Article

Energy Capacity of Waffle-Flat-Plate Structures with Hysteretic Dampers Subjected to Bidirectional Seismic Loadings

by
Jesús Donaire-Ávila
1,* and
David Galé-Lamuela
2
1
Department of Mechanical and Mining Engineering, University of Jaén, 23700 Linares (Jaén), Spain
2
Department of Mechanical Engineering, Universidad Politécnica de Madrid, 28006 Madrid, Spain
*
Author to whom correspondence should be addressed.
Appl. Sci. 2020, 10(9), 3133; https://doi.org/10.3390/app10093133
Submission received: 27 March 2020 / Revised: 23 April 2020 / Accepted: 28 April 2020 / Published: 30 April 2020
(This article belongs to the Special Issue Passive Seismic Control of Structures with Energy Dissipation Systems)

Abstract

:

Featured Application

The results of this study can be applied to design reinforced concrete (RC) waffle-flat-plate structures with hysteretic dampers capable of enduring bidirectional seismic loadings under different seismic performance levels. The levels tested were: fully operational (elastic), operational (damage only in dampers), and near collapse (damage in dampers and in RC structure).

Abstract

This study investigates the capacity, in terms of energy, of waffle-flat-plate (WFP) structures with hysteretic dampers subjected to biaxial seismic actions. A numerical model was developed and calibrated with the experimental results obtained from shake-table testing carried out on a WFP specimen subjected to biaxial seismic loads. Then the WFP system was retrofitted with hysteretic dampers—slit-plate dampers (SPDs)—and the numerical model was subjected to different sets of ordinary ground motion records to attain different seismic performance levels (SPLs). Each set of records was applied in a sequence of scaled seismic simulations until the SPL of near collapse was achieved. The capacity in terms of input energy and dissipated energy are presented for the different SPLs, taking into account the differences observed under unidirectional and bidirectional seismic loadings. Furthermore, the level of damage (i.e., accumulated plastic deformations), the level of ductility and the relationship between them—expressed as equivalent number of cycles—are also shown for both the WFP system and the hysteretic dampers. The seismic capacity of the WFP system is found to be significantly enhanced by the inclusion of hysteretic dampers.

1. Introduction

Flat-plate (FP) structures consist of horizontal reinforced concrete (RC) slabs supported on isolated columns. One version of this type of system is the waffle-flat-plate (WFP) structure, which features RC lightened flat-plates supported on isolated columns. The lightening facilitates achievement of bay lengths of up to 10–12 m with plate depths of 40–45 cm. Further, the bidirectional action of FP or WFP systems under gravity loads provides flexibility in the architectural design of the building; that is, it permits a non-regular layout of columns. These characteristics have led to a widespread use of FP and WFP structures in many earthquake-prone countries, including Spain and Mexico. Nevertheless, FP and WFP structures exhibit some important drawbacks when they are used as the primary system under seismic loadings. Past earthquakes, such as Michoacan (Mexico, 1985) and Northridge (USA, 1994), unveiled these drawbacks. As a consequence, worldwide standards have implemented new rules and recommendations for the use of FP and WFP structures. Spanish standard NCSE-02 [1] establishes a low ductility class for FP and WFP buildings, and limits the ductility factor, μ, to μ = 2. Eurocode 8 [2] also proposes a low ductility class (DCL) for FP buildings with a behavior factor, q, of 1.5 and limits their use for low seismicity areas. ACI 318M-14 [3] indicates that two-way slabs without beam structures can be used only in areas with a moderate—level C—seismic category design (SCD). Despite these limitations, there are experiences for which FP structures exhibit good performance under heavy seismic actions [4]: Kalamata (Greece, 1986), Aegio (Greece, 1995), and Athens (Greece, 1999). Therefore, new research and studies are needed to improve the knowledge of the seismic behavior of this type of structures.
Research involving WFP structures was limited until the Michoacan earthquake (1985). Rodríguez and Meli [5] tested a two-story WFP structure designed with seismic codes prior to the Michoacan quake and found it to show low energy dissipation and ductility capacities. Benavent-Climent et al. [6,7] investigated the seismic behavior of WFP structures with a non-regular layout of columns under unidirectional and bidirectional seismic loadings. They corroborated the high flexibility of this type of system (the yield interstory drift being around 1%) and identified sources that limit the energy dissipation capacity (e.g. brittle torsional failure of the spandrel beams, weak column-strong plate mechanisms in interior columns).
The use of energy dissipation devices (EDDs) as primary seismic elements has proven effective to control the response of a structure under seismic actions [8,9,10,11,12,13]. Different methods for the design of dampers have been developed, to ensure a reasonably uniform story drift distribution [10,14] or to dissipate the hysteretic energy demand of the seismic action through plastic deformations [15,16,17]. Among the latter, the energy approach proposed by Akiyama [15] was adopted by the Japanese Building Code [18] for the design of structures equipped with hysteretic dampers.
One effective way to improve the seismic behavior of WFP systems is to add EDDs. Combining the inherent flexibility of the WFP system with the high lateral stiffness and high energy dissipation capacity provided by EDDs can mean important advantages in terms of seismic response. One study [15] demonstrates such advantages in the context of the so-called “flexible-stiff mixed system”. In a flexible-stiff mixed structure, the flexible part—also called the main structure—supports the gravity loads and remains basically elastic (at least for lower seismic performance levels (SPLs)), while the stiff part absorbs and dissipates the energy introduced by lateral loads, i.e., wind or earthquakes. Eurocode 8 [2] establishes primary seismic elements to absorb and dissipate the seismic loadings and secondary seismic elements with deformation capacity sufficing to bear only gravity loads. ACI 318M-14 [3] indicates that two-way slabs without beam structures to provide adequate deformation capacity can be used as secondary elements in high seismic risk areas (SCD D, E, and F). Benavent et al. [19] investigated the seismic behavior of a WFP structure designed to carry only gravity loads yet retrofitted with hysteretic dampers. By subjecting to dynamic (shake-table) tests a scaled specimen of a WFP system with dampers, they found that the WFP system remains basically elastic under very severe ground motions, while the dampers dissipate most of the energy input from the earthquake. Donaire-Ávila [20] investigated the behavior of WFP structures with hysteretic dampers subjected to different seismic hazard levels (SHLs), finding that the hysteretic dampers can effectively control the response of WFP systems subjected to near- and far-field earthquakes with low and high SHLs. Other studies have also investigated other versions of flexible-stiff mixed structure with a reverse performance. Feng and Chai [21] and Anajafi and Medina [22] proposed partial mass isolation systems in which portions of a building mass (i.e., several isolated multi-story blocks or floor masses) were decoupled from the main structure. Their proposed systems divide a building into two parts: a relatively stiff mega frame (i.e., substructure) that primarily supports gravity loads and relatively flexible isolated blocks equipped with energy dissipation devices that play the role of inherent tuned-mass-dampers for the main building without the need to incorporate additional masses.
Past experimental and numerical studies on FP or WFP systems with EDDs entail application of a single horizontal component of the ground motion to the structure. To date, no published studies on the seismic behavior of FPs or WFPs with hysteretic dampers have focused on quantifying their ultimate energy dissipation capacity under bidirectional seismic loadings, in particular. The energy capacity of structural systems is a poorly known aspect of the earthquake engineering field [23]. This research effort is aimed to help fill this gap, testing a WFP system equipped with hysteretic dampers under loading conditions (bidirectional loadings). The different parameters related to the capacity of both the WFP system and the hysteretic dampers in terms of energy are presented and discussed. These findings are particularly useful for designers and researchers involved in the energy-based approach to seismic design.

2. Test, Numerical Model, and Validation of Reinforced Concrete (RC) Waffle-Flat-Plate (WFP) Structure

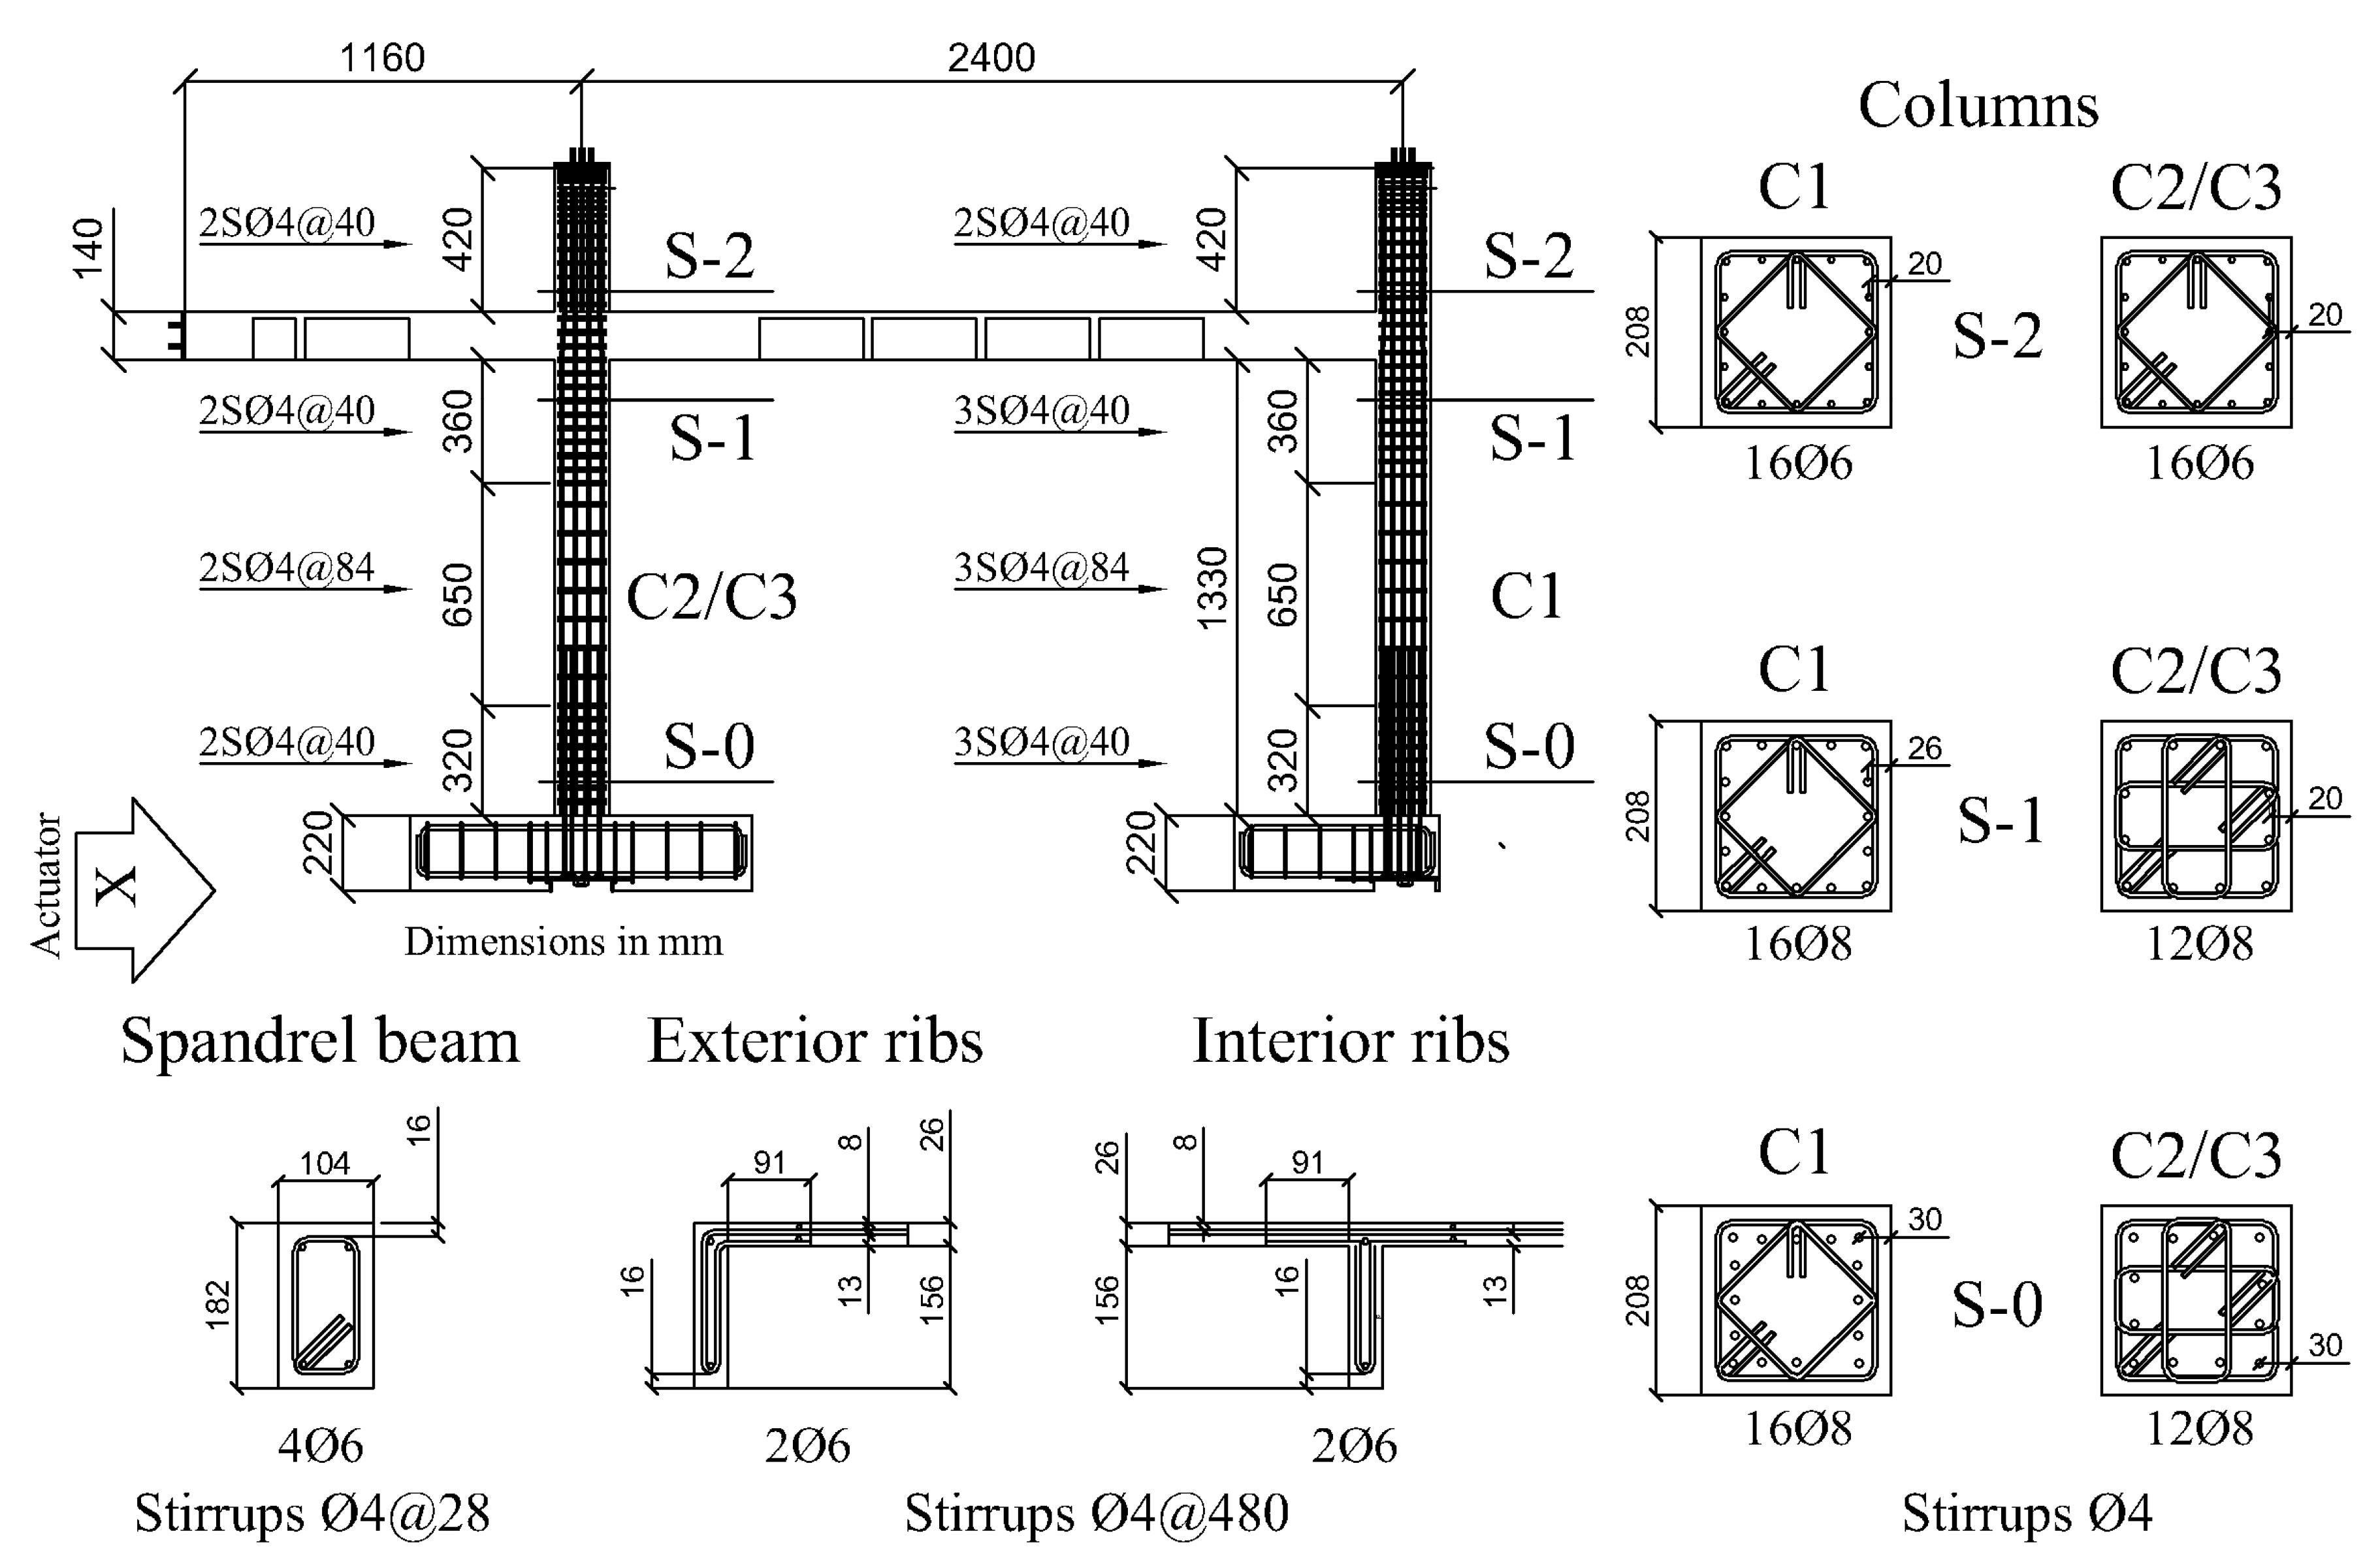
2.1. Shake-Table Tests

First, a three-story prototype structure consisting of waffle-flat-plates supported on isolated columns with an irregular layout was designed according to the current Spanish standard NCSE-02 [1]. The structure corresponds to a residential building located in Granada, a low-to-moderate seismicity region of Spain. From the prototype, a portion formed by one exterior and two interior columns comprising one and a half stories—first and second story—was selected and scaled by 2/5. Figure 1 offers details of the geometry and reinforcement of the structural members. As seen in Figure 1, S-0 and S-1 are respectively the lower and upper end sections of the columns of the first (ground) story; S-2 is the lower end section of the columns of the second story.
The specimen was set up on a shake-table equipped with two horizontal actuators and subjected to bidirectional simulations until collapse using the two horizontal components of the ground motion registered at the Calitri station during the Campano-Lucano earthquake (Italy, 1980). The peak ground acceleration, PGA, of the original records was scaled to 35%, 50%, 100%, 200% (partial), 200% (full), and 300% (hereafter identified as C35, C50, C100, C200i, C200, and C300, respectively) in order to produce increasing levels of the seismic action. Before applying this sequence of seismic simulations, the specimen was subjected to a white noise vibration during the training phase, called T10. A more detailed description of these tests together with the response in terms of forces, displacements, and energies can be found in reference [7].

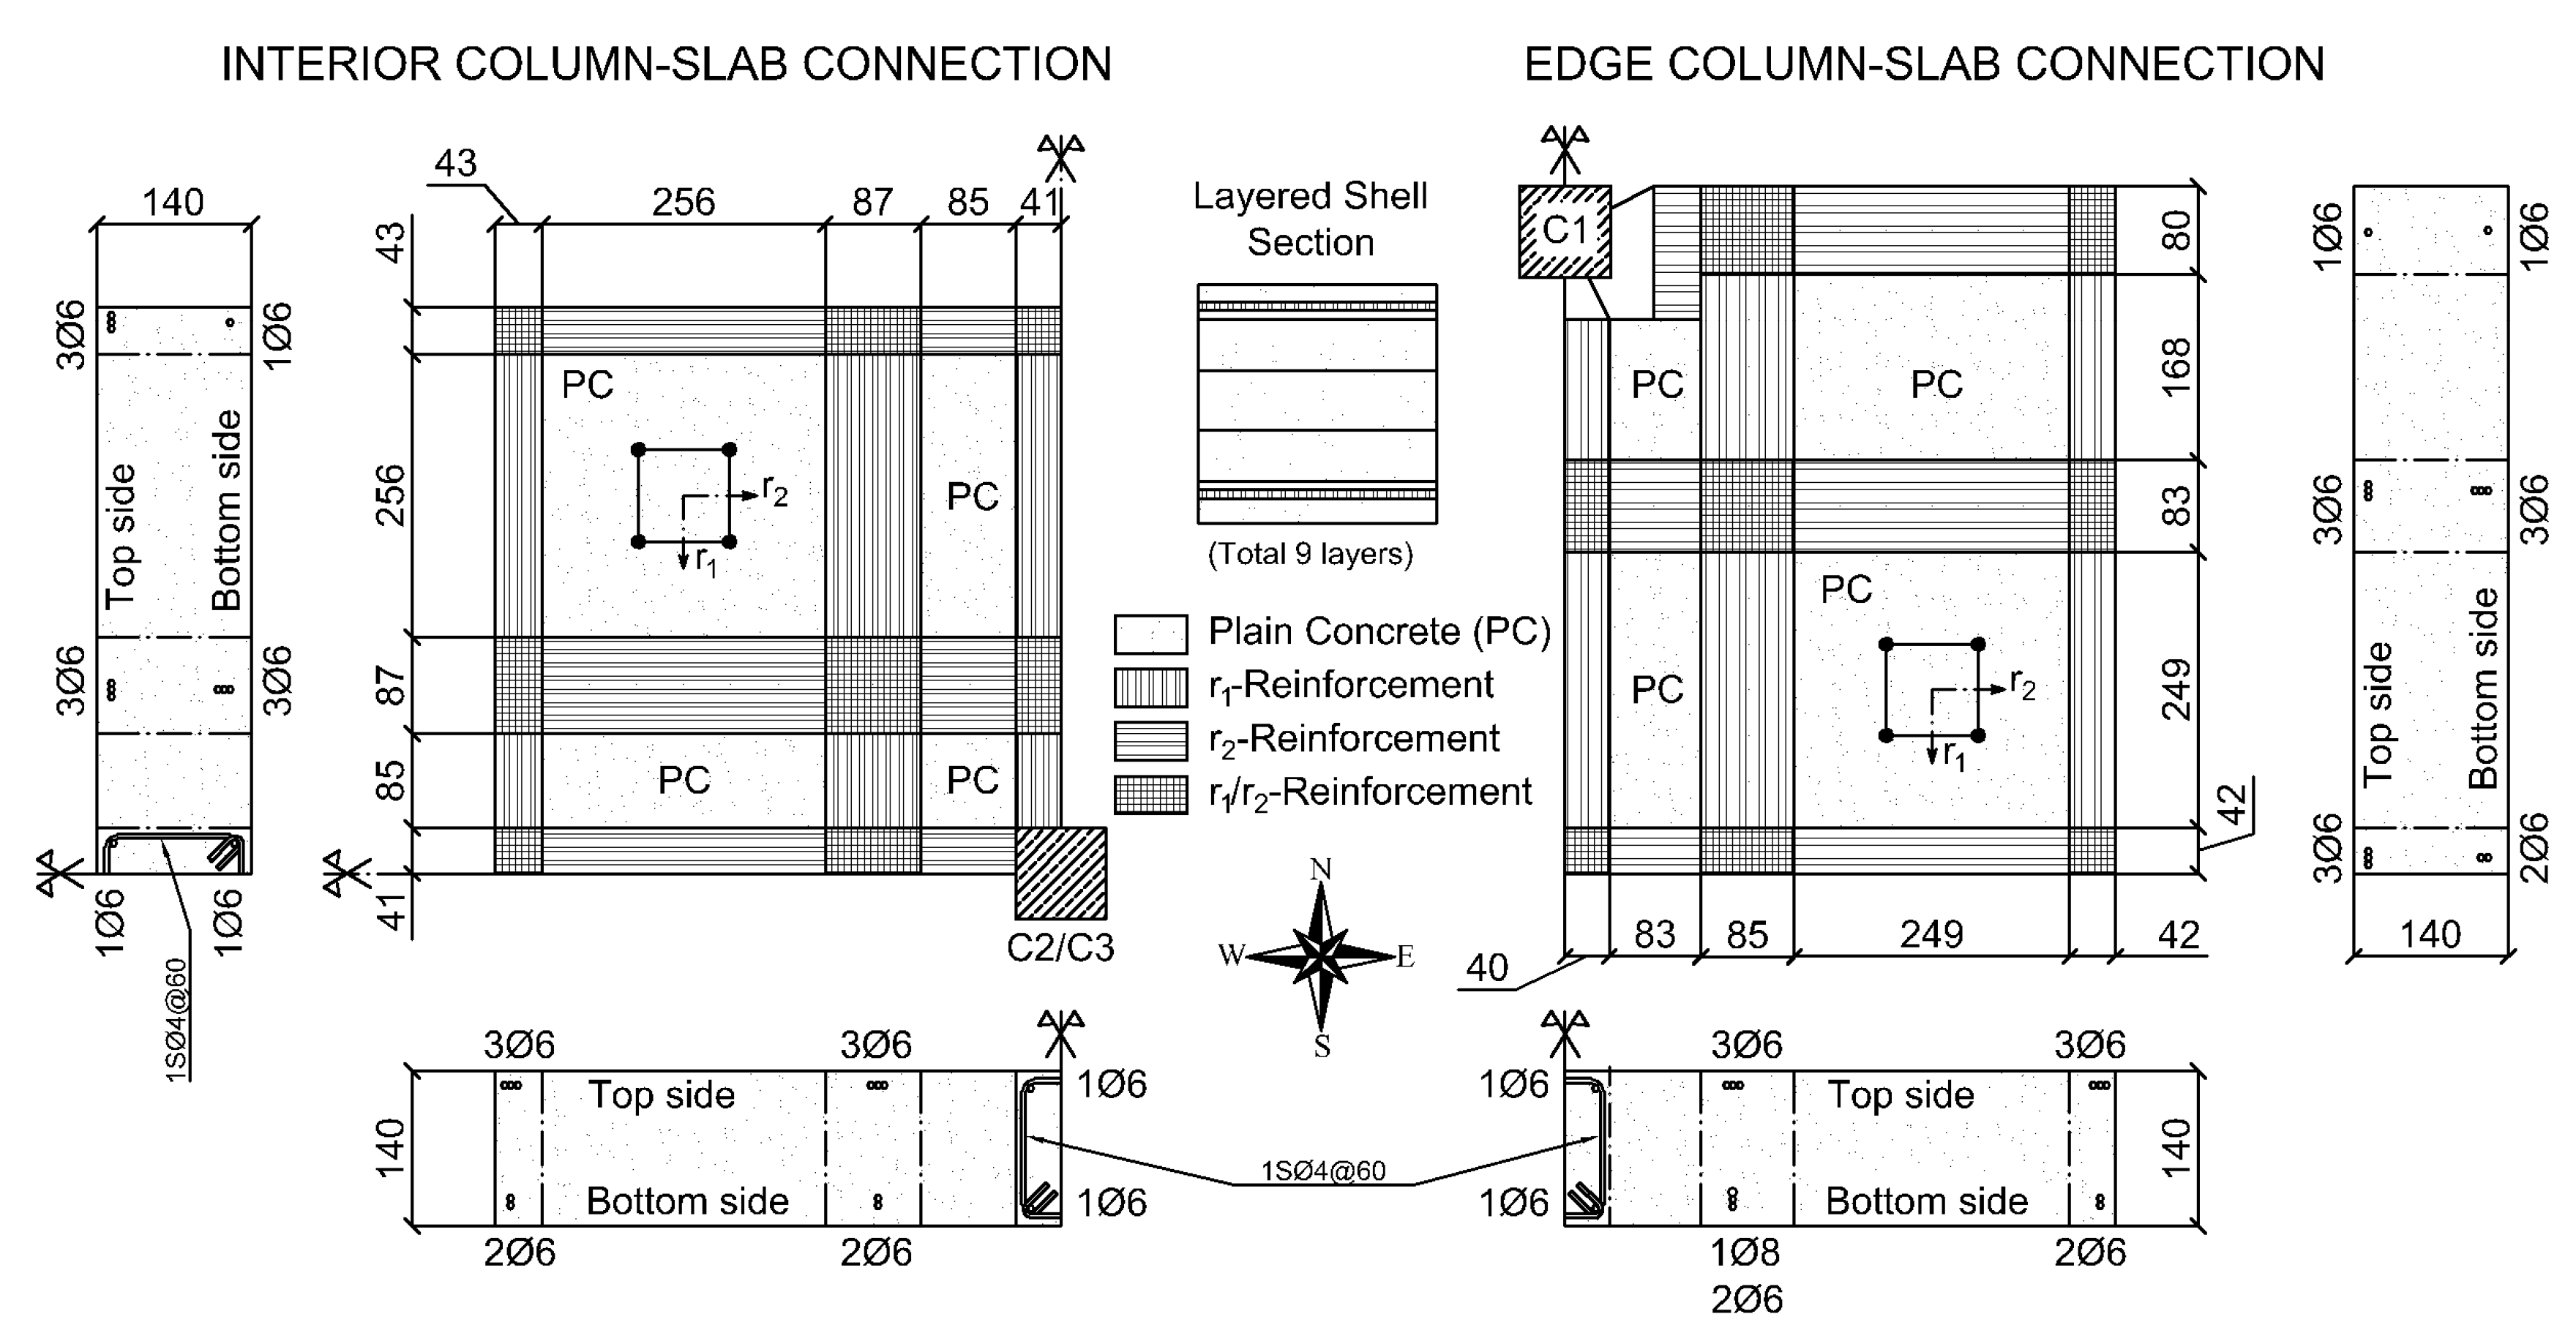
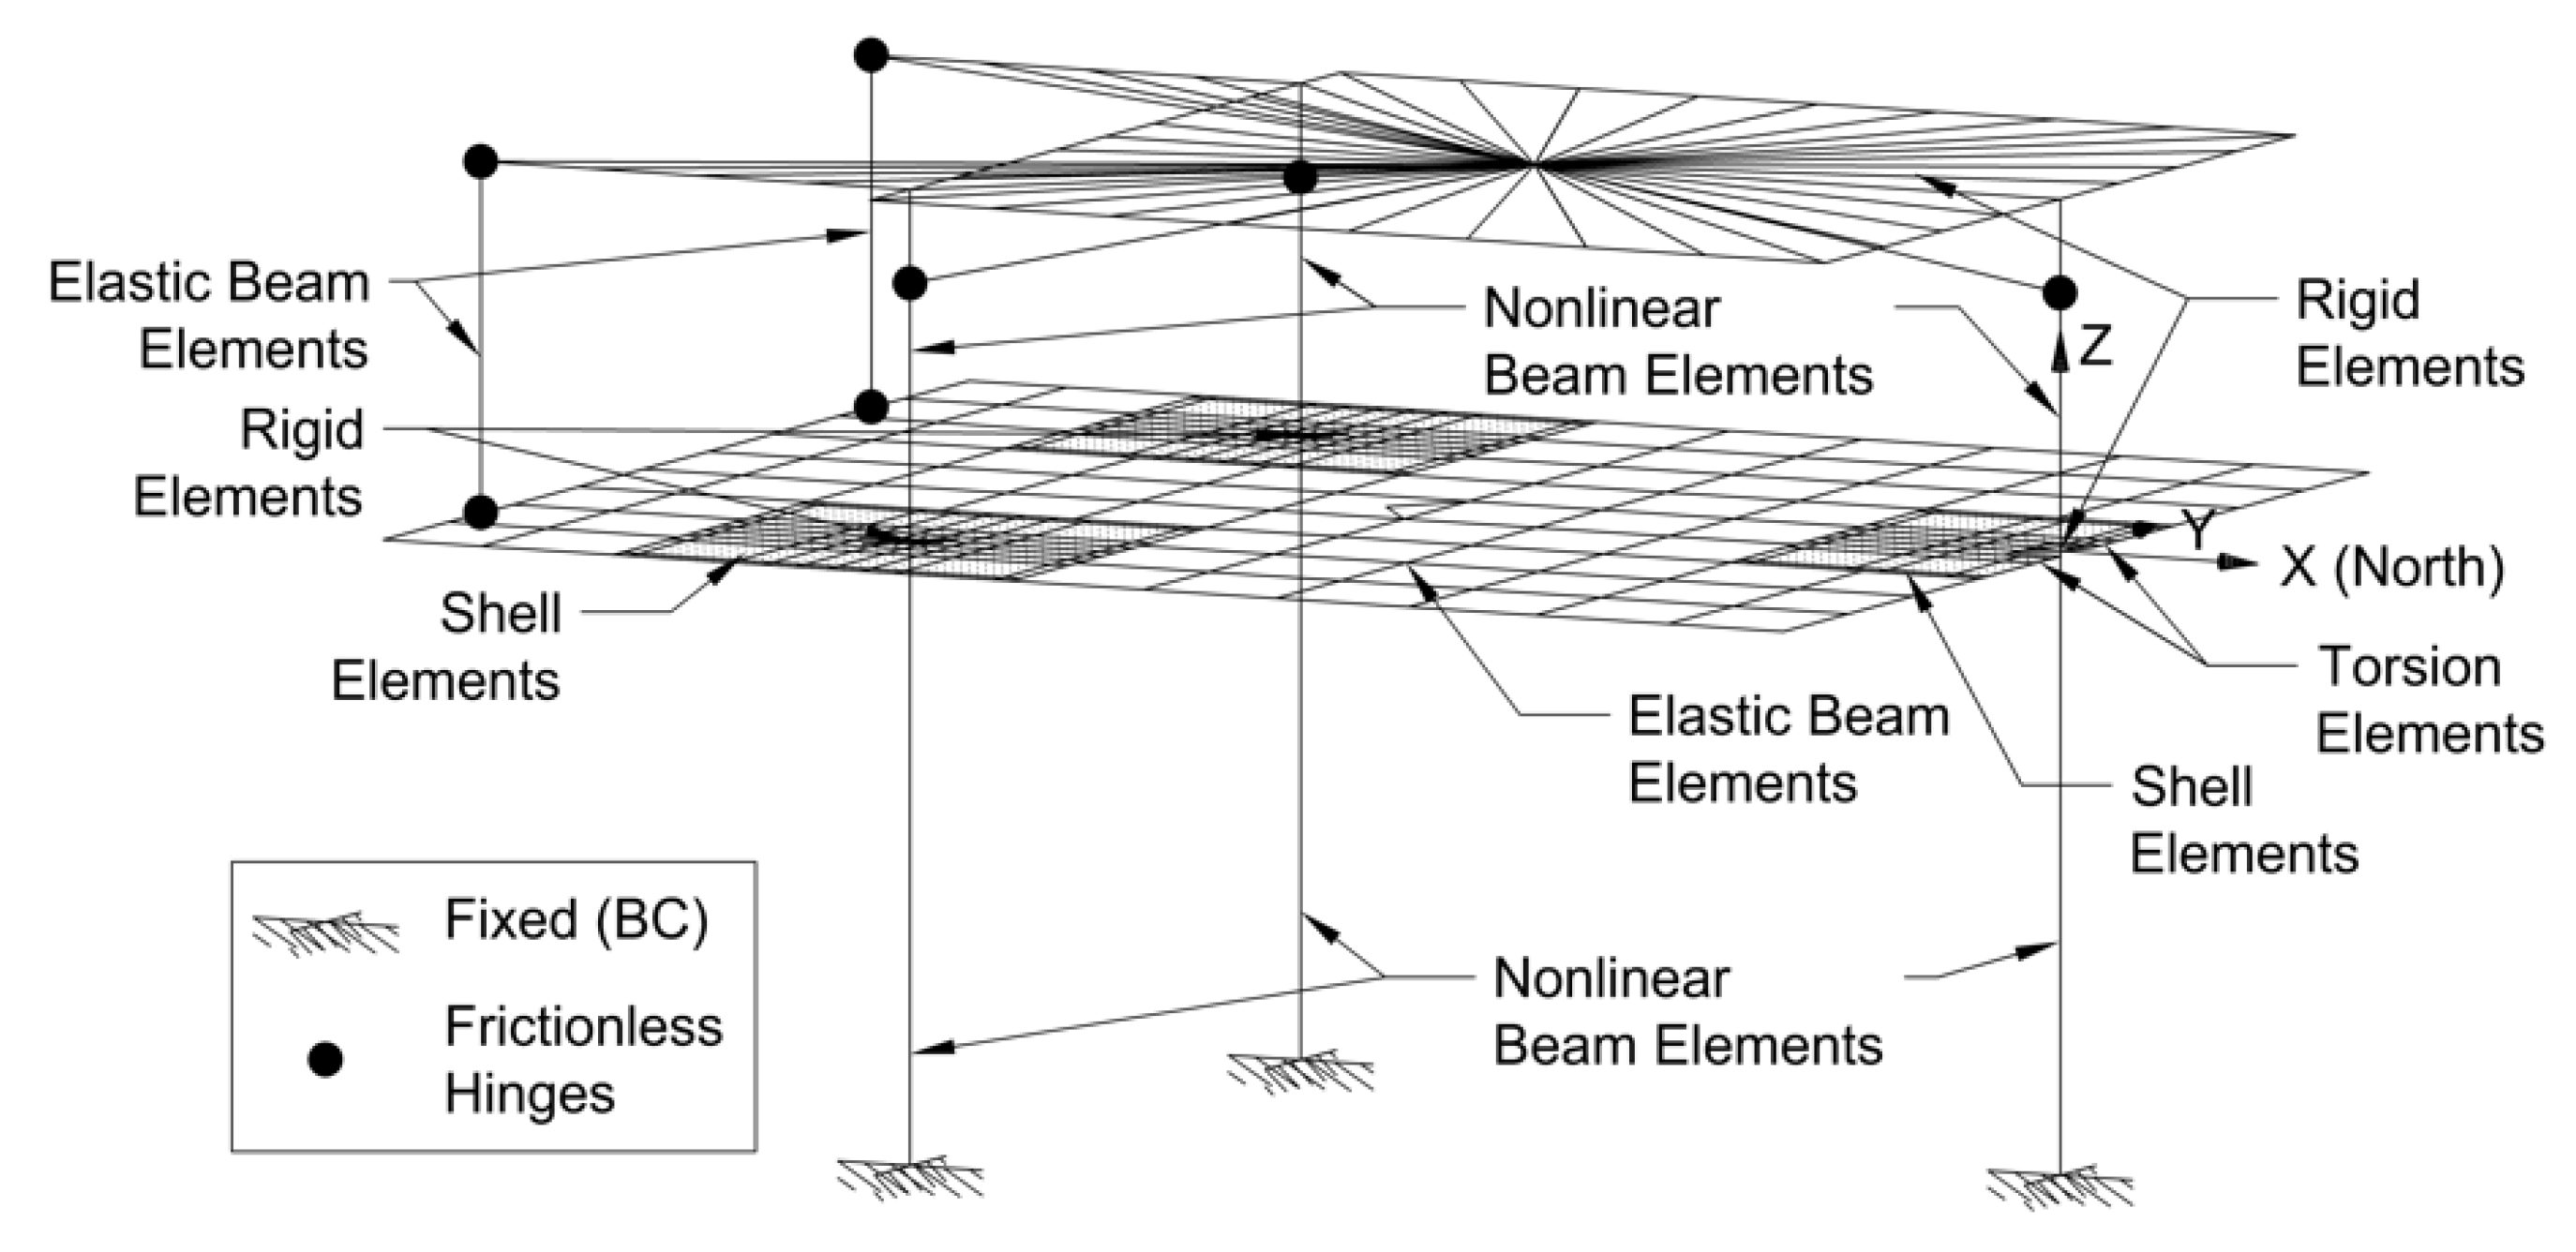
2.2. Numerical Model of the WFP Structure

A 3-D numerical model representing the specimen with the shake-table was built in OpenSees v2.5.0. rev 6477 [24]. The model is made up of 1802 nodes and 1810 elements. Columns proved to be the critical elements in the numerical model, since they exhibited the largest non-linear behavior during tests and governed the overall response of the structure. RC columns were modeled using non-linear frame elements. The material properties described in reference [7] were used. The frame element comprises three parts: the two end parts are lumped plastic hinges, while the central part uses fiber elements. The length of the end parts is determined by the plastic hinge length, lp, which is taken here as the depth of the transverse section, i.e., lp = 160 mm according to ACI 318M-14 [3]. As for the fiber elements, the transverse section is discretized by a grid of 2x2 mm fibers of concrete, which are replaced by steel when they are occupied by rebars. In addition, the hysteretic behavior of the concrete was defined through the parametric model proposed in [25], adapted to the constitutive model proposed in [26]. For the steel rebars, the Giuffré-Menegotto-Pinto model with isoparametric strain hardening was used. The non-linear behavior of the plastic hinges is characterized by means of the moment-curvature backbone curve, i.e., M-φ, and the corresponding hysteretic law in each main direction. The M-φ curve is defined by yield moment, My, and the yield and ultimate curvatures, φy and φu. My was estimated using the empirical expression proposed by Fardis [4] with a reduction of 20% to account for the biaxial cyclic loading-interaction factor [27,28]. First, φy and φu were calculated as φy=θy/lp and φu = θu/lp, where θy and θu are the yielding and ultimate rotation obtained with empirical formulae [4]. Next, these initial values were modified to fit the results obtained from the tests. The stiffness degradation implemented in the hysteretic law was based on the study carried out by Rodriguez et al. [27].
The waffle-flat-plate is formed by a grid of ribs and solid zones around the columns. The grid of ribs, whose transverse section is shown in Figure 1, was modeled with elastic frame elements having a 20% reduction of the initial elastic stiffness to account for cracking. The solid zones were modeled through shell elements measuring, on average, 42x42 mm; these shell elements support geometric non-linearity. In order to reduce the computational time, non-linearity was adopted only for the shell elements of certain parts of the solid zones around the columns, those showing damage in the test. Shell elements were defined through multilayer shell sections with a total of nine layers. The thickness of each layer depends on the existence (or not) of reinforcement. Rebars at the top and the bottom of the plate cross-section were considered as smeared steel layers of equivalent thicknesses, one in each reinforcement direction. Therefore, complete reinforcement entails four smeared steel layers, two for the upper part and two for the lower. The remaining layers are made up of concrete of variable thickness. The solid zones around the columns were subdivided into different parts according to the heterogeneous distribution of the reinforcement (Figure 2). The constitutive model used for concrete is based on the concept of damage mechanics and the smeared crack model. Cracks are assumed to form when the principal tensile stress exceeds the specified concrete tensile strength. After cracking, concrete is treated as an orthotropic material by smearing the cracks in the finite element. The properties of reinforcing steel are derived from the uniaxial materials for rebars in accordance with the corresponding angles of the steel layer in the model.
The spandrel beam (transverse beam) connected to the edge column C1, whose cross section is shown in Figure 1, was modeled as an elastic beam element with non-linear torsional plastic hinges at the ends. The backbone curve of the torsional spring in terms of twist, φ, and torque, Tcr, is a simplified version of the model developed by Valipour and Foster [29]. It is defined through three points: cracking torsion (φ1,Tcr); ultimate torsional capacity (φ2,Tu); and torsional failure (φ3,Tu).
Finally, Figure 3 gives an overview of the numerical model that includes all the elements described above.

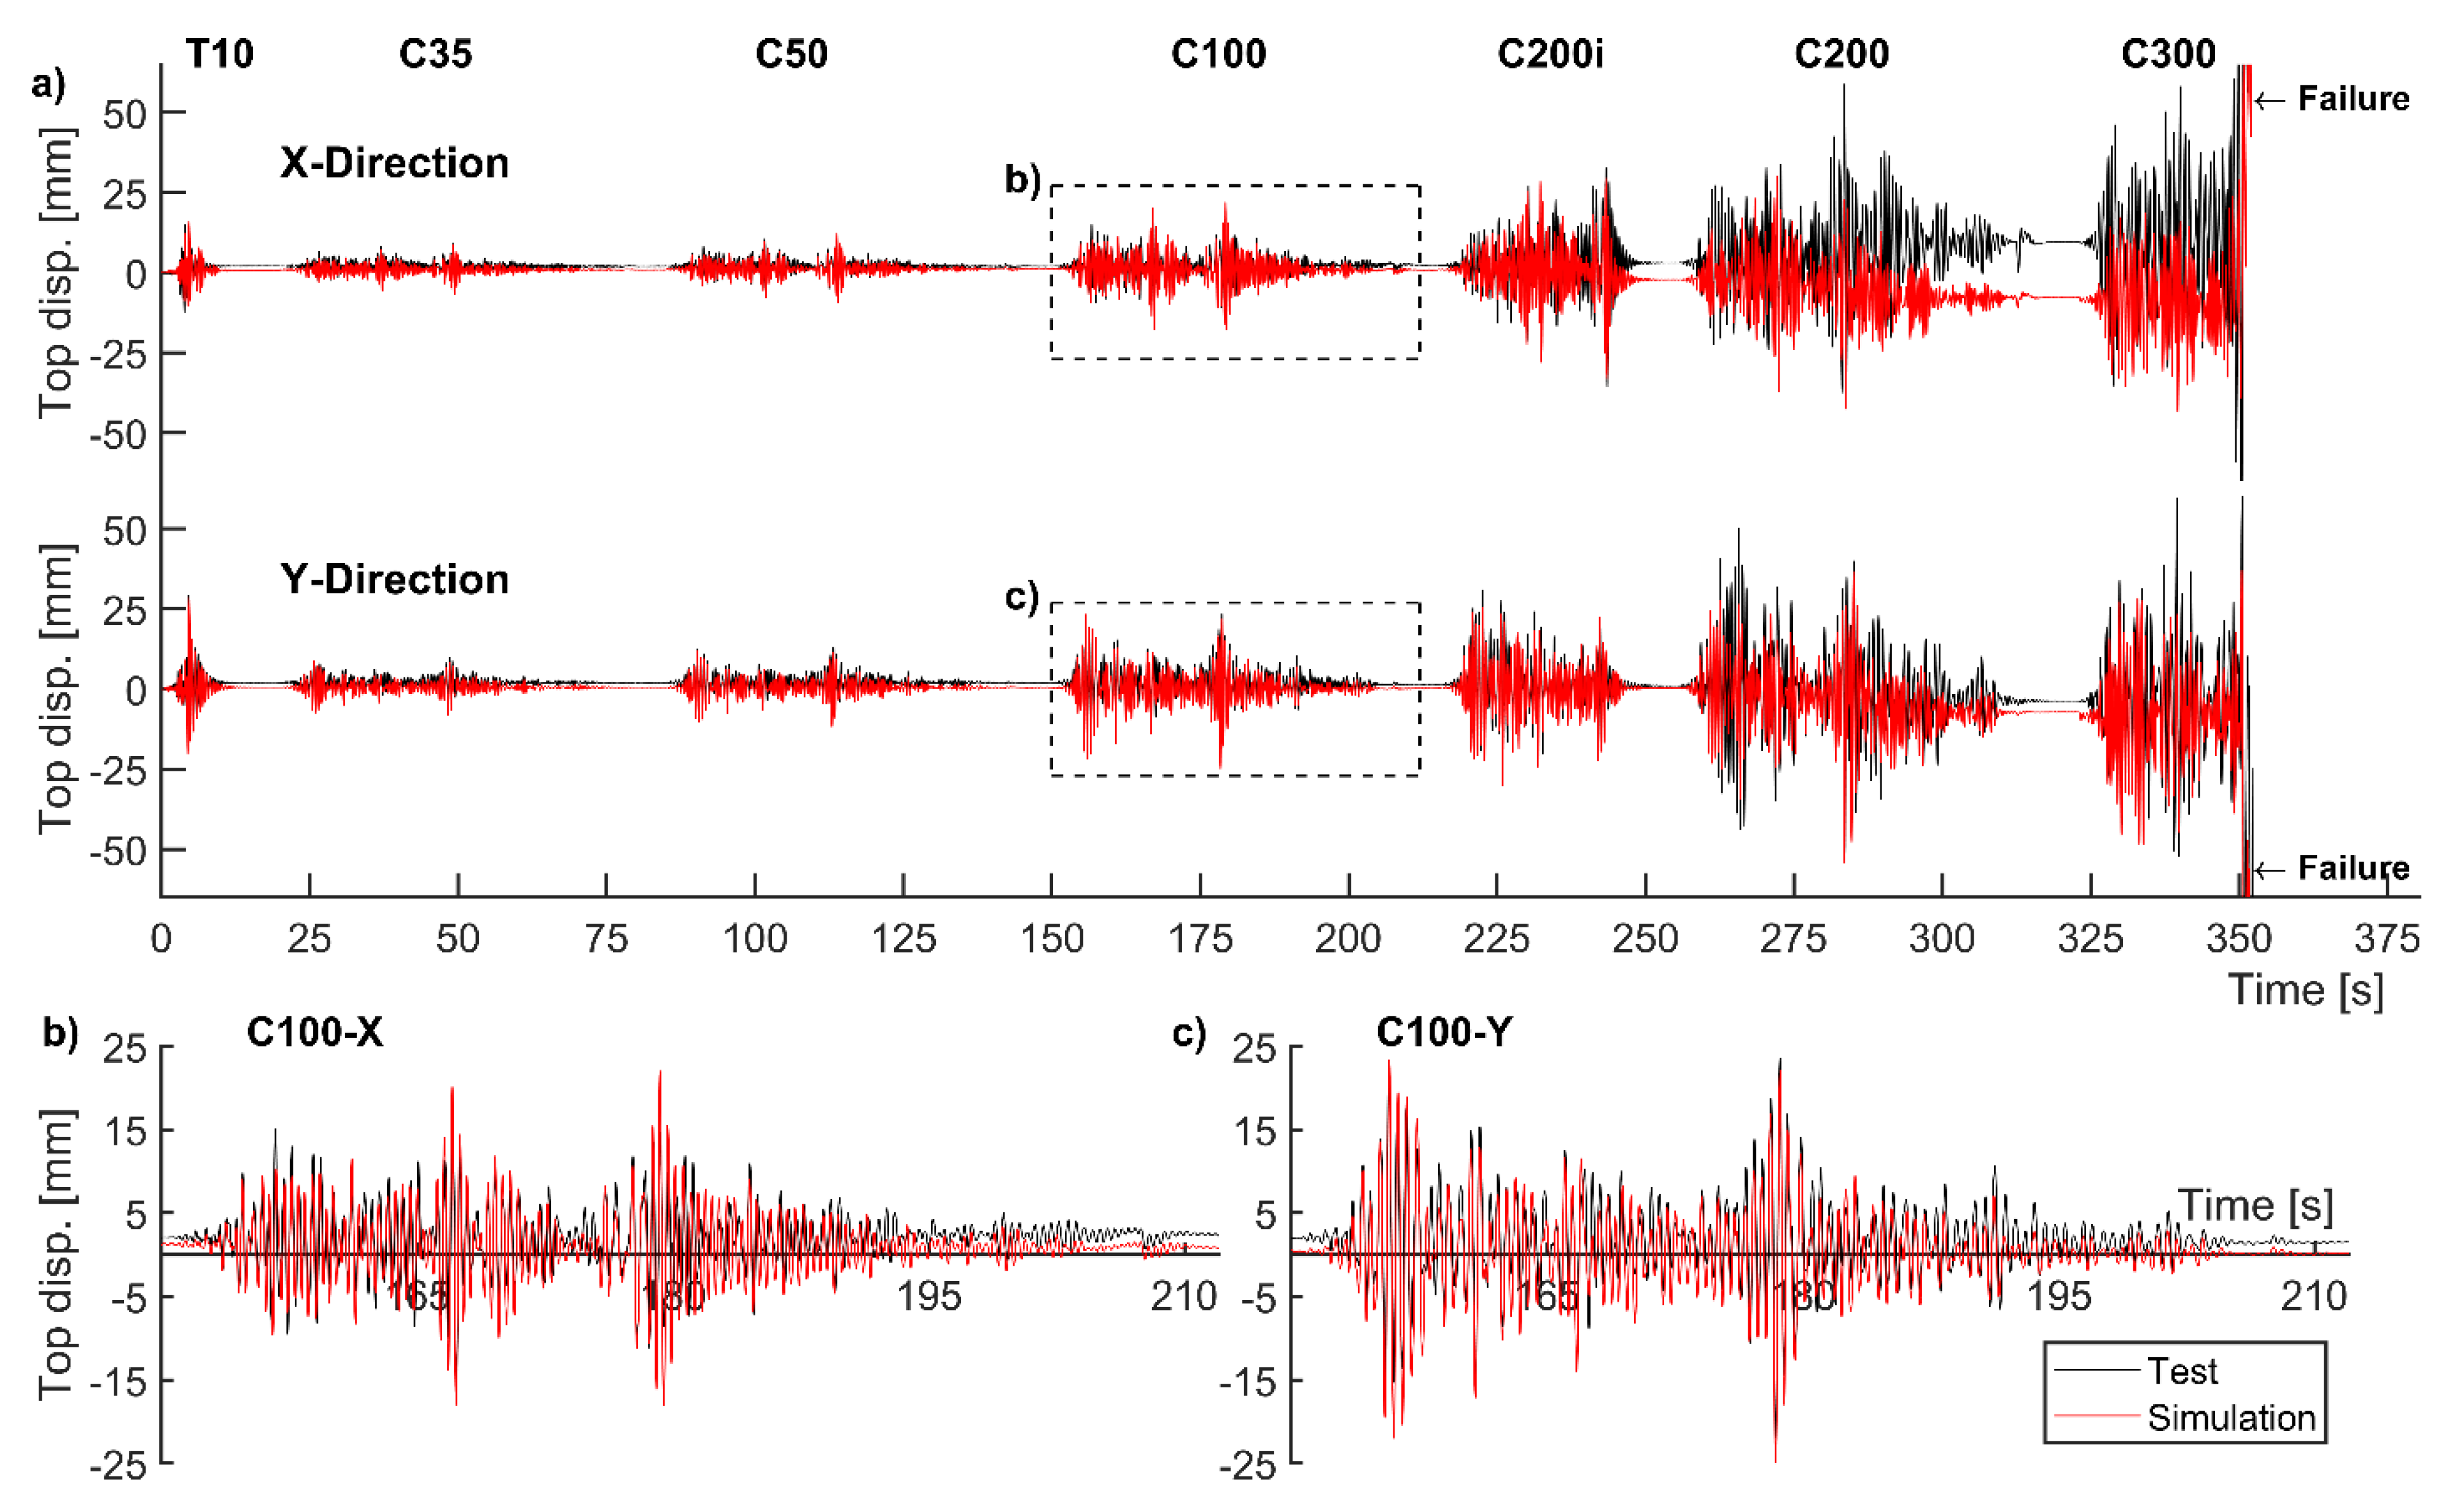
2.3. Experimental Validation of the Numerical Model

The numerical model was subjected to the same combination of loads as the specimen tested in laboratory using OpenSees software. Firstly, the gravity loads were applied in a static analysis; afterwards, non-linear time history analyses (NLTHAs) were carried out following the same sequence of seismic simulations used for the shake-table tests (from simulations T10 until C300). A mass-proportional damping model was defined and calibrated with experimental test data, in order to derive a classical damping matrix that prevents spurious damping [30,31,32,33]. The damping matrix, C—classical—is given by C = a0M, where a0 is a parameter and M is the mass matrix. In turn, a0 is defined through the expression a0 = 2ξiωi, where ξi and ωi are the damping ratio and the angular frequency—corresponding to the frequency, fi = ωi/2π—of the i-th vibration mode. The reference damping ratio and frequency used to calculate a0 were 0.03 and 3.16 Hz, respectively; these values are close to the one obtained experimentally under elastic deformations, 0.024 [7]. This gives a0 = 1.19. When the numerical model collapsed, the frequency of the fundamental mode was 1.3 Hz; using a0 = 1.19 the corresponding damping ratio at failure is ξ1 = a0/(2ω1) = a0/(2f12π) = 0.072, a value close to the one measured at the end of the tests, 0.092 [7].
Next, the response of the numerical model was compared with the experimental results. Figure 4 shows the history of displacements at the top of the structure. The response in X and Y directions for the successive simulations—C35, C50, C100, C200i, C200, and C300—is depicted in the two upper graphs of the figure. In addition, the detail corresponding to the response in X and Y directions of C100 is shown at the bottom of the figure. A good agreement is observed between the numerical prediction and experimental response, especially for the lower and moderate intensity levels, i.e., until the onset of C200. However, for higher intensity levels—C200 and C300—the large strength degradation observed in the tests, especially at the ends of columns and at the edge of the column-slab connection, was not properly reproduced in the numerical model, which led to the observed differences.
Figure 5 shows the history of total energy input in the specimen by the bidirectional seismic loading, EI. The numerical model is seen to predict the input energy until the onset of simulation C200i very well. From this point on, the numerical model underestimates the input energy measured experimentally only for C200i and part of C200. It is important to note that the response history in terms of input energy provides a more convenient and accurate criterion to assess the goodness-of-fit between model and test, preferable to displacement or force histories. Displacements or forces are vectors defined at specific parts of the structure; in contrast, energy is a scalar quantity that synthesizes the overall response of the entire structure [23]. Moreover, variations in the input energy history are better distinguished by using a logarithmic scale.

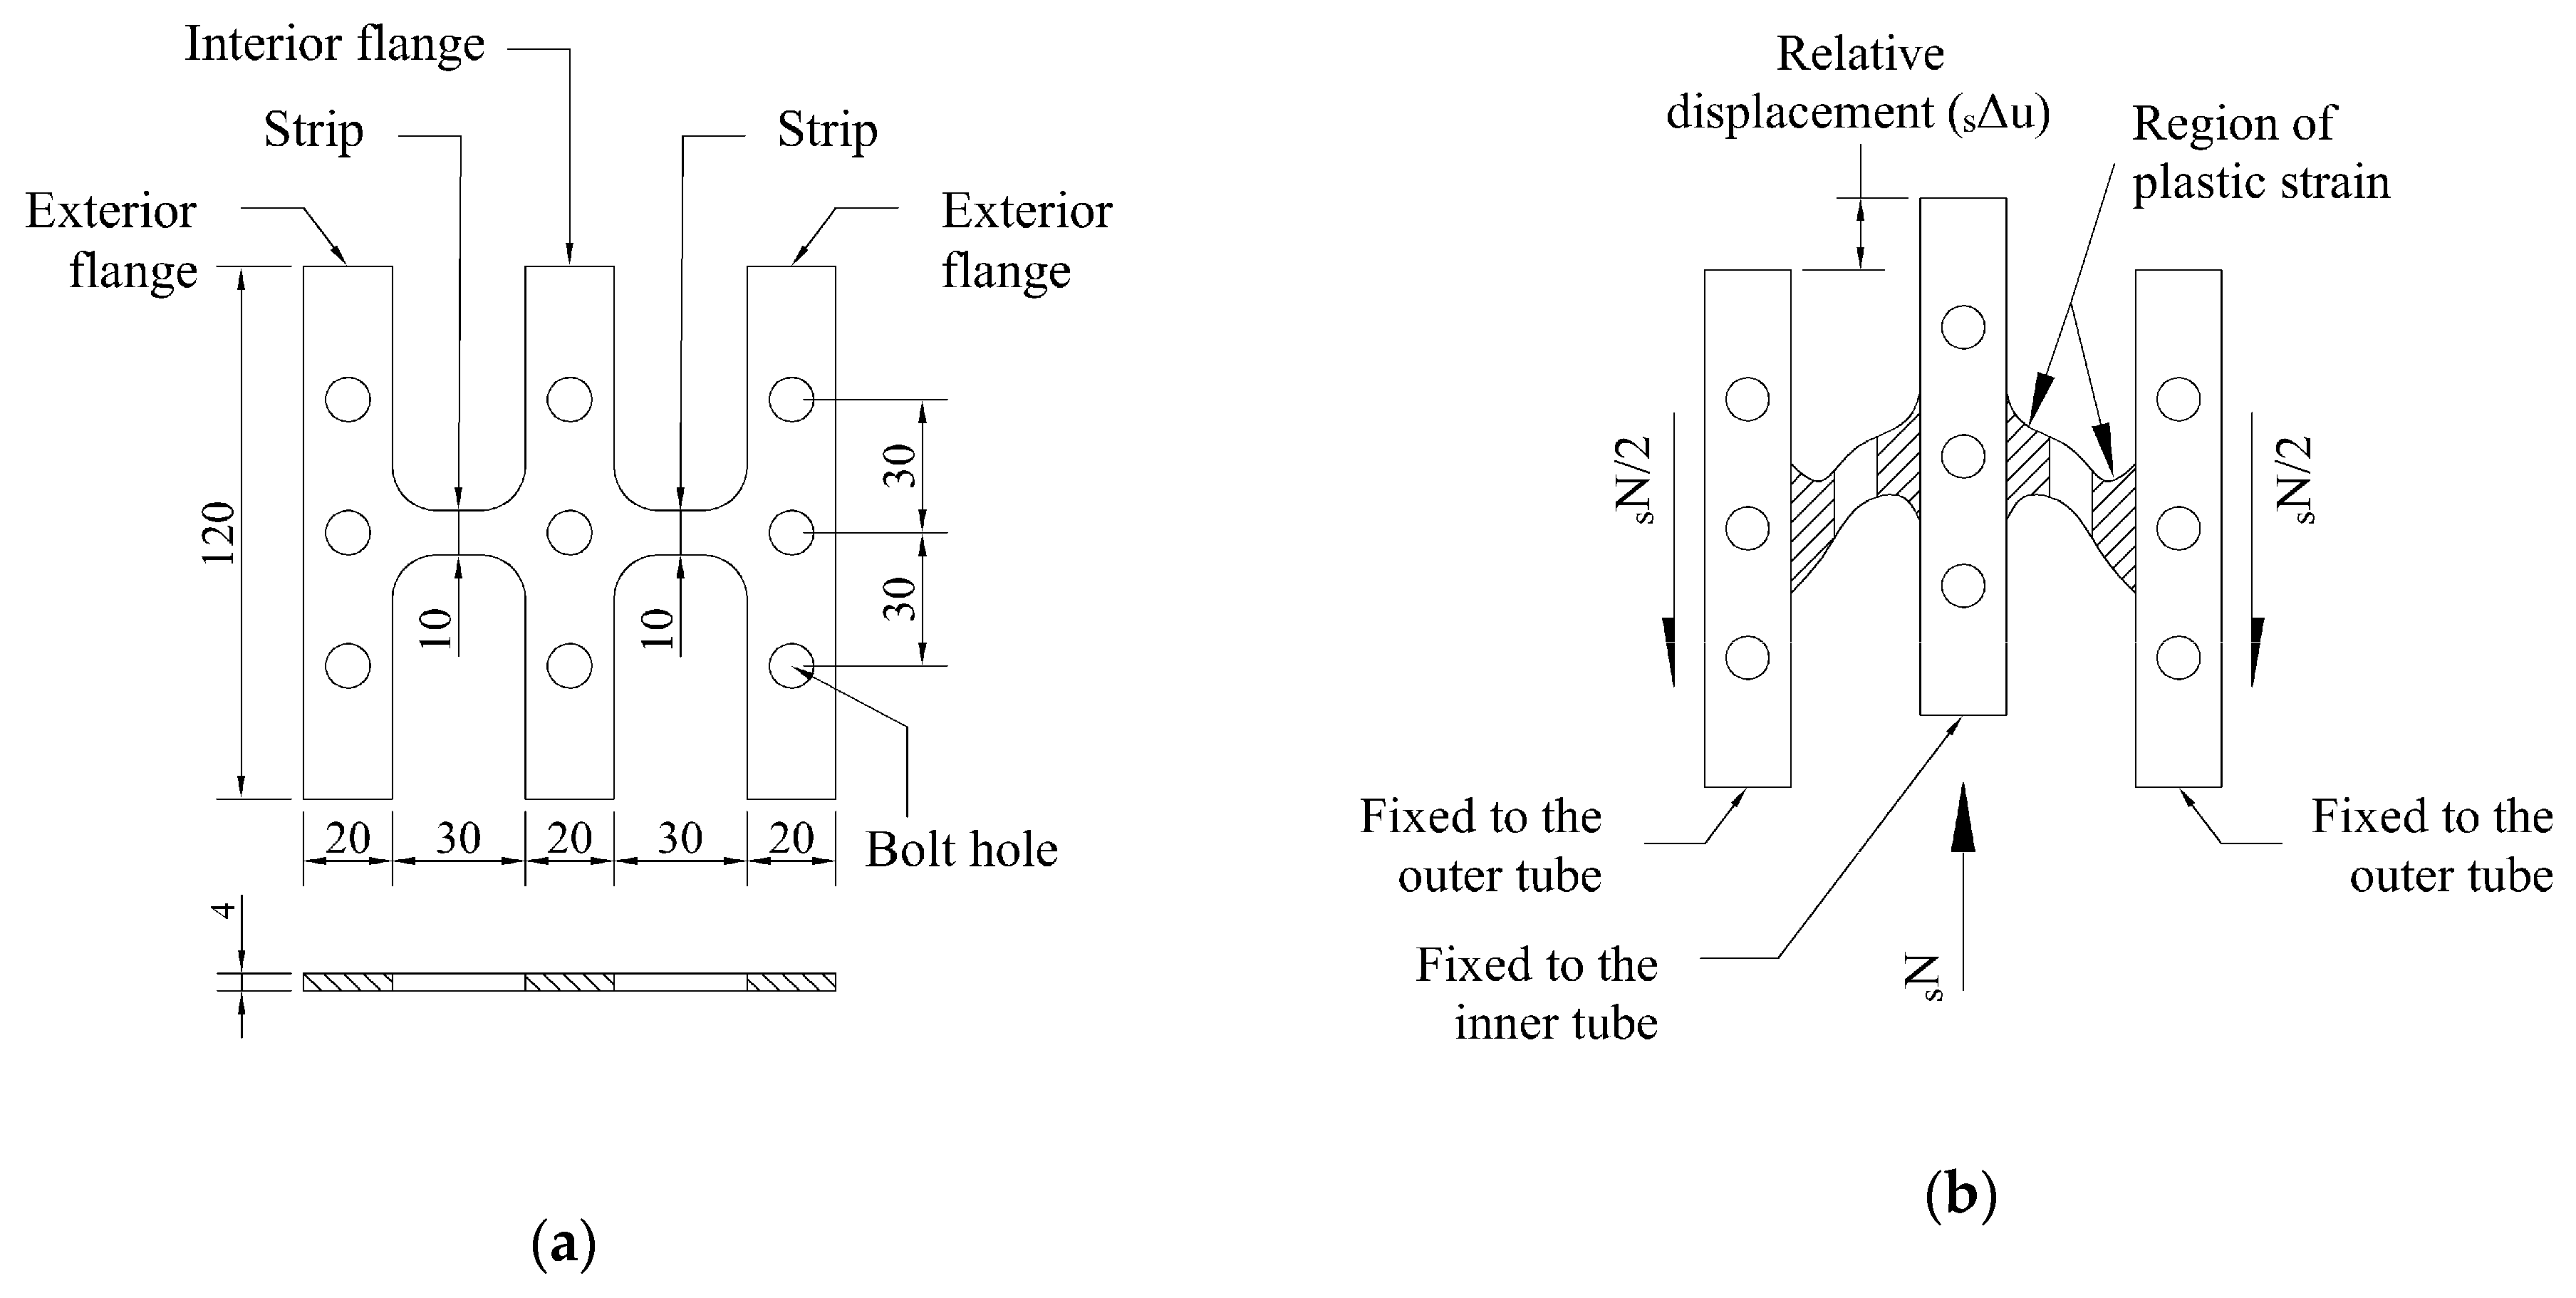
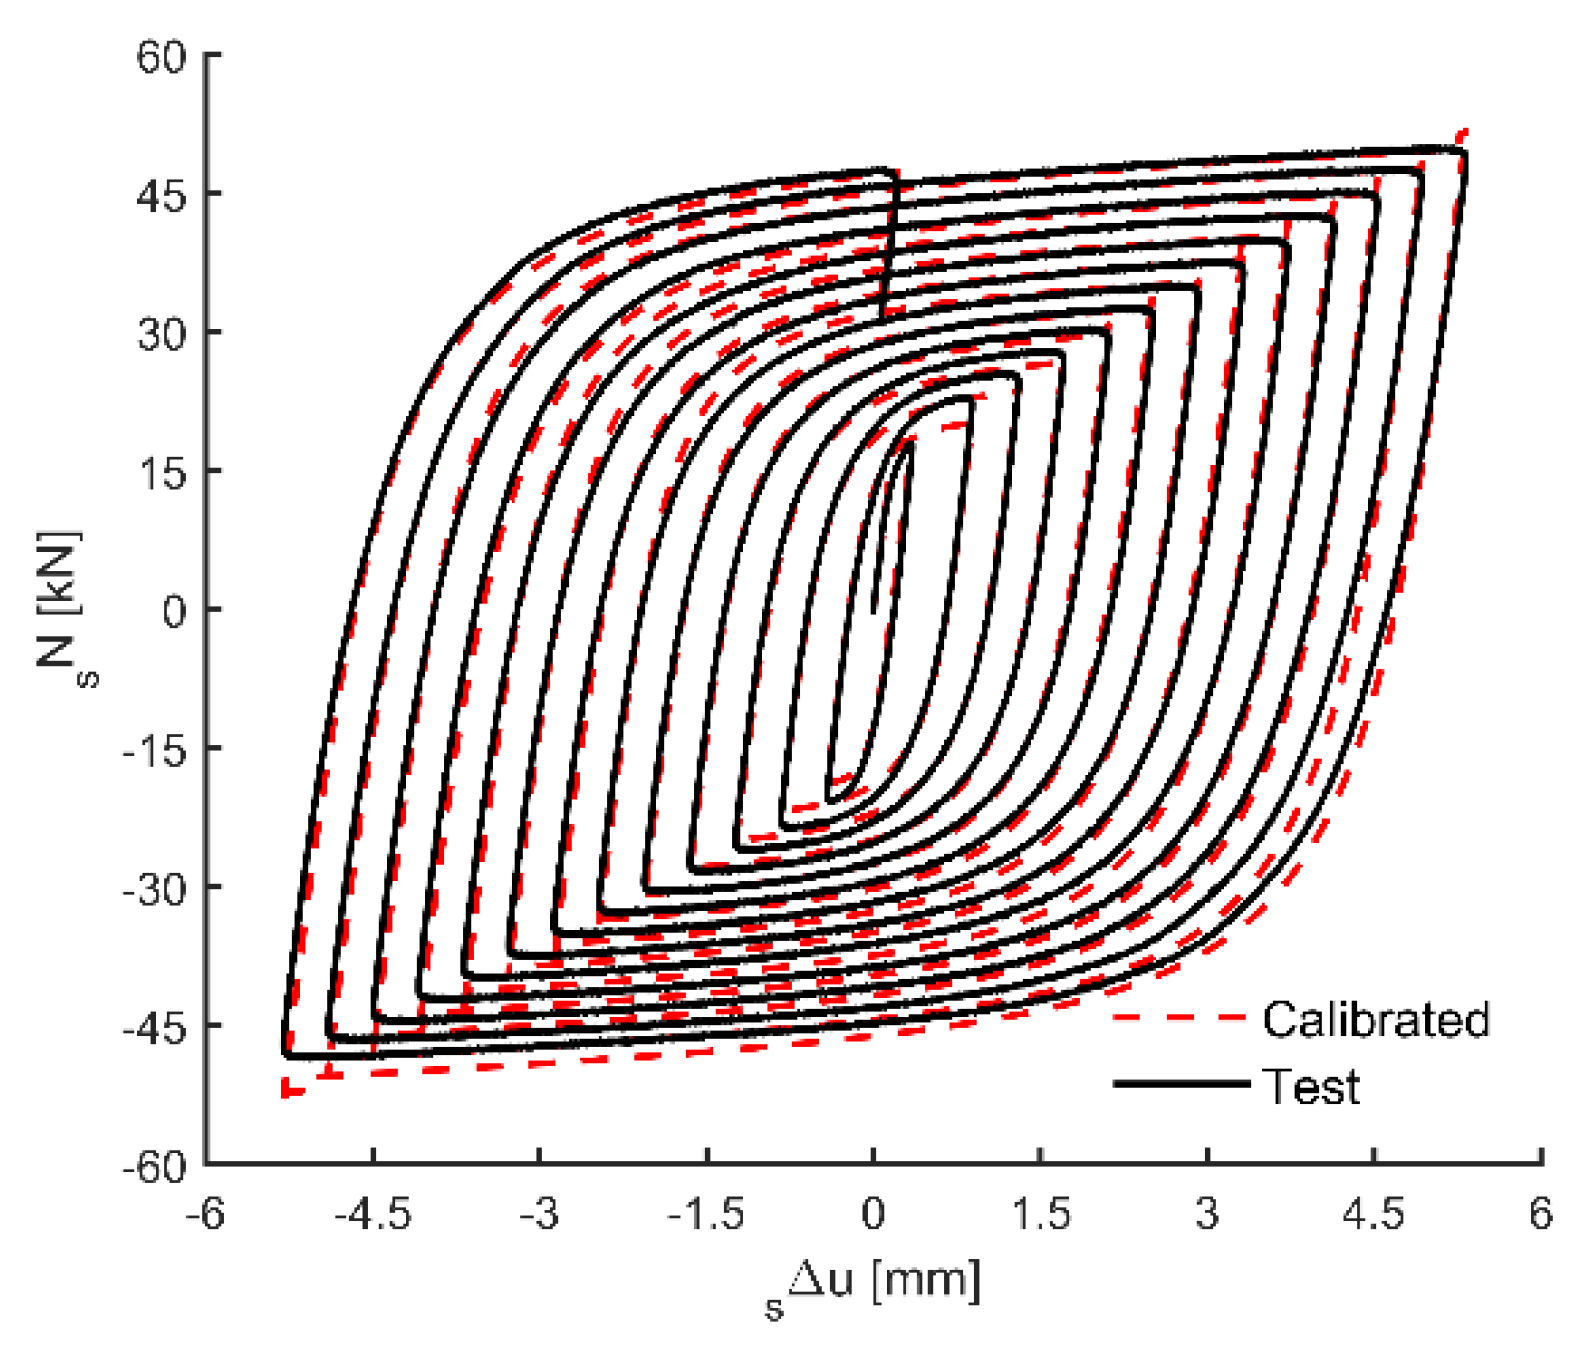
3. Test and Numerical Model of Dampers

The hysteretic dampers considered in this study consist of steel strips connected to two external flanges and one internal flange, as shown in Figure 6a. They are built from a steel plate by cutting a number of slits and leaving a number of strips in between and will be called slit-plate damper (SPD) hereafter. The SDPs are installed in the structure in such a way that when it is subjected to horizontal deformations, the internal flange is forced to move with respect to the external flanges in the direction perpendicular to the axis of the steel strips, as shown in Figure 6b, and this causes flexural/shear deformations on the strips. The source of energy dissipation of the SPD is the hysteretic plastic deformation of the steel strips. The cyclic behavior of SPDs were investigated through a lab test whose results are reported in reference [34].
Figure 7 shows, with solid lines, the force displacement curve, sN-sΔu, obtained from one of the tests before the specimen failed. The test results were used to calibrate a numerical model (to characterize the behavior of the SPD), namely, the Giuffré-Menegotto-Pinto model with isotropic strain hardening. It is implemented in Opensess [24] as Uniaxial Material Steel 02. Table 1 indicates the values of the parameters that control this constitutive model. sNy and sk correspond to the yield-axial force and the stiffness, respectively, while the remaining parameters control the hysteretic behavior of the steel device; their meaning is explained in reference [24]. Figure 7 compares the sN-sΔu curves obtained experimentally with those predicted by the numerical model (dash lines). A very good agreement is seen.

4. Numerical Analyses of a WFP Structure Upgraded with Slit-Plate Dampers (SPDs)

The ultimate capacity in terms of energy of WFP structures with hysteretic dampers is investigated in this section. A numerical model that represents the WFP structure subjected in Laboratory to shake-table tests was used as a target structure to be upgraded with SPDs. Then, non-linear time history analyses were conducted to evaluate the response of the WFP structure with dampers under bidirectional seismic loadings, focusing on its ultimate capacity in terms of energy.

4.1. Design of the Hysteretic Dampers

The dampers were designed in view of two conditions. The first was for them to have the maximum strength established in seismic codes. The second was to use a single type of damper in each story, i.e., all dampers installed in a given story would have the same stiffness and strength. The second condition is common in practice, simplifying the construction process and helping to avoid execution errors. Figure 8 shows a detail of the layout of the dampers at the first story in the WFP system. They were placed as diagonal members connecting the ends of columns. This arrangement of the dampers was intended to decrease the eccentricity in Y direction between the center of masses and the center of stiffness.
For the dampers located at the first story, the yield-strength was defined according to the criteria proposed by standard ASCE-SEI/41-13 [35], which establishes a base shear for the dampers equal, at most, to 50% of the main structure. The base shear strength of the WFP specimen tested in laboratory in X and Y directions, fQyX,1 and fQyY,1, were 57.5 kN and 62.5 kN, respectively [7]. These results were corroborated against those provided by the numerical model through a pushover analysis. Therefore, the base shear of the dampers in X and Y directions, sQyX,1 and sQyY,1, was limited to 28.75 kN (=57.5/2) and 31.25 kN (=62.5/2), respectively.
Using these sQyX,1 and sQyY,1, the axial yield strength of the dampers at the first story for X and Y directions, sNyX,1 and sNyY,1, were obtained as follows. For X direction, Q s y X , 1 = 2 N s y X , 1 cos α cos γ , from which sNyX,1 = 17.72 kN. For Y direction, Q s y Y , 1 = N s y Y , 1 ( cos θ + 2 cos β cos γ ) , thus NyY,1 = 20.93 kN. The meaning of angles α, β, γ, θ is shown in Figure 8. Finally, a common value for the axial yield strength of the dampers installed in the first-story, sNy,1, was determined as sNy,1 = min {sNyX,1, sNyY,1} = 17.72 kN, in order to fulfill the criteria explained above. Furthermore, the yield interstory drift for the dampers, sδy,1, was limited to 0.40fδy,1 on the basis of the results obtained by Oviedo et al. [9], where fδy,1 is the yield interstory drift of the WFP system (without dampers) at the first floor. The results of the test [7] and the pushover analyses conducted with the numerical model indicate that fδy,1 ≈ 0.01hp,1 = 14 mm for both X and Y directions, where hp,1 is the height of the first story; hence, the value adopted for sδy,1 is sδy,1 = 0.40 × 0.01hp,1 = 5.6 mm. Then, the axial yield relative displacement for the dampers, sΔuy,1, is obtained from sδy,1 in X direction, for which sNy,1 was selected as Δ s u y , 1 = δ s y , 1 cos γ / cos α , giving that sΔuy,1 is 5.35 mm. Finally, the stiffness of the dampers is k s y , 1 = N s y , 1 / Δ s u y , 1 = 17.72 / 5.35 = 3.31 kN/mm.
The yield-strength for the upper stories, Qy,i for i > 1, was determined for the purpose of preventing damage concentration. Here, damage is characterized through the parameter η i = W p , i / ( Q y , i δ y , i ) , where Wp,i is the energy dissipated by plastic deformations at the i story [15]. Qy,i, can be expressed as dimensionless by the yield-force coefficient, α i , defined as α i = Q y , i / k = i N m k g , where mk is the mass of the k story, N is the number of stories and g is the gravity acceleration. The distribution α ¯ i = α i / α 1 that makes η i approximately equal in all stories is called optimum yield-shear strength coefficient distribution [15]. Different expressions for α ¯ i have been proposed in the literature [15,16,17,18]. In this study, the approach proposed by Japanese Building Code [18], α ¯ J B C , i is used, which is expressed as follows:
α ¯ J B C , i = 1 + ( 1 m ¯ i m ¯ i ) 2 T 1 1 + 3 T 1
where m ¯ i = k = s N m k / M , M is the total mass and T1 is the fundamental period of the structure without dampers. The eigenvalue analysis carried out in the numerical model of the WFP system showed that the fundamental periods along X and Y directions are TX,1 = 0.32 s and TY,1 = 0.38 s, respectively. Therefore, by applying T1,X = 0.32 s and m ¯ 2 = 0.527 in Equation (1) for the X direction, the value obtained for α ¯ J B C , 2 is equal to 1.278. Further, as the total shear strength at the first story along X direction, QyX,1, is obtained as Q y X , 1 = Q f y X , 1 + Q s y X , 1 = 57.5 + 28.75 = 86.25 kN, this implies that α 1 = 86.25 · 103 N/[(6450 kg + 5780 kg)9.8 m/s2] = 0.7196. Then, the optimum shear strength coefficient at the second story in X direction is α ¯ J B C , 2 α 1 = 0.92 and the required shear strength is α ¯ J B C , 2 α 1 k = 2 2 m k g = 58.15 kN. Following a similar procedure for Y direction, Q y Y , 1 = Q f y Y , 1 + Q s y Y , 1 = 62.5 + 26.5 = 89 kN, α 1 = 0.743 , α ¯ J B C , 2 = 1.302 (for TY,1 = 0.38 s), α ¯ J B C , 2 α 1 = 0.97 and finally α ¯ J B C , 2 α 1 k = 2 2 m k g = 61.3 kN. In addition, the yield-shear strength at the second story of the WFP specimen along X and Y direction was obtained through a pushover analysis, obtaining that Q f y X , 2 Q f y Y , 2 = 138 kN. Therefore, no dampers were considered at the second story, because the strength of the WFP system along X and Y directions (138 kN) exceeded the required strength for the story (i.e., 58.15 kN in the X direction and 61.3 kN in the Y direction). Using dampers only in specific stories (not in all stories) is a practice successfully employed in design [10].

4.2. Numerical Model of WFP System with Dampers

A numerical model of the WFP structure with SPDs was built adding the dampers calculated in Section 4.1, modeled with the “Two Node Link Elements” implemented in OpenSees [24], to the numerical model described in Section 2.2 and depicted in Figure 3. The constitutive model of the “Two Node Link Elements” that represents the SPDs is the Uniaxial Material Steel 02 described in Section 3, with, sNy = 17.72 kN and sky = 3.31 kN/mm; the values of the other dimensionless parameters of the model are indicated in Table 1.
The mass-proportional damping model was redefined for the WFP system retrofitted with hysteretic dampers in order to keep the relative damping values established for the WFP system without dampers. The new elastic stiffness matrix led to new modal frequencies for the first and second vibration modes, respectively f1 = 3.08 Hz and f2 = 3.95 Hz. In order to keep the damping ratio of 3% in the second mode established in Section 2.3 for the WFP structure without dampers, the parameter a0 was updated for the new frequency ω2 = 2πf2 = 2π3.95 = 24.82 rad/s, giving a0 = 1.49. Figure 9 shows the mass-damping model of the WFP system both with and without dampers. According to the new damping model, the value of ξ1 corresponding to the fundamental frequency f1 = 3.08 Hz is ξ1 = 3.8%. As the WFP system with dampers enters in plastic range, the fundamental frequency decreases. It is expected that its lowest value be higher than the obtained at the collapse in the tested structure without dampers, i.e., f1 = 1.3 Hz. The value of ξ for f1 = 1.3 Hz in the damping model for the WFP system with dampers corresponds to 9% (Figure 9), which is considered an upper bound for the damping in the numerical model.

4.3. Numerical Analyses

The numerical model described in the previous section was subjected to a selection of ground motion records to obtain the ultimate capacity of the specimen in terms of energy. The ground motion records were selected from the database prepared by Lucchini et al. [36], which contains ordinary records (i.e., without recognizable pulses in the ground velocity) with moment magnitude greater or equal to 5. The records were selected on the basis of the following two criteria. First, the scale factor SF70 to be applied to the accelerograms in order to achieve a total input energy—in terms of pseudo velocity VE = (2EI/M)0.5 of VE = 70 cm/s—was between 1/3 and 3. VE = 70 cm/s is the input energy measured in the WFP specimen tested on the shake-table (Section 2.1) when it was on the brim of yield under uni- and bidirectional loadings [6,7]; it will be referred to as VE,70 (=70 cm/s) herein. It was expected that by adding the hysteretic dampers, the input energy to produce plastic deformations in WFP structure would be higher than VE,70. The energy input in the X and Y directions at the onset of yielding of the WFP structure without dampers, i.e., when VE,70 (=70 cm/s) is attained, will be respectively referred to as EIX,70 and EIY,70, and the corresponding equivalent velocities are VEX,70 = (2EIX,70/M)0.5 and VEY,70 = (2EIY,70/M)0.5. In general, VEX,70 and VEY,70 are different for each ground motion. The second criterion is that the PGA of the ground motion after scaling by SF70, be 0.3 g at most. This condition was imposed to avoid excessively large (i.e., unrealistic) values of PGA when the numerical model collapses. The records were classified in five sets, Set 1 to Set 5, according to the angle θ formed by the components X and Y of VE, θ = atan ( V E Y , 70 / V E X , 70 ) , as follows: 22.91° < θ < 32.65° for Set 1; 32.65° < θ < 42.40° for Set 2; 42.40° < θ < 52.14° for Set 3; 52.14° < θ < 61.88° for Set 4; and 61.88° < θ < 71.62° for Set 5. Seven records corresponding to different earthquakes were chosen within each set. The records are identified by the earthquake name followed by the record sequence number in the database (see Table A1, Table A2, Table A3, Table A4 and Table A5 in Appendix A for details).
The X and Y components of each ground motion scaled by SF70 were applied simultaneously to the numerical model in successive seismic simulations using a sequence of scaling factors, 100%, 200%, 300%, etc., until the seismic performance level (SPL) of Near Collapse (NC) was achieved. That is, 100% meant that the scaling factor applied to the original ground motion was SF70, for 200% the scaling factor was 2×SF70, and so on. In addition, within each set, one ground motion was selected, and the X and Y components were applied separately to the numerical model until failure, so as to investigate the ultimate capacity under unidirectional seismic loads. In total, 45 NLTHAs were launched in a parallel scheme (OpenseesMP.exe) using a Dell Precision Tower 5810 with 12 cores at 3.60 GHz in order to minimize the computational time. As a reference, the mean computational time required was 40 h per core and record.
Three limit states characterized by their SPLs were considered in this study. The first one corresponds to the SPL Fully Operational (FO), in which the structure only undergoes elastic deformations, and therefore no damage occurs. The second is SPL Operational (OP), in which the WFP system remains elastic and only the dampers are damaged. The third SPL is NC, in which the WFP system is severely damaged, and the dampers are also damaged but without failing. The interstory drift index of the i story, IDIi, defined as the ratio between the interstory drift and the story height, is used here as the engineering parameter to establish the upper limit of IDIi for the different SPLs defined above, denoted as IDIFO,i, IDIOP,i and IDINC,i, respectively. Therefore, for SPL FO, IDIFO,1 = 0.4% (sδy,1 = 0.4 fδy,1 and fδy,1 = 0.01hp) and IDIFO,2 = 1% for the second story, not having dampers. For SPL OP, the reference was the yield-displacement of the WFP system, thus IDIOP,i = 1% for both stories. Finally, for SPL NC and according to the results obtained in the literature [6,7], the limit was established at IDINC,i = 2.6% for both stories.

5. Results: Seismic Capacity of a WFP Structure Upgraded with Hysteretic Dampers

5.1. Input Energy and Dissipated Energy

The input energy on a structure subjected to bidirectional (horizontal) seismic loading expressed in terms of equivalent velocity VE can be simply calculated from the energy input in the X, EIX, and in the Y, EIY, directions by VE = (VEX2+VEY2)0.5, where VEX = (2EIX/M)0.5, VEY = (2EIY/M)0.5. VE can be interpreted as the modulus of a vector in the VEX-VEY plane. The same can be applied to the total energy that contributes to damage, ED, defined [15] as EI minus the energy dissipated by inherent damping Eξ, i.e., ED= EIEξ. Given the energy balance of the structure [15], it follows that ED equals the sum of the elastic vibrational energy Ee and the energy dissipated through plastic deformations (hysteretic energy) Eh, i.e., ED=Ee+Eh. For high levels of plastic deformations Ee becomes negligible in comparison with Eh [15], which leads to EDEh. The energy that contributes to damage can be calculated independently in the X and Y directions, EDX and EDY, and is nearly equal to the energy dissipated in the X and Y directions, EhX and EhY, i.e., EDXEhX and EDYEhY. The corresponding equivalent velocities are VDX = (2EDX/M)0.5, VDY = (2EDY/M)0.5, and VD = (VDX2+VDY2)0.5. Based on the above considerations, the values of VD, VDX, and VDY when the structure is near collapse can be interpreted as the ultimate energy dissipation capacity of the structure in the form of plastic deformations, expressed in terms of equivalent velocities.
Figure 10 illustrates the energy capacity of the structure when it reaches the SPL of FO, OP, and NC, respectively. More precisely, Figure 10a,b,d show VE (defined by its components VEX and VEY) obtained through numerical simulations using the model described in Section 4.2, subjected to the five sets of bidirectional ground motion records explained in Section 4.3. The results of each set (Set 1 to Set 5) are identified in the figure with different colors. Additionally plotted are the VE’s obtained with the numerical model subjected to unidirectional ground motions (referred to as Set X and Set Y); they are identified in the legend with the letter X or Y added to the record name. The mean x ¯ (red dash line) and mean plus/minus one standard deviation σ (blue dash line) are also depicted and identified with VE,FO, VE,OP and VE,NC in Figure 10.
The average values shown in Figure 10a,b,d are V ¯ E , F O = 36 cm/s, V ¯ E , O P = 112 cm/s and V ¯ E , N C = 301 cm/s, with standard deviations equal to 11 cm/s, 34 cm/s, and 84 cm/s, respectively. In terms of equivalent velocity this entails that the energy capacity of the structure in terms of input energy for SPL NC is, on average, 2.70 times that for SPL OP. In terms of energy (EI), the increase is more than sevenfold, i.e., 7.29 (= 2.702).
A more detailed analysis of the results is offered in Table 2, where the mean and the coefficient of variation, COV, of the input energy of the three SPLs are shown for each set of records. Moderate differences are seen among the different groups for VE,FO, which are greater for VE,OP and especially for VE,NC., with COVs around 0.30. Furthermore, the differences between the input energy achieved for the different SPLs under each set of ground motions were analyzed by means of the ratios VE,OP/VE,FO and VE,NC/VE,FO. Moderate differences could be seen for VE,OP/VE,FO, with a mean of 3.22. For VE,NC/VE,FO the mean increases to 8.82. The highest values for the latter are found under Set X, Set 1 and especially Set 2 (VE,NC/VE,FO = 12.23). The structure under Sets 4, 5, and Y showed the highest values for the elastic input energy VE,FO, while the trend was reversed for VE,NC (i.e., when the structure undergoes plastic deformations), giving the highest values under Sets X, 1, and 2. Therefore, a reduction of the seismic capacity of the structure under plastic deformations is observed when the Y component of the seismic action is the strongest. It is worth noting that the structure analyzed in this study presents eccentricities of the center of mass with respect to the center of stiffness in the Y direction.
Figure 11 shows the mean and error bars of θ V E defined as θ V E = atan ( V E Y / V E X ) , obtained for each SPL under the different set of bidirectional ground motions (Set 1 to Set 5). In the ground motions of Set 1, the energy input in the X direction is markedly larger than in the Y direction (see Section 4.3). As seen in Figure 11, for Set 1, as the level of plastic deformations increases (i.e., from the SPL FO to SPL NC) the value of θ V E decreases; this means that the energy input in the X direction keeps increasing in relation to the energy input in the Y direction. A similar trend but for the Y component of the ground motion is observed in Sets 3, 4, and 5. In these sets, the energy input in the Y direction is initially larger than in the X direction and keeps increasing with the level of plastic deformation (i.e., the value of θ V E increases as the SPL goes from FO to NC). Set 2 presented an intermediate behavior. Accordingly, the structure investigated does not show a tendency to balance the energy input in the two orthogonal horizontal directions as the structure enters in the non-linear range. This is opposite to what has been reported in previous studies [37] for conventional structures, where the torsional response makes the energy input in the X and Y directions tend to grow near as the structure undergoes larger plastic deformation. This finding is most probably due to the presence of the dampers, effectively controlling (i.e., reducing) the torsional response. The EDDs installed in the WFP system successfully reduced the torsional response because: (i) they reduced the initial eccentricity, (ii) the EDDs did not present stiffness degradation, and (iii) overstrength was provided by the EDDs due to strain hardening.
Moreover, Figure 10c,e show the maximum energy dissipated through plastic deformations for SPLs OP and NC in terms of equivalent velocity, i.e., VD,OP and VD,NC, respectively. The same representation criteria as in Figure 10a were used. The average values shown in the Figures with red dashed lines are V ¯ D , O P = 77 cm/s and V ¯ D , N C = 241 cm/s, with standard deviations equal to 22 cm/s and 69 cm/s, respectively. A more detailed analysis of results regarding the energy that contributed to damage is given in Table 3. As seen, under the sets of ground motions X, 1 and 2, the structure shows the highest values for the capacity to dissipate energy by plastic deformation, as with input energy. Moreover, this capacity is on average more than threefold, in terms of equivalent velocity, for SPL NC than for SPL OP, exhibiting the highest differences under unidirectional seismic loadings (Sets X and Y) and the bidirectional seismic loadings with Sets 1 and 2 for which the X component of the seismic action is the strongest.
Table 3 furthermore gives the mean of the ratios VD,OP/VE,OP and VD,NC/VE,NC obtained for the different set of records for SPL OP and NC, respectively. The mean of VD,OP/VE,OP under each set of records was in a range between 0.66 and 0.72, the absolute mean—taking into account all the records—being equal to 0.70. For VD,NC/VE,NC, a range between 0.76 and 0.82 was obtained and the absolute mean was 0.80. Two aspects of these results deserve special attention. The first one is the low dispersion achieved for both cases, with COV equal to 0.11 at the most for VD,OP/VE,OP and 0.04 for VD,NC/VE,NC. The second noteworthy finding is: the stronger the X component of the seismic action applied along a symmetrical direction, the higher the aforementioned relationships, and thus the capacity to dissipate the energy through plastic deformations.
As indicated above, the mean of VD,OP/VE,OP was 0.70 (COV = 0.09) and the mean of VD,NC/VE,NC was 0.80 (COV = 0.04). Numerous expressions are proposed in the literature to estimate VD/VE. Among them, the one proposed by Akiyama [15] is expressed as follows:
V D V E = 1 1 + 3 ξ + 1.2 ξ
Substituting the damping ratio 0.038 established in Section 4.2 in Equation (2) gives VD/VE = 0.74, which is very close to the value obtained, on average, in the analyses for VD,OP/VE,OP (=0.70). Nevertheless, for SPL NC both the WFP system and the dampers undergo plastic deformations. This means that higher values are expected for the modified frequency and damping ratio. Substituting the damping ratio 0.09 considered in Section 4.2 for the WFP system with dampers when it is near collapse, Equation (2) gives VD/VE = 0.61, far from the value obtained from the analysis, (VD,NC/VE,NC= 0.80). The well-known reason [15] is that, for the sake of simplicity, Equation (2) ignores the fact that for a large level of plastic deformation (as is the case of SPL NC), the amount of energy dissipated by damping tends to decrease, and this enlarges VD/VE. Akiyama’s Equation (2) therefore provides a reasonable approximation for SPL OP—damage only in dampers—but underestimates the VD/VE for SPL NC damage to both the WFP system and the dampers.

5.2. Differences for the Seismic Capacity Under Unidirectional and Bidirectional Loadings

The seismic capacity of structures determined through independent unidirectional analysis along two orthogonal directions is a matter of controversy [27,37,38,39]. To shed light on this issue, a comparison is made in this section between: (i) the capacity of the WFP system with hysteretic dampers obtained from the analysis under unidirectional seismic loadings using the records included in Set X and Set Y, and (ii) that obtained from the analysis under bidirectional seismic loadings using both components of those same records. In this case, only SPLs OP and NC are considered. The input energy and dissipated energy derived for each SPL in terms of equivalent velocity under unidirectional loading are represented by V E X , S P L u n i and V D X , S P L u n i along X direction, and by V E Y , S P L u n i and V D Y , S P L u n i along the Y direction. Moreover, V E X , S P L u n i and V E Y , S P L u n i can be used to obtain an estimation of the capacity of the structure in terms of input energy, V E , S P L * , through the expression V E , S P L * = ( V E X , S P L u n i ) 2 + ( V E Y , S P L u n i ) 2 . By applying a similar procedure, an estimation of the total dissipated energy, V D , S P L * , is obtained through the expression V D , S P L * = ( V D X , S P L u n i ) 2 + ( V D Y , S P L u n i ) 2 .
Table 4 reports the results, so that for each SPL the seismic capacity of the WFP system with hysteretic dampers under unidirectional loadings can be compared to the values obtained under bidirectional loadings in terms of input energy and dissipated energy. For SPL OP, the capacity seen for most records under unidirectional loadings is smaller than under bidirectional loadings, being on average 79% to 85% for VE and 70% to 80% for VD. The same trend is observed for SPL NC, but with higher values—86% to 89% for VE, and 78% to 88% for VD. Similar results were obtained by Rodrigues H. et al. in columns subjected to biaxial cyclic loadings and variable axial loads [27]. Yet, there are exceptions, such as the response under the Y component of Kobe-1115 or the X component of Landers-888 in SPL NC, which show values of VE and VD that are higher than those under bidirectional seismic action (about 50% higher for Kobe-115 and about 20% greater for Landers-888). The limited number of records used in the present study impedes the formulation of a general statement about the higher capacity of structures under bidirectional loading versus unidirectional loads. It is worth noting that the columns of the WFP system are prone to undergoing variable axial loads under both unidirectional and bidirectional cyclic loadings due to the scheme of the structure itself—three columns. This could explain the results obtained.
Furthermore, Table 4 indicates the differences observed between the capacity in terms of energy estimated from the uniaxial analyses under X and Y components of the selected seismic actions and that obtained in the bidirectional analyses under both components of the referred seismic actions. In all cases, V E , S P L * and V D , S P L * exceeded the counterpart VE,SPL and VD,SPL. For SPL OP the differences, on average, are about 18% higher with COV = 0.07. For SPL NC the differences are greater, being about 27% higher with COV = 0.20.

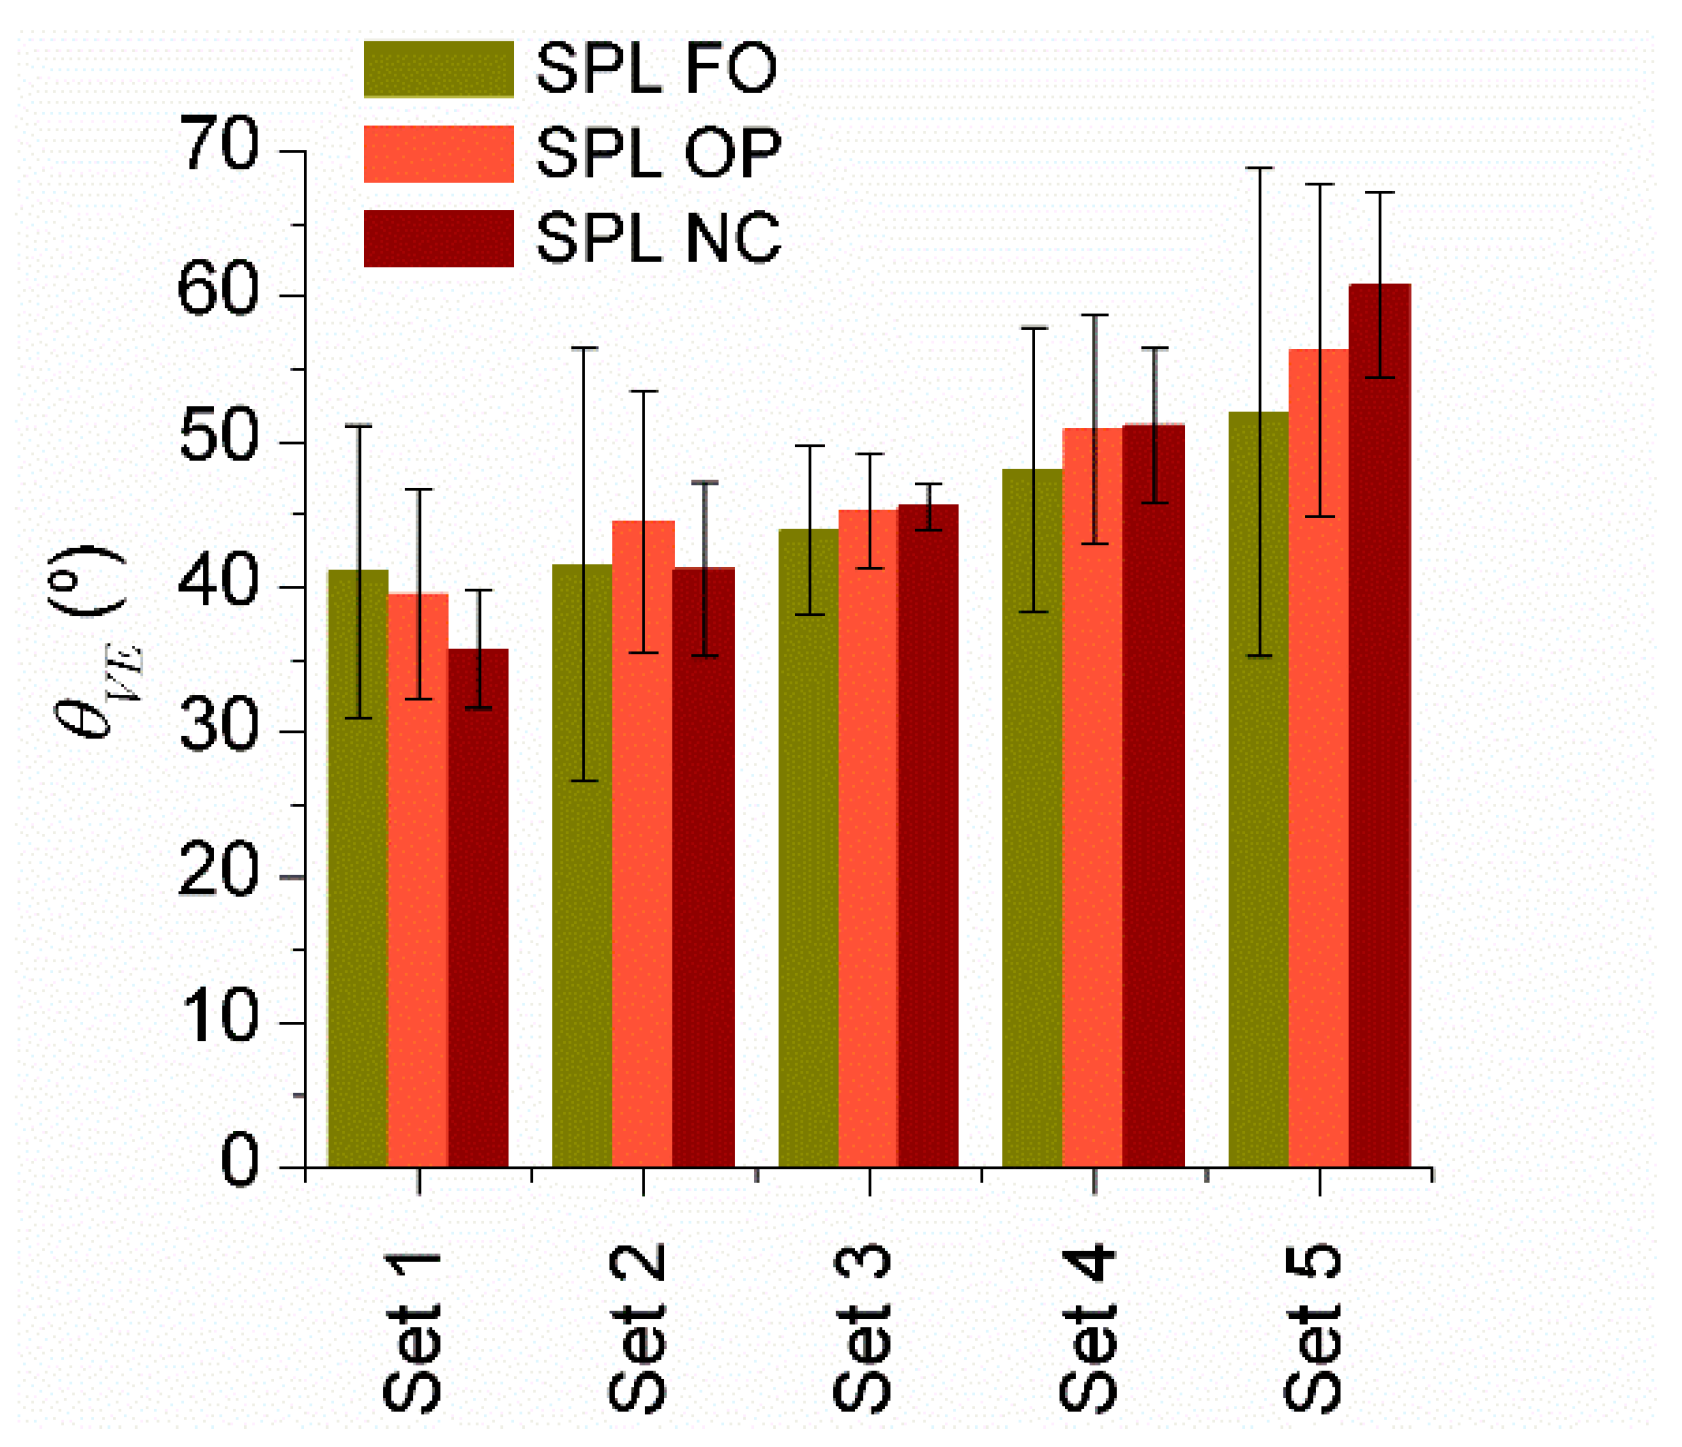
5.3. Ductility Level for Seismic Performance Levels (SPL) Near Collapse (NC)

The ductility level attained in the analyses for SPL NC is studied here through the apparent plastic deformation of the i story along the X and Y directions, calculated separately for the WFP system (flexible system), fμX,i and fμY,i, and for the dampers (the stiff part), sμX,i and sμY,i, respectively. For the flexible part (WFP system), fμX,i is defined as μ f X , i = ( δ m a x X , i δ f y X , i ) / δ f y X , i , where δmaxX,i and fδyX,i are the maximum interstory drift—measured at the center of stiffness of the story—and the yield interstory drift of the main structure for the i story, respectively, along the X direction, and fμY,i it is as μ Y , i = ( δ m a x Y , i δ f y Y , i ) / δ f y Y , i , where δmaxY,i and fδyY,i are the counterpart variables defined above but along the Y direction. For the stiff part (dampers), the same definition is used for sμX,i and sμY,i, changing the subindex ‘f’ to ‘s’, and using sδyX,i and sδyY,i for the yield interstory drift of the dampers along X and Y directions instead of fδyX,i and fδyY,i.
The SPL NC was achieved in all cases at the first story (i = 1), for which the analyses stopped when IDI1 exceeded IDImax = 2.6% in any direction. In contrast, for the second story, the low values achieved for δmaxX,2 and δmaxY,2 led to values about zero for both fμX,2 and fμY,2. Taking into account that fδyX,1 = fδyY,1 = 14 mm, sδyX,1 = sδyY,1 = 5.6 mm and IDImax = IDImax,NC = 2.6%, the maximum apparent plastic deformation for the WFP system and for hysteretic dampers would be fμmax,1 = 1.6 and sμmax,1 = 5.5, respectively. This means that for the structure investigated in this study, the ductility level in dampers is about triple the one considered for the WFP system. Figure 12 offers the mean of the maximum apparent plastic deformation achieved in the WFP system (Figure 12a) and in hysteretic dampers (Figure 12b) under the different sets of ground motion records for each direction. It is seen that under Sets X, 1, and 2, SPL NC is achieved under the X direction for which the input energy of the X component of the seismic action is the highest, because the mean of fμX,1 and sμX,1 correspond to fμmax,1 and sμmax,1, respectively. The opposite occurs under Sets 4, 5, and 7. Nevertheless, under Set 3 there is no specific direction for which SPL NC is attained.

5.4. Energy Dissipated by Plastic Deformations for SPL NC

The energy dissipated by plastic deformations, i.e., the damage obtained in the analyses for SPL NC in both the WFP system and the hysteretic dampers, is studied here. The damage at the i story, Wp,i, is obtained by adding the damage in the flexible part (WFP system), fWp,i, and that of the stiff part (hysteretic dampers), sWp,i, i.e., W p , i = W f p , i + W s p , i . Further, Wp,i, fWp,i and sWp,i can be expressed from their X and Y components as W p , i = W p X , i + W p Y , i , W f p , i = W f p X , i + W f p Y , i and W s p , i = W s p X , i + W s p Y , i . Then, the following relationships are deduced: W p X , i = W f p X , i + W s p X , i and W p Y , i = W f p Y , i + W s p Y , i . The dissipated energy of the main structure at the i story along X and Y directions under a given seismic record is obtained as follows: (i) first, the contribution of the j column to the dissipated energy along the X and Y directions is obtained through the expressions W f p X , i j = Q f X , i j d δ X , i j and W f p Y , i j = Q f Y , i j d δ Y , i j , respectively, where fQX,ij and fQY,ij are the shear force histories of the j column along X and Y directions, and δX,ij and δY,ij are the counterpart interstory drift histories; (ii) next, fWpX,i and fWpY,i are obtained by adding the contribution of the dissipated energy of all the columns of the story along X and Y directions, i.e., W f p X , i = j = 1 N c W f p X , i j and W f p Y , i = j = 1 N c W f p Y , i j , where Nc is the number of columns at the i story. The dissipated energy of the dampers at the i story is obtained by adding the contribution of all of them along the X and Y directions. The WFP system considered in this research was upgraded with dampers located only at the first story, arranged as indicated in Figure 8. The energy dissipated by a k damper under a seismic record, sWp,ik, is obtained through the expression W s p , i k = N s k d ( Δ s u k ) , where sNk and sΔuk are respectively the axial force history and the relative axial displacement history of the damper. Damper 3 is aligned in Y direction, hence its contribution to the dissipated energy for the first story is entirely accounted for in sWpY,1. Dampers 1 and 2 contribute to dissipating energy in both X and Y directions (Figure 8); their contributions sWpX,1 and sWpY,1 are W s p , 1 k ( cos ( α ) ) 2 and W s p , 1 k ( sin ( α ) ) 2 , respectively.
Figure 13 shows that the energy absorbed and dissipated by the dampers with respect to the total one at the first story, W s p , 1 / W p , 1 ranges, on average, from 80% to 90%. The highest values are obtained under Sets X, 2, and 3—higher input energy in X component—and the lowest under set Y. This means that most of the energy is absorbed by the dampers. Additionally shown in Figure 13 is the former ratio, but expressed from the X and Y components, W s p X , 1 / W p X , 1 and W s p Y , 1 / W p Y , 1 , respectively. W s p X , 1 / W p X , 1 ranges, on average, from 83% to 97% for bidirectional loadings (Sets 1 through 5) and 100% under set Y—without a seismic component in X direction. W s p Y , 1 / W p Y , 1 ranges, on average, from 77% to 88% for bidirectional loadings and 100% under set X—without a seismic component in Y direction—for which reason the torsional effects led to displacements and damage entirely absorbed by the dampers. Therefore, the symmetrical layout of dampers 1 and 2 (Figure 8) leads to higher efficiency in absorbing and dissipating energy along the X direction than along Y direction, where the three dampers contribute to dissipating energy but not in the same proportion. Moreover, according to these results, the WFP system absorbs and dissipates about 20%, at most, of Wp,1; this stands as a moderate contribution and means that the dampers are effectively controlling (i.e., limiting) damage to the main structure.
The damage along X and Y directions at the i story for both the main part (WFP structure) and the stiff part (dampers) can also be expressed through the dimensionless variable η,i defined in Section 4.1. Accordingly, for the WFP system, the damage along X and Y directions is respectively expressed as η f X , i = W f p X , i / ( Q f y X , 1 δ f y X , i ) and η f Y , i = W f p Y , i / ( Q f y Y , 1 δ f y Y , i ) . For the hysteretic dampers, the counterpart expressions are η s X , i = W s p X , i / ( Q s y X , 1 δ s y X , i ) and η s Y , i = W s p Y , i / ( Q s y Y , 1 δ s y Y , i ) . Moreover, according to De Stefano and Faella [38], the damage to the main part and the stiff part at the i story can be expressed as η f i = η f X , i + η f Y , i and η s i = η s X , i + η s Y , i , respectively. Figure 14a,b show fηX,i, fηY,i and fηi for the first (i = 1) and second story (i = 2), respectively. Higher values are seen for fη1 than for fη2. This result is a consequence of the greater strength of the WFP system in the second story with respect to the value provided by an optimum distribution (Section 4.1).
Figure 14a also shows that the higher the intensity of the X or Y component of the seismic action, the higher the damage fηX,1 or fηY,1, respectively. The same response is observed for the hysteretic dampers in Figure 14c. Nevertheless, the efficiency exhibited by dampers in the X direction under ground motion records of large intensity for the X component is higher than that of the Y direction under seismic actions having large intensity for the Y component; this is reflected by the comparatively higher values observed for sηX,1 under Sets X, 1, and 2 as opposed to those for sηY,1 under Sets 4, 5 and Y.
It is likewise interesting to note the significant differences observed for damage in the WFP system versus the dampers, respectively shown in Figure 14a and Figure 14c, a finding related to the energy dissipated in them (Figure 13). Despite the values achieved in dampers, none of them failed, as verified by the energy-based damage index ID. This damage index is defined in the reference [40] for steel elements and moreover verified by non-destructive evaluation tests [34,41,42]. ID varies from 0 to 1, where 0 indicates no damage and 1 failure. Figure 14d shows the damage indices for the three dampers, IDk (k varies from 1 to 3), achieved under each set of records, as well as the maximum damage index achieved for them under each set of records, IDmax. It is seen that IDmax ranges from 0.07 (Set 3) up to 0.25 (Set Y), indicating that SPL NC is achieved in conjunction with the failure of the WFP system, but not by failure of the dampers. The mean IDk values obtained for the different dampers result from their distribution at the first story: (i) along X direction, dampers 1 and 2 are in symmetric layout, from the base of columns 2 and 3 to the outer column-plate connection; (ii) along Y direction, a non-symmetric layout has damper 3 located between columns 2 and 3, and aligned in this direction. Therefore, ID1 and ID2 show, on average, similar values under the different record sets, whereas ID3 shows higher values under the sets with large intensity in the Y component. This means that the arrangement of dampers in the story is a key issue for preventing an uneven distribution of damage among them.

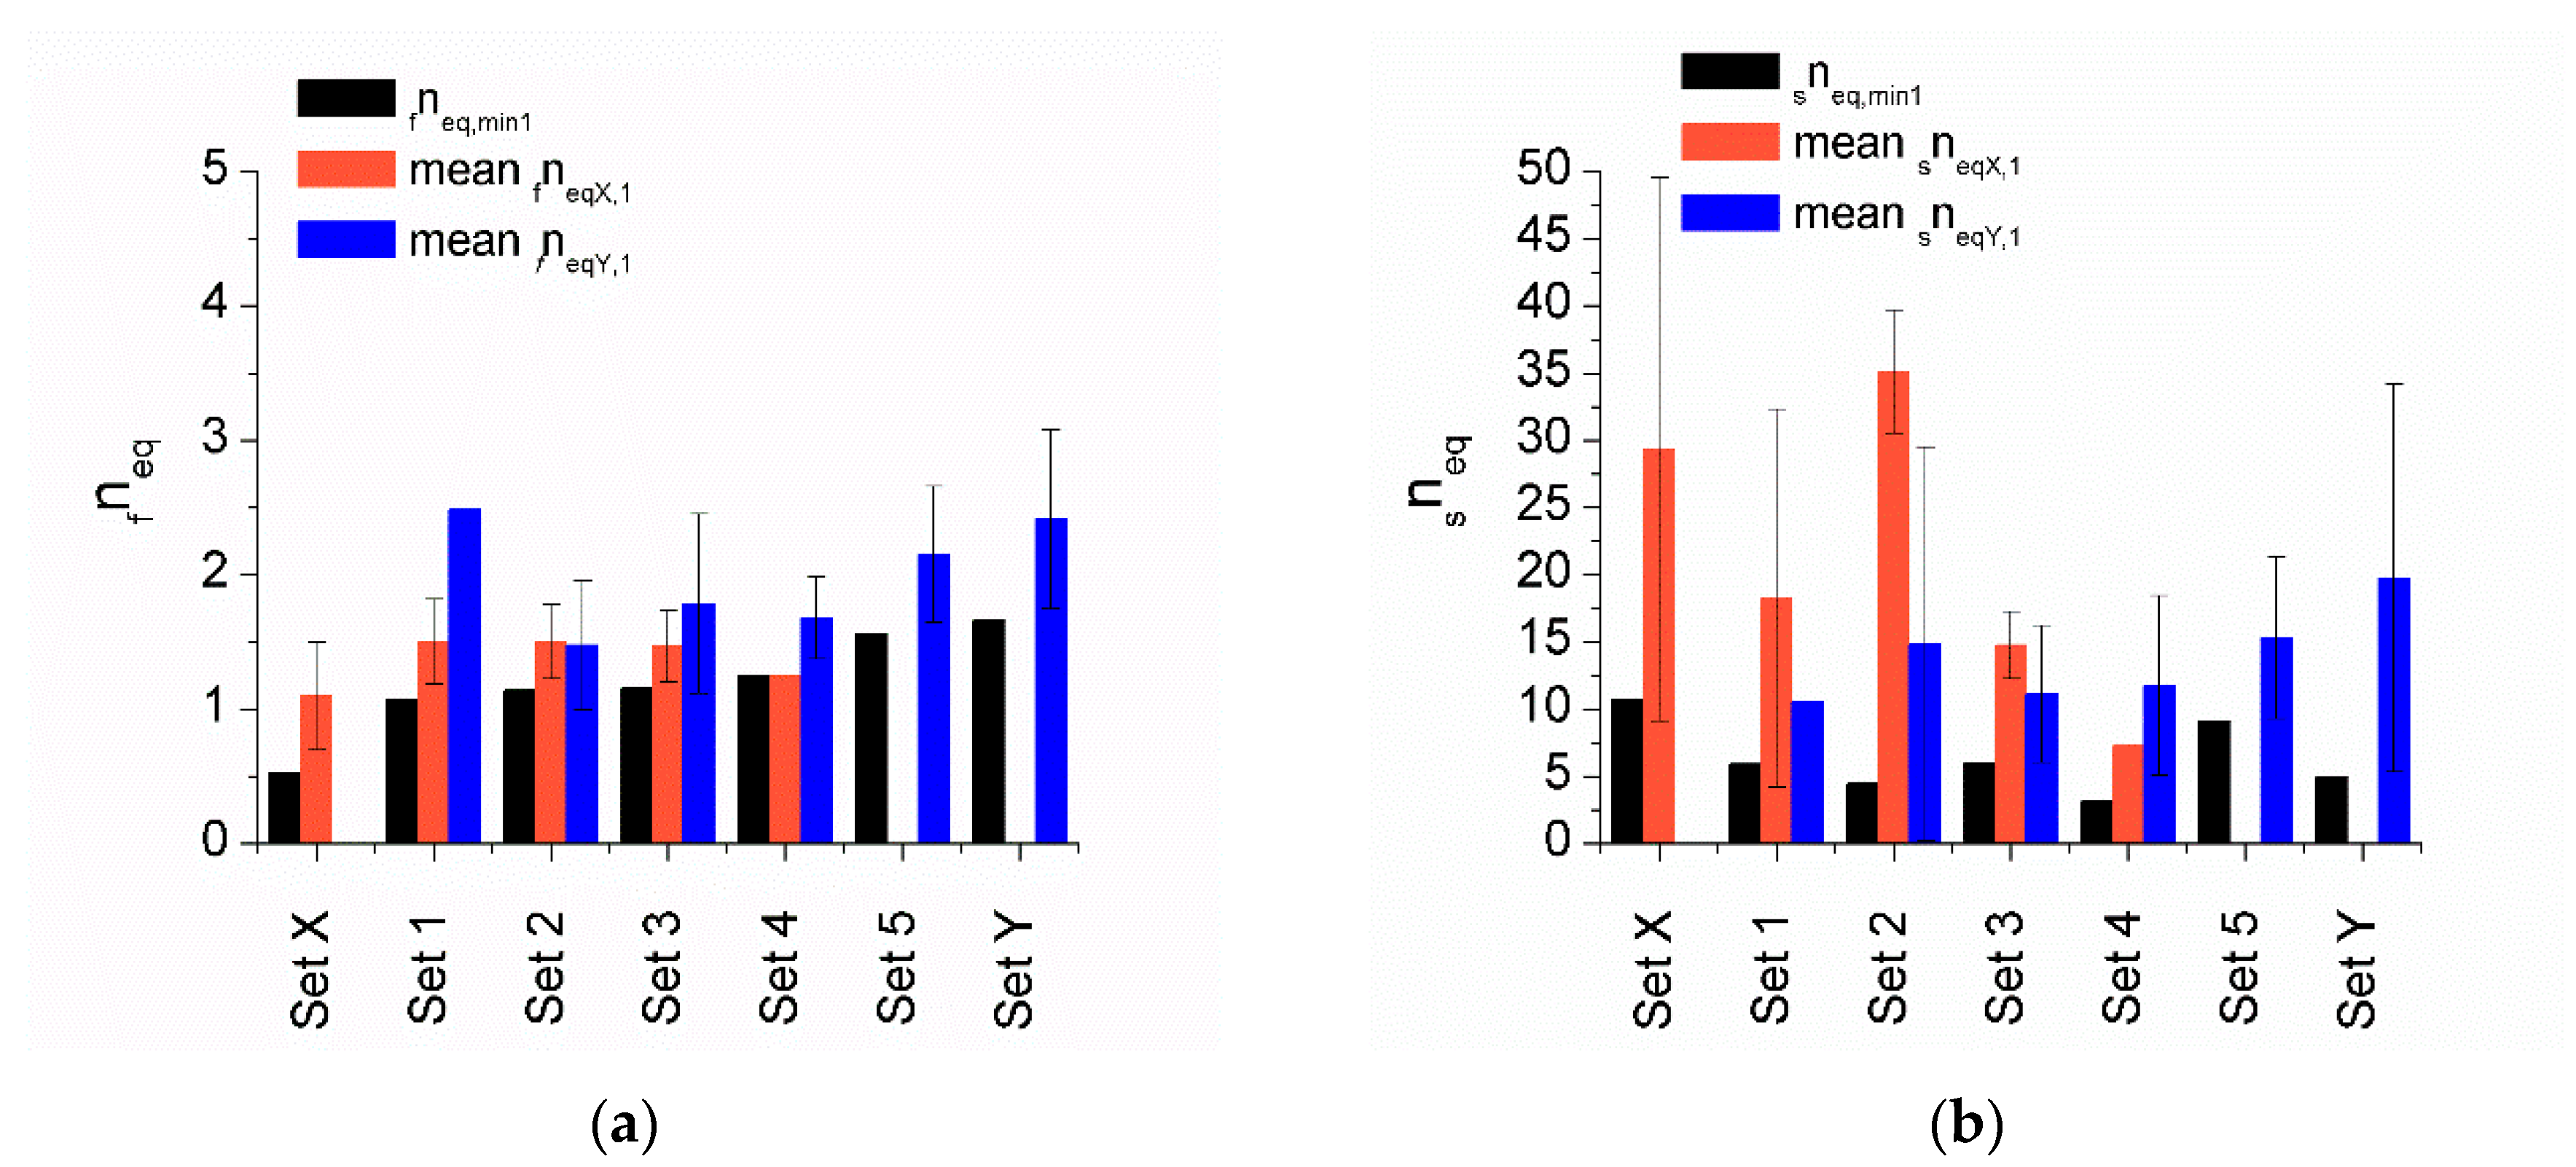
5.5. Equivalent Number of Cycles for SPL NC

Section 5.3 and Section 5.4 addressed two important aspects of the seismic response of structures. One is the ductility level at each i story expressed through the variable µi; the other is the hysteretic energy dissipated through cumulative cyclic reversals of each story i expressed through the dimensionless variable ηi. The ratio ηi/µi is another key aspect of the seismic response of the structure, characterizing the efficiency of the structure in dissipating energy [15]. The ratio ηi/µi is referred in the literature as the equivalent number of cycles n e q , i ( = η i / μ i ) and is influenced by the characteristics of the ground motion and the type of structure [43]. In flexible-stiff mixed structures, this ratio can be defined for the main structure, n f e q , i = η f i / μ f i , and for the stiff part, n s e q , i = η s i / μ s i .
Figure 15 offers the mean of fneq,1 and sneq,1 obtained in the analyses for SPL NC at the first story along the X and Y directions, i.e., n f e q X , i = η f X , i / μ f X , i and n f e q Y , i = η f Y , i / μ f Y , i for the WFP system (Figure 15a), and n s e q X , i = η s X , i / μ s X , i and n s e q Y , i = η s Y , i / μ s Y , i for the hysteretic dampers (Figure 15b). It is important to stress that the components X and Y used to calculate fneq,1 and sneq,1 were those for which the maximum ductility levels, μ f m a x , 1 and μ s m a x , 1 , were achieved under each seismic record. Figure 15 also shows fneq,min1 and sneq,min1, respectively, the minimum values achieved for fneq,1 and sneq,1 in the analysis under each set of records.
As seen in Figure 15a, fneqX,1 ranges on average between 1 and 1.5, with a mean of 1.39 and COV = 0.24; in turn fneqY,1 ranges between 1.5 and 2.5, with a mean of 2.0 and COV = 0.28. Further, it can be observed that fneq,min1 ranges between 0.53 (set X) and 1.66 (set Y), with a mean of 1.20 and COV = 0.29. These values obtained for fneq,1 are similar to the proposal by Akiyama, fneq = 2 for flexible-stiff mixed systems whose flexible part exhibits pinching (as is the case of WFP systems) [15].
On the other hand, Figure 15b shows that sneqX,1 ranges on average between 7 and 35, with a mean about 24 and COV = 0.60. sneqY,1 ranges between 10 and 20, with a mean about 15 and COV = 0.59. The higher values for both sneqX,1 and sneqY,1 are concentrated under the sets of records for which the correspondent seismic component (X or Y) is large, i.e., Sets X, 1, and 2 for the former, and Sets 5 and Y for the latter. Furthermore, sneq,min1 is found to range between 3.1 (Set 4) and 10.72 (Set X), with a mean of 6.36 and COV = 0.39. For flexible-stiff systems whose stiff parts exhibit an elastic-perfectly plastic behavior, Akiyama [15] proposed sneq = 8. This value is slightly higher than sneq,min1, but close to the lower limit of the range of both sneqX,1 and sneqY, indicated above.
It is noteworthy that the results obtained in the analyses for fneq,1 and sneq,1 come from the successively scaled seismic simulations until achieving SPL NC. Therefore, they can be used to obtain the cumulative damage in WFP structures with hysteretic dampers subjected to shocks and aftershocks.

6. Conclusions

This study investigated the seismic behavior of reinforced concrete (RC) waffle-flat-plate (WFP) structures upgraded with hysteretic dampers and subjected to bidirectional seismic loadings. To this end, a 3D numerical model representing a 2/5 scale portion of a WFP prototype structure was built, calibrated and validated with the results of bidirectional shake-table tests. Next, hysteretic dampers were added to the numerical model at the first story. The constitutive model used for the dampers was also validated by means of the results of static cyclic tests. The numerical model of the WFP system with dampers was subjected to five sets of seven ground motion records in order to attain SPLs of fully operational (FO, elastic behavior), operational (OP, damage only in dampers), and near collapse (NC, heavy damage in WFP and dampers). Each record was applied in a sequence of scaled seismic simulations until achieving SPL NC. In addition, five records were selected (one from each set) and the X and Y components were applied separately in only one direction until achieving SPL NC. The following conclusions are reached:
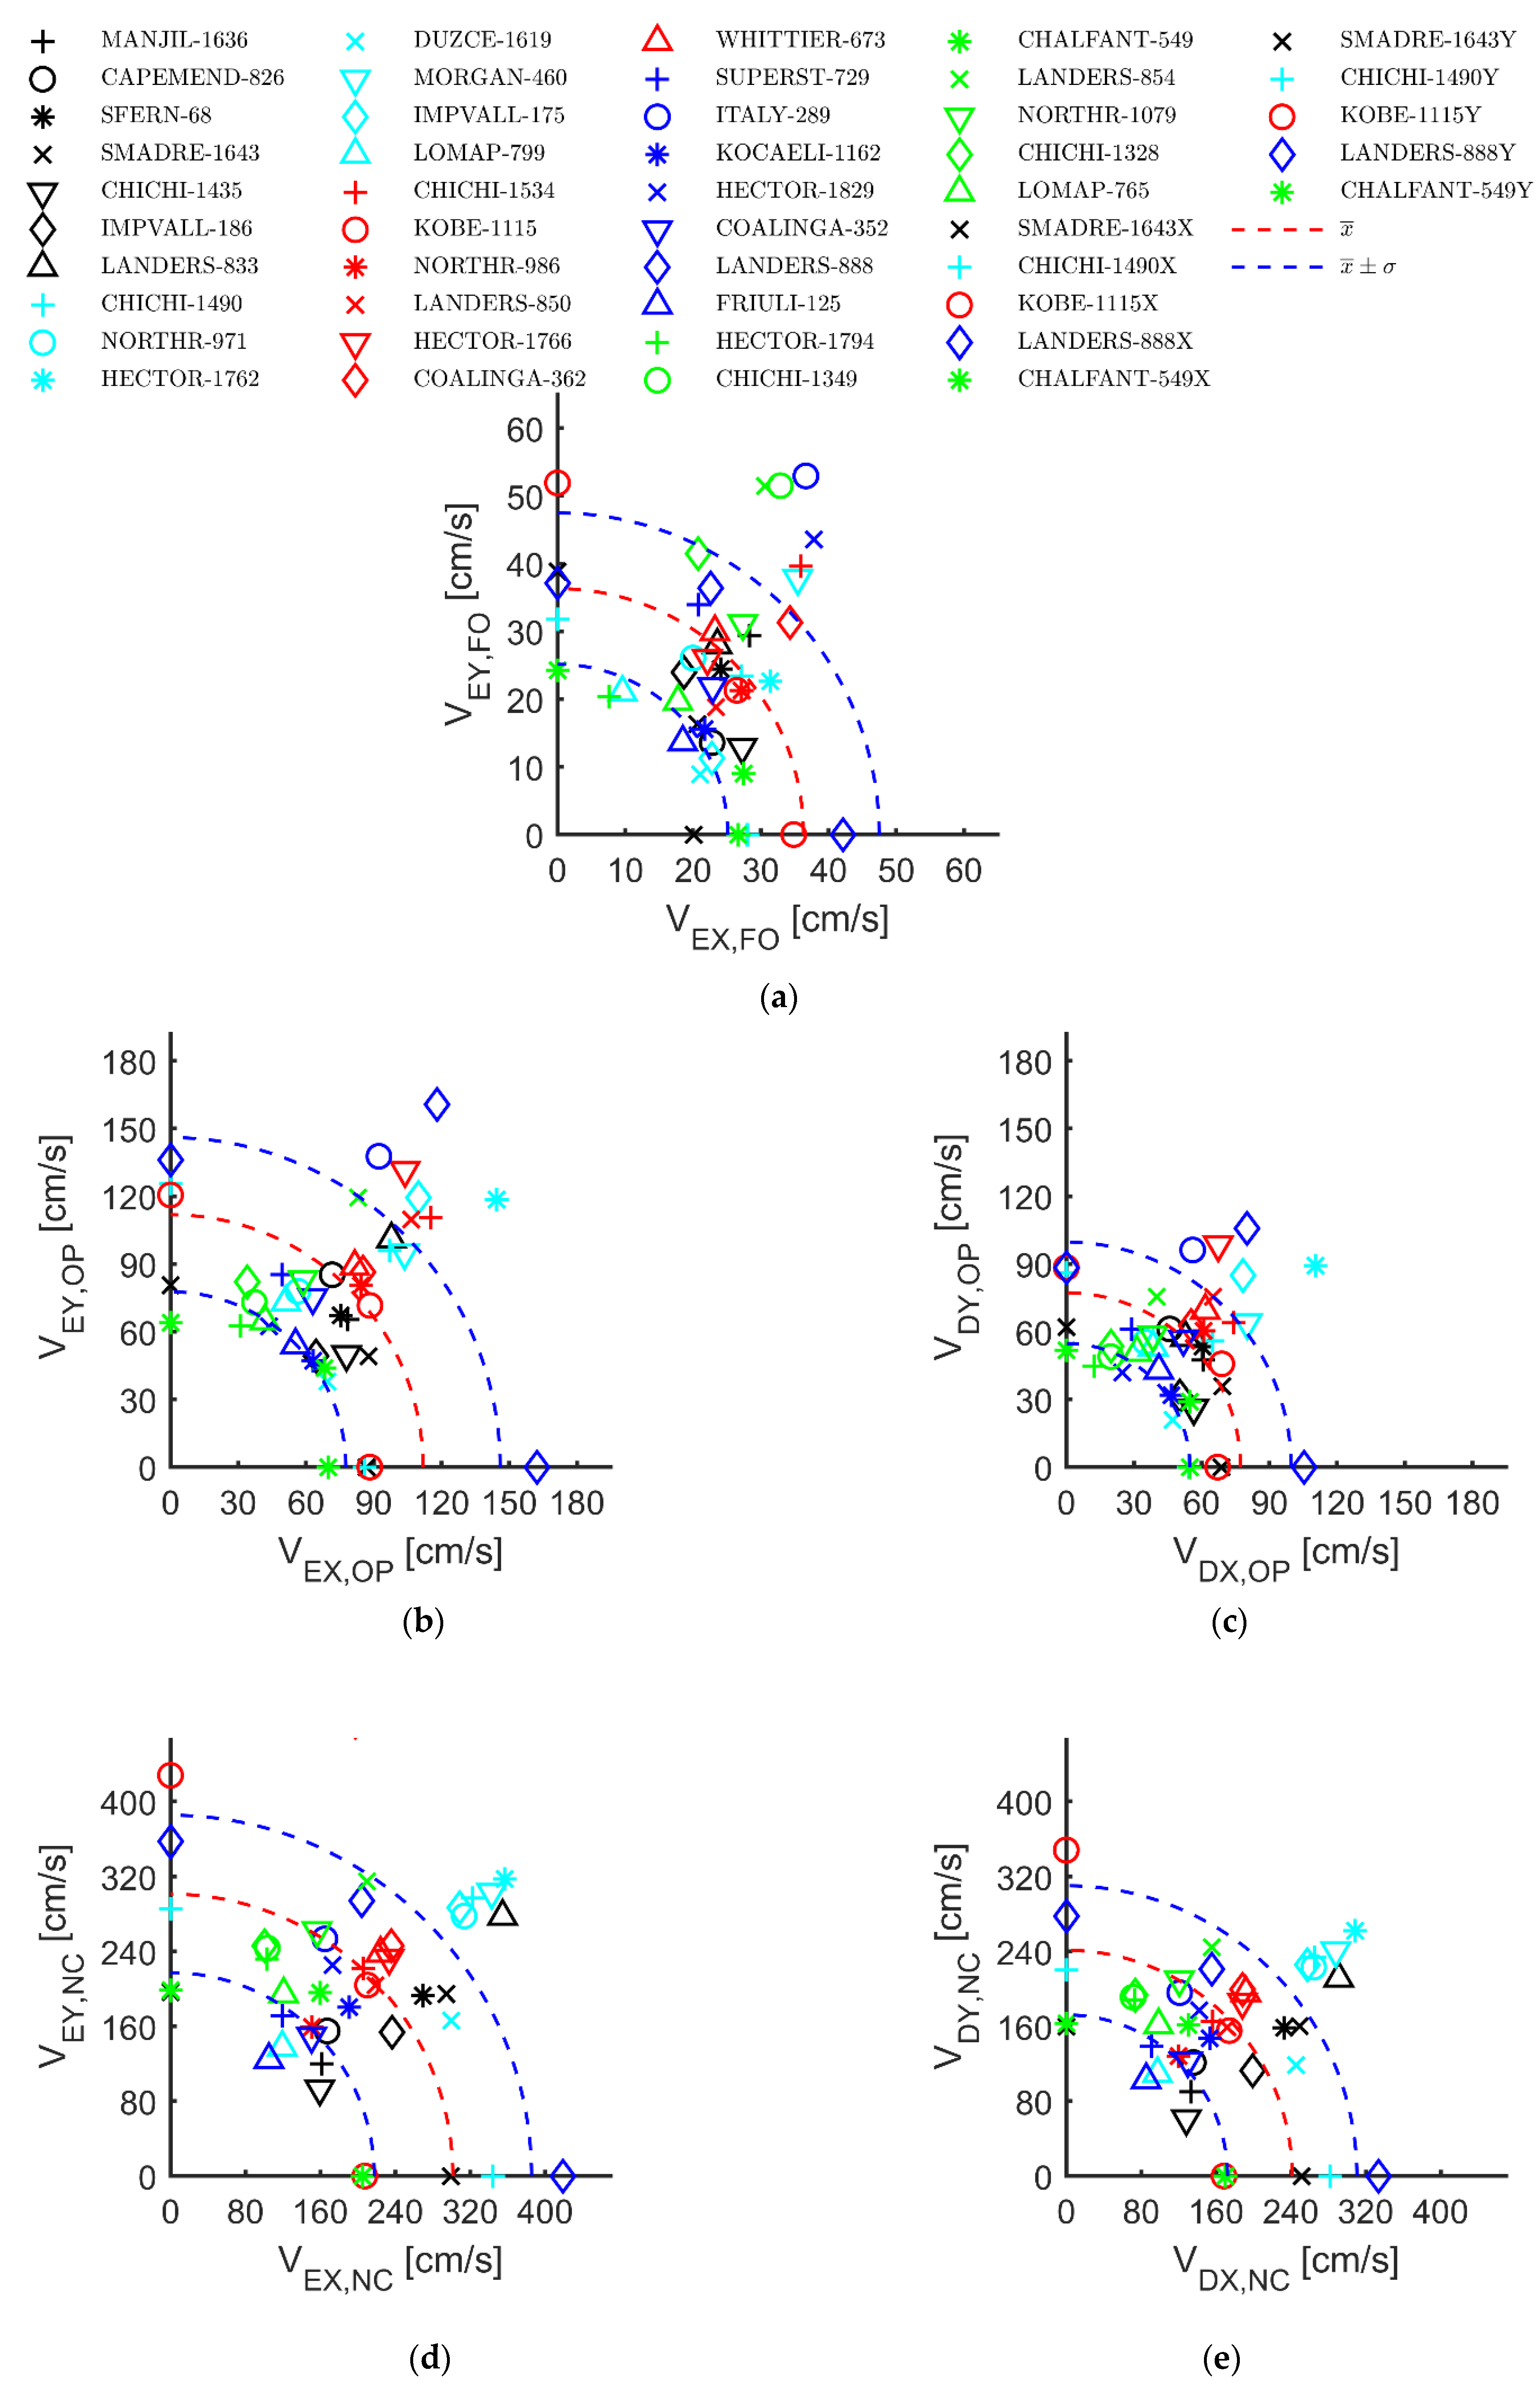
  • The total input energy or the total hysteretic energy—expressed in the form of equivalent velocities VE or VD—required to attain SPLs FO, OP, and NC remains basically constant, irrespective of the ground motion considered when the two horizontal components of the ground motion are simultaneously applied.
  • The VE that the structure can endure until SPL NC was, on average, about three times the value obtained SPL OP, and eight times the value for OP and FO. Meanwhile, the VD when the structure reaches SPL NC was, on average, about three times that obtained for SPL OP.
  • Past studies on conventional structures pointed out that torsion effects tend to redistribute the damage in the structure, which in terms of energy means to balance the energy input by the X and Y components of the ground motion. This was not found for the structure under study, most probably due to the fact that the dampers controlled the torsional movements.
  • The capacity of the structure under bidirectional loadings is in most cases slightly higher than under unidirectional loadings. Nevertheless, for some ground motions the response is opposite.
  • The values of VE and VD estimated from the energies obtained independently for the X and Y components of the ground motion (unidirectional analysis) are always larger than the actual value obtained applying the two components simultaneously (bidirectional analysis). The values are 18% larger for SPL OP and 27% larger for SPL NC.
  • The relationship VD/VE obtained for SPL OP (0.70 with COV = 0.09) was very similar to that predicted with Akiyama’s Equation (2) (0.74). Nevertheless, for SPL NC, the value obtained (0.80) was markedly higher than that provided by Akiyama’s equation (0.61).
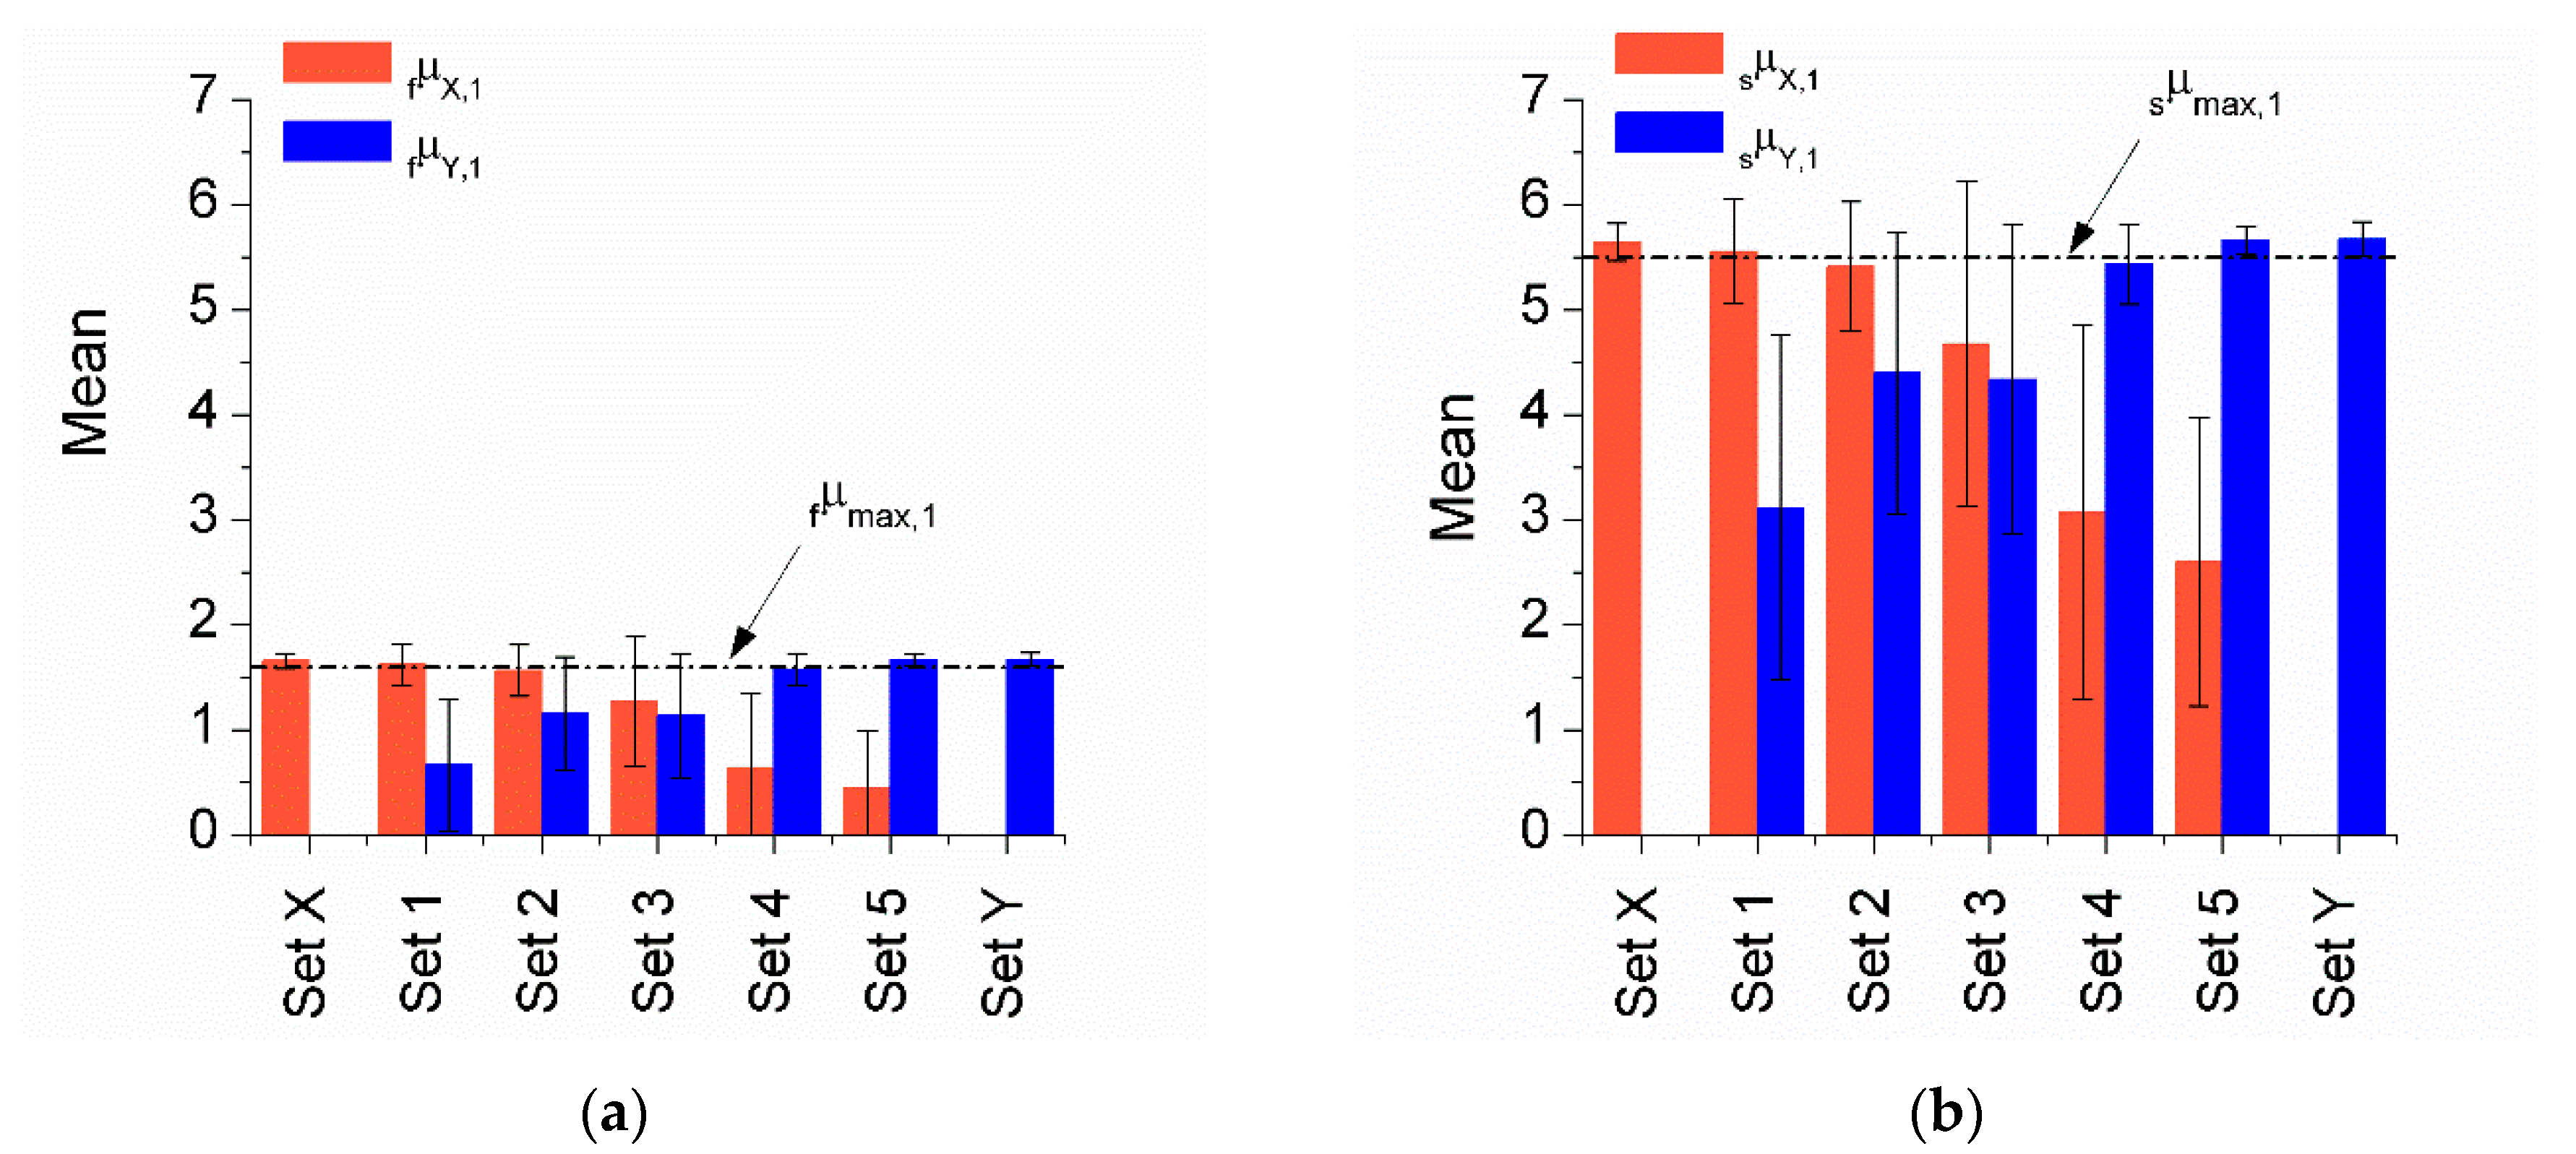
  • The maximum ductility level, estimated through the maximum apparent plastic deformation, was 1.6 in the WFP system and 5.5 in SPDs.
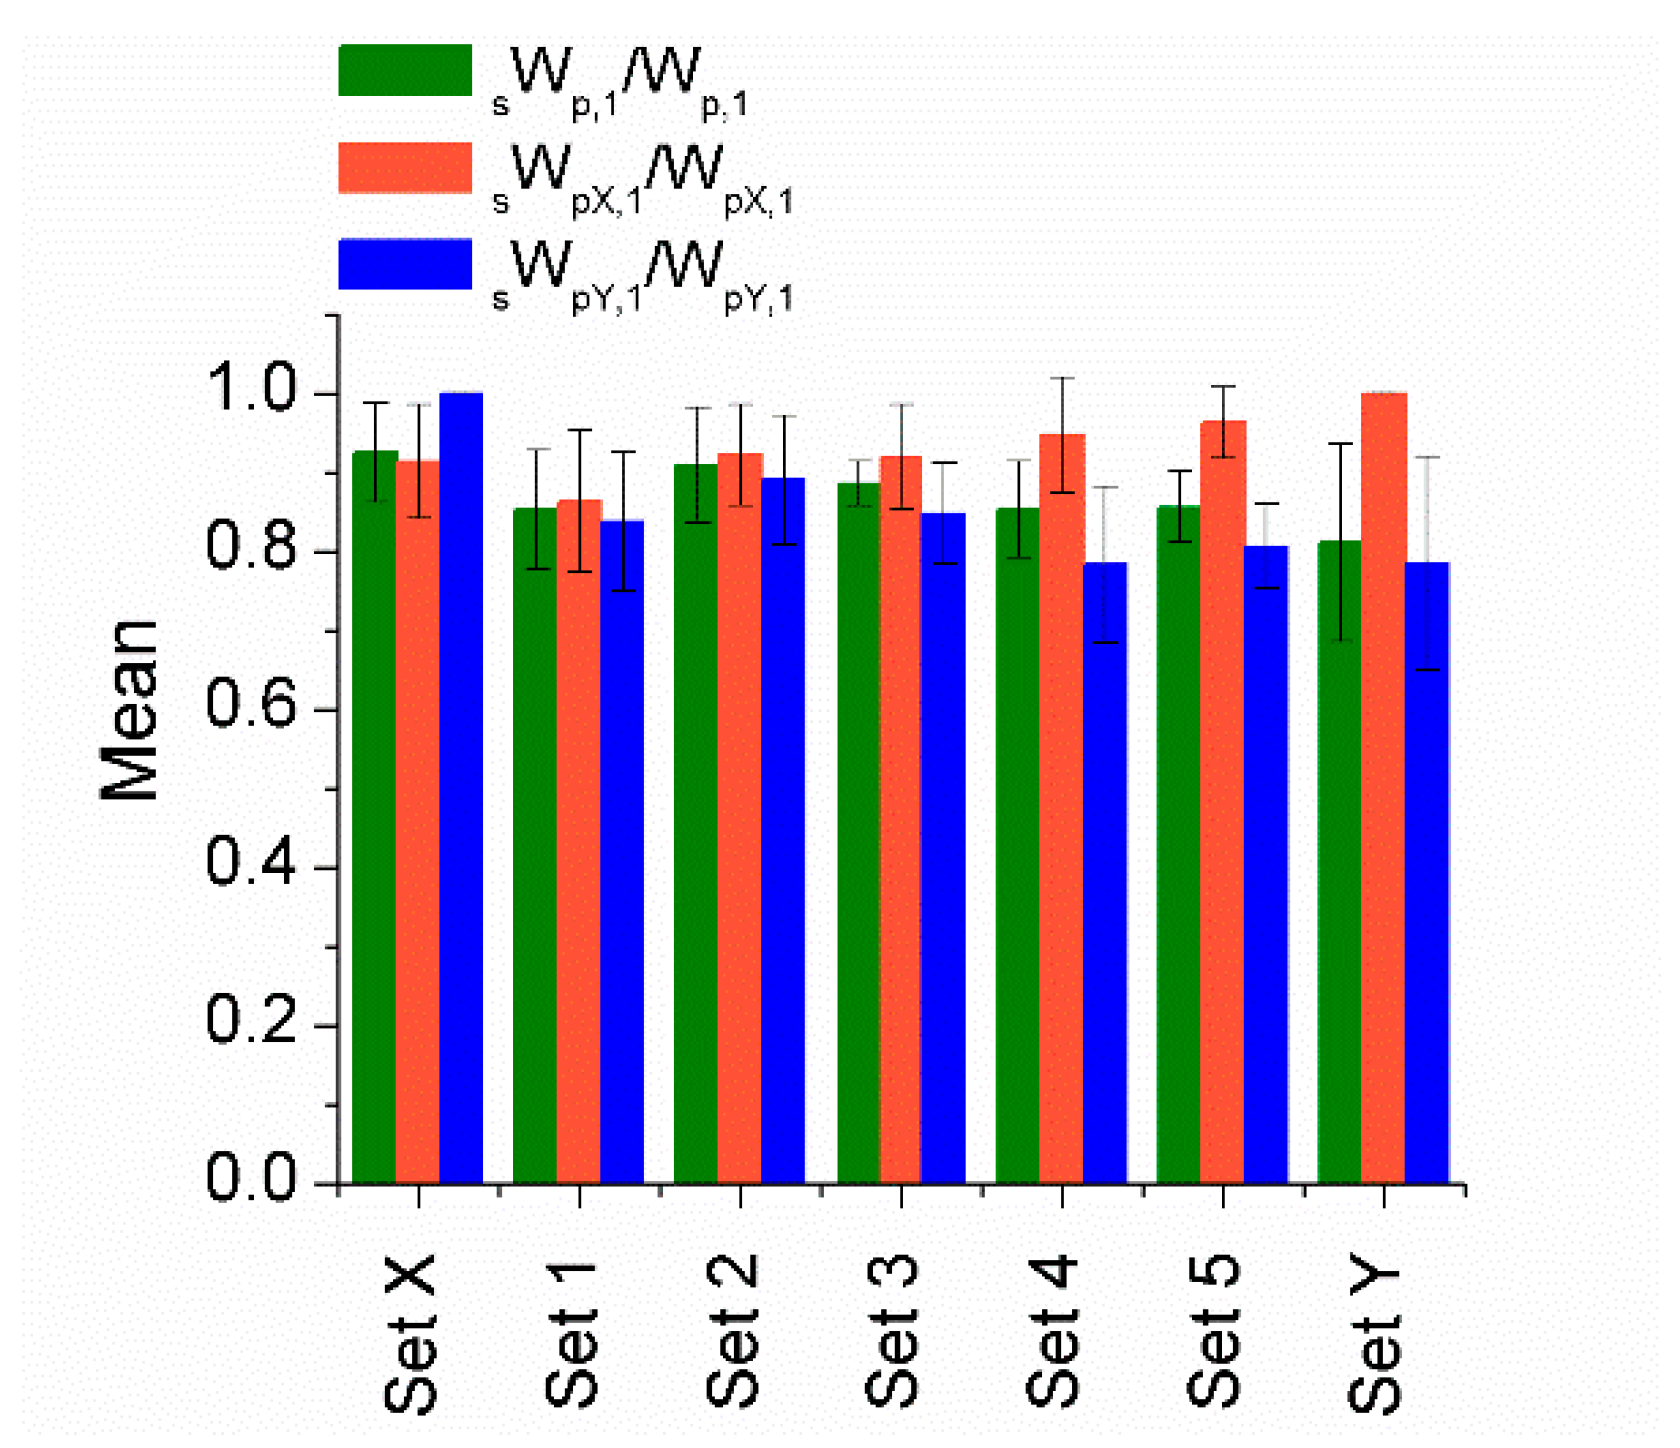
  • Most of the energy (80%) input and dissipated by the structure was absorbed by the dampers.
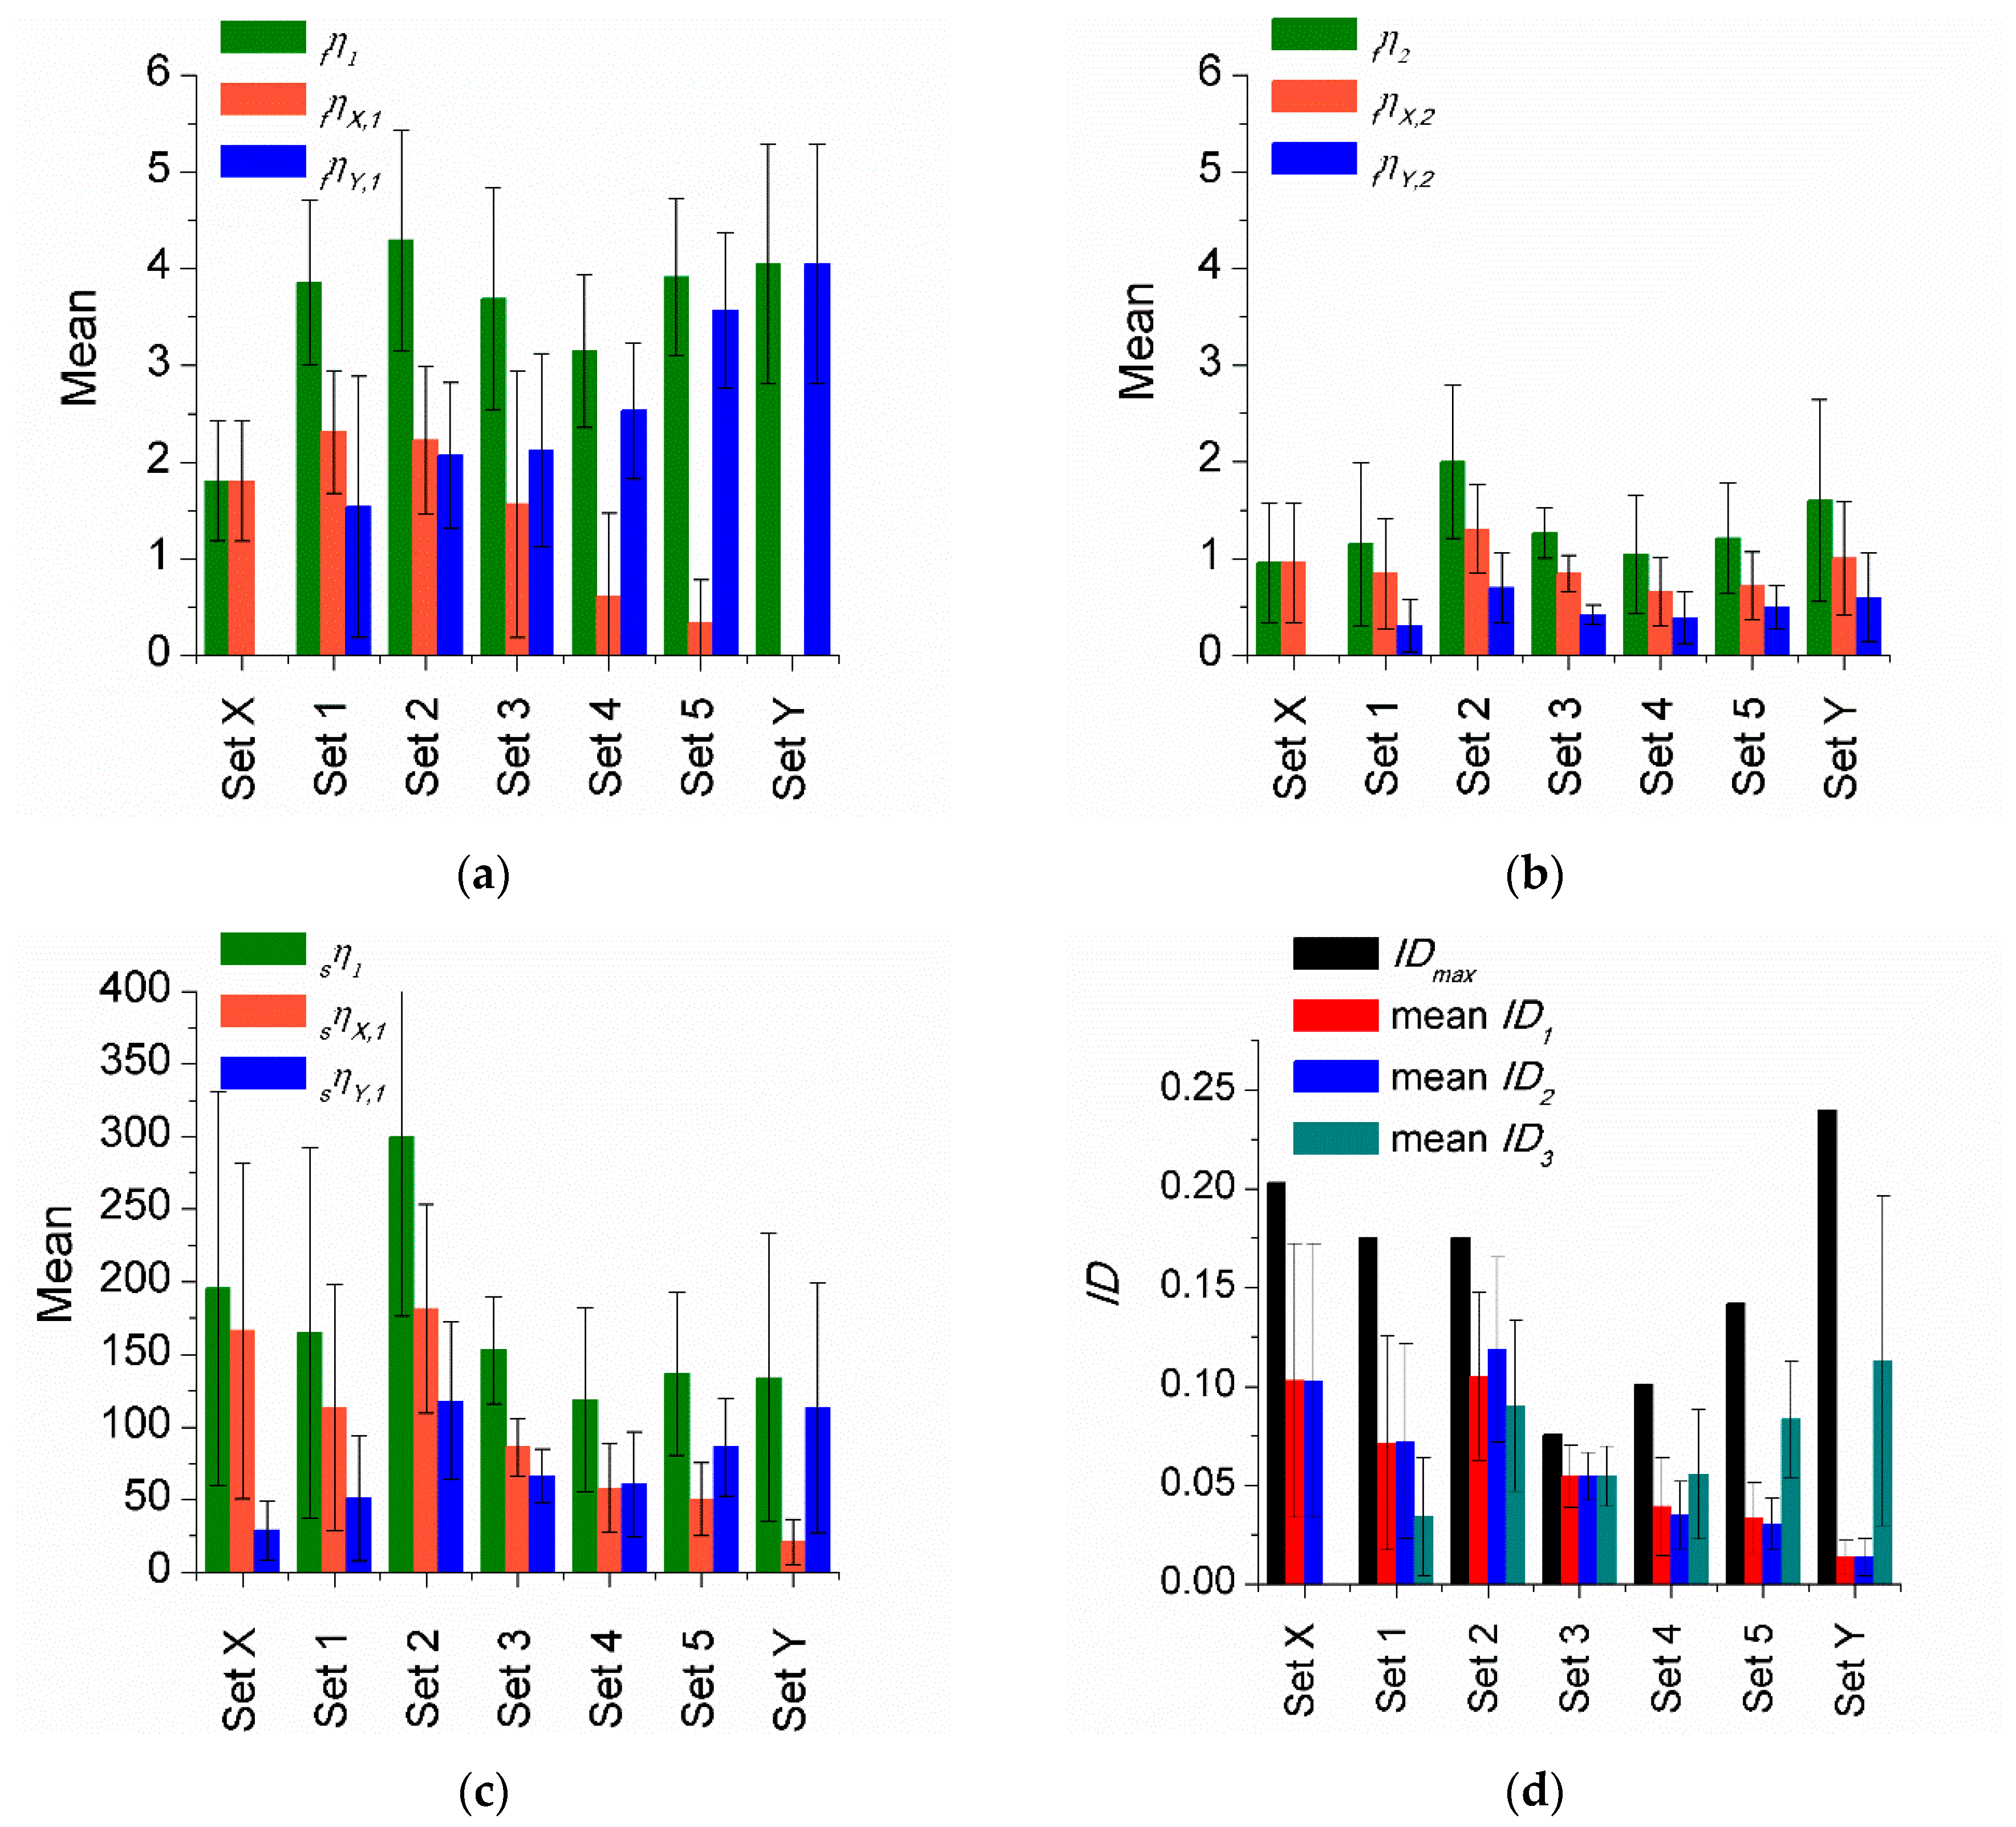
  • The equivalent number of cycles obtained for the flexible and stiff parts would rely on the characteristics of the main structure and the layout of dampers in X and Y directions. The average and minimum values obtained are fneq,1 = 2 and fneq,min1 = 1.20, respectively, for the flexible part; sneq,1 ranged between 15 and 24, with a minimum value of sneq,min1 = 6.36. The values found here are in accordance with those proposed by Akiyama [15].
Finally, it is important to note that the results shown in this study have been obtained from the analysis of a portion of a structure. Therefore, further research will be required to apply them to a whole structure.

Author Contributions

Conceptualization, J.D.-Á. and D.G.-L.; methodology, J.D.-Á. and D.G.-L.; software, D.G.-L.; validation, D.G.-L.; formal analysis, J.D.-Á. and D.G.-L.; investigation, J.D.-Á. and D.G.-L.; data curation, J.D.-Á.; writing—original draft preparation, J.D.-Á.; writing—review and editing, J.D.-Á. and D.G.-L. All authors have read and agreed to the published version of the manuscript.

Funding

This research was funded by Spanish Ministry of Economy and Competitivity, research project reference MEC BIA2017 88814 R and received funds from the European Union (Fonds Européen de Dévelopment Régional). The mobility of the first author was funded by the National Program of Promoting the Talent and its Uses in I+D+i, Modality B: Research stays and mobility abroad José Castillejo-2018.

Acknowledgments

The authors gratefully acknowledge professors Fabrizio Mollaioli and Andrea Lucchini from the La Sapienza University that during the research stay of J.D.-A. (first author) in 2018 provided the ground motion records database used in this study.

Conflicts of Interest

The authors declare no conflict of interest.

Appendix A

Table A1. Properties of the Set 1 ground motion records.
Earthquake
Name
YearSta. Name (Record Seq. No.)MwSF70PGAX
(g)
PGAY
(g)
VEX
(cm/s)
VEY
(cm/s)
θ
(°)
Manjil (Irán)1990Qazvin (1636)7.371.050.180.1357.9432.8429.54
Cape Mendocino (USA)1992Eur.Myrtle&West (826)7.011.070.150.1857.1532.4129.56
San Fernando (USA)1971Hollywood Stor FF (68)6.611.120.210.1752.6333.5732.53
Sierra Madre (USA)1991LA-City Terrace (1643)5.611.700.110.0935.2421.3731.23
Chi-Chi (Taiwan)1999TAP051 (1435)7.621.740.110.0635.0819.8929.55
Imperial Valley (USA)1979Niland Fire Sta. (186)6.531.770.110.0733.2921.1932.48
Landers (USA)1992Anaheim-WB Rd (833)7.282.690.050.0422.0813.7631.94
Table A2. Properties of the Set 2 ground motion records.
Earthquake
Name
YearSta. Name (Record Seq. No.)MwSF70PGAX
(g)
PGAY
(g)
VEX
(cm/s)
VEY
(cm/s)
θ
(°)
Chi-Chi (Taiwan)1999TCU050 (1490)7.621.000.150.1353.3945.7840.62
Northridge (USA)1994Elizabeth Lake (971)6.690.980.150.1157.7641.9736.00
Hector Mine (USA)1999Amboy (1762)7.130.950.180.1559.3843.3736.15
Duzce (Turkey)1999Mudumu (1619)7.141.060.120.0653.8538.4035.50
Morgan Hill (USA)1984Gilroy Array 7 (460)6.190.890.190.1160.1150.9440.28
Imperial Valley (USA)1979EL Centro 12 (175)6.531.180.140.1246.2537.2338.83
Loma Prieta (USA)1989Intern. Airport (799)6.930.590.240.3391.3477.2840.24
Table A3. Properties of the Set 3 ground motion records.
Earthquake
Name
YearSta. Name (Record Seq. No.)MwSF70PGAX
(g)
PGAY
(g)
VEX
(cm/s)
VEY
(cm/s)
θ
(°)
Chi-Chi (Taiwan)1999TCU107 (1534)7.621.010.120.1645.0053.0549.69
Kobe (Japan)1995Sakai (1115)6.900.990.160.1250.1350.1345.00
Northridge (USA)1994Brentwood-VAHosp. (986)6.691.030.190.1643.7951.5849.67
Landers (USA)1992Desert Hot Springs (850)7.280.940.170.1551.9153.7846.02
Hector Mine (USA)1999Baker Fire Sta. (1766)7.131.250.130.0936.3242.6049.55
Coalinga (USA)1983Parkfield VinC2W (362)6.361.590.070.0827.5334.4451.37
Whittier Narrows (USA)1987Panorama City-Roscoe (673)5.991.650.100.1129.5130.6146.04
Table A4. Properties of the Set 4 ground motion records.
Earthquake
Name
YearSta. Name (Record Seq. No.)MwSF70PGAX
(g)
PGAY
(g)
VEX
(cm/s)
VEY
(cm/s)
θ
(°)
Superstition Hills (USA)1987Wild Life Liq. Ar (729)6.540.840.180.2143.3471.5658.80
Irpinia (Italy)1980Calitri (289)6.900.820.130.1844.9572.4658.18
Kocaeli (Turkey)1999Goynuk (1162)7.511.260.130.1234.0344.1952.40
Hector Mine (USA)1999San Bernardino – Mont.M (1829)7.131.280.090.1329.2546.3957.77
Coalinga (USA)1983Parkfield – Gold Hill 3W (352)6.361.550.140.1224.0338.4057.96
Landers (USA)1992San Bernardino – E&Hosp. (888)7.281.480.080.0927.3638.4954.59
Friuli (Italy)1976Tolmezzo (125)6.500.560.350.3164.73107.6058.97
Table A5. Properties of the Set 5 ground motion records.
Earthquake
Name
YearSta. Name (Record Seq. No.) MwSF70PGAX
(g)
PGAY
(g)
VEX
(cm/s)
VEY
(cm/s)
θ
(°)
Hector Mine (USA)1999Joshua Tree (1794)7.130.790.150.1936.7880.5265.45
Chi-Chi (Taiwan)1999ILA066 (1349)7.621.280.080.1019.9251.1268.71
Chalfant Valley (USA)1986Bishop – LADWP (549)6.190.750.250.1733.9786.8068.62
Landers (USA)1992Featherly Park –Maint (854)7.281.680.050.0518.7237.1863.28
Northridge (USA)1994Seal Beach – Off Bldg. (1079)6.691.840.060.0817.1633.9963.21
Chi-Chi (Taiwan)1999ILA036 (1328)7.622.540.060.079.8225.7569.12
Loma Prieta (USA)1989Gilroy Array 1 (765)6.930.360.410.4779.93179.1665.96

References

  1. Ministerio Fomento. Norma de Construcción Sismorresistente. Parte General y Edificación (NCSE-02); Centro Publicaciones. Secretaria General Técnica; Ministerio Fomento: Madrid, España, 2003.
  2. European Committee for Standardization. European Standard EN 1998-1:2004 Eurocode 8: Design of Structures for Earthquake Resistance; European Committee for Standardization: Brussels, Belgium, 2005. [Google Scholar]
  3. ACI Committee 318. Building Code Requirements for Structural Concrete (ACI 318M-14) and Commentary (ACI 318RM-14); American Concrete Institute: Farmington Hills, MI, USA, 2014; ISBN 978-0-87031-964-8. [Google Scholar]
  4. Fardis, M. Seismic Design, Assessment and Retrofitting of Concrete Buildings: Based on EN-Eurocode 8; Springer: Heidelberg, Germany, 2009; Volume 8, ISBN 9781402098413. [Google Scholar]
  5. Rodriguez, M.; Meli, R. Seismic Load Tests on two-story Waffle-Flat Plate Structures. J. Struct. Eng. 1995, 121, 1287–1293. [Google Scholar] [CrossRef]
  6. Benavent-Climent, A.; Donaire-Avila, J.; Oliver-Saiz, E. Shaking table tests of a reinforced concrete waffle-flat plate structure designed following modern codes: Seismic performance and damage evaluation. Earthq. Eng. Struct. Dyn. 2016, 45, 315–336. [Google Scholar] [CrossRef]
  7. Benavent-Climent, A.; Galé-Lamuela, D.; Donaire-Avila, J. Energy capacity and seismic performance of RC waffle-flat plate structures under two components of far-field ground motions: Shake table tests. Earthq. Eng. Struct. Dyn. 2019, 48, 949–969. [Google Scholar] [CrossRef]
  8. Symans, M.D.; Charney, F.A.; Whittaker, A.S.; Constantinou, M.C.; Kircher, C.A.; Johnson, M.W.; Mcnamara, R.J. Energy Dissipation Systems for Seismic Applications: Current Practice and Recent Developments. J. Struct. Eng. 2008, 134, 3–21. [Google Scholar] [CrossRef] [Green Version]
  9. Oviedo, A.; Midorikawa, M.; Asari, T. Earthquake response of ten-story story-drift-controlled reinforced concrete frames with hysteretic dampers. Eng. Struct. 2010, 32, 1735–1746. [Google Scholar] [CrossRef]
  10. Kasai, K.; Nakai, M.; Nakamura, Y.; Asai, H.; Suzuki, Y.; Ishii, M. Building Passive Control in Japan. J. Disaster Res. 2009, 4, 261–269. [Google Scholar] [CrossRef]
  11. Providakis, C.P. Effect of LRB isolators and supplemental viscous dampers on seismic isolated buildings under near-fault excitations. Eng. Struct. 2008, 30, 1187–1198. [Google Scholar] [CrossRef]
  12. Tributsch, A.; Adam, C. Evaluation and analytical approximation of Tuned Mass Damper performance in an earthquake environment. Smart Struct. Syst. 2012, 10, 155–179. [Google Scholar] [CrossRef]
  13. Anajafi, H.; Medina, R.A. Partial mass isolation system for seismic vibration control of buildings. Struct. Control Health Monit. 2018, 25, 1–16. [Google Scholar] [CrossRef]
  14. Connor, J.J. Introduction to Structural Motion Control; Prentice Hall: Upper Saddle River, NJ, USA, 2003. [Google Scholar]
  15. Akiyama, H. Earthquake Resistant Limit-State Design for Buildings (English Version); University of Tokyo Press: Tokyo, Japan, 1985. [Google Scholar]
  16. Benavent-Climent, A. An energy-based method for seismic retrofit of existing frames using hysteretic dampers. Soil Dyn. Earthq. Eng. 2011, 31, 1385–1396. [Google Scholar] [CrossRef]
  17. Donaire-Ávila, J.; Benavent-Climent, A. Optimum strength distribution for structures with metallic dampers subjected to seismic loading. Metals (Basel) 2020, 10, 127. [Google Scholar] [CrossRef] [Green Version]
  18. Building Research Institute. The Building Standard Law of Japan; The Building Center of Japan: Tokyo, Japan, 2009. [Google Scholar]
  19. Benavent-Climent, A.; Donaire-Avila, J.; Oliver-Sáiz, E. Seismic performance and damage evaluation of a waffle-flat plate structure with hysteretic dampers through shake-table tests. Earthq. Eng. Struct. Dyn. 2018, 47, 1250–1269. [Google Scholar] [CrossRef]
  20. Donaire-Ávila, J. Proyecto Sismorresistente de Estructuras con Forjado Reticular y Disipadores Histeréticos Basado en el Balance de Energia. Ph.D. Thesis, University of Granada, Granada, Spain, 2013. [Google Scholar]
  21. Feng, M.Q.; Chai, W. Design of a mega-sub-controlled building system under stochastic wind loads. Probabilistic Eng. Mech. 1997, 12, 149–162. [Google Scholar] [CrossRef] [Green Version]
  22. Anajafi, H.; Medina, R.A. Comparison of the seismic performance of a partial mass isolation technique with conventional TMD and base-isolation systems under broad-band and narrow-band excitations. Eng. Struct. 2018, 158, 110–123. [Google Scholar] [CrossRef]
  23. Fardis, M.N. From force- to displacement-based seismic design of concrete structures and beyond. In Proceedings of the 16 European Coinference on Earthquake Engineering, Thessaloniki, Greece, 18–21 June 2018; pp. 1–20. [Google Scholar]
  24. Mckenna, F.T. Object-Oriented Finite Element Programming: Frameworks for Analysis, Algorithms and Parallel Computing. Ph.D. Thesis, University of California, Berkeley, CA, USA, 1997. [Google Scholar]
  25. Mohd, Y.M. Nonlinear Analysis of Prestressed Concrete Structures under Monotonic and Cyclic Loads. Ph.D. Thesis, University of California, Berkeley, CA, USA, 1994. [Google Scholar]
  26. Maekawa, K.; Pimanmas, A.; Okamura, H. Non Linear Mechanics of Reinforced Concrete; Spon Press: New York, NY, USA, 2003. [Google Scholar]
  27. Rodrigues, H.; Furtado, A.; Arêde, A. Behavior of Rectangular Reinforced-Concrete Columns under Biaxial Cyclic Loading and Variable Axial Loads. J. Struct. Eng. (United States) 2016, 142, 1–8. [Google Scholar] [CrossRef]
  28. Rodrigues, H.; Varum, H.; Arêde, A.; Costa, A.G. Behaviour of reinforced concrete column under biaxial cyclic loading—State of the art. Int. J. Adv. Struct. Eng. 2013, 5, 1–12. [Google Scholar] [CrossRef] [Green Version]
  29. Valipour, H.R.; Foster, S.J. Nonlinear reinforced concrete frame element with torsion. Eng. Struct. 2010, 32, 988–1002. [Google Scholar] [CrossRef]
  30. Charney, F.A. Unintended Consequences of Modeling Damping in Structures. J. Struct. Eng. 2008, 134, 581–592. [Google Scholar] [CrossRef]
  31. Jehel, P.; Léger, P.; Ibrahimbegovic, A. Initial versus tangent stiffness-based Rayleigh damping in inelastic time history seismic analyses. Earthq. Eng. Struct. Dyn. 2014, 43, 467–484. [Google Scholar] [CrossRef] [Green Version]
  32. Anajafi, H.; Medina, R.A.; Santini-Bell, E. Effects of the improper modeling of viscous damping on the first-mode and higher-mode dominated responses of base-isolated buildings. Earthq. Eng. Struct. Dyn. 2020, 49, 51–73. [Google Scholar] [CrossRef]
  33. Chopra, A.K.; Mckenna, F. Modeling viscous damping in nonlinear response history analysis of buildings for earthquake excitation. Earthq. Eng. Struct. Dyn. 2016, 45, 193–211. [Google Scholar] [CrossRef]
  34. Abarkane, C.; Galé-Lamuela, D.; Benavent-Climent, A.; Suárez, E.; Gallego, A. Ultrasonic pulse-echo signal analysis for damage evaluation of metallic slit-plate hysteretic dampers. Metals (Basel) 2017, 7, 526. [Google Scholar] [CrossRef] [Green Version]
  35. ASCE/SEI 41-13. Seismic Evaluation and Retrofit of Existing Buildings; American Society of Civil Engineers: Reston, VA, USA, 2014; ISBN 9780784412855. [Google Scholar]
  36. Lucchini, A.; Franchin, P.; Mollaioli, F. Uniform hazard floor acceleration spectra for linear structures. Earthq. Eng. Struct. Dyn. 2017, 46, 1121–1140. [Google Scholar] [CrossRef]
  37. Marušić, D.; Fajfar, P. On the inelastic seismic response of asymmetric buildings under bi-axial excitation. Earthq. Eng. Struct. Dyn. 2005, 34, 943–963. [Google Scholar] [CrossRef]
  38. De Stefano, M.; Faella, G. An evaluation of the inelastic response of systems under biaxial seismic excitations. Eng. Struct. 1996, 18, 724–731. [Google Scholar] [CrossRef]
  39. Rodrigues, H.; Arêde, A.; Varum, H.; Costa, A. Damage evolution in reinforced concrete columns subjected to biaxial loading. Bull. Earthq. Eng. 2013, 11, 1517–1540. [Google Scholar] [CrossRef]
  40. Benavent-Climent, A. An energy-based damage model for seismic response of steel structures. Earthq. Eng. Struct. Dyn. 2007, 36, 1049–1064. [Google Scholar] [CrossRef]
  41. Abarkane, C.; Ríos-García, G.; Gale-Lamuela, D.; Rescalvo, F.; Gallego, A.; Benavent-Climent, A. Metallic slit-plate dampers: Damage evaluation with metal magnetic memory technique and application to structures with rocking columns. Metals (Basel) 2019, 9, 953. [Google Scholar] [CrossRef] [Green Version]
  42. Abarkane, C.; Galé-Lamuela, D.; Benavent-Climent, A.; Rescalvo, F.J.; Gallego, A. Diagnosis of hysteretic dampers used for seismic protection of structures by means ultrasonic measurements. Meas. J. Int. Meas. Confed. 2019, 137, 344–354. [Google Scholar] [CrossRef]
  43. Manfredi, G.; Polese, M.; Cosenza, E. Cumulative demand of the earthquake ground motions in the near source. Earthq. Eng. Struct. Dyn. 2003, 32, 1853–1865. [Google Scholar] [CrossRef]
Figure 1. Geometry and reinforcement of the structural members of the specimen.
Applsci 10 03133 g001
Figure 2. Solid zone discretization in interior and exterior column-slab connections.
Applsci 10 03133 g002
Figure 3. Overview of the numerical model.
Applsci 10 03133 g003
Figure 4. Top displacement history: (a) for the successive simulations in X and Y directions; (b) for C100 in X direction; (c) for C100 in Y direction.
Applsci 10 03133 g004
Figure 5. Input energy history.
Applsci 10 03133 g005
Figure 6. Slit-plate dampers: (a) dimensions (in mm); (b) deformed shape.
Applsci 10 03133 g006
Figure 7. Force displacement curves obtained from the test and the calibrated model.
Applsci 10 03133 g007
Figure 8. Layout of dampers at the first story: (a) elevation of the installation scheme of damper 3; (b) plan view; (c) elevation of the installation scheme of dampers 1 and 2.
Applsci 10 03133 g008
Figure 9. Mass-damping model defined for waffle-flat-plate (WFP) system with and without dampers.
Applsci 10 03133 g009
Figure 10. Energy capacity of the structure: input energy for seismic performance levels (SPL) FO (a), SPL OP (b) and SPL NC (d); hysteretic energy for SPL OP(c) and SPL NC (e).
Applsci 10 03133 g010
Figure 11. Mean and error bars of θ V E for the different SPLs.
Applsci 10 03133 g011
Figure 12. Mean and error bars for fμ along X and Y directions: (a) main structure; (b) hysteretic dampers.
Applsci 10 03133 g012
Figure 13. Ratio of the dissipated energy in the hysteretic dampers with respect to the total value at the first story, overall ( W s p , 1 / W p , 1 ), and by components ( W s p X , 1 / W p X , 1 and W s p Y , 1 / W p Y , 1 ).
Applsci 10 03133 g013
Figure 14. Dimensionless representation of the damage: for WFP system at the first story (a) and at second story (b); for hysteretic dampers, damage level, (c) and damage index (d).
Applsci 10 03133 g014
Figure 15. Equivalent number of cycles obtained in the analyses at the first story for WFP system (a) and for hysteretic dampers (b).
Applsci 10 03133 g015
Table 1. Parameters of the constitutive model of a slit-plate damper (SPD) calibrated with an experimental test.
Uniaxial
Material
sNy
[kN]
sk
[kN/mm]
bR0cR1cR2a1a2a3a4sigInit
Steel02161000.00522.00.9250.150.131.00.131.00.0
Table 2. Analysis of the input energy obtained from non-linear time history analyses (NLTHAs).
Setmean VE,FO
(cm/s)
COV VE,FOmean VE,OP
(cm/s)
COV VE,OPmean VE,NC
(cm/s)
COV VE,NCmean
V E , O P V E , F O
COV
V E , O P V E , F O
mean
V E , N C V E , F O
COV
V E , N C V E , F O
X30.360.2598.580.33294.890.283.280.2110.150.31
132.150.15104.140.17289.980.303.290.189.190.31
232.940.29127.210.29391.200.244.000.2912.230.23
338.640.20136.040.16301.720.123.640.248.040.19
440.870.35113.430.40255.920.242.920.326.690.26
540.850.3692.300.26278.610.162.440.247.550.30
Y36.770.25105.360.27293.240.312.930.258.020.19
All records36.310.31111.810.31301.390.283.220.308.820.33
Table 3. Analysis of the energy that contributes to damage obtained from NLTHAs.
Setmean VD,OP
(cm/s)
COV VD,OPmean
V D , O P V E , O P
COV
V D , O P V E , O P
mean VD,NC
(cm/s)
COV VD,NCmean
V D , N C V E , N C
COV
V D , N C V E , N C
mean
V D , N C V D , O P
COV
V D , N C V D , O P
X70.040.270.720.09241.060.270.820.023.530.26
173.080.110.710.11235.980.310.810.033.220.28
289.770.330.700.06320.270.250.820.023.770.29
394.530.130.700.07240.510.130.800.032.570.16
478.980.370.700.07202.710.210.800.042.800.33
561.920.190.680.09220.270.150.790.033.600.10
Y67.360.180.660.11223.430.310.760.043.270.18
All records77.220.290.700.09241.350.290.800.043.240.28
Table 4. Comparison between the seismic capacity under uniaxial and bidirectional loadings.
Rec. Name
No.
V E X , O P u n i V E , O P V E Y , O P u n i V E , O P V E , O P * V E , O P V E X , N C u n i V E , N C V E Y , N C u n i V E , N C V E , N C * V E , N C V D X , O P u n i V D , O P V D Y , O P u n i V D , O P V D , O P * V D , O P V D X , N C u n i V D , N C V D Y , N C u n i V D , N C V D , N C * V D , N C
SMADRE 16430.860.801.180.850.561.020.880.801.190.850.541.01
CHICHI 14900.630.921.120.780.651.020.631.001.190.800.621.01
KOBE 11150.781.061.310.711.461.620.811.071.340.721.491.66
LANDERS 8880.810.681.061.171.001.540.790.671.041.231.031.61
CHALFANT 5490.860.791.170.810.781.130.880.841.220.820.791.13
mean0.790.851.170.860.891.260.800.701.190.880.781.28
COV0.100.140.070.170.330.190.100.170.070.190.360.21

