Article

Novel Utility-Scale Photovoltaic Plant Electroluminescence Maintenance Technique by Means of Bidirectional Power Inverter Controller

by
Javier Ballestín-Fuertes
1,
Jesús Muñoz-Cruzado-Alba
1,
José F. Sanz-Osorio
2,
Luis Hernández-Callejo
3,*,
Victor Alonso-Gómez
3,
José Ignacio Morales-Aragones
3,
Sara Gallardo-Saavedra
3,
Oscar Martínez-Sacristan
4 and
Ángel Moretón-Fernández
4
1
Fundación CIRCE, Parque Empresarial Dinamiza, Avenida Ranillas Edificio 3D, 1ª Planta, 50018 Zaragoza, Spain
2
Instituto Universitario de Investigación CIRCE (Universidad de Zaragoza—Fundación CIRCE), Edificio CIRCE, Campus Rio Ebro, C/Mariano Esquillor Gómez, 15, 50018 Zaragoza, Spain
3
Campus Universitario Duques de Soria, Universidad de Valladolid, 42004 Soria, Spain
4
Campus Miguel Delibes, Universidad de Valladolid, 47011 Valladolid, Spain
*
Author to whom correspondence should be addressed.
Appl. Sci. 2020, 10(9), 3084; https://doi.org/10.3390/app10093084
Submission received: 20 March 2020 / Revised: 22 April 2020 / Accepted: 24 April 2020 / Published: 28 April 2020
(This article belongs to the Special Issue Next Generation Solar Cells, Modules and Applications)

Abstract

:

Featured Application

The paper proposes a new utility-scale photovoltaic plant maintenance method to evaluate the degradation of photovoltaic panels. The method takes advantage of the installed power inverters and combiner boxes of the solar photovoltaic plant to use them as a way of energising the panels as light emitters, in order to look for defects in them without the need of an expensive uninstalling and reinstalling process.

Abstract

Nowadays, photovoltaic (PV) silicon plants dominate the growth in renewable energies generation. Utility-scale photovoltaic plants (USPVPs) have increased exponentially in size and power in the last decade and, therefore, it is crucial to develop optimum maintenance techniques. One of the most promising maintenance techniques is the study of electroluminescence (EL) images as a complement of infrared thermography (IRT) analysis. However, its high cost has prevented its use regularly up to date. This paper proposes a maintenance methodology to perform on-site EL inspections as efficiently as possible. First, current USPVP characteristics and the requirements to apply EL on them are studied. Next, an increase over the automation level by means of adding automatic elements in the current PV plant design is studied. The new elements and their configuration are explained, and a control strategy for applying this technique on large photovoltaic plants is developed. With the aim of getting on-site EL images on a real plant, a PV inverter has been developed to validate the proposed methodology on a small-scale solar plant. Both the electrical parameters measured during the tests and the images taken have been analysed. Finally, the implementation cost of the solution has been calculated and optimised. The results conclude the technical viability to perform on-site EL inspections on PV plants without the need to measure and analyse the panel defects out of the PV installation.

1. Introduction

Energy use worldwide is changing quickly due to the need to mitigate climate change. Renewable energies (RE) have a crucial role in helping the world to meet its energy needs, with the possibility to supply four-fifths of the world’s electricity by 2050, massively cutting down carbon emissions. Nowadays, new legislation is promoting the installation of RE power plants to increase their penetration level in the power generation system [1,2]. However, photovoltaic (PV) and wind power have to exploit their full potential, decreasing the installation and maintenance costs of power plants.
Currently, the proportion of electricity generation of the European Union (EU) from renewable energy sources has increased from only 12 % in 2000 to more than 30 % in 2020 [3]. This represents an average growth of 1.7 % per year. Moreover, RE power installation worldwide has changed from a 20 % of the shared electricity net in 2010, to a value over 30 % in 2020, and the forecast is to reach the 50 % by year 2050 [4]. In particular, wind and solar plants dominate the growth in renewable energy generation.
Nowadays, the reduction of needed investment cost for new utility-scale photovoltaic plants (USPVPs), up to 6 times in respect to one decade ago [5], has placed the PV technology in a competitive scenario regarding other generation sources, both conventional and renewable. This situation is accelerating the rate of PV power penetration into the international power system, turning solar power generation into an important actor in the transformation of the future electric market [6,7]. In addition, in order to substitute conventional power plants, the size and rated power of USPVPs have increased exponentially in the last decade, recently reaching rated powers up to 2.2 GW [8].
The area needed to place USPVPs grows linearly related to the rated power capacity [9], and therefore it is crucial to develop efficient and optimum maintenance techniques for USPVPs, which can cover huge extensions of terrain in a short time at a competitive cost.
One of the most promising maintenance techniques in the current state-of-the-art is the evaluation method of PV panels damage through the study of images. This method covers up two different technologies: the study of infrared thermography (IRT) images and the study of electroluminescence (EL) images. On the one hand, the study of IRT images analyses hot and cold spots on the PV cells while they are generating power during the daylight [10]. On the other hand, the study of EL images analyses the PV panels while they are in the direct polarisation working zone, detecting the damaged modules from the emitted spectrum in the non-visible zone [11].
The paper focus on the latter category, which will be explained in detail in the following section. The main objective of this paper is to present a new method to reduce the maintenance costs of EL testing, using the hardware provided by the PV solar inverters and a sequencing of the PV strings to polarise them accordingly. The paper analyses hardware and software used in current and future USPVPs, and points out the required changes in order to apply the developed technique conveniently. Finally, the paper provides a discussion about the expected outcomes and costs of the new method.
This paper is organised as follows. First, Section 2 describes the principles of EL technology applied to PV panels and the current maintenance procedure, as well as a comparison with the most commonly used image processing analysis: the IRT technology. After that, Section 3 describes power inverters used currently in USPVPs and how to adapt them to run EL tests. Section 4 introduces the control technique added to the power inverter to induce a direct polarisation of the PV panels, as well as how to synchronise the whole plant in order to perform the EL maintenance action in the proper way. Following this, Section 5 and Section 6 show the built prototype, the demo-plant and the results obtained from the experiments. Section 7 introduces a cost analysis of the solution in order to evaluate its feasibility. Finally, Section 8 summaries the most important conclusions of the research.

2. Electroluminescence Technique

2.1. EL Principles Applied to PV Panels

The working principle of a PV solar cell is based on a photoreceiver diode which captures the photons doing a photoelectric conversion. According to this fact, the classic electric model of a PV panel is shown in Figure 1a [12,13].
Therefore, the current provided by the PV cell is defined by expression (1),
I = I L I D I s h
where I L is the current generated by the captured light, I s h is the dissipated current by the shunt PV panel resistor and I D is the lost current due to the recombination. In particular, I D is defined by the following expression,
I D = I o e V + I R s n V T 1
where I 0 is the inverse saturation current of the diode, V T is the thermal voltage, n is the diode ideality factor and R s is the series resistance.
Consequently, the characteristic I–V curve of a PV panel is described by the dashed curve in Figure 1b [14], known as the LIV curve. It has a behaviour determined by the electric characteristics of the diode, and the vertical position is determined by the irradiation value. Besides, the dashed curve at Figure 1b has been calculated for an irradiance value of 800 W/m 2 . On the other hand, when the irradiation is equal to zero it reaches the solid curve, known as the DIV curve. Due to the physical characteristics of PV cells, they start to work as photo-emitters (4th quadrant), instead of phosphorescent (1st quadrant), when a current is supplied to them, in the same way as the light-emitting diode (LED) technology [14].
However, the light emitted in the 4th quadrant is relatively low, due to the fact that in the PV silicon panels this process is done through the carriers recombination in a forbidden indirect band of the semiconductor, by means of the recombination by defects or Auger [15]. Nevertheless, there is a small radiative recombination, which is enough to be detected by an external sensor. This phenomenon means that the EL technique could be useful as a non-destructive and fast evaluation method to get the health state of PV cells.

2.2. EL Analysis Procedure

The health state of a PV silicon panel could be determined using the EL technique by means of supplying current to the panel. Typically, the hardware needed to perform tests such as is a power supply able to provide the short-circuit current of the panel under test, I s c , and at a voltage level higher than the panel open circuit value at the rated irradiance, V o c .
Consequently, current injection produces near-infrared (IR) light emission in the solar panel. In an industrial solar plant scenario, this operation is performed by qualified technical staff, taking the PV panel photograph in the plant-site, and conducting the post-image process and analysis of results afterwards. The image is taken with an appropriate digital camera, and focused in the wavelength of interest, paying special attention to avoid parasitic light and camera vibrations [16].
The technical specification International Electrotechnical Commission (IEC) 60904 defines methods to capture images of PV panels by means of EL technique. It also defines postprocessing procedures to get quantitative descriptors and provide a guideline to understand the results. The standard is oriented to the measurement in a controlled scenario, forcing the current flow thanks to a voltage power supply in the panel under test terminals. In addition, captures with low signal-to-noise ratio (SNR) are provided by thermoelectric cooling of charge-coupled device (CCD) or complementary metal-oxide-semiconductor (CMOS) cameras. Relevant parameters such as the number of pixels, noise, wide length, and dynamic range are taken into account in the selection of the right detectors. Moreover, the images should have enough quality, and therefore they should be obtained in dark scenarios, by means of walls, curtains or otherwise, in order to avoid the parasitic light [16].
The EL technique is very useful in the manufacturing step of PV panels, where the controlled described test could be run easily. However, applying EL evaluation over existing USPVPs implies one of these alternatives: (i) to dismount, test and remount every single panel individually; (ii) to perform the EL images on the PV panels without dismounting them by means of an external power supply. In the first case, cell breaking due to transport is a very common issue. In the second case, it is necessary to carry an external power source to the plant site. Additionally, in both cases, the processes are invasive, so there is a potential danger of damaging facilities and workers.
If the PV solar inverter was adapted conveniently to work in a bidirectional way, it would be possible to force the panels to work in the 4th quadrant and apply EL recognition during low irradiation time slots (at night, sunrise and sunset) directly on the installed panels.

2.3. IRT Versus EL Inspections

IRT is the most extended technique in PV image processing to detect failures in panels. It is a non-destructive measurement technique, which provides fast, real-time and two-dimensional distributions of characteristic features from PV modules [17,18,19]. In addition, IRT can be performed in illuminated or dark conditions [16,20,21,22].
In the former instance, the illuminated IRT or IRT under common operating conditions of the PV system are similar to luminescence, where the current flowing through cells increases PV module temperature. In this case, it is used as a contactless method for diagnosing of common thermal and electrical defects in PV modules [23,24,25]. Typical anomalies detected by illuminated IRT arise whenever one component becomes warmer than the surrounding ones or the expected rated values, for instance: modules; bypass diodes; single cells without following any pattern, in the lower parts or closer to the frame; a part of a cell respect to the rest; or pointed heating or a bypass diode string part respect to the others when they are equally shaded [26].
However, results reveal that IRT could not detect all possible failures in PV modules. Recently research about EL shows that it can give complementary information to IRT techniques, adding value to individual findings [27,28]. Performed IRT measurements proved that not all identified defects lead to an increase in temperature [28]. It has been experimentally observed how using EL is especially interesting to detect cell cracks in PV modules, appearing as dark lines on the solar cell in the EL image, as well as interrupted contacts, or a number of process failures (e.g., shunts or defects in the anti-reflection layer) [28]. Irregular areas indicate the presence of cracks in the silicon wafers while regular rectangular dark areas can be due to broken front grid fingers. In this case, EL locating can complement outdoor IRT technique by detecting defects that does not produce a temperature increment [29].
In the latter instance, IRT in dark conditions shares some similarities with EL technique, being the module subjected to a forward voltage. In the EL test, modules operate under forwarding bias like a LED, and therefore have to be power supplied. The excitation current can be less than or equal to I s c [21]. It has been observed from visual inspection of EL and IR images in the fourth quadrant that most of the defects detected in the dark IRT images under the forwarding bias condition can also be identified in the EL images, whereas not all the defects detected in the EL images can be detected with dark-IRT, as some broken cells or soldering defects over one or more buses [29]. Therefore, the high resolution of the EL images enables resolving most defects more precisely than the dark IRT images.

3. USPVPs Power Inverters

3.1. USPVPs Retrofit Requirements to Apply EL on-Site

Several automatic tools must be introduced in a USPVP in order to perform the EL image processing technique diagnosis successfully, leading the PV panels to the 4th quadrant working area sequentially, and in the right order.
Firstly, it is mandatory to have a way of getting the EL images with the required requisites, being the optical device installed in a drone, vehicle, tripod, etc. Afterwards, the images taken by the camera will be sent to a central controller site, where they will be saved, post-processed, and a final diagnosis will be obtained.
On the other hand, the power electronics inverter will have to fulfil a list of requirements to allow the direct polarisation of the PV panel strings and lead them to the 4th quadrant for the EL evaluation. Following, the characteristics that must fulfil the power converters are pointed out.
  • Working-mode as a current source: the inverter must be able to work as a power supply with the capability of producing the PV panel string I s c at a voltage near the PV panel open-circuit value, V o c . Therefore, the inverter must have a completely bidirectional feature.
  • Starting-up without irradiation: in order to avoid parasitic light irradiance and PV plant power losses, all tests must be carried out during sunrise, sunset or at night. Therefore, the DC-Link precharge of the inverter must be done from the alternating current (AC) grid side, instead of doing it in the usual way, from the PV panels. Consequently, the PV inverter must include a precharge mechanism from its grid side.
  • PV string sequencing: especially in the cases of large solar inverters, the number of PV string arrays in parallel can be considerable, covering a large ground area. Thus, it is desirable to apply direct polarisation to a single fraction of all panels connected to the inverter, limiting the action area, and therefore minimising the power needed to carry out the EL inspection. Therefore, it is recommended to replace isolators with several lower power automatic switches connected to one or a few strings.

3.2. USPVPs Power Inverters Topologies

Nowadays, there is a wide variety of power electronics converter topologies oriented to solar plant applications. The state-of-the-art is extensive and there is not an homogeneous answer about which is the best solution [30,31,32,33,34,35,36,37], providing very different solutions according to the needs of each specific application.
There are many possible classifications of solar inverters according to different factors: galvanic isolation or not; single-stage or multi-stage; central, multi-string, string or module inverter; bi-level or multi-level converter; voltage source inverter (VSI), current source inverter (CSI) or impedance source; grid-connected or isolated; hard or soft switching, etc. [33].
In particular, this study focuses on the application of automated EL technique to large PV plants. Therefore, we will consider grid-connected high-power inverters. In these applications, VSI non-isolated inverters are commonly used. Besides, hard-switching is usually chosen because there are no space or weight limitations in the case of solar micro-inverters for domestic applications.
According to the conversion stages inside the PV inverter, single-stage and multi-stage topologies can be found. Multi-stage topologies are suitable for direct current (DC) voltage adjustment, providing galvanic isolation through high-frequency (HF) intermediate stages if needed. However, specially in high-power plants, single-stage inverters are widely used due to the fact that strings are grouped reaching the highest possible voltage, up to 1500 V, and achieving a maximum power between 1 MW and 3.5 MW [38,39,40,41,42,43]. The objective is to reduce the DC current at the rated power and, consequently, reduce the power losses in the DC installation.
Finally, as the case of study are large PV installations, only three-phase topologies will be considered. Four-leg configurations or several single-phase devices in parallel are also possible, but they are not usually used in industrial environment, and thus they will not be studied in this paper. Within this context, the most representative topologies are described below (although the state-of-the-art is not limited to these topologies).
Firstly, nowadays the bi-level three-phase inverter is the simplest and most used topology in the market. This topology, shown in Figure 2a, consists of only six full-controlled semiconductor devices (usually metal-oxide-semiconductor field-effect transistor (MOSFETs) or (insulate gate bipolar transistors (IGBTs)).
In the following, several multilevel topologies for PV inverters are presented [44,45]. These topologies can be extended in the case of 3, 5 or N levels, but, for the sake of simplicity, only the three-level cases are presented. The objective of increasing the number of levels is to add step levels in the voltage waveform, reducing the low-pass filter size and, therefore, improving the inverter response, as well as reducing its cost and size.
One of the most used multilevel topology is the neutral point clampled (NPC) topology type I. Figure 2b shows an example of 3-level NPC topology; this configuration has a floating medium point in the DC-link that allows it to modulate 0 V in addition to + V D C and V D C . There are some variants on this configuration; Figure 2e shows one representative modification [46]. This configuration has some advantages over the previous one as lower harmonics introduction, smaller passive components, higher efficiency, and solves the leakage current problem inherent in PV panels. Besides, the new capacitor in parallel to the medium-point diodes facilitates the semi-buses balancing: the main problem in standard NPC topology.
NPC topology type T is another of the most used topologies in PV applications. Figure 2c shows the T-type topology in a three-level example. This configuration reduces the number of semiconductor elements removing the antiparallel diodes required by the I-type topology. Besides, T-type inverters have a slightly higher efficiency due to the fact that, in active mode, only one switch is conducting [47].
Another common multilevel configuration is the flying-capacitor topology, for example, Figure 2d shows a three-level flying-capacitor inverter. This topology allows low harmonics injection, and a better power control and capacitor balancing than the NPC topology. On the contrary, the DC-link bus capacity becomes larger and, for a higher number of levels, this solution becomes more complex and bulky. Moreover, this topology achieves a lower efficiency and a worse use of the effective switching frequency than others alternatives. In addition, like in the case of NPC topology, there are some variations on this configuration that provides certain advantages [44].
In conclusion, all the discussed topologies in this section allow bidirectional current flow and, therefore, they can be used for EL inspections. Consequently, the hardware available in current large PV plants can be modified in most cases to allow EL maintenance at low or zero cost.

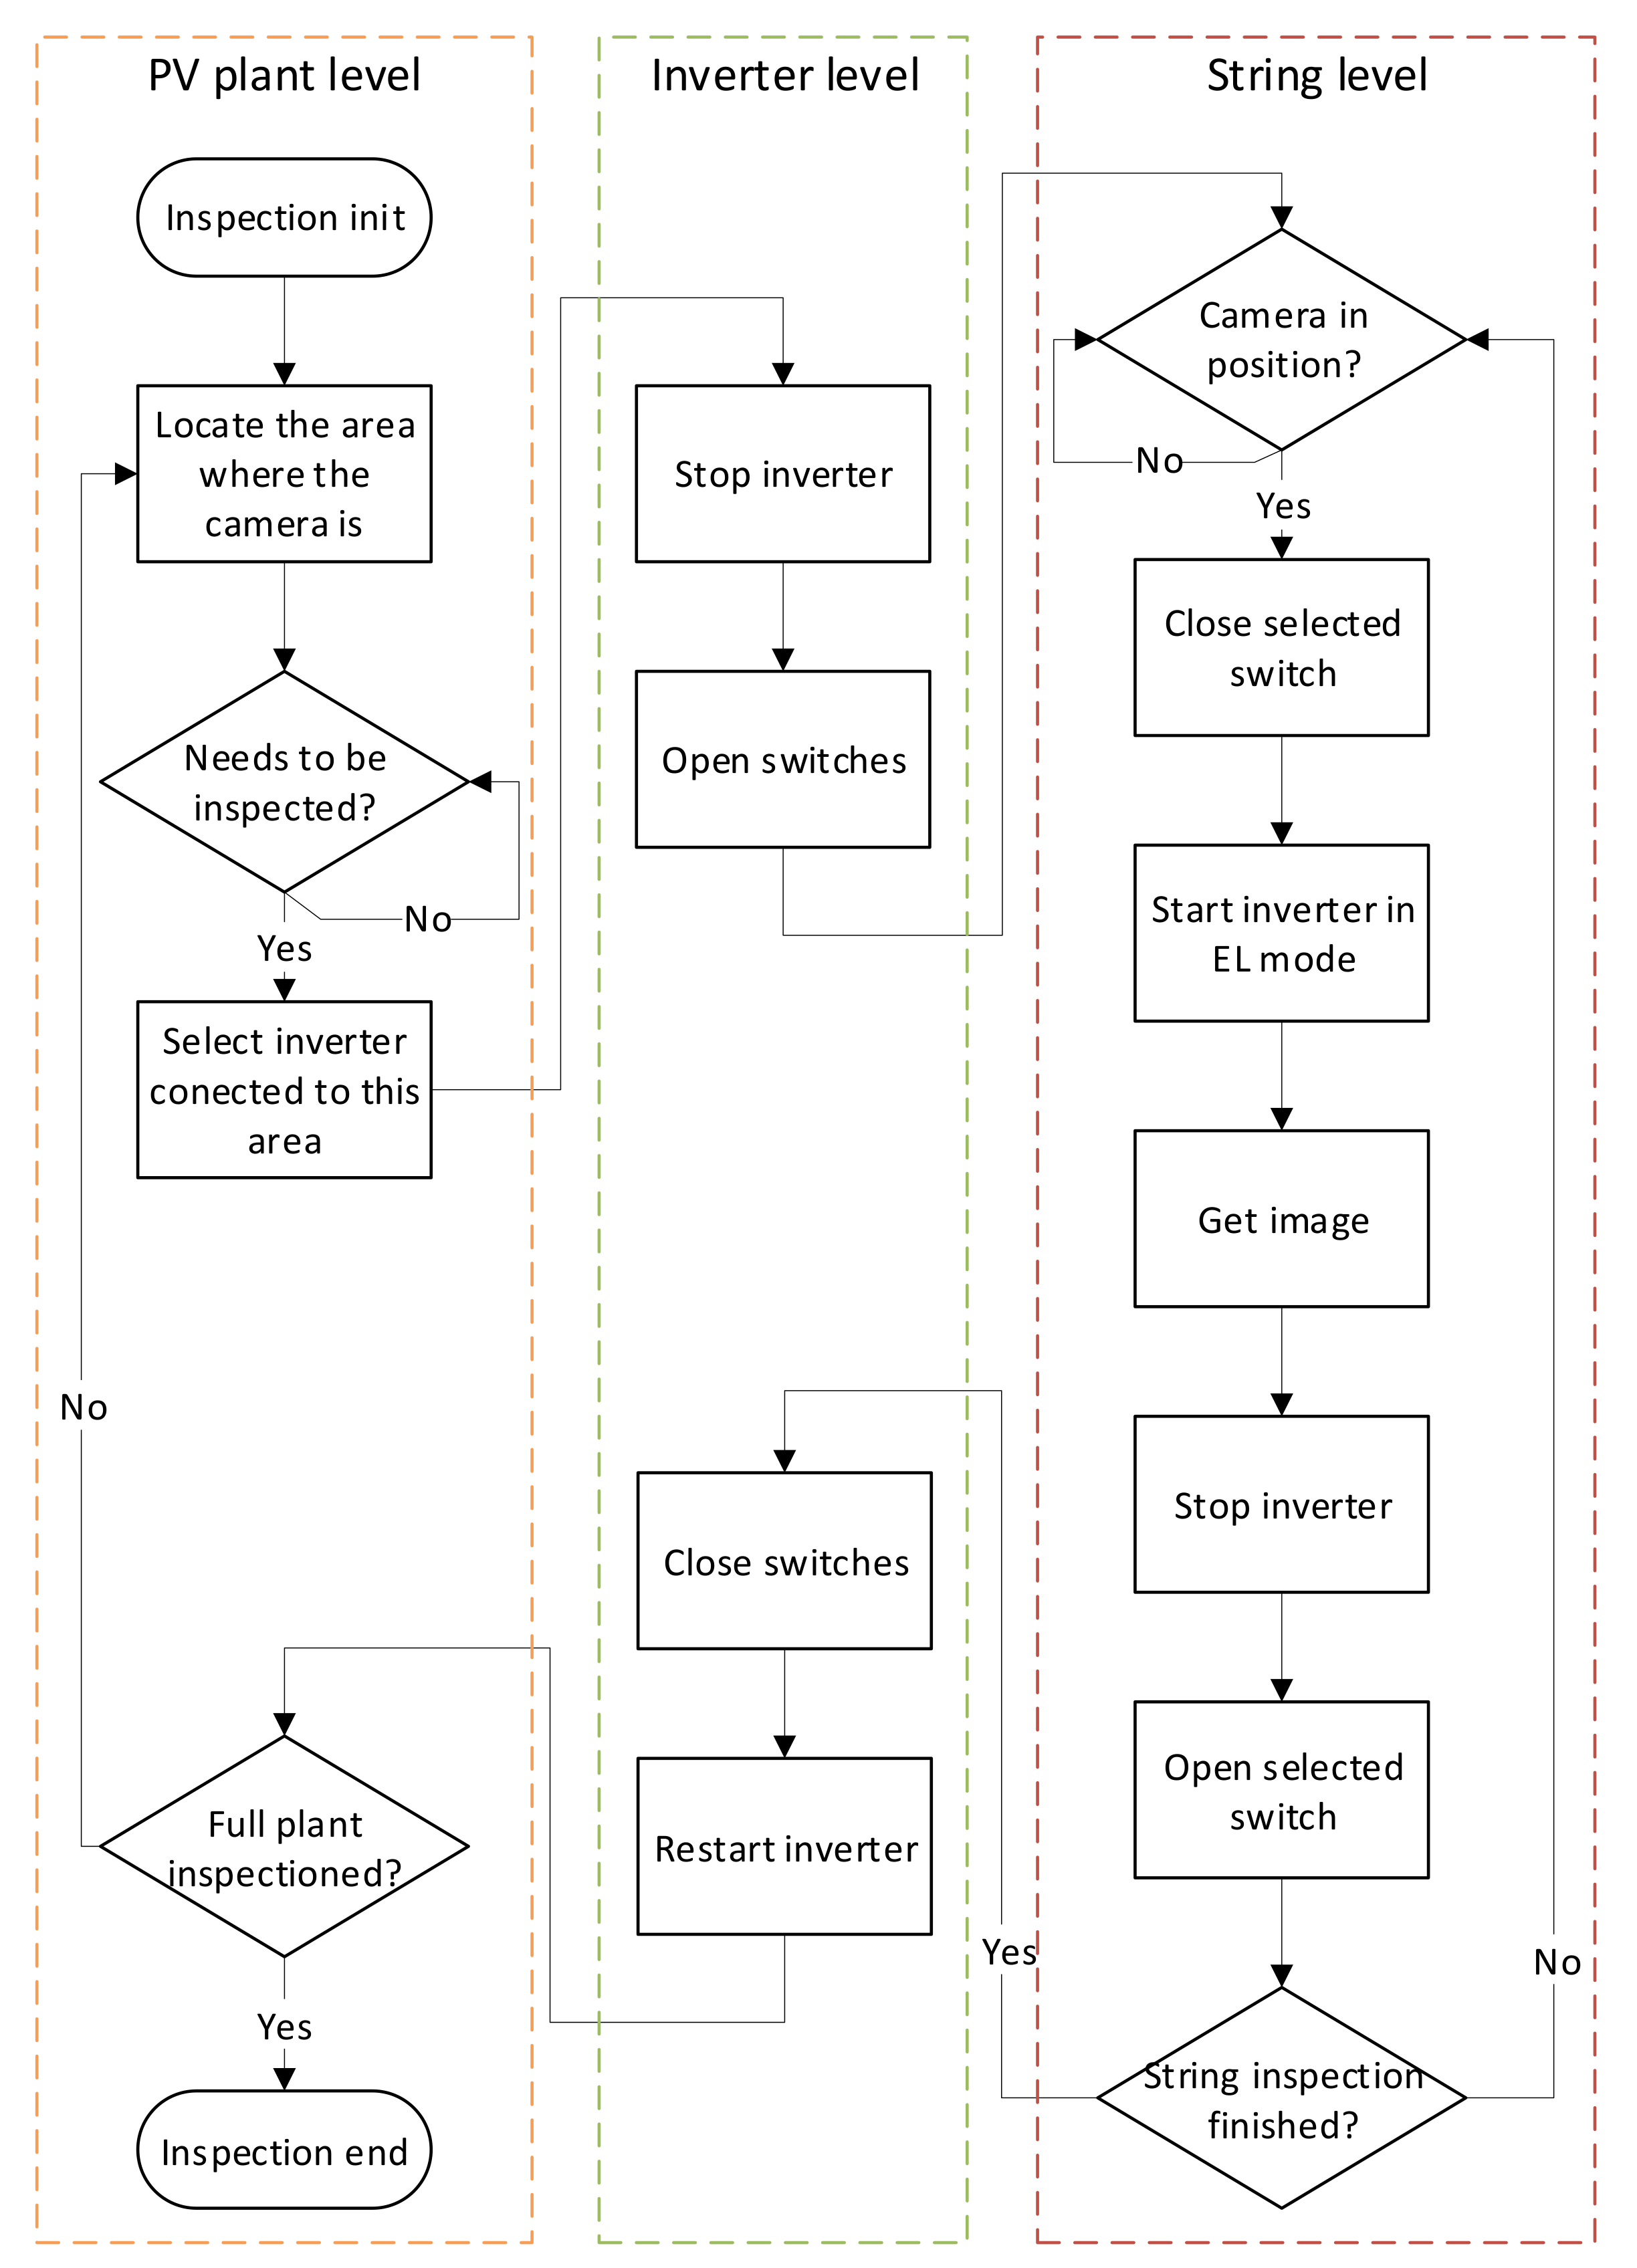
4. USPVPs Control for Applying EL Technique

4.1. Power Inverter Controller Structure

As discussed in the previous section, industrial high-power grid-tie converters usually use a single-stage inverter topology in PV applications [48,49]. A three-level NPC type-I three-phase topology has been selected for the purposes of this study; however, nevertheless, the same techniques could be applied in the same way to other topologies.
Figure 3 shows a classical DG converter control block scheme. The controller is divided into four layers [50,51]:
  • High level controller: The highest level control is responsible for providing the right active and reactive power set-points to the lower level controllers. Its objective is to maximise the active power generation and to help the utility grid with the reactive power injection.
  • Middle level controller: The middle level controller is tasked to follow the higher level control references. Besides, it is in charge of checking the power inverter limitations due to restrictions (such as temperature and over voltages), and setting up priorities whenever necessary.
  • Low level controller: The low level controller includes both the instantaneous current controller based on a proportional-integrative-derivative (PID) controller, a direct-quadrature-zero (DQ0) transformation and the modulation control technique, which provides the switching pulse width modulation (PWM) signal to the power converter semiconductors.
  • Hardware level: Finally, the hardware level is in charge of translating the control signals to the physical pulses of the converter in order to produce the expected voltage signal behaviour by the power converter.
In particular, the EL control action is performed inside the high level controller layer. Figure 3 highlights in blue the blocks concerning EL functionality. The PV power inverter has a maximum power point tracking (MPPT) algorithm that looks for the optimum working point of the inverter in order to get the maximum output power from the PV panels [52,53,54,55].
The proposed algorithm introduces a switch that allows to change between the MPPT controller and a specific DC current controller for the EL operation. Therefore, the high-level goal, instead of being the maximum output power generation, is to establish a predefined negative DC current reference, in order to force the PV panels to work as light emitters. Consequently, the controller finds the right DC voltage reference in which the current set-point is acquired by means of, for example, a PID controller. Theoretically, the transition between the EL and the MPPT working modes could be done on the fly; however, it is necessary to stop the device in order to change the combiner box breakers state conveniently [56,57].

4.2. Complete System Control Architecture

In order to perform the EL inspection in USPVPs, a higher automatisation control level should be achieved. On the one hand, it is mandatory to have a system that is capable of taking the images automatically. Nowadays, due to its autonomy and profitability, unmanned aerial vehicles are the most studied inspection system [58,59], and several studies are focused on the applications of drones to the autonomous monitoring of large-scale PV plants [60]. On the other hand, the direct polarisation of a full USPVP has an energetic consumption so high that it is economically unfeasible. The solution to this problem is to divide the full plant into smaller areas, composed of one or several PV strings whose polarisation power requirements were viable, so that a single area is energised at the same time. To get this, it will be necessary to replace the isolators, located in the combiner boxes, with lower power remote controlled switches.
The automatisation level discussed above requires a real-time control to be able to complete the inspections as efficiently as possible. Automatic inspections require a control node capable of synchronising the image capture with the sequencing of the strings. The control node needs a communication system to receive images and telemetry from the camera, send the activation and deactivation signals to the breakers and send the current set-point to the inverter, as Figure 4 shows.
The whole inspection process diagram carried out by the control node to analyse the full plant is shown in Figure 5. First, the inspection order is received, and the control node requests the camera to be in the right position and location. If the camera is near to an un-inspected area, the control node determines the inverter connected to these panels. Second, the selected inverter is stopped, set in EL mode, and all the switches are opened in order to isolate the PV strings from the inverter. In a third place, the camera position is determined accurately and, therefore, the panels that appears in the image. Then, it is possible to close the switch connected to this string and send the current set-point to the inverter. When the camera obtains the images of the entire area connected to the close breaker, the inverter stops the current injection and the switch is opened again, a new string is chosen and the process is repeated. If all the panels connected to this inverter are inspected, every switch is closed and the inverter is restarted in solar inverter mode. When the entire plant is analysed the inspection finishes; otherwise, the camera moves to a new inverter area and the process runs again.
The hardware plant modifications proposed here, like the AC grid pre-charge system, add on the possibility of new functionalities in the PV plant, for example, reactive power injection at night [61,62,63].

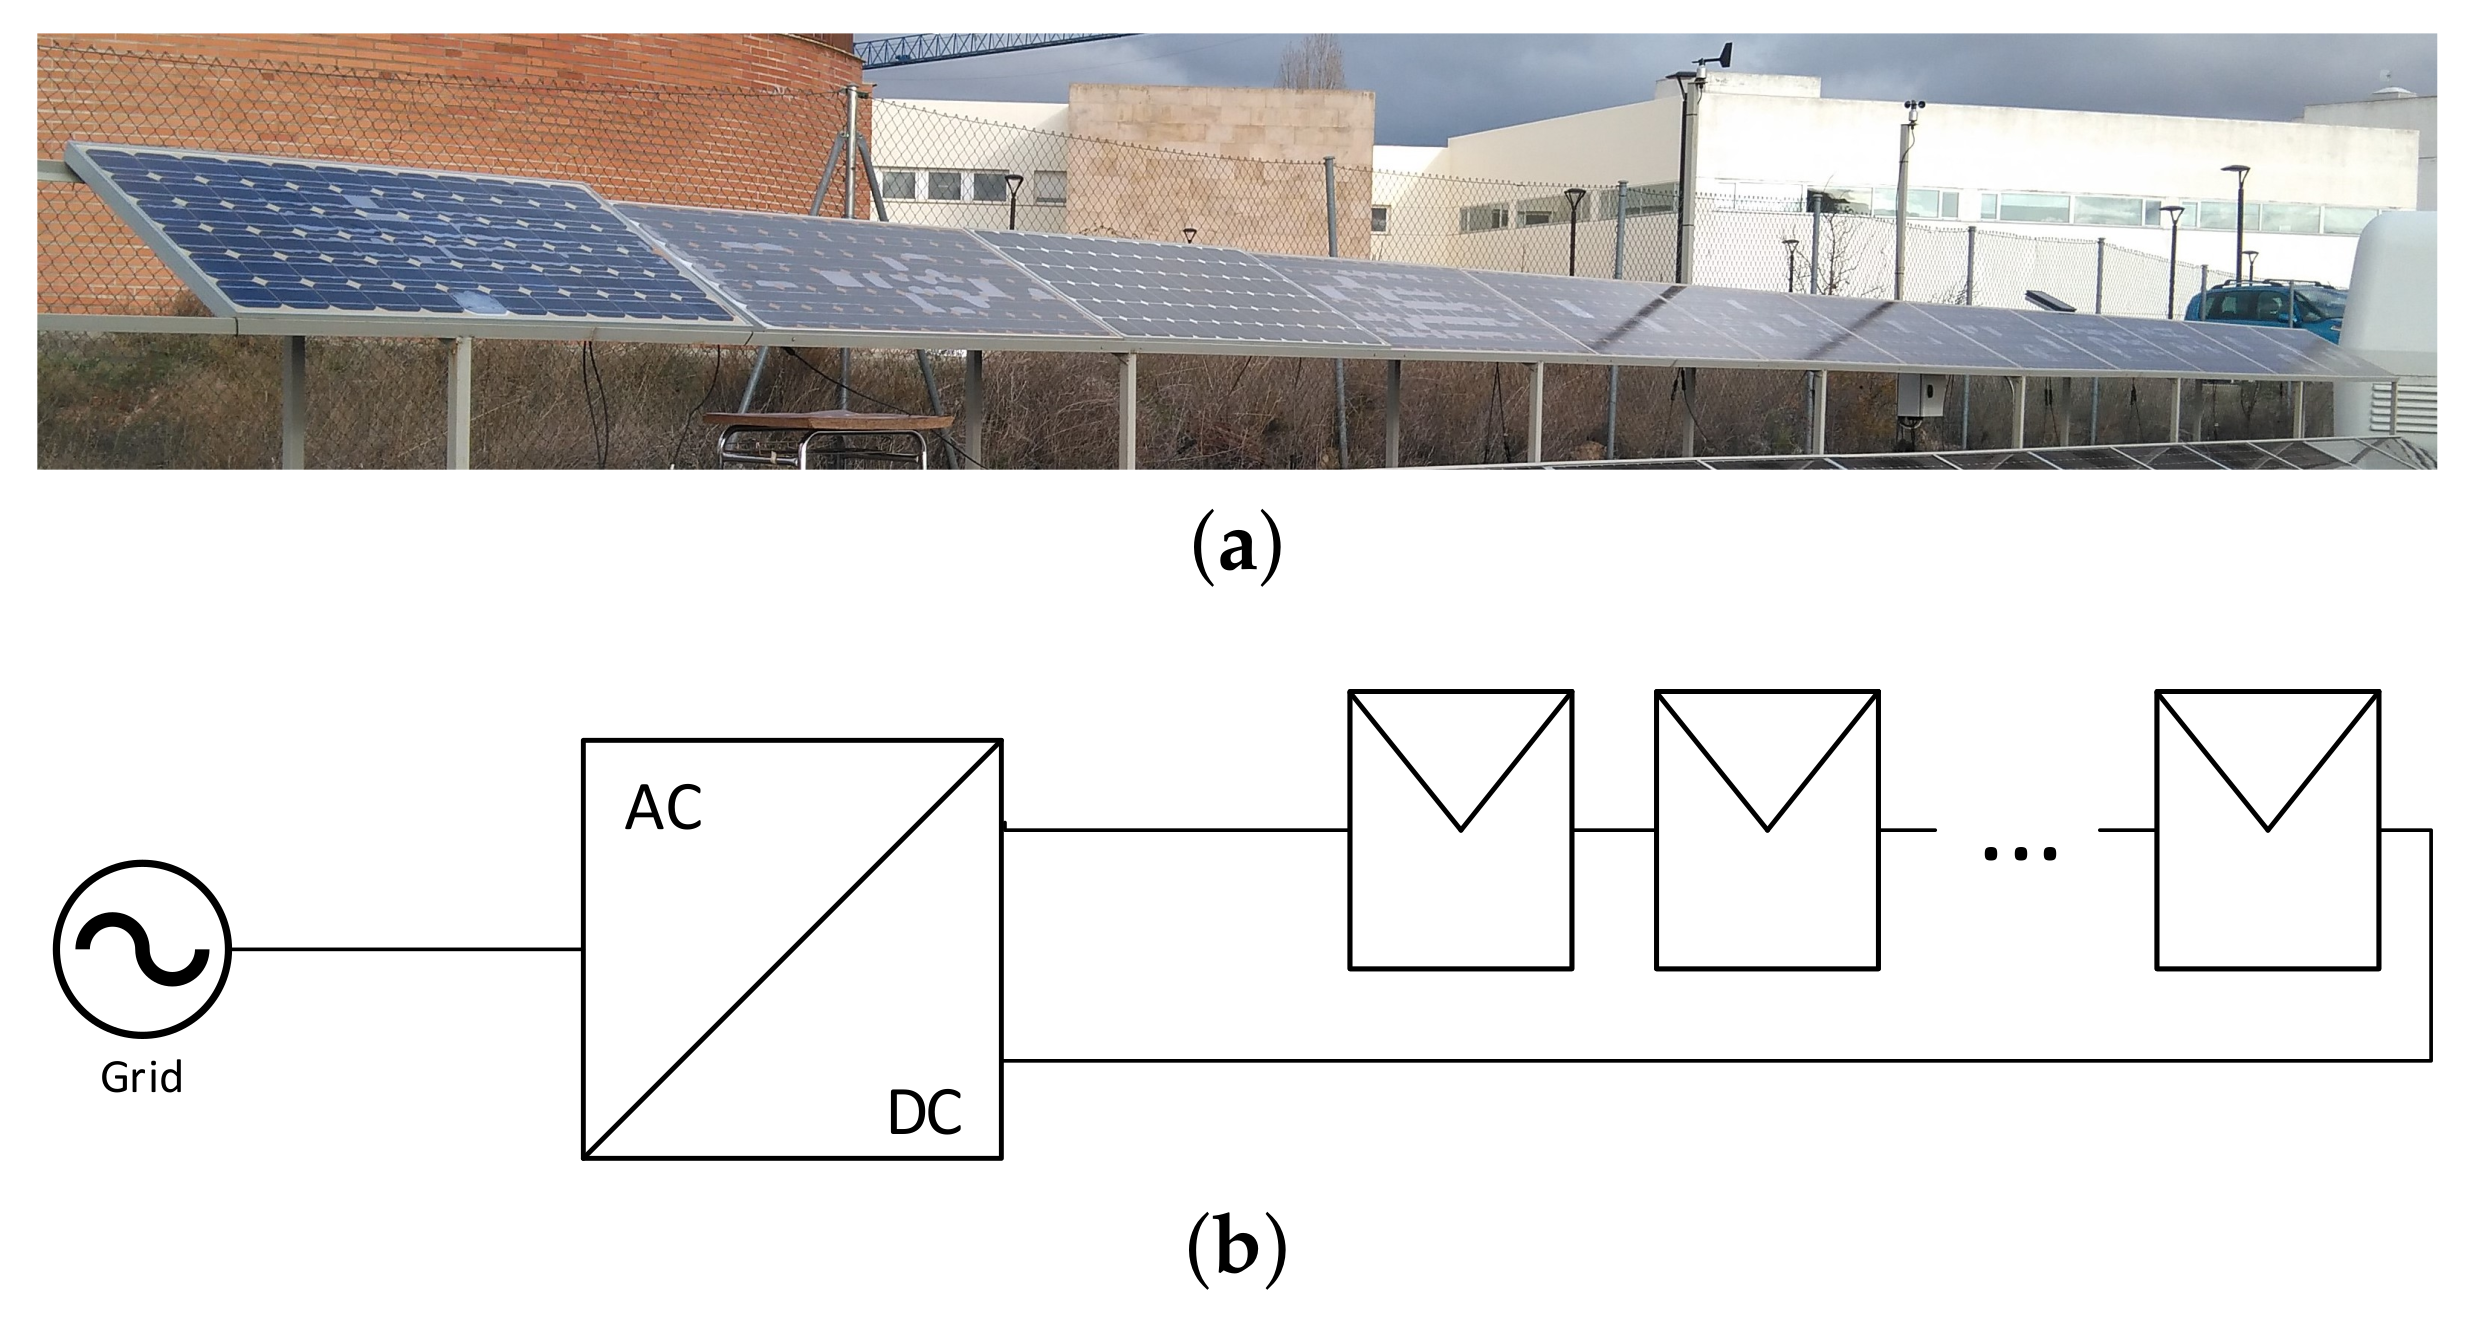
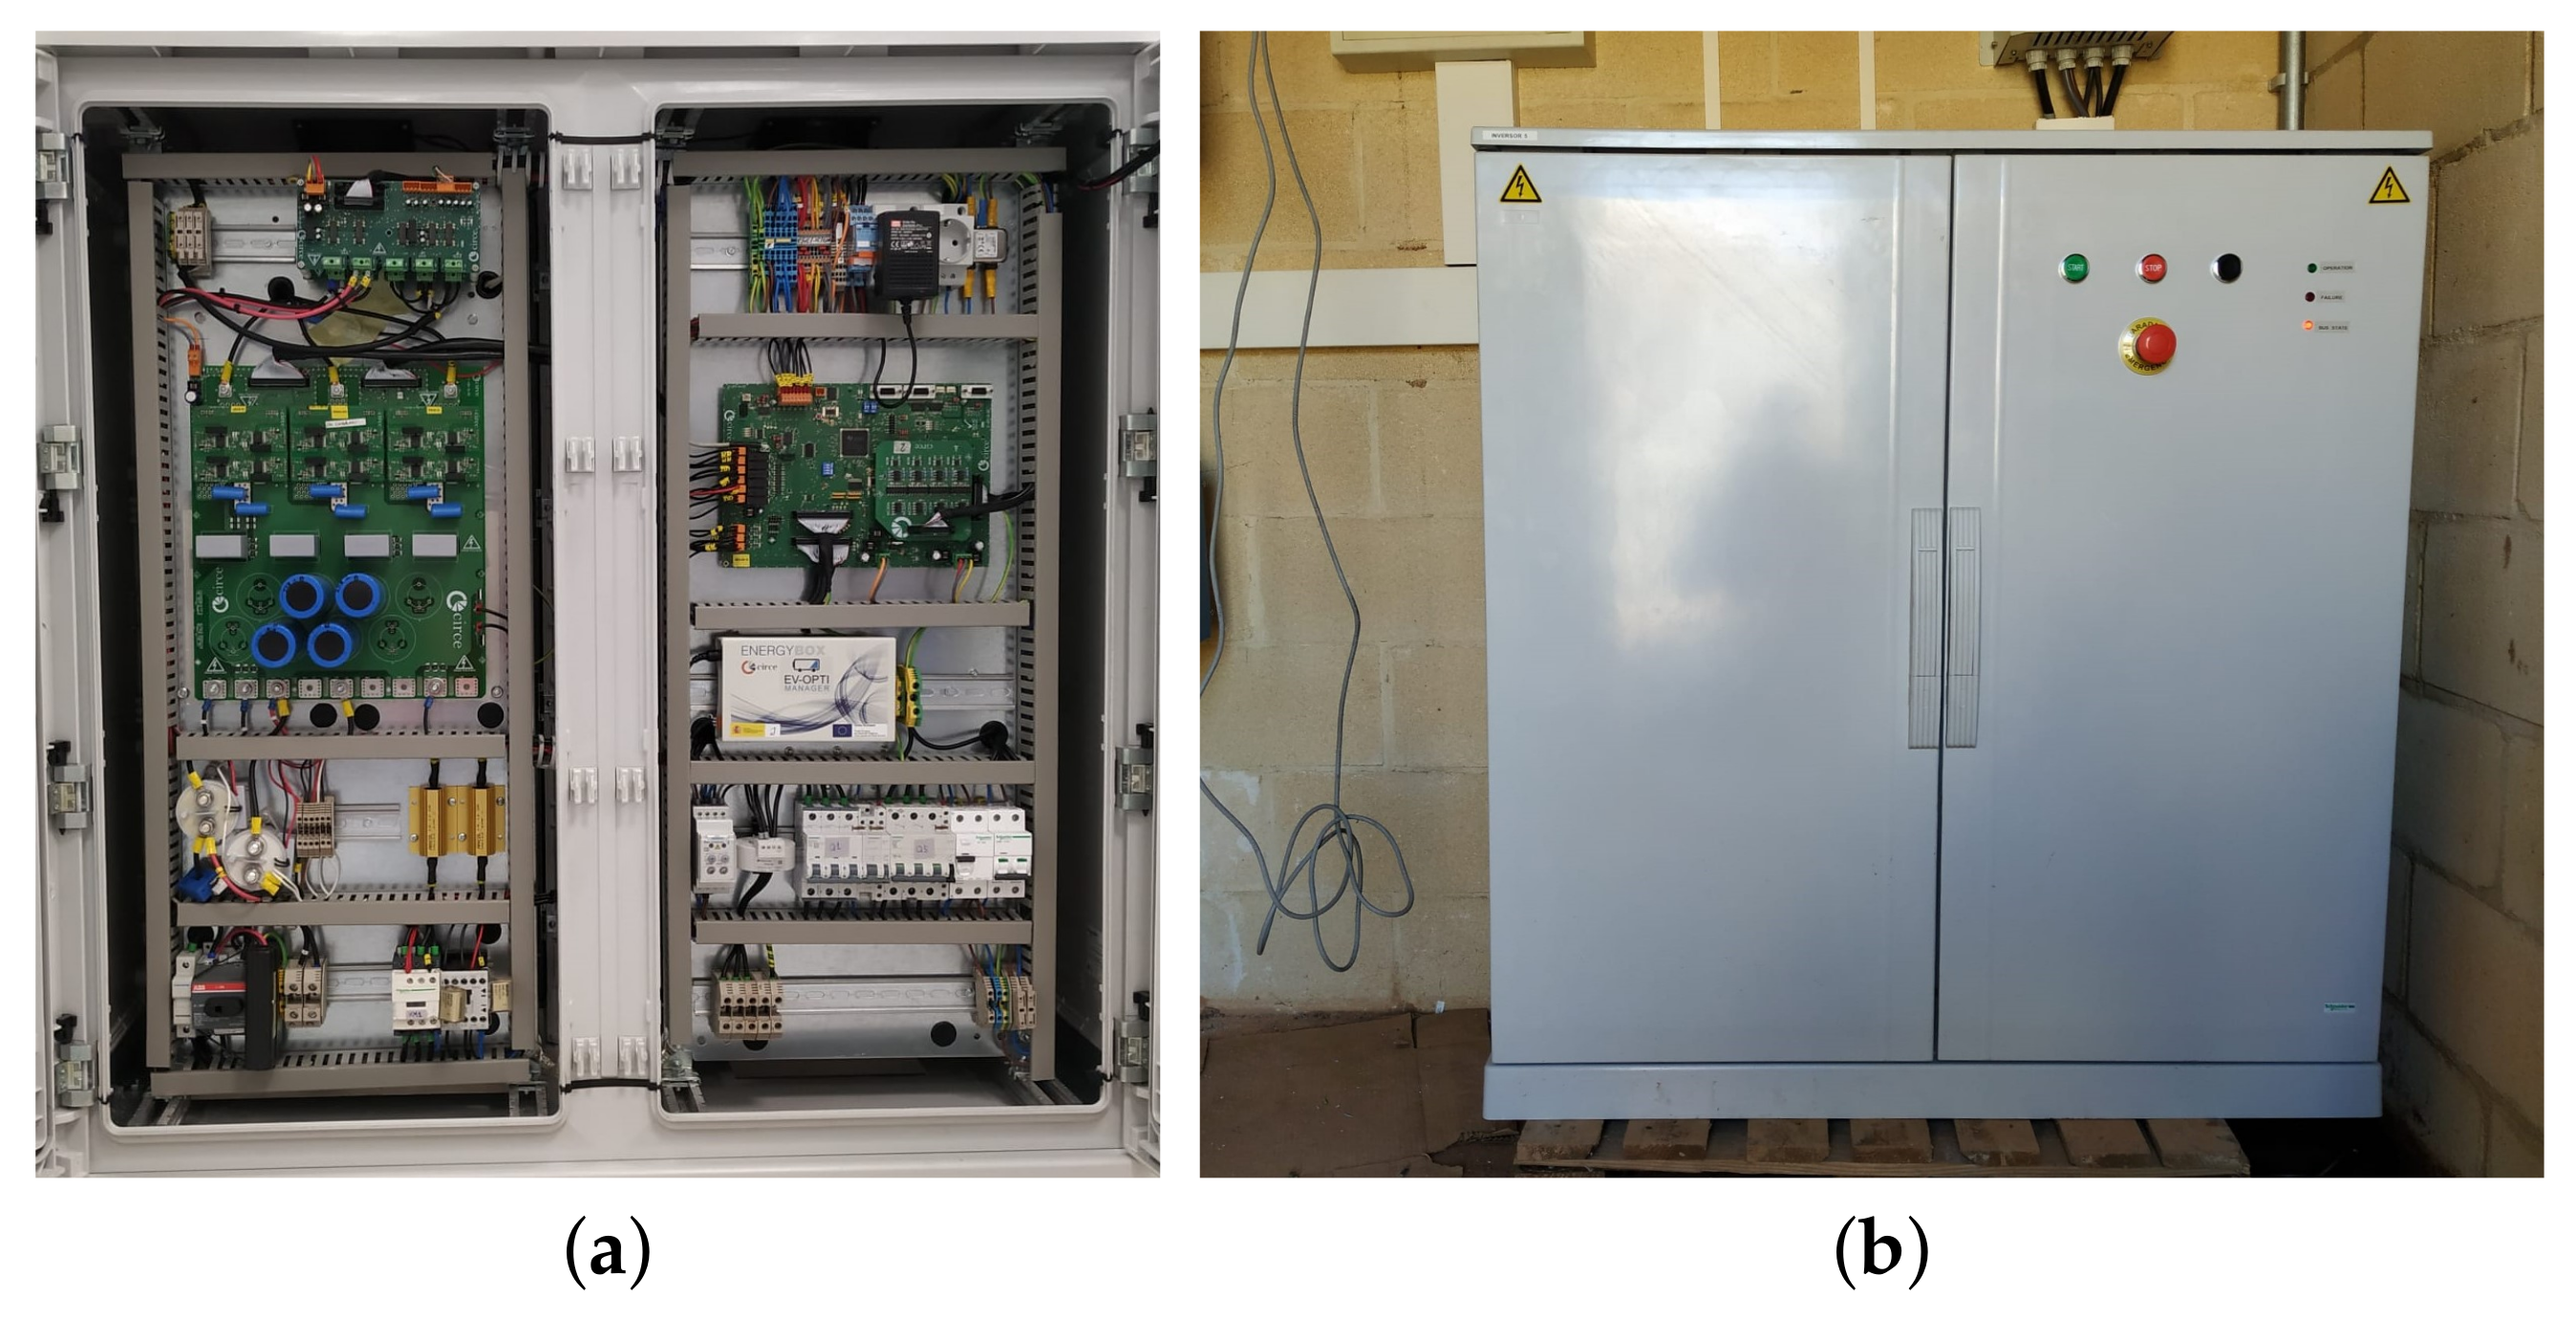
5. Prototype Design and Installation on the Demo Site

In order to test the proposed inspection procedure, a small pilot plant is available. The pilot, shown in Figure 6a, consists of 11 PV panels with several damaged cells. The datasheet contains the main specifications of the panels: every panel has a maximum peak power of 175 W, a V o c of 44.35 V and a I s c of 5.45 A. Summarising, the full plant achieves a maximum power point (MPP) of 2.1 kW, with 488 V V o c and 5.45 A I s c . It is important to emphasise that these characteristics are provided by the manufacturer for the newly manufactured panels, but the pilot plant have several defects, and therefore the showed values may vary significantly.
A three-level NPC I-type converter, which is prepared to allow the bidirectional current flow, has been developed for the purpose of performing an EL inspection on the pilot plant. The inverter, shown in Figure 7, achieves a maximum power of 3 kW. As Figure 6b shows, the inverter AC side has been connected to the 400 V three-phase grid, whereas the PV side can set its voltage between 330 and 550 Vdc. During the EL test execution, this voltage range is enough to allow the current control between 10 % I s c and 100 % I s c . Besides, the DC-link pre-charge allows the panels direct polarisation in night time conditions.

6. Simulation and Experimental Results
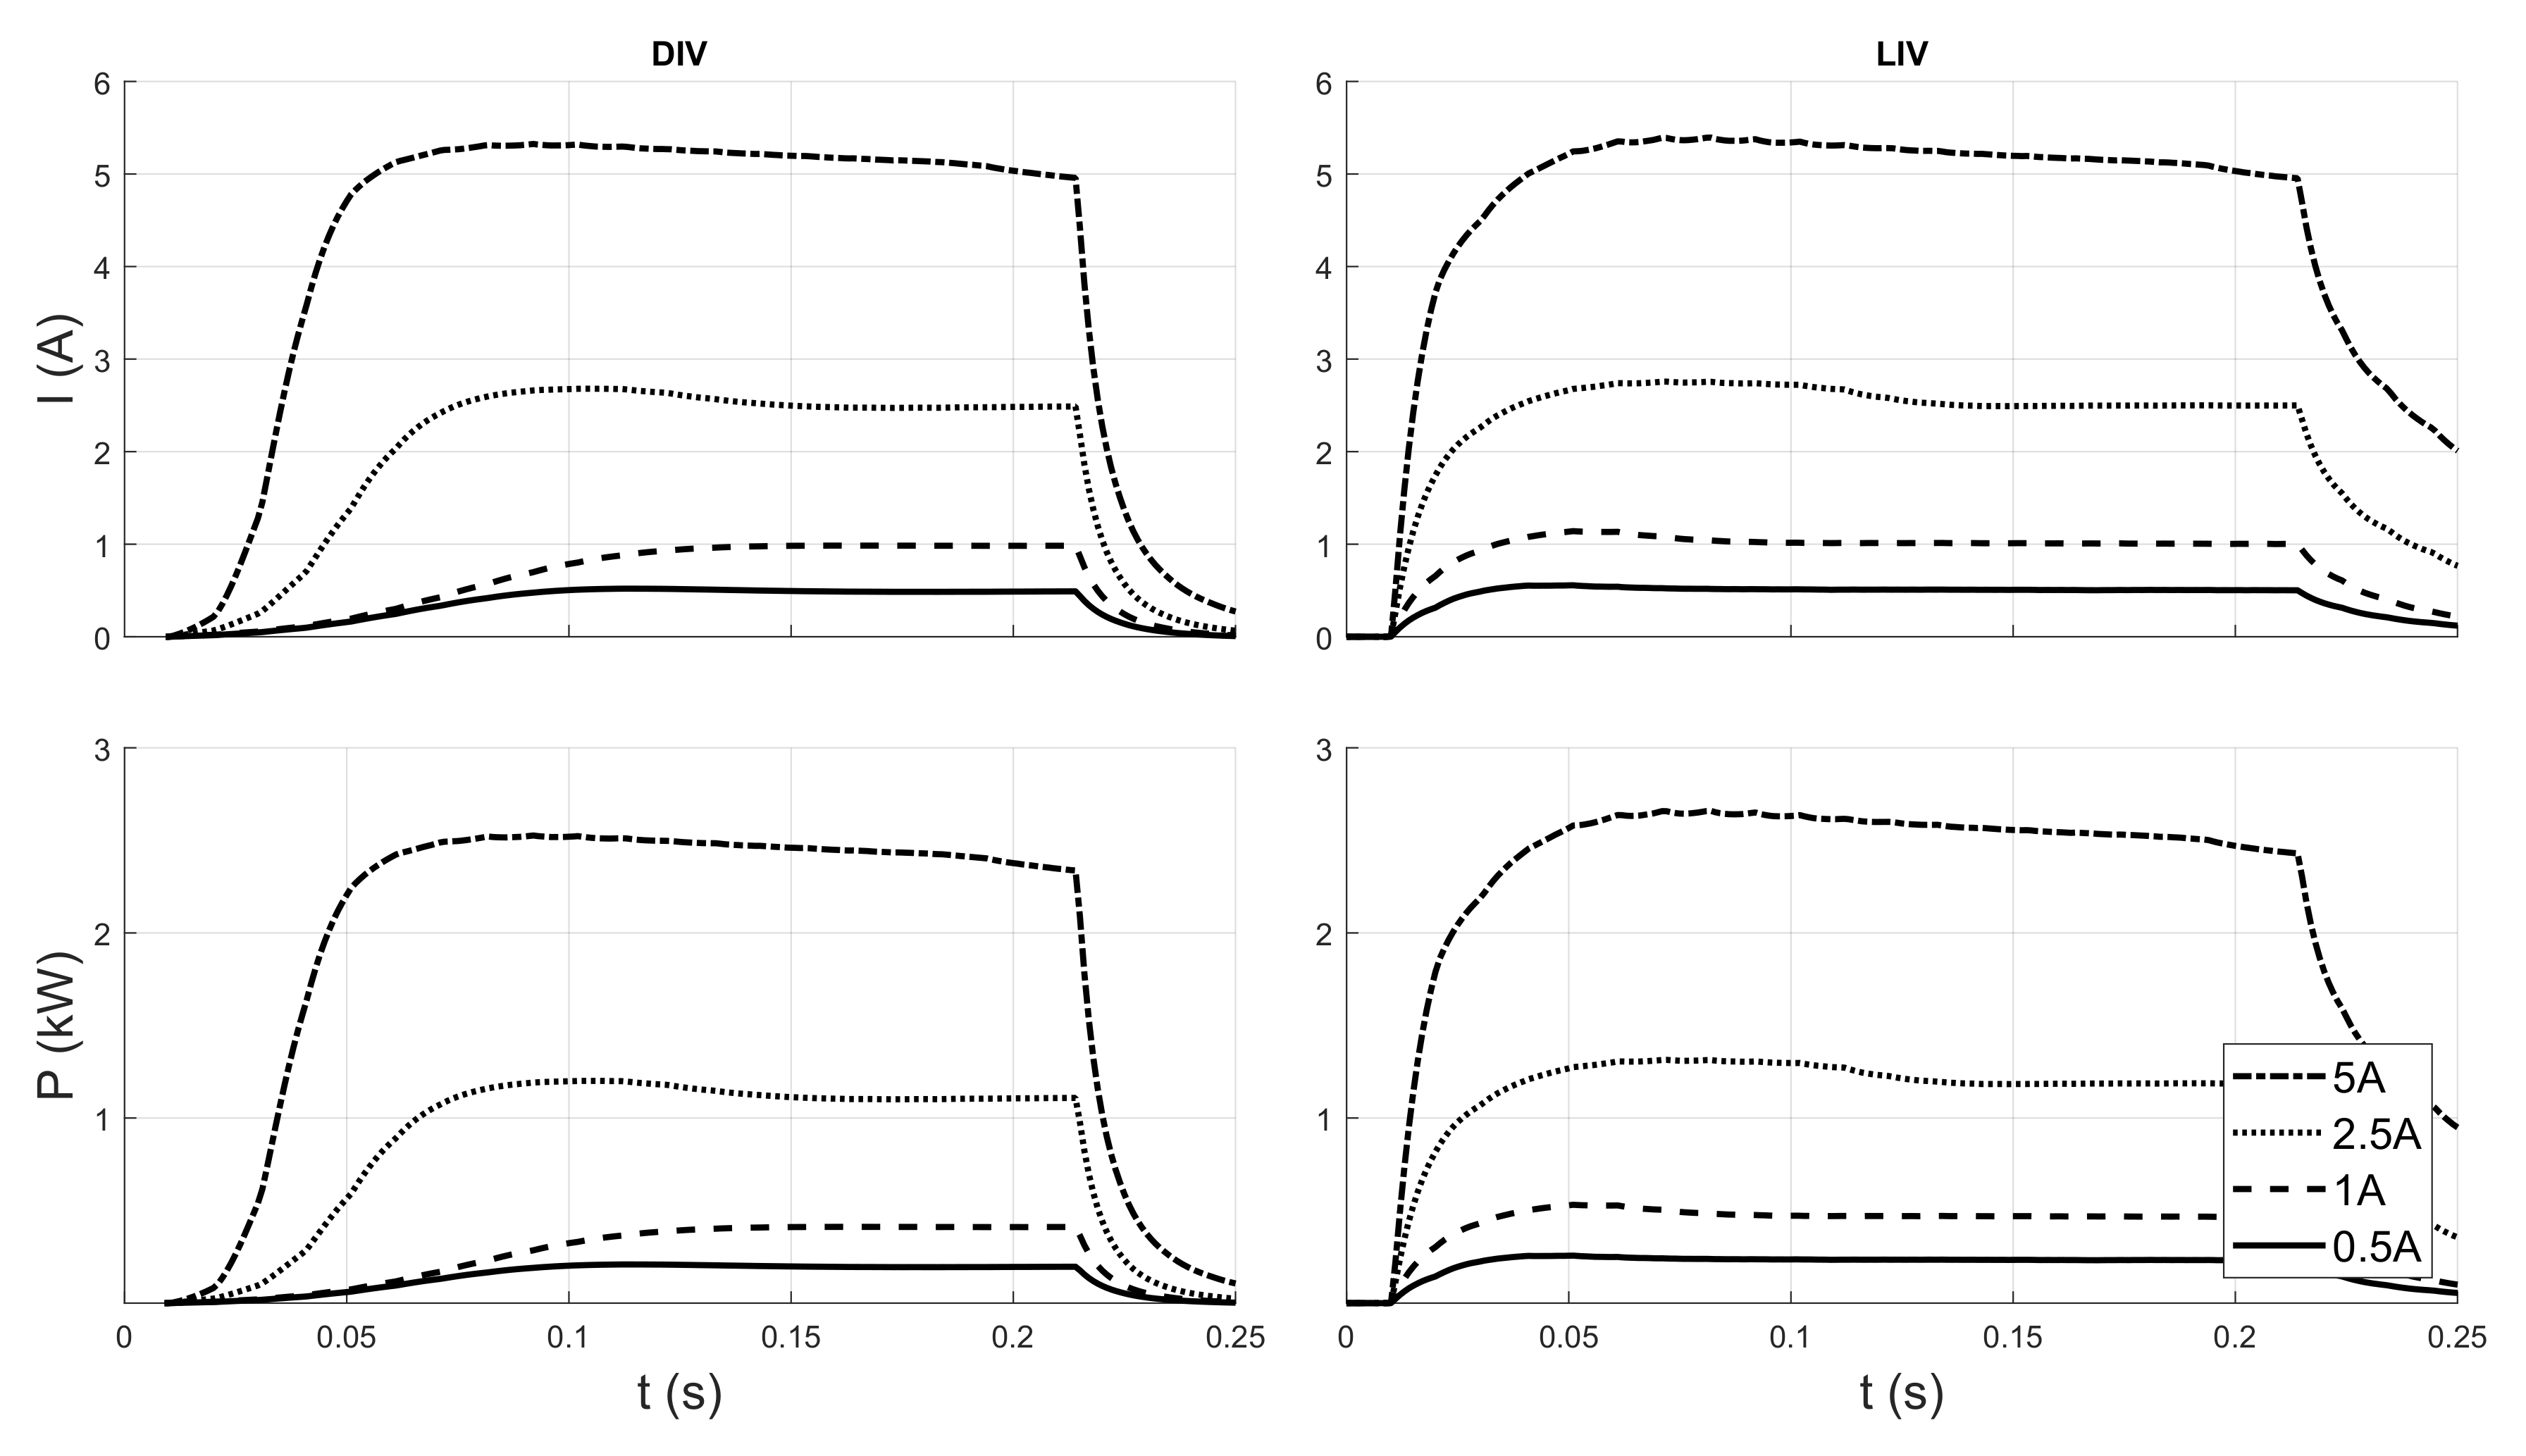
6.1. Simulation

Previously to the inverter assembly, the full system behaviour has been analysed in the PSCAD simulation environment. A model of the bidirectional converter and its controller has been simulated connected to a PV array. In this way, the PV array has been modelled according to the pilot plant characteristics, so that the obtained results can be extrapolated to the experimental set-up.
Current EL legislation [64] establishes that two tests must be completed in order to detect defects of different nature. A current equal to 10 % and 100 % of I s c must be injected during the first and second test, respectively. Starting from a scenario where the PV panels are connected to the inverter without current flowing between them, the current controller has been tested under different irradiance levels and current set-points, always within the limits set in legislation.
Figure 8 shows the PID controller response to a reference in the form of 200 ms pulse. Thus, voltage, current and power results are summarised in Table 1 for the analysed cases, allowing the calculation of power consumption required during the inspection.
On the one hand, the simulations conclude that irradiance is not strongly related with voltage and power levels required to achieve the current reference. On the other hand, a slight increase in voltage produces an important current variation. Consequently, if current set-point is increased, the voltage increases slightly also, and therefore the needed power variations are approximately linear with current. In conclusion, power consumption and, consequently, inspection cost, depends strongly on the current level necessary to achieve the light emission required to the defect detection.

6.2. Field Test

The developed inverter installed in the pilot plant has been tested in current source working mode in order to compare the simulation results with the experimental ones. The current controller allows different set-points levels according to the requirements of the inspection. Tests has been performed at four current levels: 10 % , 25 % , 50 % and 100 % of I s c . Table 2 shows the voltage and power measurements obtained from the pilot tests. These results confirm the simulation conclusions: power mainly depends on current and is practically independent of irradiance. On the other hand, small variations in voltage produce substantial changes in current. This conclusion ensures that the necessary voltage to carry out the inspection is around the V o c in the inverter, values within the inverter working range.
The controller implemented in the inverter allows to follow a current reference externally set. Figure 9 shows a transitory measurement when the current set-point, injected to the panels, change from 5 A to 0.5 A. The response time and over oscillation strongly depends on the implemented controller, in this case a PID controller.
In order to corroborate the validity of the techniques used in the pilot plant, both in the inverter, and in the capture of images with the use of unmanned vehicles, EL measurements were made in the pilot plant. Figure 10 shows the EL image of a PV panel, obtained in the experimental plant with an injected current of 10 % of I s c (approximately 0.5 A). Figure 11 shows the image obtained from the same PV panel in the plant with the injection of the I s c (approximately 5 A). The EL image of the same PV panel, but obtained previously to be mounted in the plant, in darkness (inside the laboratory), using a power supply, at I s c , is shown in Figure 12.
Some assessments can be made from the previous figures. It could be observed the existence of fractures in many of the cells of Figure 10 and Figure 11 that are not seen in Figure 12. Such fractures are the result of blows during transport or in the installation of the PV panels. For example, highlighted in red, the three figures show a pair of adjacent cells that present a diagonal fracture in the pilot plant, but that did not appear in the PV panel previous to its installation. The same type of fractures can be detected in other cells throughout the PV panel, especially at the edges and less sharply in the centre. These fractures were not carried out consciously, nor was the PV panel hit during its transfer or installation. However, this fact reinforces the need to carry out on-site inspections, without having to disassemble the PV panels and take them to a dark chamber to perform EL.
Regardless of possible damage done in transport and installation, it is confirmed that the device designed for the injection of current into the PV panels is capable of working properly to obtain EL images, both at very low currents (10% of I s c ) and at the working currents of the PV panels ( I s c ). The images obtained indicate that photographs can be obtained with the appropriate quality, and that they obtained photographs highlight the behaviour of the cells. This step is indispensable for the viability of the subsequent capture of EL images with the use of a mobile camera.
Moreover, the proposed procedure using bidirectional inverter allows us to easily perform EL image capture at different currents. A localisable defect with low current intensity is that of potential-induced degradation. This type of panel failure is evidenced by the presence of cells that have a markedly lower brightness than other existing cells. However, at high currents, they have a brightness similar to the rest, so it is not possible to distinguish them. Several examples of this phenomenon can be seen in Figure 10, which are not seen in Figure 11 or Figure 12. Two of these cells have been highlighted in orange in the three previous images.

7. Economic Analysis of Solution Cost

7.1. Solution Cost

This section analyses the extra installation cost of upgrading a new USPVP to allow for the proposed EL maintenance technique. In addition, installation costs will be compared to current plant costs in order to evaluate the additional needed investment. As Section 3 shows, power inverters allow bidirectional power flow; therefore, only some minor additional features have to be added.
Firstly, an inspection control is required in order to perform the new features. Due to the low computational requirements of the needed software, hardware upgrades are not required by the control system. Besides, software development costs will be amortised for all manufactured inverters worldwide, so its impact on the final price will be negligible.
Secondly, the AC pre-charge system is required to apply EL inspections. The device is implemented in the inverter and allows to raise the DC-link voltage from the grid side. Pre-charge is carried out by means of the following components; an auxiliary power transformer to level-up the input voltage, a breaker to activate the pre-charge process, a resistor to limit the peak current and a diode-based bridge to rectify the AC voltage. These components must be chosen for each case, but their cost will not differ significantly. For instance, a grid-tied inverter with an output grid voltage of 400 V, pre-charge system cost would be zero if the PV plant had a functionality that requires it, for example, reactive power injection at night feature; otherwise, it would be approximately 135 according to up to date market values [65,66,67].
Finally, string sequencing requires several breakers in order to energise a small panel area and to minimise the energy consumption. Thus, the number of breakers is not predefined, and its estimation is carried out in the following section.
On the other hand, plant power generation will not be affected as the best accuracy for the EL technique is obtained at night, sunrise or sunset. Thus, the inspection will be carried out during non-productive hours, and therefore there will not be any power production losses and the operational costs of the solution will not increase.

7.2. Economic Optimisation of the Solution

Obviously, choosing the optimal number and size of breakers is an important task, but it is not an easy one. On the one hand, if too many breakers are installed, the initial investment cost will raise significantly. On the other hand, a high number of breakers divide the full plant in smaller areas with a lower energy consumption per test. Moreover, although a higher number of breakers would be required, dividing the plant into smaller sectors will lead to breakers with less power cutting capability and, therefore, cheaper ones. Expression (3) gives a relationship between power and price of the required breakers:
C B r k r = α P N + β
where C B r k r is the unitary cost in €, P N the rated power in k W and α and β are two parameters to establish a linear regression about the cost of breakers in the working range of the selected scenario.
In order to calculate the optimal amount of breakers, an optimisation analysis is going to be carry out in a selected application. For a typical USPVP application using power solar inverters of 1 MW, α and β have been estimated according to current market prices [68,69,70,71,72,73,74] as 1.475 and 325, respectively. Additionally, several costs could be taken into account, but only the exposed above are relevant to this study. These costs are represented by the initial investment and the energy consumption during the inspection process. The investment in breakers ( C 0 ) can be formulated as
C 0 = C B r k r N B r k r
where N B r k r is the amount of breakers, the variable to optimise.
Regarding electricity power consumption, current legislation specifies that two inspections must be performed at 10 % and 100 % of I s c . This cost can be calculated by means of expression (5),
C I n s p = C E n e r g y ( P 10 % I s c + P 100 % I s c ) t N B r k r
where the inspection energy cost per MWp of PV panels installed ( C I n s p ) depends on the energy price ( C E n e r g y ), the power consumed during both tests ( P 10 % I s c and P 100 % I s c ) and the time required to inspect 1 MWp-equivalent-area; moreover, it is inversely proportional to the number of breakers used. Electricity cost is ~10 cent €/kWh [75,76], the energy consumption has been taken from Table 2, and the inspection time using unmanned vehicle techniques is estimated to be ~13 min/MWp.
These costs have been calculated for a one-year period, assuming a plant expected life of 25 years. Furthermore, increasing plant automatisation would improve the capacity to carry out the maintenance tasks, being able to perform inspections more frequently. In this case, it is assumed that an inspection is completed monthly. In order to show the costs on an annual basis, the initial investment ( C 0 ) has been divided for the 25 years of expected plant life; inspection energy cost ( C I n s p ) has been multiplied by 12 annual inspections; and finally, total costs are the sum of both of them. Selected costs are represented in Figure 13, where the minimum cost is found installing 4 or 5 breakers per PV-panel- M W p , which, according to expressions (3) and (4), it represents an investment of 2775 €.
Accordingly to these estimations, the price to adapt a new USPVP to EL inspection can be calculated as the addition of pre-charge cost (135 €) and breaker cost (2775 €), which gives a result of 2910 €. On the other hand, it should be noted that inverters already have a switch to disconnect the panels; so the extra cost will be 2910 € minus the cost of 1-MW-breaker (1800 €), which is an extra cost of 1110 € per MWp. Major studies assert that the average installation cost of a large PV plant is 1112 €/kW [5]. Based on this information, it can be concluded that an increase of 0.10 % on the initial investment would allow the on-site EL maintenance of the PV plant.

8. Discussion

Section 2 compares EL and IRT technology from the point of view of both technique performances. Later, a solution to apply on-site EL maintenance is developed. The technical feasibility of the proposed method is analysed in Section 6. Moreover, Section 7 concludes that the extra cost required to include the direct polarisation feature in a USPVP is no relevant to the cost of these plants. An analysis showing economic viability and the increment over productivity produced by early detection of damaged panels can be carried out in detail, but it is not relevant to reach the main objectives of the study and, therefore, it is out of the paper’s scope.
Finally, Table 3 summarise the comparison between the most important image processing USPVP maintenance methods. As can be seen, IRT and EL could be both used at a low cost, and without incurring in power plant production losses. EL tests require more time to perform the test because it needs a higher image resolution than IRT but, on the other hand, it gives also more information than IRT techniques.

9. Conclusions

The size and rated power of USPVPs have been increasing exponentially in the last decade, increasing the need for optimisation and automation of maintenance processes. Currently, one of the most extended practices in the maintenance of PV panels is the analysis of IRT images. However, as has been explained through the text, IRT technique has some limitations in the detection of defects in PV panels.
One of the most promising techniques to complement the results of IRT tests is the study of EL images. Unfortunately, EL procedures involves dismantling the modules or to use external power supplies and, therefore, they have a high cost and require qualified staff and special equipment.
In this context, the paper has presented a novel USPVP maintenance technique based on on-site EL image acquisition by means of the bidirectional inverters usually installed in USPVPs. The proposed procedure retains the high capability to characterise defects inherent in EL technique, achieving a high automatisation level and, as a consequence, a time and cost reduction.
The behaviour of the system has been calculated by simulation, and has been validated with experimental results in a small-scale PV plant successfully, afterwards. The results confirm the technical feasibility of performing this technique on a USPVP, without the need to uninstall and reinstall the panels for their evaluation. Consequently, on the one hand, the presented technique allows a full evaluation of the plant at a low operational cost, due to the low energy consumption performing the test. Moreover, on the other hand, the technique could be applied to both new and existing plants at a low installation cost, due to the fact that only minor hardware and software changes are needed. In particular, hardware costs of the installation for a real scenario have been calculated, representing a neglecting increment in the plant installation cost per megawatt, and the cost of software modifications is almost zero too, because it is very simple, with low computational requirements, and easy to implement algorithm in any commercial inverter control unit.
In conclusion, the paper has provided a new cheap and valuable solution to improve the maintenance of USPVPs; a method that could be used as an alternative or complementary with IRT technique. Indeed, some resources such as the unmanned vehicle could be shared between the two methods, reducing the overall installation cost for both of them.
Following the evaluation in the pilot-site with successful results, future work will test the solution in a real USPVP, in order to evaluate the solution in an industrial environment.

Author Contributions

Conceptualization, J.B.-F., J.M.-C.-A. and L.H.-C.; methodology, J.M.-C.-A., J.F.S.-O. and L.H.-C.; software, J.B.-F., J.M.-C.-A.; validation, J.B.-F., J.M.-C.-A., L.H.-C. and V.A.-G.; formal analysis, J.B.-F., J.M.-C.-A., L.H.-C. and J.F.S.-O.; investigation, J.B.-F., J.M.-C.-A., L.H.-C. and O.M.-S.; resources, J.B.-F., J.M.-C.-A., V.A.-G., Á.M.-F., J.I.M.-A. and S.G.-S.; data curation, J.B.-F., J.M.-C.-A., V.A.-G., J.I.M.-A., S.G.-S. and Á.M.-F.; writing—original draft preparation, J.B.-F., J.M.-C.-A., L.H.-C. and V.A.-G.; writing—review and editing, J.B.-F., J.M.-C.-A., L.H.-C. and V.A.-G.; visualization, J.B.-F., J.M.-C.-A., J.F.S.-O., L.H.-C. and V.A.-G.; supervision, J.F.S.-O., L.H.-C., O.M.-S. and V.A.-G.; project administration, J.M.-C.-A., J.F.S.-O. and L.H.-C.; funding acquisition, J.M.-C.-A., J.F.S.-O., L.H.-C., V.A.-G. and O.M.-S.; All authors have read and agreed to the published version of the manuscript.

Funding

This research was funded by the “Ministerio de Industria, Economía y Competitividad” grant number “RTC-2017-6712-3” with name “Desarrollo de herramientas Optimizadas de operaCión y manTenimientO pRedictivo de Plantas fotovoltaicas—DOCTOR-PV”. The authors want to thank the support and collaboration of the Centro para el Desarrollo Tecnológico Industrial, E.P.E. (CDTI) funds through the RED CERVERA CER-20191002 “ENERISLA: SISTEMAS ENERGÉTICOS AISLADOS 100% RENOVABLES”. This work has been partially financed by the Junta de Castilla y León under project VA283P18.

Conflicts of Interest

The authors declare no conflicts of interest.

References

  1. European Commission. Europe leads the global clean energy transition: commission welcomes ambitious agreement on further renewable energy development in the EU. Int. Energy Agency 2018, 1, 718. [Google Scholar] [CrossRef]
  2. European Parliament. U targets: More Renewables, Better Energy Efficiency (Video). 2018. Available online: https://www.europarl.europa.eu/news/en/headlines/economy/20181031STO18175/eu-targets-more-renewables-better-energy-efficiency-video (accessed on 19 February 2020).
  3. Agora Energiewende and Sandbag. The European Power Sector in 2017. State of Affairs and Review of Current Developments; 128/02-A-2018/EN; Agora Energiewende and Sandbag: Berlin, Germany, 2018. [Google Scholar]
  4. U.S. Energy Information Administration. Energy Information Administration. Choice Rev. Online 2007, 44, 44–3624. [Google Scholar] [CrossRef]
  5. IRENA. Renewable Power Generation Costs in 2018; International Renewable Energy Agency: Abu Dhabi, UAE, 2019; ISBN 978-92-9260-126-3. [Google Scholar]
  6. InterSolarEurope. Global Market Outlook for Solar Power 2018-2022; InterSolarEurope: Brussels, Belgium, 2018; ISBN 978-908-271-431-9. [Google Scholar]
  7. Rakhshani, E.; Rouzbehi, K.; Adolfo, J.S.; Tobar, A.C. Integration of Large Scale PV-Based Generation into Power Systems: A Survey. Energies 2019, 12, 1425. [Google Scholar] [CrossRef] [Green Version]
  8. SolarInsure. Larges Solar Power Plants of the World; SolarInsure: Costa Mesa, CA, USA, 2019. [Google Scholar]
  9. Wikipedia. Direct and Indirect Band Gaps. Available online: https://en.wikipedia.org/wiki/Direct_and_indirect_band_gaps (accessed on 5 July 2019).
  10. Glavaš, H.; Vukobratović, M.; Primorac, M.; Muštran, D. Infrared thermography in inspection of photovoltaic panels. In Proceedings of the International Conference on Smart Systems and Technologies 2017, Osijek, Croatia, 19 October 2017; pp. 63–68. [Google Scholar] [CrossRef]
  11. Frazão, M.; Silva, J.A.; Lobato, K.; Serra, J.M. Electroluminescence of silicon solar cells using a consumer grade digital camera. Meas. J. Int. Meas. Confed. 2017, 99, 7–12. [Google Scholar] [CrossRef]
  12. Rodriguez, P.; Sera, D.; Teodorescu, R.; Rodriguez, P. PV Panel Model Based on Datasheet Values PV. In Proceedings of the 2007 IEEE International Symposium on Industrial Electronics, Vigo, Spain, 4–7 June 2007; pp. 2392–2396. [Google Scholar] [CrossRef]
  13. PV Performance Modeling Collaborative. Single Diode Equivalent Circuit Models. Available online: https://pvpmc.sandia.gov/modeling-steps/2-dc-module-iv/diode-equivalent-circuit-models/ (accessed on 20 February 2020).
  14. Liu, S.; Dougal, R.A. Dynamic Multi-Physics Model for Solar Array. IEEE Power Eng. Rev. 2002, 22, 66. [Google Scholar] [CrossRef] [Green Version]
  15. Wu, F.; Lin, H.; Yang, Z.; Liao, M.; Wang, Z.; Li, Z.; Gao, P.; Ye, J.; Shen, W. Suppression of surface and auger recombination by formation and control of radial junction in silicon microwire solar cells. Nano Energy 2019, 58, 817–824. [Google Scholar] [CrossRef]
  16. IEA International Energy Agency. Review on Infrared and Electroluminescence Imaging for PV Field Applications; Technical Report IEA-PVPS T13-10:2018, IEA-PVPS Task 13; IEA International Energy Agency: Paris, France, 2018. [Google Scholar]
  17. Waqar Akram, M.; Li, G.; Jin, Y.; Chen, X.; Zhu, C.; Zhao, X.; Aleem, M.; Ahmad, A. Improved outdoor thermography and processing of infrared images for defect detection in PV modules. Solar Energy 2019, 190, 549–560. [Google Scholar] [CrossRef]
  18. Meola, C.; Boccardi, S.; Maria Carlomagno, G. Nondestructive Testing With Infrared Thermography. In Infrared Thermography in the Evaluation of Aerospace Composite Materials; Elsevier: Cambridge, MA, USA, 2017; pp. 85–125. [Google Scholar] [CrossRef]
  19. Botsaris, P.N.; Tsanakas, J.A. Infrared Thermography as an Estimator Technique of a Photovoltaic Module Performance Via Operating Temperature Measurements. In Proceedings of the 10th ECNDT, Moscow, Russia, 7–11 June 2010; pp. 199–202. [Google Scholar]
  20. Ebner, R.; Kubicek, B.; Ujvari, G.; Novalin, S.; Rennhofer, M.; Halwachs, M. Optical characterization of different thin film module technologies. Int. J. Photoenergy 2015, 2015. [Google Scholar] [CrossRef]
  21. Berardone, I.; Lopez Garcia, J.; Paggi, M. Quantitative analysis of electroluminescence and infrared thermal images for aged monocrystalline silicon photovoltaic modules. In Proceedings of the 2017 IEEE 44th Photovoltaic Specialist Conference (PVSC), Washington, DC, USA, 25–30 June 2017; pp. 402–407. [Google Scholar] [CrossRef]
  22. Gallardo-Saavedra, S.; Hernández-Callejo, L.; Alonso-García, M.d.C.; Santos, J.; Morales-Aragonés, J.I.; Alonso-Gómez, V. Failure diagnosis on photovoltaic modules using thermography, electroluminescence, RGB and I-V techniques. In Proceedings of the 36th European Photovoltaic Solar Energy Conference and Exhibition, Marseille, France, 9 September 2019; pp. 1171–1175. [Google Scholar]
  23. Tsanakas, J.A.; Ha, L.; Buerhop, C. Faults and infrared thermographic diagnosis in operating c-Si photovoltaic modules: A review of research and future challenges. Renew. Sustain. Energy Rev. 2016, 62, 695–709. [Google Scholar] [CrossRef]
  24. Salazar, A.M.; Macabebe, E.Q.B. Hotspots Detection in Photovoltaic Modules Using Infrared Thermography. MATEC Web Conf. 2016, 70, 10015. [Google Scholar] [CrossRef] [Green Version]
  25. Jaffery, Z.A.; Dubey, A.K.; Irshad; Haque, A. Scheme for predictive fault diagnosis in photo-voltaic modules using thermal imaging. Infrared Phys. Technol. 2017, 83, 182–187. [Google Scholar] [CrossRef]
  26. Köntges, M.; Kurtz, S.; Packard, C.; Jahn, U.; Berger, K.A.; Kato, K.; Friesen, T.; Liu, H.; Van Iseghem, M. IEA-PVPS T13-01 2014 Review of Failures of Photovoltaic Modules Final; Technical Report IEA-PVPS T13-01:2014, IEA-PVPS Task 13; IEA International Energy Agency: Paris, France, 2014. [Google Scholar]
  27. Deitsch, S.; Christlein, V.; Berger, S.; Buerhop-Lutz, C.; Maier, A.; Gallwitz, F.; Riess, C. Automatic classification of defective photovoltaic module cells in electroluminescence images. Sol. Energy 2019, 185, 455–468. [Google Scholar] [CrossRef] [Green Version]
  28. Ebner, R.; Zamini, S.; Újvári, G. Defect analysis in different photovoltaic modules using electroluminescence (EL) and infrared (IR)-thermography. In Proceedings of the 25th European Photovoltaic Solar Energy Conference and Exhibition/5th World Conference on Photovoltaic Energy Conversion, Valencia, Spain, 6–10 September 2010. [Google Scholar] [CrossRef]
  29. Gallardo-Saavedra, S.; Hernández-Callejo, L.; Alonso-García, M.D.C.; Santos, J.; Morales-Aragonés, J.I.; Alonso-Gómez, V. Nondestructive characterization of solar PV cells defects by means of electroluminescence, infrared thermography, I-V curves and visual tests: experimental study and comparison. Energies 2020. (pending publication). [Google Scholar]
  30. Seth, N.; Goel, V.; Kulkami, R.D. Three phase innovative multilevel inverter topologies for research and industrial applications: A review. In Proceedings of the 2017 International Conference on Nascent Technologies in Engineering, Navi Mumbai, India, 27 January 2017. [Google Scholar] [CrossRef]
  31. Cabrera-Tobar, A.; Bullich-Massagué, E.; Aragüés-Peñalba, M.; Gomis-Bellmunt, O. Topologies for large scale photovoltaic power plants. Renew. Sustain. Energy Rev. 2016, 59, 309–319. [Google Scholar] [CrossRef] [Green Version]
  32. Kjaer, S.; Pedersen, J.; Blaabjerg, F. Power inverter topologies for photovoltaic modules-a review. In Proceedings of the Conference Record of the 2002 IEEE Industry Applications Conference. 37th IAS Annual Meeting (Cat. No.02CH37344), Pittsburgh, PA, USA, 13–18 October 2002; Volume 3, pp. 782–788. [Google Scholar] [CrossRef]
  33. Dogga, R.; Pathak, M.K. Recent trends in solar PV inverter topologies. Sol. Energy 2019, 183, 57–73. [Google Scholar] [CrossRef]
  34. Deshpande, S.; Bhasme, N.R. A review of topologies of inverter for grid connected PV systems. Innov. Power Adv. Comput. Technol. 2018, 2017, 1–6. [Google Scholar] [CrossRef]
  35. Smyth, D. What Is the Best Grid Connected PV Inverter Topology and Why? Technical Report; AC Solar Warehouse. 2016. Available online: www.acsolarwarehouse.com (accessed on 15 February 2020).
  36. Zhao, T.; Bhavaraju, V.; Nirantare, P.; Xu, J. Evaluation of commercial scale transformerless solar inverter technology. In Proceedings of the 2015 IEEE Energy Conversion Congress and Exposition, ECCE 2015, Montreal, QC, Canada, 20–24 September 2015; pp. 5342–5348. [Google Scholar] [CrossRef]
  37. Shehadeh, S.H.; Aly, H.H.; El-Hawary, M.E. An overview of topologies for photovoltaic electrical energy. In Proceedings of the IEEE Electrical Power and Energy Conference, Halifax, NS, Canada, 21–23 August 2013; pp. 1–8. [Google Scholar]
  38. SMA Solar Technology, AG. Sunny Central 1000CP Xt. Technical report. Available online: www.SMA.de (accessed on 20 February 2020).
  39. Schneider Electric Solar. 1500V Context SmartGen. Available online: https://solar.schneider-electric.com/product/conext-smartgen/ (accessed on 20 February 2020).
  40. Ingeteam. INGECON SUN Power (1000V/1500V). Available online: https://www.ingeteam.com/us/en-us/sectors/photovoltaic-energy/p15_24_36/ingecon-sun-power-1000v-1500v.aspx (accessed on 20 February 2020).
  41. ABB Central Inverters, PVS980, 1818 to 2091 kVA—Data Sheet. Available online: http://search.abb.com/library/Download.aspx?DocumentID=3AXD50000027473&LanguageCode=en&DocumentPartId=&Action=Launch (accessed on 20 February 2020).
  42. GPTech. SmartPV. Available online: http://www.greenpower.es/en/gptech-solutions/products/smartpv/#!tab1 (accessed on 20 February 2020).
  43. FreesunHEM | Power Electronics. Available online: https://power-electronics.com/productos/solar-products/freesun-hem/ (accessed on 27 February 2020).
  44. Tayab, U.B.; Bashir, M.A. Multilevel inverter topologies for photovoltaic power system: A review. ARPN J. Eng. Appl. Sci. 2017, 12, 3537–3549. [Google Scholar]
  45. Prabaharan, N.; Palanisamy, K. A comprehensive review on reduced switch multilevel inverter topologies, modulation techniques and applications. Renew. Sustain. Energy Rev. 2017, 76, 1248–1282. [Google Scholar] [CrossRef]
  46. Busquets-Monge, S.; Rocabert, J.; Rodriguez, P.; Alepuz, S.; Bordonau, J. Multilevel Diode-Clamped Converter for Photovoltaic Generators with Independent Voltage Control of Each Solar Array. IEEE Trans. Ind. Electron. 2008, 55, 2713–2723. [Google Scholar] [CrossRef]
  47. Ma, L.; Kerekes, T.; Teodorescu, R.; Jin, X.; Floricau, D.; Liserre, M. The high efficiency transformer-less PV inverter topologies derived from NPC topology. In Proceedings of the 2009 13th European Conference on Power Electronics and Applications, Barcelona, Spain, 8–10 September 2009; pp. 1–10. [Google Scholar]
  48. Burkart, R.; Kolar, J.W.; Griepentrog, G. Comprehensive comparative evaluation of single- and multi-stage three-phase power converters for photovoltaic applications. In Proceedings of the IEEE 34th International Telecommunications Energy Conference (INTELEC), Scottsdale, AZ, USA, 30 September–4 October 2012; pp. 1–8. [Google Scholar]
  49. Tahir, S.; Wang, J.; Baloch, M.H.; Kaloi, G.S. Digital control techniques based on voltage source inverters in renewable energy applications: A review. Electronics 2018, 7, 18. [Google Scholar] [CrossRef] [Green Version]
  50. Muñoz-Cruzado-Alba, J.; Villegas-Núñez, J.; Vite-Frías, J.A.; Carrasco-Solís, J.M.; Galván-Díez, E. New Low-Distortion Q-f Droop Plus Correlation Anti-Islanding Detection Method for Power Converters in Distributed Generation Systems. IEEE Trans. Ind. Electron. 2015, 62, 5072–5081. [Google Scholar] [CrossRef]
  51. Muñoz-Cruzado-Alba, J.; Villegas-Núñez, J.; Vite-Frías, J.A.; Solís, J.M.C. A new fast peak current controller for transient voltage faults for power converters. Energies 2016, 9, 1. [Google Scholar] [CrossRef] [Green Version]
  52. Kalogerakis, C.; Koutroulis, E.; Lagoudakis, M.G. Global MPPT Based on Machine-Learning for PV Arrays Operating under Partial Shading Conditions. Appl. Sci. 2020, 10, 700. [Google Scholar] [CrossRef] [Green Version]
  53. Basha, C.H.; Rani, C. Different conventional and soft computing MPPT techniques for solar PV systems with high step-up boost converters: A comprehensive analysis. Energies 2020, 13, 371. [Google Scholar] [CrossRef] [Green Version]
  54. Costanzo, L.; Vitelli, M. A Novel MPPT technique for single stage grid-connected PV systems: T4S. Energies 2019, 12, 4501. [Google Scholar] [CrossRef] [Green Version]
  55. Tobón, A.; Peláez-restrepo, J.; Montano, J.; Durango, M. MPPT of a Photovoltaic Panels Array with Partial Shading Using the IPSM with Implementation Both in Simulation as in Hardware. Energies 2020, 13, 815. [Google Scholar] [CrossRef] [Green Version]
  56. What is a Combiner Box? Available online: https://power-electronics.com/productos/solar-products/freesun-hem/ (accessed on 27 February 2020).
  57. Solar String Combiner Boxes—ABB Enclosures. Available online: https://new.abb.com/low-voltage/products/enclosures/solar-combiners (accessed on 29 February 2020).
  58. Niccolai, A.; Gandelli, A.; Grimaccia, F.; Zich, R.; Leva, S. Overview on photovoltaic inspections procedure by means of unmanned aerial vehicles. In Proceedings of the 2019 IEEE Milan PowerTech, PowerTech 2019, Milan, Italy, 23–27 June 2019; pp. 1–6. [Google Scholar] [CrossRef]
  59. Luo, X.; Li, X.; Yang, Q.; Wu, F.; Zhang, D.; Yan, W.; Xi, Z. Optimal path planning for UAV based inspection system of large-scale photovoltaic farm. In Proceedings of the 2017 Chinese Automation Congress, CAC 2017, Jinan, China, 20–22 October 2017; pp. 4495–4500. [Google Scholar] [CrossRef]
  60. Sizkouhi, A.M.M.; Esmailifar, S.M.; Aghaei, M.; Vidal de Oliveira, A.K.; Rüther, R. Autonomous Path Planning by Unmanned Aerial Vehicle (UAV) for Precise Monitoring of Large-Scale PV plants. In Proceedings of the 2019 IEEE 46th Photovoltaic Specialists Conference (PVSC), Chicago, IL, USA, 16–21 June 2019; Volume 2, pp. 1398–1402. [Google Scholar]
  61. Cabrera-Tobar, A.; Bullich-Massagué, E.; Aragüés-Peñalba, M.; Gomis-Bellmunt, O. Active and reactive power control of a PV generator for grid code compliance. Energies 2019, 12, 3872. [Google Scholar] [CrossRef] [Green Version]
  62. Marinopoulos, A.; Papandrea, F.; Reza, M.; Norrga, S.; Spertino, F.; Napoli, R. Grid integration aspects of large solar PV installations: LVRT capability and reactive power/voltage support requirements. In Proceedings of the 2011 IEEE PES Trondheim PowerTech: The Power of Technology for a Sustainable Society, POWERTECH 2011, Trondheim, Norway, 19–23 June 2011; pp. 1–8. [Google Scholar] [CrossRef]
  63. Cagnano, A.; De Tuglie, E.; Dicorato, M.; Forte, G.; Trovato, M. PV plants for voltage regulation in distribution networks. In Proceedings of the Universities Power Engineering Conference, London, UK, 4–7 September 2012; pp. 1–5. [Google Scholar] [CrossRef]
  64. IEC International Electrotechnical Commission. IEC TS 60904-13 Photovoltaic Devices-Part 13: Electroluminescence of Photovoltaic Modules; IEC International Electrotechnical Commission: Geneva, Switzerland, 2018. [Google Scholar]
  65. ST 500/69/23 | Transformadores para Panel de Control Block, 230V ac, 500VA, 1 salida | RS Components. Available online: https://es.rs-online.com/web/p/transformadores-de-montaje-en-panel-y-carril-din/7315208/ (accessed on 18 April 2020).
  66. LC1D09BL | Contactor 9 A, 3 NA, Bobina 24 V dc, TeSys D | RS Components. Available online: https://es.rs-online.com/web/p/contactores/4001899/ (accessed on 17 April 2020).
  67. HS200 68R J | Arcol | Resistencias Fijas para Montaje en Panel | RS. Available online: https://es.rs-online.com/web/p/resistencias-fijas-para-montaje-en-panel/6150583/ (accessed on 17 April 2020).
  68. Disyuntor 100A NZMB1-A100 | Eaton | NZMB1-A100 | 259079 | Interruptor potencia protección transfo. eibabo.es. Available online: https://www.eibabo.es/eaton/disyuntor-100a-nzmb1-a100-eb10784156 (accessed on 17 April 2020).
  69. Disyuntor 160A XT2N 160 R160 | ABB | XT2N 160 R160 | 1SDA067058R0001 | Interruptor potencia protección transfo. eibabo.es. Available online: https://www.eibabo.es/abb/disyuntor-160a-xt2n-160-r160-eb17803409 (accessed on 17 April 2020).
  70. Disyuntor 250A XT4N 250 EKIP LS/I | ABB | XT4N 250 EKIP LS/I | 1SDA068147R0001 | Interruptor potencia protección transfo. eibabo.es. Available online: https://www.eibabo.es/abb/disyuntor-250a-xt4n-250-ekip-ls-i-eb12102121?fs=4278333618 (accessed on 17 April 2020).
  71. Disyuntor 400A T5N000040E02403 | ABB | T5N000040E02403 | 1SDA054317R0001 | Interruptor potencia protección transfo. eibabo.es. Available online: https://www.eibabo.es/abb/disyuntor-400a-t5n000040e02403-eb12102118 (accessed on 17 April 2020).
  72. Disyuntor 400A NZMN3-AE400 | Eaton | NZMN3-AE400 | 259114 | Interruptor potencia protección transfo. eibabo.es. Available online: https://www.eibabo.es/eaton/disyuntor-400a-nzmn3-ae400-eb10703722?fs=2659164480 (accessed on 17 April 2020).
  73. Disyuntor 1000A 33241 | Schneider Electric | 33241 | Interruptor potencia protección transfo. eibabo.es. Available online: https://www.eibabo.es/schneider-electric/disyuntor-1000a-33241-eb15803670 (accessed on 17 April 2020).
  74. Disyuntor 1000A IZMX16N3-V10F-1 | Eaton | IZMX16N3-V10F-1 | 183333 | Interruptor potencia protección transfo. eibabo.es. Available online: https://www.eibabo.es/eaton/disyuntor-1000a-izmx16n3-v10f-1-eb17403569 (accessed on 17 April 2020).
  75. Fu, R.; Feldman, D.; Margolis, R. U.S. Solar Photovoltaic System Cost Benchmark: Q1 2018; NREL: Golden, CO, USA, 2018; pp. 1–47. [Google Scholar] [CrossRef]
  76. EIA. Cost and Performance Characteristics of New Generating Technologies. In Annual Energy Outlook 2019; EIA: Washington, DC, USA, 2019; Volume 2019, pp. 1–3. [Google Scholar]
Figure 1. Classic electric model of photovoltaic (PV) panel (a) and light I–V (LIV) and dark I–V (DIV) curves of a standard 36 PV cell module according to the work in [14] (b).
Applsci 10 03084 g001
Figure 2. Representative power inverter topologies for utility-scale photovoltaic plants (USPVPs) applications: (a) two-level three-phase inverter, (b) three-level three-phase NPC I-type inverter, (c) three-level three-phase neutral point clampled (NPC) T-type inverter, (d) three-level three-phase flying capacitor inverter and (e) three-level three-phase NPC I-type modified inverter.
Applsci 10 03084 g002
Figure 3. Main control diagram of a photovoltaic (PV) inverter controller: in blue are marked the high-level control blocks related to the maximum power point tracking (MPPT) and electroluminescence (EL) evaluation working modes.
Applsci 10 03084 g003
Figure 4. Proposed communication scheme for the implementation of EL maintenance technique in USPVPs.
Applsci 10 03084 g004
Figure 5. Complete system flow diagram for the maintenance of USPVPs.
Applsci 10 03084 g005
Figure 6. Panels with several defects used in the pilot plant (a), and connection diagram between panels and the inverter (b).
Applsci 10 03084 g006
Figure 7. Bidirectional inverter developed for the direct polarization of the panels (a), and inverter installed in the demo site facilities (b).
Applsci 10 03084 g007
Figure 8. Controller response to a pulse of 200 ms under different irradiance conditions—DIV (1 W/m 2 ) and LIV (800 W/m 2 )—and for several current references scenarios.
Applsci 10 03084 g008
Figure 9. Experimental results: current set-point changed from 5 A to 0.5 A .
Applsci 10 03084 g009
Figure 10. EL image of the 0.5 A PV panel ( 10 % I s c ) in the pilot plant. Capture made with the camera fixed on a tripod.
Applsci 10 03084 g010
Figure 11. EL image of the 5 A PV panel ( 100 % I s c ) in the pilot plant. Capture made with the camera fixed on a tripod.
Applsci 10 03084 g011
Figure 12. EL image of a the same PV panel, to at I s c , previous to be installed in the plant (indoors and with the use of a power supply). Capture made with the camera fixed on a tripod.
Applsci 10 03084 g012
Figure 13. Annual prorated costs resulting from the EL maintenance application for installed MWp for the selected use case.
Applsci 10 03084 g013
Table 1. Behaviour of PV panels under different conditions during direct polarisation: Daytime (800 W/m 2 ) and Night-time (1 W/m 2 ).
IrradianceDaytimeNighttime
Current (A)0.512.550.512.55
Voltage (V)461464475490401418446472
Avg. power (W)2314651186244520041911142359
Table 2. Behaviour of PV panels under different conditions during direct polarisation: Daytime (800 W/m 2 ), Night-time (1 W/m 2 ).
IrradianceDaytimeNighttime
Current (A)0.512.550.512.55
Voltage (V)462468486512439460498528
Power (W)2314681215256022046012452640
Table 3. Features and costs comparison between state of the art and proposed USPVP image processing methods.
TechnologyIlluminated IRTDark IRTOff-site ELOn-site EL
Feature
Implementation test cost+++++++
Plant production losses--+++-
Results accuracy+++++++++
Time per test+++++++
-: null, +: low, ++: moderate, +++: high, ++++: very high.

