Article

Guided Waves for Damage Detection in Complex Composite Structures: The Influence of Omega Stringer and Different Reference Damage Size

1
Department of Physics, Goethe University, 60438 Frankfurt, Frankfurt am Main, Germany
2
Department of Mechanical Engineering, University of Siegen, 57076 Siegen, Germany
3
Institute of Composite Structures and Adaptative Systems, Multifunctional Materials, German Aerospace Center (DLR), 38108 Braunschweig, Germany
4
Measurement Systems and Monitoring, Faserinstitut Bremen e.V. (FIBRE), 28359 Bremen, Germany
*
Author to whom correspondence should be addressed.
Appl. Sci. 2020, 10(9), 3068; https://doi.org/10.3390/app10093068
Submission received: 7 April 2020 / Revised: 20 April 2020 / Accepted: 21 April 2020 / Published: 28 April 2020
(This article belongs to the Special Issue Guided Wave-Based Damage Identification for Composite Structures)

Abstract

:
The third dataset dedicated to the Open Guided Waves platform aims at carbon fiber composite plates with an additional omega stringer at constant temperature conditions. The two structures used in this work are representative for real aircraft components. Comprehensive measurements were recorded in order to study (I) the impact of the omega stringer on guided wave propagation, and (II) elliptical reference damages of different sizes located at three separate positions on the structure. Measurements were recorded for narrowband excitation (5-cycle toneburst with varying carrier frequencies) and broadband excitation (using chirp waveforms). The paper presents the results of a technical validation including numerical modelling, and enables further research, for example related to probability of detection (POD) analysis.

1. Introduction

Modern technical structures are presently often constructed as fiber reinforced composites due to their low weight, high strength and superior fatigue behavior. Examples include aircraft structures, wind turbine blades, ship components and automotive structures. Structural health monitoring (SHM) systems have been researched for more than 20 years to improve safe operation, to reduce safety factors in the structural design and to avoid unnecessary maintenance tasks [1]. Several techniques were proposed in the literature to detect damage in complex composite structures, including acoustic emission [2], low-frequency vibrations [3] and X-ray computed tomography [4]. One promising SHM concept for thin-walled structures is based on ultrasonic guided waves (GW). Dienel et al. have shown that such an SHM system has the potential of saving 5% of the structural mass of a vertical tail plane [5]. Applying this analysis to the whole aircraft fuel consumption could be reduced by roughly 1.8%.
The advantages of GW are the ability to propagate over long distances without substantial attenuation and their high sensitivity to stiffness changes within the structure because of damages. On the other hand, GW are dispersive and occur multimodally [6,7,8,9]. This makes signal analysis to detect damage challenging and a good understanding of the phenomenology of GW propagation is needed. Simulation models can help to establish this understanding and additionally support signal evaluation. For this purpose, however, these numerical models must be validated.
For the further development of GW-SHM systems an important challenge is the lack of public, freely and permanently available, high-quality and well-documented benchmark datasets. In particular, the measurements should be performed on specimens of different complexity in order to validate the wide range of numerical methods [10] and signal processing methods. In recent years, such data sets with different focus were provided, e.g., by Moll et al. [11,12] and Marzani et al. [13].
The central questions regarding the practical deployment of GW-based diagnostics are given (i) by the relative performance of existing and novel SHM methods, and (ii) by the performance relative to competing non-destructive testing (NDT) techniques. Here, the performance e.g., can be given in terms of damage detection sensitivity or localization accuracy. These questions should ideally be tackled by using an open dataset, because there exist significant differences in the published modelling procedures or the manner in which experiments were conducted.
Due to this variability, a fair assessment of performance results is not feasible. This article presents an amendment to the Open Guided Waves (OGW, www.openguidedwaves.de) online platform whose datasets might be considered to be a reference standard. Through OGW existing algorithms for signal analysis used in SHM and GW field processing can be compared without uncertainties because of varying measurement equipment or different transducer technologies. Also the platform can serve engineers or researchers with appealing ideas but without access to expensive instrumentation. This potentially will lead to a stronger transdisciplinary cooperation between the scientific and technical fields in order to promote GW-based SHM technology.
The OGW platform aims to provide relevant data sets for GW-based SHM of thin-walled structures. In previous works, benchmark measurements were recorded on the so-called wave field plate with one piezoelectric transducer placed in the center [11]. A 3D scanning laser Doppler vibrometer (SLDV) recorded the acoustic wave field on a spatial grid of measurement points. In addition, measurements from the SHM plate were taken based on an array of twelve piezoelectric transducers, see [11,12]. Both plates were made of carbon fibre reinforced plastics (CFRP). Generally, fiber composites have typically anisotropic material properties which affect the group velocity of GW. Because the measurement setup was motivated by an aircraft-related structural element a typical quasi-isotropic material was used for both plates. Therefore, no significant direction dependency for the group velocity was measured. Li et al. [14] show that anisotropic effects are very pronounced for uni-directional and cross ply laminates. As in [15] it is shown by Wang et al., that for quasi-isotropic layups and frequencies below the higher order GW modes, the group velocity is approximately direction-independent.
In contrast to the previous datasets, an omega stringer was attached to both plates for representative aircraft components. The plates are again made of quasi-isotropic material, so that no anisotropic effects occur. Since measurements from the flat structure and the structure with the stringer are available, it is possible to analyse the scattering behaviour of guided waves at the stringer. For excitation a conventional narrowband toneburst, so as to reduce the impact of frequency dispersion similar to [16,17], and a broadband chirp signal was used as presented in [18,
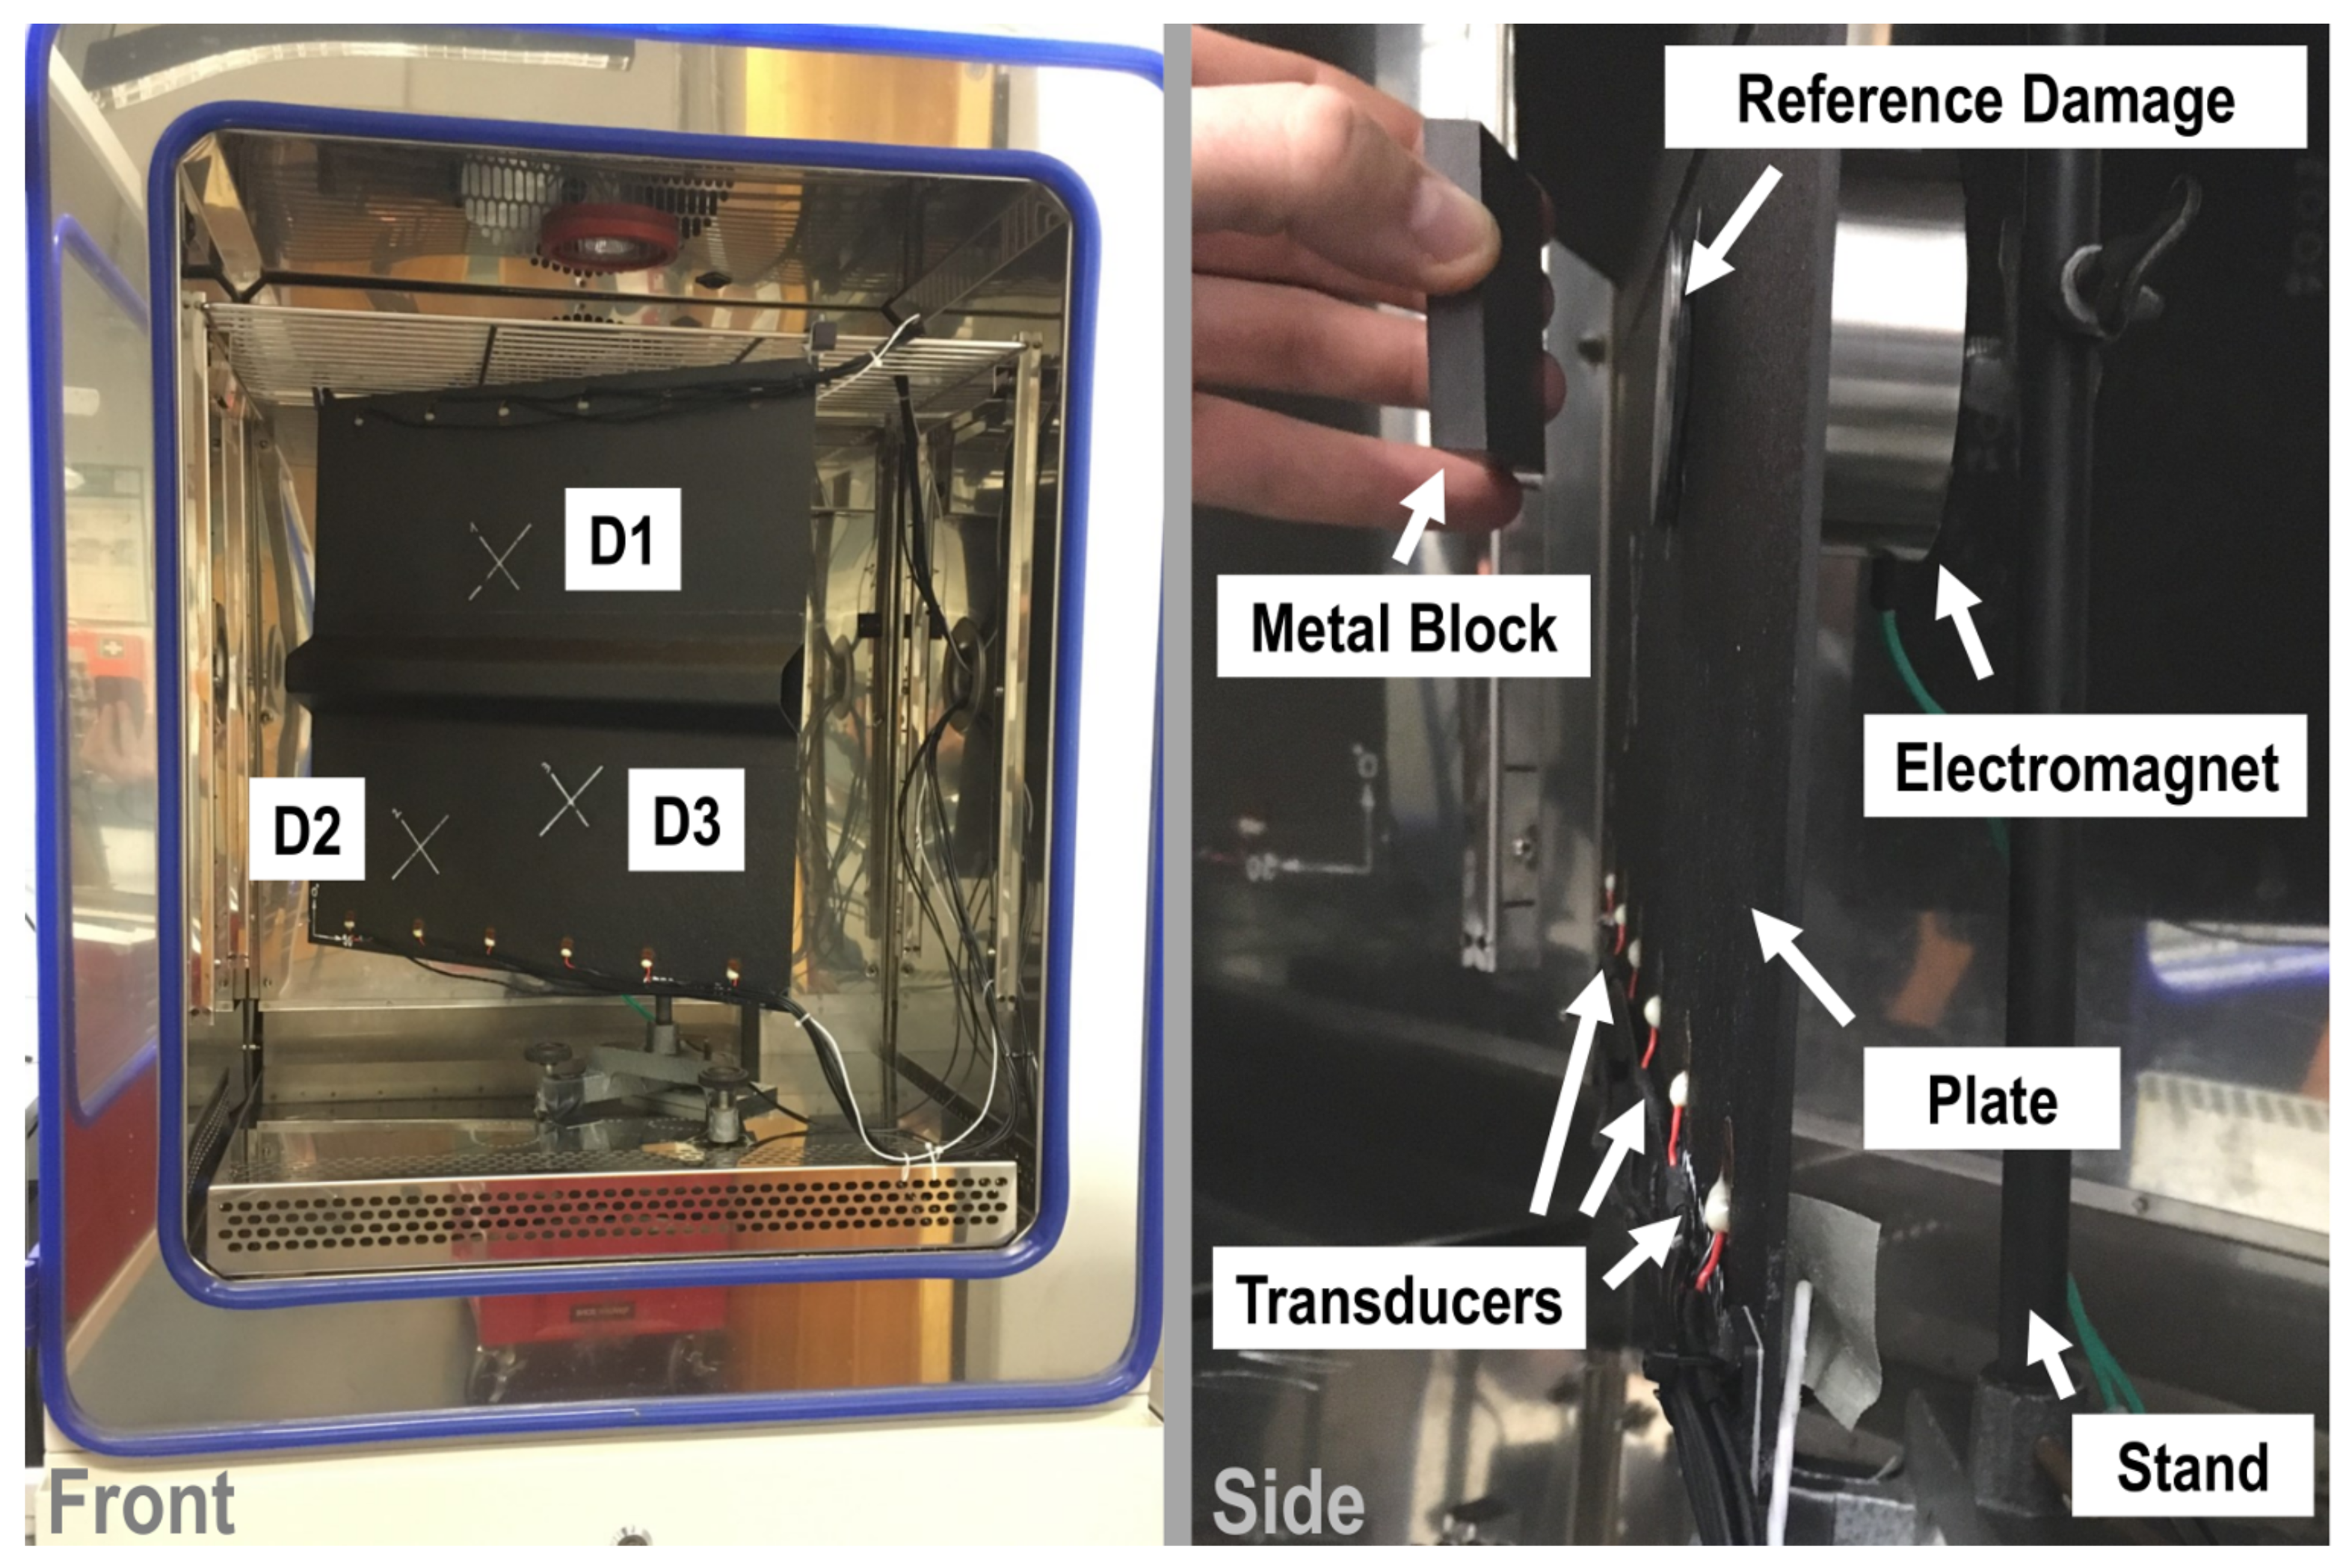
19]. Since GW-based SHM tests are limited by the high instrumentation effort and enormous costs, we have studied a reversible reference damage that could be attached to the plates surface [20,21]. A representative damage is used, which is easy to model in numerical simulation and experiment. The representative damage is necessary to evaluate SHM systems in a standardized way. It should be able to represent the key features of the damage (size, interaction with the excited GW-modes and stiffness change). For this purpose, an elliptically shaped damage was chosen. Its size is motivated by the projected surface of real impacts. The reference damage has been placed at different locations on the structure in order to study spatially distributed probability of detection (POD) of GW-based SHM-systems [22].
The goal of the paper is to provide
  • measurements supporting current state-of-the-art GW-based SHM research for model-based POD [23,24,25,26,27],
  • a dataset with multiple damage sizes for model validation,
  • a finite shell element-based model as starting point for numerical model validation.
The remainder of the paper is organized in the following way: Section 2 presents the CFRP (carbon fiber reinforced plastics) structures with stringers as well as the elliptical reference damage model. After that, Section 3 introduces the experimental setup for the SHM plate and the wave field plate with stringer element. Results derived from those measurements are presented in Section 4. Section 5 gives an overview of the modeling approach and some results for comparison. Finally, conclusions are drawn at the end.

2. Description of the Test Structures

2.1. CFRP Structures with Stringers

Two CFRP plates were manufactured with a dimension of 550 mm × 550 mm and a nominal thickness of 2 mm. The corresponding ply thickness is 0.125 mm. The plates were manufactured with the prepreg Hexply® M21/34%/UD134/T700/300 with a quasi-isotropic (QI) layup of [ 45 / 0 / 45 / 90 / 45 / 0 / 45 / 90 ] S . The material properties of a single unidirectional layer were measured based on standard test procedures [11]. They are listed in Table 1. The omega stringer was manufactured separately using the prepreg Hexply® M21/34%/UD194/T700/IMA-12K. The stringer was built also in a quasi-isotropic layup [ 45 / 0 / 90 / 45 / 90 / 45 ] S with the dimensions depicted in Figure 1. The nominal thickness is 1.5 mm with a ply thickness of 0.125 mm. The material properties are listed in Table 2. Secondary bonding using Loctide Hysol 9466 fixed the omega stringers to the plates. The adhesive was cured in vacuum and at room temperature. A photo of both specimens with stringer including the material reference system is shown in Figure 2. Twelve piezoceramic transducers were applied to the plate. Their positions are shown in Figure 3 and listed for the SHM plate in Table 3.

2.2. Elliptical Reference Damage Model

For composite structures in the aviation industries, the relevant design-driving damage types can be narrowed down to accidental damages, as the others are highly unlikely to occur [28]. For the currently appointed visual inspection, allowable damage limits are generally described in terms of dent depth or projected damage area. Tolerable damage sizes are specifically defined for each airframe part. Damages equal to or larger than this threshold are assumed to reduce the residual strength and must therefore be reliably detected by scheduled or directed field inspections. In a standard aerospace application a residual strength analysis is not performed. This is because airlines do not have the material information and critical load cases of the structure to perform such analysis. In the current operational process, all deliminations are surrounded by an ellipse and the area of the ellipse is determined. This area is compared with values of the maintenance manual provided by the aircraft manufacturer. If the area is defined as critical, the structure has to be repaired or replaced. Based on the currently implemented certification, damage assessment approaches requires repair action for projected damages beyond 600 mm2 [29,30]. An example of a projected damage is given in Figure 4. The example is taken from [31]. In this thesis, a model-based evaluation of different impact damages was performed. For this purpose, an automated mapping software (DaMapper) was developed. The software used standard ultrasonic measurement technique and determines the delaminations between layers. The measurement was performed at the German Aerospace Center with a Hillgus system equipped with an Olympus V309-2 transducer; 5 MHz sampling rate and 0.25–0.25 mm measurement grid resolution [31]. Figure 4 shows delaminations between 12 interfaces from a fourteen layer CFRP composite [45/0/135/90/135/0/45]S caused by a 20 J impact. The surrounding ellipse illustrates the projected damage area.
In this paper, we consider a reversible damage model and demonstrate its application for the reliability assessment of a GW-based SHM system. A metallic disc is used that is attached to the composite structures by a tacky tape as introduced in [20]. The reference damage are not tuned to real impacts. This would require a distribution function of the most frequently occurring impact damages. However, the application of the reference damage to the outside causes a stiffness asymmetry and despite its simplified shape, the interaction with GW is similar in terms of decrease in amplitude, change in time of flight [21] and mode conversion [7]. Thirteen different sizes of the reference damage at three locations are considered, cf. Figure 5a,b. Six sizes above and below the 600 mm2 area are used to model stiffness changes causing a relevant reduction of residual strength. Figure 5c shows the reference damages made of steel after manufacturing.

3. Description of the Experimental Setups

3.1. Experimental Setup for the SHM Plate

Figure 6 depicts the experimental setup. The SHM plate is placed in a climate chamber (left figure) at a constant target temperature of 23 °C and a relative humidity of 50% (DIN EN ISO 291). On the top and bottom of the structure, two Pt-100 temperature sensors were attached to the surface of the SHM plate to detect potential thermal gradients within the climate chamber. The temperature sensors were coupled to a PT-104A device (Omega Engineering, Deckenpfronn, Germany) which enables temperature measurements with a resolution of 0.001 °C and an accuracy of 0.01 °C.
For GW actuation, piezoceramic transducers are used to excite the signal. A Handyscope HS5 (TiePie Engineering) is employed to generate arbitrary waveforms and to record signals by analog-to-digital conversion (14 bit resolution). A broadband amplifier PD200 (PiezoDrive Ltd, Shortland, NSW 2307, Australia) enhances the excited waveforms and feeds the signals to a dedicated multiplexing device that is described in greater detail in [32]. This custom device is also used to measure all actuator-receiver pairs by time-division multiplexing. A sine with five cycles was Hann-windowed which is represented by w ( t ) in the subsequent formula
U ( t ) = U ^ w ( t ) sin ( 2 π f c t ) .
The voltage amplitude was defined as U ^ = 100 V. The central frequency f c is in a range from 40 kHz to 260 kHz in steps of 20 kHz. Moreover, a broadband excitation was used (see Figure 7), namely a linear up-chirp with 0.125 ms duration, start frequency of 20 kHz and stop frequency of 500 kHz. The structured process of data acquisition regarding the SHM plate consists of seven phases. For measurements with reference damage, only a single defect D 1 , D 2 or D 3 was used at the same time.
  • Phase 1
Five baseline measurements of the pristine structure were recorded.
  • Phase 2
Reference defects were attached to the plate at position D 1 , see Table 4. For maximum reliability an electromagnet supported by a metal block was used to press the reference damage to the structure. In a next step, the electromagnet was removed so that only the reference damage was in contact with the structure. For every of the 13 damage sizes and each damage position, the measurement was repeated independently five times. Each time the procedure includes the following steps: fixation of the model defect with tacky tape, measurement, detaching, removal of tacky tape, renewed fixation.
  • Phase 3
Another 5 baseline measurements were recorded without any applied reference damage.
  • Phase 4
The damage positions D 2 , see Table 4, was considered and the procedure of phase 2 was followed.
  • Phase 5
Another 5 baseline measurements were recorded without any applied reference damage.
  • Phase 6
The damage positions D 3 , see Table 4, was considered and the procedure of phase 2 was followed.
  • Phase 7
Finally, in the last phase, five baseline measurements were acquired.
The temperature in the climate chamber showed a standard deviation of 0.12 °C (sensor on top), 0.08 °C (sensor at the bottom) and an average temperature gradient between both temperature sensors of 0.49 °C. All datasets were saved in a HDF5 container file format. Experimentation was carried out sequentially by two independent persons.

3.2. Experimental Setup for the Wave Field Plate

The experimental setup for the wave field plate measurements is shown in Figure 8. The wave field was recorded by a 3D scanning laser Doppler vibrometer PSV-400-3D from Polytec GmbH (Waldbronn, Germany) with an additional PCI 6110 National Instruments measurement card to increase the sample rate to 2.56 MHz. In a first step, the full wave field is captured, as described in Ref. [11] and indicated by the purple region in Figure 3b. Next, a B-scan is recorded vertically to assess the influence of the stringer on the acoustic wavefield (marked in red in the same figure). All measurement parameters of the 3D scanning laser Doppler vibrometer (SLDV) are listed in Table 5. The temperature was measured before every 3D-LDV measurement with a GTH 1200 (Greisinger electronic) with an accuracy of 0.1 °C.
The coordinates of the piezoelectric actuator and the reference damage locations are listed in Table 6. This table also includes information on the omega stringer placement and the measurement area. The properties of the excitation signals are listed in Table 7. The arbitrary signals were generated by an (Agilent, Santa Clara, CA 95051, United States) 33500 B and amplified by a (Falco, 2225 TH Katwijk aan Zee, The Netherlands) Systems WMA-300 5 MHz high voltage amplifier. The reference damage was attached to the structure in the same way as in the SHM measurements.

4. Results

4.1. SHM Plaate with Stringer

The following analysis is subdivided into two parts: First, the damage detection results are presented followed by a comparison between the SHM plate (OGW1 dataset from Ref. [11]) and the SHM plate with stringer (OGW3 dataset from the present work). Finally, tomographic image reconstructions for different damage sizes are presented.

4.1.1. Comparison of SHM Plate and SHM Plate with Omega Stringer

To study the influence of the omega stringer to the ultrasound signals the SHM plate without and the SHM plate with stringer are analysed. Both plates are made of the same composite layup as described in Section 2.1. Figure 9 presents the comparison between the measurements for f c = 260 kHz of both plates. Addtional results are provided in the datasets available at the OGW website. In this example, the first transducer T 1 is the actuator and all other transducers T 2 T 12 serve as receivers. The influence of the stringer can be clearly identified especially for receivers T 7 T 12 that are located on the opposite side of the stringer. The amplitude of the sensor signals at the excitation side are larger, and smaller for the opposing side for the SHM plate with stringer. This is due to reflections at the stringer.

4.1.2. Detectability of Damage

The starting point for the analysis of the measurement data obtained from the SHM plate is shown in Figure 10. This visualization contains a full analysis of the complete SHM-dataset by means of the signal energy of the differential signal. Therefore, the average signals of the 20 baseline measurements for each actuator-sensor pair serves as reference. The arrows on top indicate the baseline state (B) and the damage states D 1 to D 3 . An increasing damage indicator can be seen for each structural condition due to the increasing damage size.
In addition, we have considered the signal energy to evaluate the differences between the 20 baseline measurements u i , j B [ t ] and the measurements for damage D 1 to D 3 represented by u i , j [ t ] . The index i denotes the i-th actuator and the index j the j-th receiver. We have first bandpass-filtered the data—separately for each transmitter-receiver pair— and computed the average from all baseline measurements. In a next step, the signal energy of the differential signal E ( i , j ) for each reference damage size was computed according to:
E ( i , j ) = k = 1 N ( u i , j [ t k ] u i , j B [ t k ] ) 2 .
In this equation, the variable N denotes the number of time domain samples.
Figure 11 shows the analysis of this metric for three representative actuator-sensor combinations. The differential signal E ( i , j ) is plotted over the damage size. It must be noted, that each damage size has 5 samples in this graph for the 5 separately performed measurements. The biggest changes in E ( i , j ) are in the pairings where the reference damage lies on the vertical line between the transducers. Moreover, the metric increases in proportion to the damage size so that the proposed reference damage seems to be a good candidate for reliability assessment of GW-SHM systems. Since a reference damage with a stepwise adjustable size was used, the corresponding damage metric should also have a step-like behaviour as shown in the beginning for the reference damage D 2 . However, the metric is still sensitive to the repeating application of the reference damage leading to fluctuations. In conclusion, the E ( i , j ) curve is a robust indicator for damage occurence.

4.1.3. Tomographic Damage Imaging

In this section, we apply the reconstruction algorithm for probabilistic inspection of damage (RAPID) described in [33] for the analysis of tomographic damage imaging. Instead of the signal difference coefficient used in the original implementation, we have used Equation (2) to weight the contribution of each transducer path. Analog to Ref. [11] we have considered only those measurements in the analysis where the transducer pairs are on opposite sides (top and bottom).
Tomographic images for damage D 1 and the case of 60 kHz are shown in Figure 12 for four different damage sizes. It can be clearly seen that the peak intensity increases with damage size. This observation confirms the previous results reported in Figure 10 and Figure 11. In addition, processing all 65 tomographic images reveals a clear rising trend in the peak intensity at the damage location D 1 as shown in Figure 13.

4.2. Wave Field Plate with Stringer

The wave field measurements aim at the analysis of the ultrasound scattering at the reference damage that has stepwise adjustable size. Moreover, the influence of the stringer will be investigated.

4.2.1. Comparison of Wave Propagation of Wave Field Plate with and Without Stringer

A study was performed with the SLDV to show the influence of the applied omega stringer. Therefore, a B-scan was recorded along the entire plate and perpendicular to the omega stringer. The corresponding time-distance representation is shown in Figure 14 for different frequencies and excitation signals. The chirp signals were pulse-compressed using a matched filter. Moreover, the envelope of the signal was applied before imaging [34]. A logarithmic scale was used to increase the image dynamic.
The dashed black lines indicate the position of the actuator on the plate (y = 0.25 m); the dashed red lines show the contact area between the stringer and the plate. As soon as the first wave hits the stringer area, a reflection can be detected at any center frequency. A second and third reflection can be detected at the second, respectively the third, impedance discontinuity caused by the bonded stringer. This effect is more pronounced at lower frequencies. This study demonstrates the influence of the omega stringer on the wave propagation. In principle, prediction of frequency-selective reflection and attenuation is challenging, because it depends on the exact boundary conditions of a discontinuity, such as the bonding of a stringer. However, from the study of tapered waveguides, it is known that the change of thickness, e.g., due to the foot of a stringer, can lead to a frequency-selective velocity alteration in the S 0 -mode [35] and A 0 -mode [36].
The phenomenon of wave mode conversion at adhesively bonded joints was studied in [37,38]. A detailed understanding of the geometry and material as well as geometric discontinuities or transitions is of high importance. The SLDV studies performed in this work also reveals wave mode conversion that can be seen in Figure 14f. The A 0 -mode and S 0 -mode can be identified by their different group velocities, which is represented by the slope of the propagating waves in the B-scan. The group velocity of the wave changes when the faster symmetric mode hits the stringer (40 μs). This is shown in the change of the wave front in Figure 14f. Beneath the stringer, the formerly S 0 -mode burst was converted almost completely to a slower A 0 -mode.

4.2.2. Detectability of Damage

The acoustic wave field recorded by the SLDV is processed with the root mean square (RMS) metric resulting in a scalar value for each measurement point [39]. Mathematically, the RMS-map for a plate with the positions x and y can be defined as:
R M S ( x , y ) = 1 N k = 1 N s [ t k , x , y ] 2 .
In this equation, N denotes the number of sampling points. The RMS-maps for the baseline condition and selected reference damage scenarios are shown in Figure 15. For a better comparison, those images were normalized to the maximum RMS value to have a range from R M S = 0 to R M S = 1 . The yellow dot in the upper right corner of every RMS-map represents the location of the actuator and has the normalized amplitude of R M S = 1 . The deep blue area (normalized R M S = 0 ) in the middle of the structure represents the reference damage position. The radially extending shades in the RMS-maps can be considered as artefacts coming from the SLDV. The reference damage locations can be clearly identified. However, for the largest reference damage the map underestimates the actual size. This effect probably comes from a reduced contact pressure generated by the electromagnet for larger damage sizes.

5. Finite Element Reference Model

For analysis purposes, a simplified finite element shell model of the SHM-plate was created. As Kudela and Ostachowicz showed, shell elements are valid for the frequency domain (under the first cut off frequency) considered in this analysis [
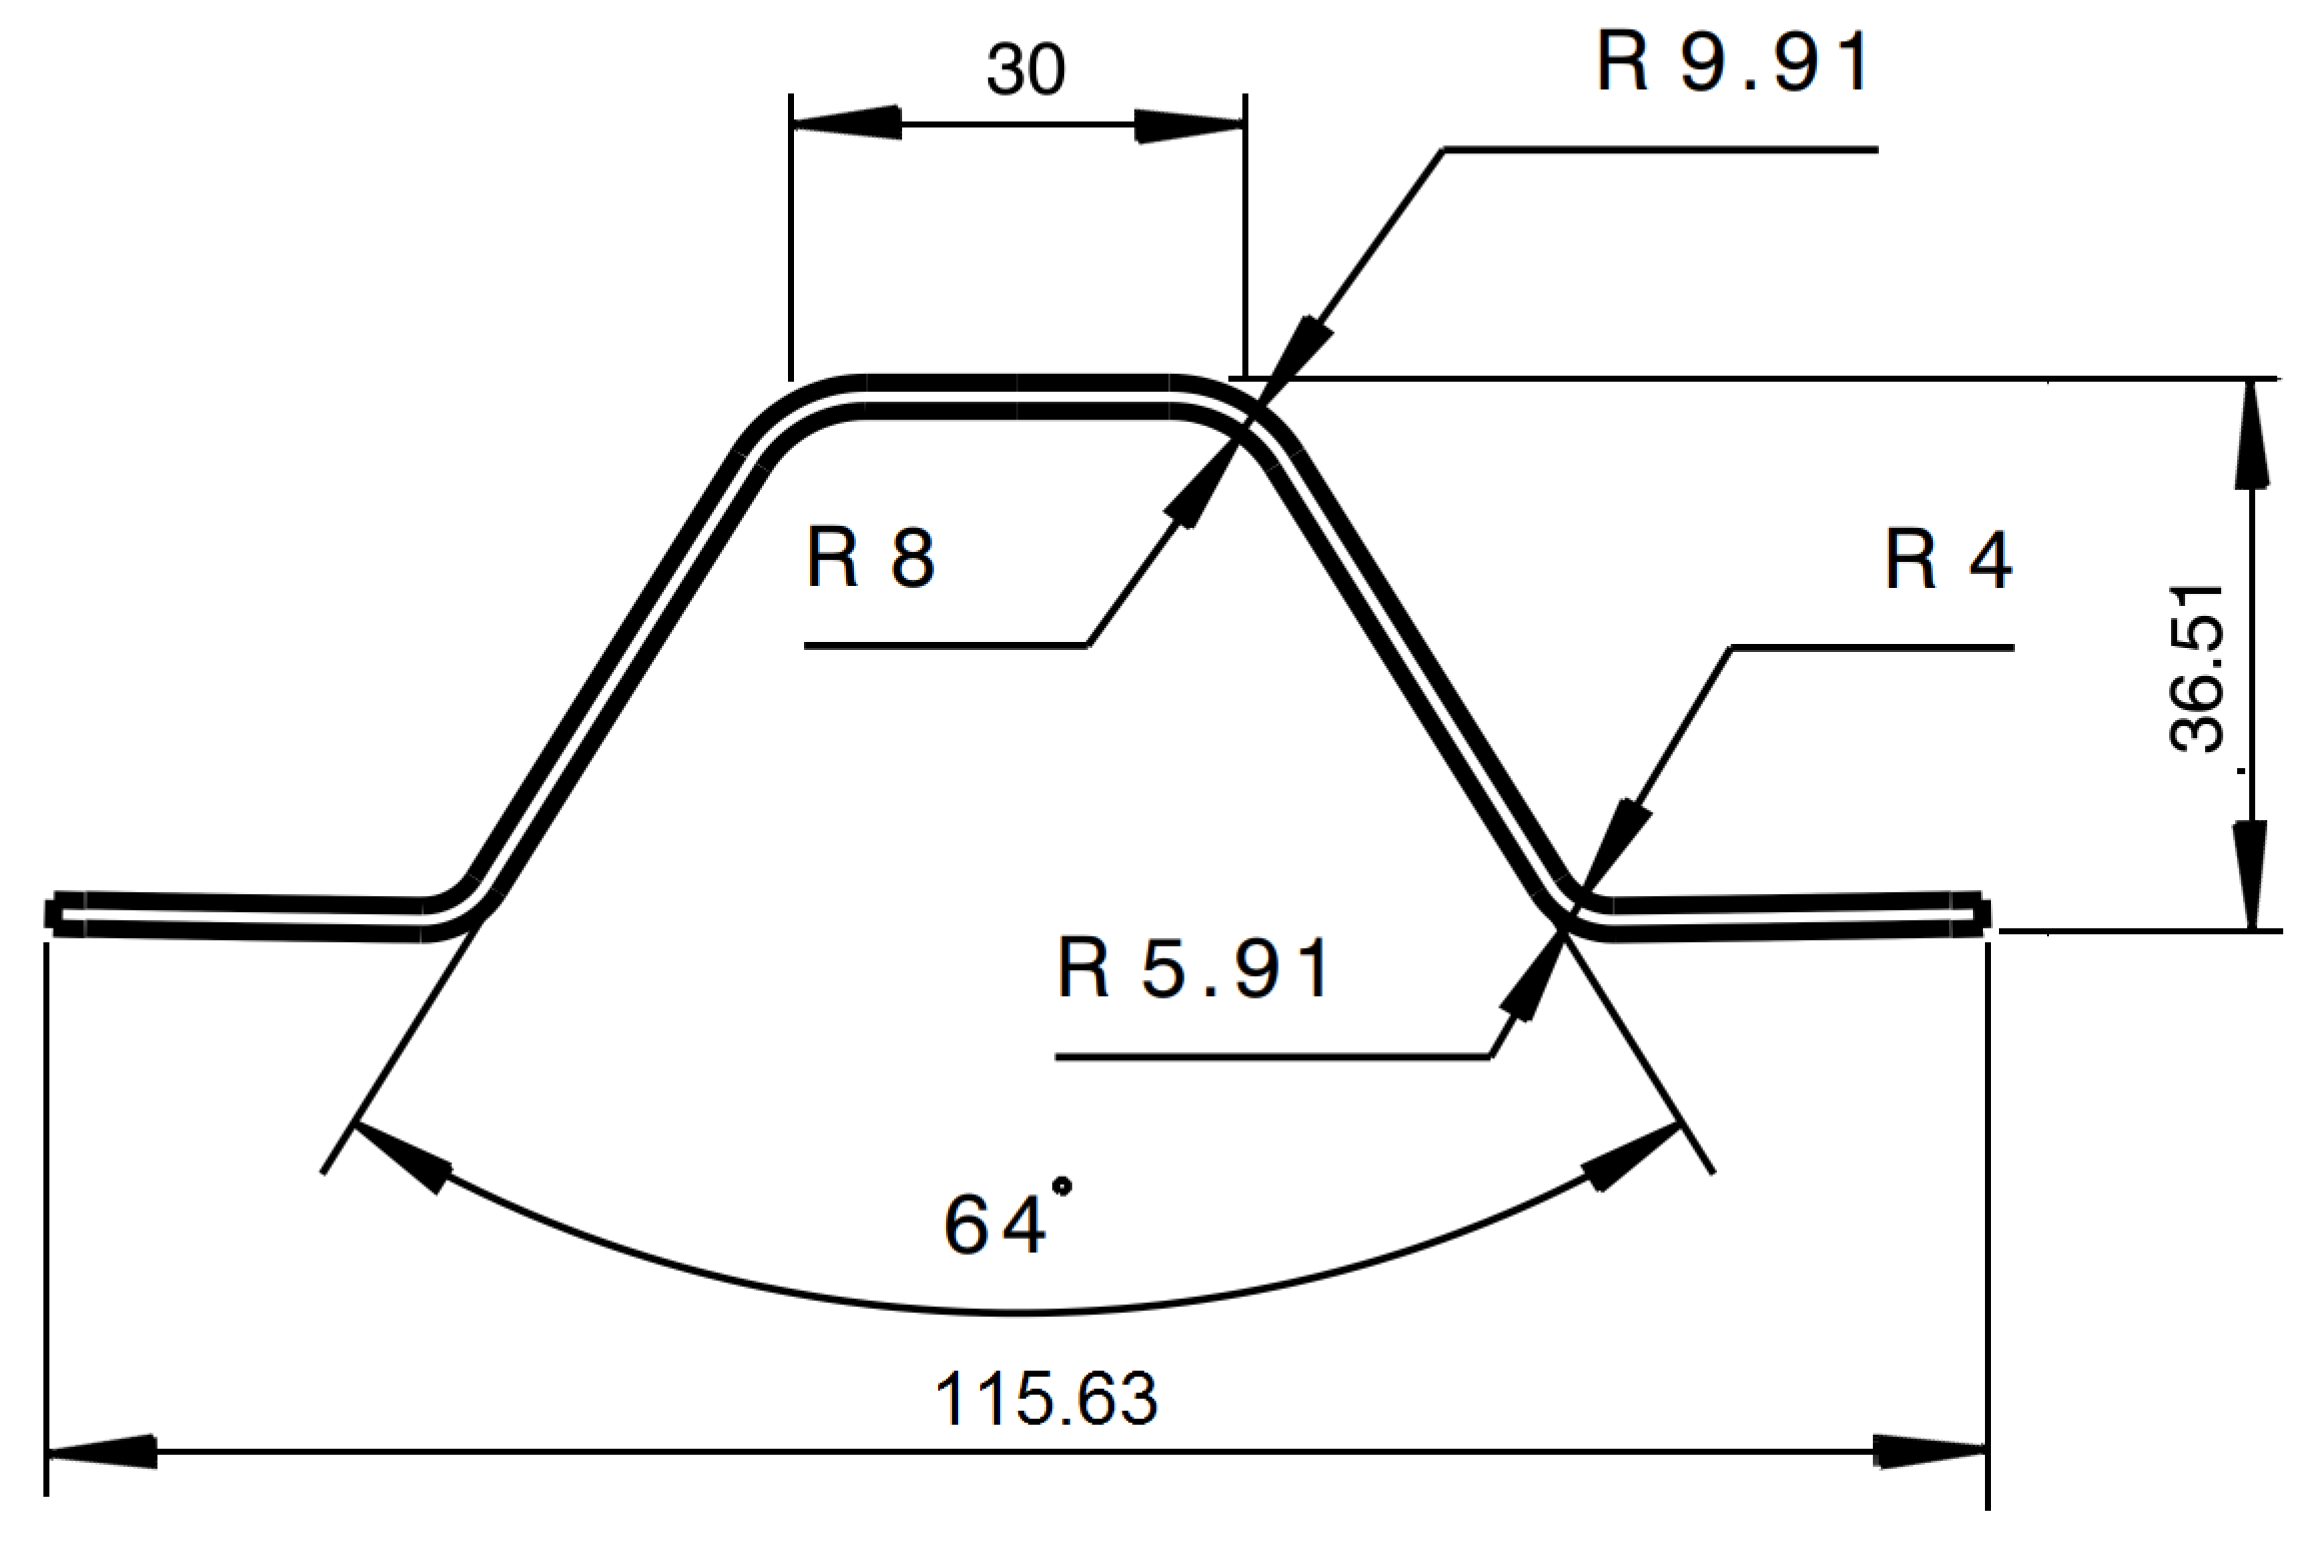
40]. The geometries of plate and stringer are given in Figure 3a and Figure 1. The material properties of a single layer are given in Table 1 and the layups are illustrated in Section 2.1. In Figure 16 the finite element model created in Abaqus is shown. The detailed modeling can be checked within the provided finite element model mesh (available online).
The transducers in the model are nodes at the center position of the real piezoceramics and used for actuation and sensing. For excitation, the amplitude signal in Equation (1) is applied as a force perpendicular to the plate surface. For each damage size D1 a separate mesh is created and analysed. As time integration scheme the explicit solver without any non-linearity was used.
In this first study, the simulation tries to reproduce the trend curves of Figure 11 using Equation (2). The damage D1 curve is shown in Figure 17. The result looks promising if the time signal analysis is done in an interval between 0–500 μs. This value was chosen, because the measured signal is more or less damped at this stage for 260 kHz, cf. Figure 9.

6. Conclusions

This work presented a benchmark datasets for carbon fiber composite plates with omega stringer elements. A reversible reference damage with 13 different sizes was placed at three locations of the structure to study the ability of guided-wave-based systems to detect damage of variable size. In addition, wave field measurements were recorded using a 3D-laser Doppler vibrometer with narrowband and broadband excitation. The main conclusions can be summarized as follows:
  • the stringer has a significant influence on guided wave propagation leading to strong signal modifications. This was demonstrated for both specimens.
  • Placing the reference damage at different locations leads to an increasing damage index (DI) when the size of the reference damage becomes larger.
  • Damage severity can be derived from tomographic image reconstructions. The larger the damage the higher the peak intensity in the reconstructed images.
  • Numerical modelling using finite element analysis is able to reproduce the trend towards larger damage sizes observed in the experiment.
  • Analysis of the acoustic wavefield shows the localization of the reference damage at the correct position. Moreover, mode conversion phenomena at the stringer element can be observed.
  • The technical validation of the measurements from both specimens shows that the dataset can be used for detailed probability of detection (POD) studies.

Author Contributions

J.M. and C.K. performed the measurements of the ’SHM plate’, implemented signal processing techniques and contributed to the paper draft. J.K. performed the scanning LDV-measurements on the ’wave field’ plate, implemented signal processing techniques and contributed to the paper draft. M.M.-B. produced the CFRP samples with stringer and contributed to the paper draft. C.W. contributed to the reference damage methodology, the numerical modelling and the paper draft. M.R. and M.K. implemented the Open Guided Wave platform and developed data management procedures. C.-P.F. and A.H. supervised the work including design and analysis. All authors have read and approved the final version of the manuscript.

Funding

J.M. gratefully acknowledges the financial support of this research by the Federal Ministry for Economic Affairs and Energy (grant no. 03SX422B). A.H. gratefully acknowledges the financial support of parts of this work by the Deutsche Forschungsgemeinschaft (grant no. HE 2574/47-1).

Acknowledgments

The authors thank I. Mueller (Bochum University of Applied Sciences, Germany) and K. Tschöke (Fraunhofer IKTS, Dresden, Germany) for discussions with respect to the experimental design.

Conflicts of Interest

The funders had no role in the design of the study; in the collection, analyses, or interpretation of data; in the writing of the manuscript, or in the decision to publish the results.

Abbreviations

The following abbreviations are used in this manuscript:
GUWguided ultrasound waves
OGWopen guided waves
SHMstructural health monitoring
SLDVscanning laser Doppler vibrometer

References

  1. Boller, C.; Chang, F.K.; Fijino, Y. Encyclopedia of Structural Health Monitoring; John Wiley & Sons: Hoboken, NJ, USA, 2009; ISBN 10 0470058226. [Google Scholar]
  2. Ben Ammar, I.; Karra, C.; El Mahi, A.; El Guerjouma, R.; Haddar, M. Mechanical Behavior and Acoustic Emission Technique for Detecting Damage in Sandwich Structures. Appl. Acoust. 2014, 86, 106–117. [Google Scholar] [CrossRef]
  3. Li, B.; Li, Z.; Zhou, J.; Ye, L.; Li, E. Damage Localization in Composite Lattice Truss Core Sandwich Structures Based on Vibration Characteristics. Compos. Struct. 2015, 126, 34–51. [Google Scholar] [CrossRef]
  4. Elamin, M.; Li, B.; Tan, K. Impact Damage of Composite Sandwich Structures in Arctic Condition. Compos. Struct. 2018, 192, 422–433. [Google Scholar] [CrossRef]
  5. Dienel, C.P.; Meyer, H.; Werwer, M.; Willberg, C. Estimation of Airframe Weight Reduction by Integration of Piezoelectric and Guided Wave–Based Structural Health Monitoring. Struct. Health Monit. 2019, 18, 1778–1788. [Google Scholar] [CrossRef] [Green Version]
  6. Su, Z.; Ye, L.; Lu, Y. Guided Lamb Waves for Identification of Damage in Composite Structures: A Review. J. Sound Vib. 2006, 295, 753–780. [Google Scholar] [CrossRef]
  7. Willberg, C.; Koch, S.; Mook, G.; Gabbert, U.; Pohl, J. Continuous mode conversion of Lamb waves in CFRP plates. Smart Mater. Struct. 2012, 21, 1–9. [Google Scholar] [CrossRef] [Green Version]
  8. Mitra, M.; Gopalakrishnan, S. Guided Wave Based Structural Health Monitoring: A Review. Smart Mater. Struct. 2016, 25, 053001. [Google Scholar] [CrossRef]
  9. De Marchi, L.; Marzani, A.; Moll, J.; Kudela, P.; Radzienski, M.; Ostachowicz, W. A Pulse Coding and Decoding Strategy to Perform Lamb Wave Inspections Using Simultaneously Multiple Actuators. Mech. Syst. Signal Process. 2017, 91, 111–121. [Google Scholar] [CrossRef]
  10. Willberg, C.; Duczek, S.; Vivar-Perez, J.M.; Ahmad, Z.A.B. Simulation Methods for Guided Wave-Based Structural Health Monitoring: A Review. Appl. Mech. Rev. 2015, 67, 010803. [Google Scholar] [CrossRef] [Green Version]
  11. Moll, J.; Kathol, J.; Fritzen, C.P.; Moix-Bonet, M.; Rennoch, M.; Koerdt, M.; Herrmann, A.S.; Sause, M.G.R.; Bach, M. Open Guided Waves—Online Platform for Ultrasonic Guided Wave Measurements. Struct. Health Monit. 2019, 18, 1903–1914. [Google Scholar] [CrossRef]
  12. Moll, J.; Kexel, C.; Pötzsch, S.; Rennoch, M.; Herrmann, A.S. Temperature Affected Guided Wave Propagation in a Composite Plate Complementing the Open Guided Waves Platform. Sci. Data 2019, 6, 191. [Google Scholar] [CrossRef] [PubMed]
  13. Marzani, A.; Testoni, N.; De Marchi, L.; Messina, M.; Monaco, E.; Apicella, A. An Open Database for Benchmarking Guided Waves Structural Health Monitoring Algorithms on a Composite Full-Scale Outer Wing Demonstrator. Struct. Health Monit. 2019, 147592171988902. [Google Scholar] [CrossRef]
  14. Li, B.; Liu, Y.; Gong, K.; Li, Z. Damage Localization in Composite Laminates Based on a Quantitative Expression of Anisotropic Wavefront. Smart Mater. Struct. 2013, 22, 065005. [Google Scholar] [CrossRef]
  15. Wang, L.; Yuan, F. Group Velocity and Characteristic Wave Curves of Lamb Waves in Composites: Modeling and Experiments. Compos. Sci. Technol. 2007, 67, 1370–1384. [Google Scholar] [CrossRef]
  16. Michaels, J.E. Detection, Localization and Characterization of Damage in Plates with an in Situ Array of Spatially Distributed Ultrasonic Sensors. Smart Mater. Struct. 2008, 17, 035035. [Google Scholar] [CrossRef] [Green Version]
  17. Moll, J.; Fritzen, C.P. Guided Waves for Autonomous Online Identification of Structural Defects under Ambient Temperature Variations. J. Sound Vib. 2012, 331, 4587–4597. [Google Scholar] [CrossRef]
  18. De Marchi, L.; Perelli, A.; Marzani, A. A Signal Processing Approach to Exploit Chirp Excitation in Lamb Wave Defect Detection and Localization Procedures. Mech. Syst. Signal Process. 2013, 39, 20–31. [Google Scholar] [CrossRef]
  19. Michaels, J.E.; Lee, S.J.; Croxford, A.J.; Wilcox, P.D. Chirp Excitation of Ultrasonic Guided Waves. Ultrasonics 2013, 53, 265–270. [Google Scholar] [CrossRef]
  20. Beard, S.J.; Kumar, A.; Qing, X.; Chan, H.L.; Zhang, C.; Ooi, T.K. Practical Issues in Real-World Implementation of Structural Health Monitoring Systems. Smart Struct. Mater. 2005, 196. [Google Scholar] [CrossRef]
  21. Bach, M.; Pouilly, A.; Eckstein, B.; Moix Bonet, M. Reference Damages for Verification of Probability of Detection with Guided Waves. In Structural Health Monitoring 2017; DEStech Publications, Inc.: Lancaster, PA, USA, 2017. [Google Scholar] [CrossRef]
  22. Mueller, I.; Moll, J.; Tschoke, K.; Prager, J.; Kexel, C.; Schubert, L.; Lugovtsova, Y.; Bach, M.; Vogt, T. SHM Using Guided Waves–Recent Activities and Advances in Germany. In Structural Health Monitoring 2019; DEStech Publications, Inc.: Lancaster, PA, USA, 2019. [Google Scholar] [CrossRef]
  23. Calmon, P.; Mesnil, O.; Miorelli, R.; Artusi, X.; Chapuis, B.; D’Almeida, O. Model Assisted Probability of Detection for Guided Wave Imaging Structural Health Monitoring. In Structural Health Monitoring 2019; DEStech Publications, Inc.: Lancaster, PA, USA, 2019. [Google Scholar] [CrossRef]
  24. Memmolo, V.; Ricci, F.; Maio, L.; Boffa, N.D.; Monaco, E. Model Assisted Probability of Detection for a Guided Waves Based SHM Technique. In SPIE Smart Structures and Materials + Nondestructive Evaluation and Health Monitoring; Kundu, T., Ed.; SPIE: Bellingham, WA, USA, 2016; p. 980504. [Google Scholar] [CrossRef]
  25. Moriot, J.; Quaegebeur, N.; Le Duff, A.; Masson, P. A Model-Based Approach for Statistical Assessment of Detection and Localization Performance of Guided Wave–Based Imaging Techniques. Struct. Health Monit. 2018, 17, 1460–1472. [Google Scholar] [CrossRef] [Green Version]
  26. Tschöke, K. Anpassung des EFIT-Algorithmus zur Anwendung Rechnergestützer POD-Methoden im SHM-Bereich. Ph.D. Thesis, Technical University of Dresden, Dresden, Germany, 2019. [Google Scholar]
  27. Howard, R.; Cegla, F. On the Probability of Detecting Wall Thinning Defects with Dispersive Circumferential Guided Waves. NDT E Int. 2017, 86, 73–82. [Google Scholar] [CrossRef]
  28. Soutis, C. Carbon Fiber Reinforced Plastics in Aircraft Construction. Mater. Sci. Eng. A 2005, 412, 171–176. [Google Scholar] [CrossRef]
  29. Administration, F.A. AC 25.571-1D—Damage Tolerance and Fatigue Evaluation of Structure; Document Information; U.S. Department of Transportation: Washington, DC, USA, 2011.
  30. EASA. Acceptable Means of Compliance 20-29/Amendment 6; European Union Aviation Safety Agency: Cologne, Germany, 2010.
  31. Dienel, C.P. Damage Assessment for Composite Structures Based on Individiual Residual Strength Prediction. Ph.D. Thesis, Technische Universität Carolo-Wilhelmina zu Braunschweig, Braunschweig, Germany, 2019. [Google Scholar]
  32. Neuschwander, K.; Moll, J.; Memmolo, V.; Schmidt, M.; Bücker, M. Simultaneous Load and Structural Monitoring of a Carbon Fiber Rudder Stock: Experimental Results from a Quasi-Static Tensile Test. J. Intell. Mater. Syst. Struct. 2019, 30, 272–282. [Google Scholar] [CrossRef]
  33. Hay, T.R.; Royer, R.L.; Gao, H.; Zhao, X.; Rose, J.L. A Comparison of Embedded Sensor Lamb Wave Ultrasonic Tomography Approaches for Material Loss Detection. Smart Mater. Struct. 2006, 15, 946–951. [Google Scholar] [CrossRef]
  34. Yoshino, M.; Okuno, R.; Nagamune, A.; Nishifuji, K. Next Generation On-Line Ultrasonic Testing System, Using Real-Time Chirp Pulse Compression Processing. Mater. Sci. Forum 1996, 210–213, 791–798. [Google Scholar] [CrossRef]
  35. De Marchi, L.; Marzani, A.; Speciale, N.; Viola, E. Prediction of Pulse Dispersion in Tapered Waveguides. NDT E Int. 2010, 43, 265–271. [Google Scholar] [CrossRef]
  36. Moll, J.; Wandowski, T.; Malinowski, P.; Radzienski, M.; Opoka, S.; Ostachowicz, W. Experimental Analysis and Prediction of Antisymmetric Wave Motion in a Tapered Anisotropic Waveguide. J. Acoust. Soc. Am. 2015, 138, 299–306. [Google Scholar] [CrossRef] [Green Version]
  37. Puthillath, P.; Galan, J.M.; Ren, B.; Lissenden, C.J.; Rose, J.L. Ultrasonic Guided Wave Propagation across Waveguide Transitions: Energy Transfer and Mode Conversion. J. Acoust. Soc. Am. 2013, 133, 2624–2633. [Google Scholar] [CrossRef] [PubMed]
  38. Ren, B.; Lissenden, C.J. Ultrasonic Guided Wave Inspection of Adhesive Bonds between Composite Laminates. Int. J. Adhes. Adhes. 2013, 45, 59–68. [Google Scholar] [CrossRef]
  39. Radzieński, M.; Doliński, Ł.; Krawczuk, M.; Żak, A.; Ostachowicz, W. Application of RMS for Damage Detection by Guided Elastic Waves. J. Phys. Conf. Ser. 2011, 305, 012085. [Google Scholar] [CrossRef] [Green Version]
  40. Kudela, P.; Ostachowicz, W. A Multilayer Delaminated Composite Beam and Plate Elements: Reflections of Lamb Waves at Delamination. Mech. Adv. Mater. Struct. 2009, 16, 174–187. [Google Scholar] [CrossRef]
Figure 1. Front view of omega stringer (dimensions in mm).
Applsci 10 03068 g001
Figure 2. Photos (a,b) of the wave field plate and SHM plate with stringer.
Applsci 10 03068 g002
Figure 3. (a) SHM-plate: Visualization of the three damage positions D 1 D 3 relative to the transducer locations T 1 T 12 . Given by the laminate stack the orientation of the reference damages is 45° (b) Wave field plate: measurement area for SLDV measurements applying the reference damage (purple) and line scan orthogonal to the stringer element to assess its influence on wave propagation (red).
Applsci 10 03068 g003
Figure 4. Delaminations caused by an impact damage and projected area (surrounding ellipse).
Applsci 10 03068 g004
Figure 5. (a) Geometry of the elliptical reference damage (b) Area of the elliptical reference damage (c) Fabricated reference damage (steel).
Applsci 10 03068 g005
Figure 6. Front view of the SHM plate in the climate chamber (left). Two temperature sensors were installed on the top right and bottom right for surface temperature measurements. Side view (right) before the fixation of a reference damage using a metal block and the electromagnet.
Applsci 10 03068 g006
Figure 7. Depiction of the employed actuation waveforms: Exemplary time-domain signals (left) and the spectrum of all waveforms (right).
Applsci 10 03068 g007
Figure 8. Scanning laser Doppler vibrometer (SLDV) setup for the wave field plate with stringer. The electromagnet was removed for the wave field measurements.
Applsci 10 03068 g008
Figure 9. Ultrasound measurements at fc = 260 kHz of the flat SHM plate (OGW1) and the SHM plate with stringer (OGW3). In this example, the first transducer T 1 works as actuator and all other transducers T 2 T 12 serve as receivers. The influence of the stringer can be clearly identified especially for receivers T 7 T 12 that are located on the opposite side of the stringer.
Applsci 10 03068 g009
Figure 10. Overall analysis of the complete dataset recorded from the SHM plate with stringer using the signal energy of the differential signals. The normalization was performed using the maximum signal energy for all transducer pairs for a specific carrier frequency. The arrows on top indicate the baseline state (B) and the damage states D 1 to D 3 . An increasing damage indicator can be observed for each structural condition due to the increasing damage size. Few black spots exist related to outliers especially for the actuator-receiver pair T 9 T 10 (channel 61). In this representation, a channel means one actuator-sensor pair.
Applsci 10 03068 g010
Figure 11. Analysis of the normalized signal energy of the differential signal for three representative actuator-sensor pairs (horizontal axis is proportional to an increasing damage size). The normalization was performed using the maximum signal energy for each transducer pair. Damage can be identified best on the straight line between the respective actuator and sensor given by the highest score.
Applsci 10 03068 g011
Figure 12. Tomographic image reconstruction for damage D 1 and the damage sizes 2, 6, 10 and 13. The peak intensity increases of larger damage sizes as shown by the colorbar. The scaling parameter of the RAPID algorithm was defined here as β = 1.1.
Applsci 10 03068 g012
Figure 13. The peak intensity at the damage location D 1 increases with damage size.
Applsci 10 03068 g013
Figure 14. B-Scans of the plate for different excitation signals. Figure (ag): 5-cycle tone burst for different frequencies, (h): chirp signal. The influence of the stringer can be seen on the upper half space.
Applsci 10 03068 g014
Figure 15. (ad) RMS-maps of the wave field plate with stringer for different damage states. All images are normalized for a better comparability. The yellow spot in the upper right corner is the actuator; the blue spot in the middle represents the damage location.
Applsci 10 03068 g015
Figure 16. Illustration of the finite element shell element modelled in Abaqus. The plate and the stringer are modelled with linear reduced integrated shell elements (S4R) with a seed length of 1 mm.
Applsci 10 03068 g016
Figure 17. Normalized energy for path T3–T9 for various damage sizes of D1 and a measurement time of 500 μs for fc = 40 kHz.
Applsci 10 03068 g017
Table 1. Stiffness values and density for unidirectional Hexply® M21/34%/UD134/T700/300 material used for the plate, taken from [11].
Stiffness (GPa)
C 1111 = 130 C 1122 = 6.1 C 1133 = 6.1
C 2222 = 11.2 C 2233 = 5.2
C 3333 = 11.2
C 1212 = 3
C 2323 = 4.2
C 1313 = 4.2
Density (kg/m3)
ρ = 1571
Table 2. Stiffness values and density for unidirectional Hexply® M21/34%/UD194/IMA-12K as material used for the stringer.
Stiffness (GPa)
C 1111 = 174.145 C 1122 = 4.076 C 1133 = 4.076
C 2222 = 9.611 C 2233 = 2.950
C 3333 = 9.611
C 1212 = 3.330
C 2323 = 5.882
C 1313 = 5.882
Density (kg/m3)
ρ = 1580
Table 3. Coordinates of piezoelectric transducers (center point) on the SHM plate; reference coordinate system is shown in Figure 3.
Transducer IDx-Coordinate (mm)y-Coordinate (mm)
150470
2130470
3210470
4290470
5370470
6450470
75030
813030
921030
1029030
1137030
1245030
Table 4. Coordinates of damage position (center position of the elliptical disc).
Damage IDx-Coordinate (mm)y-Coordinate (mm)
D 1 210350
D 2 130100
D 3 290150
Table 5. Measurement parameters (SLDV system).
PropertiesValue
Time samples (per signal)8192
Sampling rate2.56 MHz
Number of spatial sampling points45,287
Measurement range±200 mm/s
Pixel spacing≈1.2 mm
Averaged measurements per pixel50
Temperature21.1 ± 0.14 °C
Filterbandpass (15–250 kHz)
Table 6. Coordinates of the measurement setup (SLDV system) of the  wave field plate. Please note that the SLDV system has two coordinate systems, one related to the structure and one related to the built-in camera.
Damage IDCoordinate System (Structure/Camera [SLDV Built-In])
x-Coordinate (mm)y-Coordinate (mm)
Transducer250/165250/−65
Damage125/40125/−190
Measurement area0–2750–275
Omega stringer0–500contact area (top) 410–435
contact area (bottom) 320–345
Table 7. Excitation signal parameters (SLDV system).
Signal TypeParameterValue
Tone burstCenter frequencies30, 40, 50, 100, 150, 200 kHz
Number of cycles5
Windowing functionHann
Amplitude±150 V
ChirpCenter frequencies20–200 kHz
Chirp duration0.366 ms
Amplitude±150 V

