Featured Application
Evaluation of Self-Healing Efficiency in Composite Laminates
Abstract
The aim of this research is a feasibility study of self-healing process monitoring in composite laminates. A novel nondestructive method based on the full wavefield of Lamb wave processing is proposed. Experimental verification is presented for glass-fiber-reinforced polymer plate with embedded self-healing function in the form of a dry microcapsule powder. After impacting the specimen to create barely visible impact damage, a series of laser vibrometer full wavefield measurements were carried out and processed to assess self-healing efficiency.
1. Introduction
Due to their superior specific strength, stiffness and design flexibility, fiber-reinforced polymer (FRP) composite laminates are widely used in numerous aerospace and engineering applications. However, FRP laminates are susceptible to damage arising from low-velocity impact [1]. Often, an impact event creates internal damage with a minimal external indication, also called barely visible impact damage (BVID). The effect of this hidden damage on laminate properties can be significant, especially in compression where strength may be reduced by up to 50% [2]. Hence, it is necessary to regularly perform nondestructive inspections or implement a structural health monitoring (SHM) system to detect the presence of damage and prevent catastrophic failure of structure [3]. Consequently, large factors of safety are incorporated into the design to ensure their safety and reliability, which lead to composite structures with higher weight and thicker sections. Traditionally, once damage has been detected within a composite structure, the approach has been to design and undertake temporary or structural repair. The alternative solution to these problems is the application of self-healing FRP composites. Self-healing has the potential to mitigate the damage resulting from an impact event, thereby providing an opportunity to improve the design allowables for FRPs or offer other benefits such as reduced maintenance and inspection schedules [4].
The concept of healing materials was explored in polymers in the context of crack healing in the early 1980s by Wool and O’Conner [5]. This initial work was focused on understanding how cracks could be repaired, or healed, using a solvent welding approach. In this study, Wool and O’Conner introduced one of the central concepts of self-healing, the notion of healing efficiency, which is given by Equation (1):
where Γ is a material property of interest. This property is frequently fracture toughness, but other metrics, such as modulus or ultimate strength, have been adopted by researchers when attempting to quantify healing [6].
Most experimental methods in the evaluation of self-healing efficiency are destructive. Various nondestructive and SHM methods have been employed for damage quantification, but only a few of them have been considered to quantify healing, namely acoustic emission (AE), micro-X-ray computer tomography (µCT), digital image correlation (DIC), Raman spectroscopy and optical microscopy. In this overview, we focus only on studying potential methods for impact damage healing efficiency which can be determined by nondestructively.
The acoustic emission technique is used widely for structural health monitoring purposes. Piezoelectric sensors are attached to the structure to record the response under the excitation of the cracking sources. The parameters of the recorded signals are related to the fracture processes and enable the monitoring of fracture from the start until final failure. Fracture mechanisms like matrix cracking and debonding show different AE signatures, allowing the evaluation of the fracture stage as the load changes. The results in [7] indicate that AE provides the possibility to characterize the restoration action of textile-reinforced cement due to the existence of a self-healing agent aiming at closing the matrix cracks. The attenuation of the acoustic waves is also sensitive enough to indicate the physical filling of the cracks by the self-healing agent.
Acoustic emission is often utilized for studying self-healing of cracks in cementitious composites. Li et al. [8] experimentally investigated by both passive and active AE self-healing of cracks in the cement matrix due to microencapsulated healing agents. To distinguish the cracking mechanisms, the features of two representative acoustic signals, i.e., matrix cracking and debonding of the interface, were captured and used for the calibration of the AE activities. Further AE post-processing analysis was performed with temporal and spectral descriptors to reveal the damage and healing occurring in the host matrices. The average frequency versus rising time/amplitude index confirmed that the cracking modes contribute to the characteristic spectrum.
The principle of micro-X-ray computed tomography is based on the 3D computed reconstruction of a sample from 2D projections acquired at different angles around its axis of rotation. The beam intensity is attenuated after absorption by the different phases and components of the material. The component with higher density absorbs more X-ray energy [9].
In [10], µCT was used to determine the damage volume in quasi-isotropic carbon-fiber-reinforced plastic (CFRP) laminates subjected to low-velocity impacts. It was shown that a damage volume increased from 50 to 150 mm3 for impact events rising from 3 to 5 J. The laminates incorporated a layer of hollow glass fibers (HGFs) at either the 3rd or 13th interface to deliver a self-healing agent. It was shown that the direct interaction between the delamination damage and the HGF is limited. The investigation confirmed that if the delaminations do not cause extensive rupture of the HGF at these interfaces then the healing agent is not released and restoration of mechanical properties cannot be achieved. Nevertheless, the results showed that µCT has great potential in self-healing efficiency estimation. Prajer et al. [11] demonstrated a high potential of µCT for observation of local healing events in the fiber-reinforced polymer composites using healing-agent-filled compartmented fibers.
Digital image correlation is an optical method that employs tracking and image registration techniques for accurate 2D and 3D measurements of changes in images. This method is often used to measure full-field displacement and strains.
AE analysis coupled with DIC was successfully applied by Feiteira et al. [12] for precise detection of brittle failure under a developing crack movement. The brittle failure occurring due to excessive strain on the polymer bridging the healed crack generated acoustic emissions with an energy level of at least one order of magnitude higher than the background noise and a high rate of occurrence of acoustic events. DIC tests performed in parallel allowed very accurate monitoring of crack creation and widening, also detecting a high rate of increase in the crack opening during failure. In summary, DIC enables overall monitoring of the complete healed area.
Chemical and structural changes during crosslinking, such as the formation of linking functional structures in polymers, can be analyzed by Raman micro-spectroscopy. A Raman map reflects the spatial intensity distribution of a selected Raman band. The spatial distribution of vibrational frequencies characteristic of the mobile phase and newly formed crosslinked structures can be visualized in contrast to the bulk material to monitor the healing process. The method is capable of revealing the chemical composition of a sample with sufficient spatial and temporal resolution without disturbing the healing process [13]. Yuan et al. [14] applied in situ confocal Raman microscopy for observation of the impact-fractured surface of a self-healing laminate under 15 J impact. They provided a graph showing the curing reaction of the released healing agent in an authentic specimen.
Optical microscopy images are usually used as a complementary tool for inspection of healing effect rather than quantification of healing efficiency. For example, in [15], the fractured sample micrographs showed the filling of the self-healing agent in the cracks that resulted in the self-healing of samples.
Lamb-wave-based methods in the evaluation of self-healing efficiency have not been reported so far. The idea is to use the full wavefield of propagating Lamb waves measured by scanning laser Doppler vibrometer and apply special signal processing. So far, several frequency-wavenumber signal-processing methods utilizing full wavefield have been used for damage detection and localization. Most of them have been compared in [16]. Several full wavefield methods were successfully applied for the characterization of delamination and impact damage in composite laminates [17,18,19].
We showed in [20] that it is possible to quantify not only the impact damage size but also its severity. This opens up new possibilities for tracking damage growth as well as the healing process of self-healing FRP laminates by the nondestructive method. We propose an extension of our previously proposed algorithms [20,21] and show new capabilities in the evaluation of self-healing efficiency. We tested the new algorithm based on experimental data acquired from glass-epoxy laminate, with in-built microcapsules, subjected to impact.
2. The Method for Self-Healing Efficiency Estimation
The proposed method for self-healing efficiency estimation is based on the assumption that propagating Lamb waves interact with any material discontinuities. The more altered the material is in a particular area, the more changes it will cause in propagating Lamb waves in this area. Anomalies of Lamb wave propagation due to material discontinuities may manifest themselves as:
- reflections;
- wave scattering;
- changes in wave velocity;
- changes in wavelength;
- changes in wave amplitude;
- Lamb wave entrapment inside delaminated region;
- mode conversion.
These anomalies are mostly quite subtle and not easy to measure, extract and quantify. However, there is a positive correlation between local material degradation and local guided wave variation in this area. Taking this into account, changes in the wavefield might be used to monitor not only damage appearance but also its severity [19]. This opens up the possibility for nondestructive monitoring of the self-healing process. During the self-healing process, local wavefield changes are decreasing while the healing process progresses.
The main idea behind the proposed technique lies in filtering the full wavefield images. A special adaptive image filtering technique is used to remove the main component of propagating Lamb waves, leaving only information about changes in the wave pattern. This procedure is possible in the wavenumber domain in which a special filter is designed and applied to all wavefield images. Maps presenting the spatial distribution of wavefield changes are used for damage assessment.
In order to give not only qualitative results by observing how those maps change with the healing process, quantitative results are evaluated by summing the energy over the considered area.
The scheme of the proposed nondestructive self-healing efficiency estimation method is presented in Figure 1. Three main blocks may be distinguished, which are marked with dashed lines: adaptive filter preparation, measured data processing and self-healing efficiency estimation. The first part is applied only once to reference data. The second block is repeated for every measurement with the use of filter prepared in the first step. After processing of all measured data, a self-healing process efficiency is estimated in the third step.
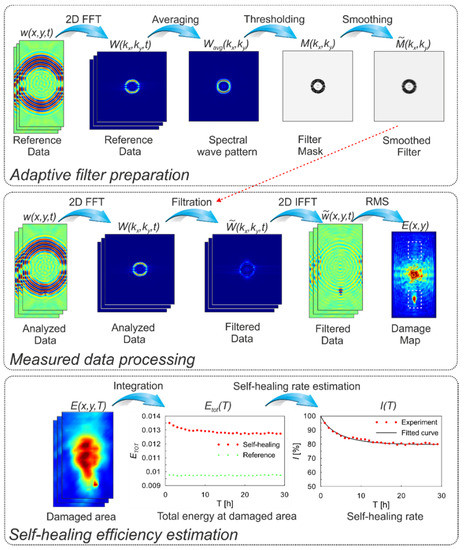
Figure 1.
Proposed nondestructive self-healing efficiency estimation method diagram.
A more detailed description of the proposed procedure is described in successive sections.
2.1. Adaptive Filter Preparation
A special filter in the wavenumber-wavenumber domain is designed. It allows for the extraction of information about local Lamb wave changes, which may be used for damage identification and assessment.
The adaptive filter is prepared only once for the whole process. As reference data, pristine condition sample measurements may be used. However, this method works effectively also when current state data is used for filter preparation, which was presented in [19,20]. A step-by-step description is given in the following subsections.
2.1.1. Transformation of Full Wavefield Images from Space to the Wavenumber Domain
Two-dimensional Fourier transform (2D FT) is used to convert full wavefield reference data from the space-space-time domain into the wavenumber-wavenumber-time domain . The discrete form of 2D FT may be written as:
where X and Y are the numbers of data points along the x and y directions, respectively. Exemplary full wavefield images at one arbitrarily chosen time frame (t1 = 108 µs) in both the space–space and the wavenumber-wavenumber domains are presented in Figure 2.
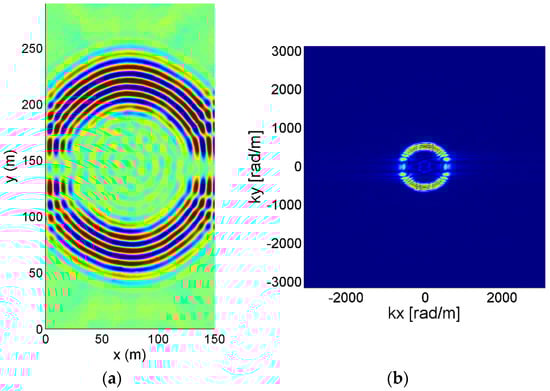
Figure 2.
Full wavefield image captured at time moment t1: (a) in the space-space domain; (b) in the wavenumber-wavenumber domain.
2.1.2. Spectral Wavefield Image Pattern Estimation
This operation provides an image that represents a spectral wave pattern for specific material and excitation. It is prepared based on a number of wavefield images in the wavenumber-wavenumber domain by determining the mean value at each point as:
where n is a vector with a number of time frames used for creating spectral wave pattern; N is a total number of frames that were used. In this study, we arbitrary selected the first 30 wavefield images for this purpose to determine the spectral wavefield image pattern, which is presented in Figure 3.
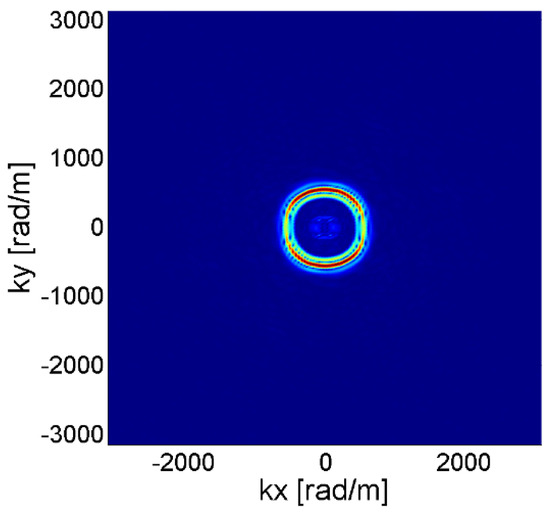
Figure 3.
Averaged wavefield image in the wavenumber-wavenumber domain.
2.1.3. Filter Mask
An adaptive filter mask is created by thresholding averaged wavefield image in the wavenumber-wavenumber domain as:
The threshold value is set based on a cumulative histogram of averaged wavefield image values to be higher than 98% of image points. In other words, 2% of averaged wavefield image points with the highest values become 0, while all other points are set to 1. In this way, the filter mask is designed to remove the main wave propagation component, leaving information about any abnormalities. An example of a filter mask used in these studies is presented in Figure 4.
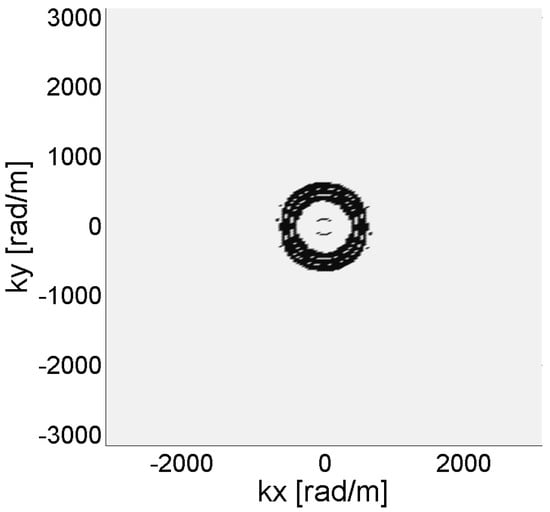
Figure 4.
Adaptive filter mask in the wavenumber-wavenumber domain.
2.1.4. Filter Mask Smoothing
The filter mask is successively smoothed by applying a Gaussian low pass filter. This operation is used to avoid ringing artifacts that may occur during the image filtering process. It is performed in as convolution of filter mask M with two-dimensional Gaussian function G.
The obtained result is presented in Figure 5.

Figure 5.
Smoothed adaptive filter mask in the wavenumber-wavenumber domain.
2.2. Measured Data Processing
2.2.1. Transformation of Full Wavefield Images from Space-Space-Time Domain to the Wavenumber-Wavenumber-Time Domain
A procedure analogical to one described in Section 2.1.1 is realized for all full wavefield data obtained during the self-healing monitoring period.
2.2.2. Filtering All Wavefield Images
Every wavefield image is filtered with an adaptive filter mask in the wavenumber-wavenumber domain as:
The exemplary filtered wavefield image at t = t1 is presented in Figure 6.
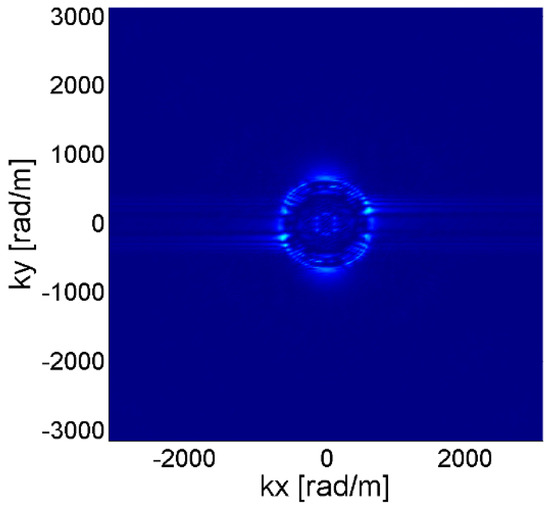
Figure 6.
Filtered wavefield image captured at t1 in the wavenumber-wavenumber domain.
2.2.3. Transformation of Data Back to the Space-Space-Time domain
Filtered data is converted back from the wavenumber-wavenumber-time domain to the space-space-time domain using two-dimensional inverse Fourier transform. Its discrete implementation may be noted as:
The comparison between original and filtered wavefield images captured at time moment t1 is given in Figure 7. It may be noted that the amplitude of propagating Lamb waves was decreased dramatically, leaving high amplitudes in the bottom part of the specimen-at the damaged region.
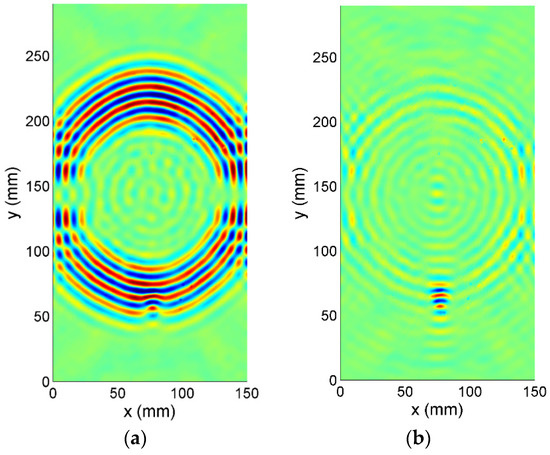
Figure 7.
Wavefield image captured at time moment t1 in the space-space domain: (a) without processing; (b) after adaptive filtering.
2.2.4. Energy Maps
The energy of abnormalities in propagating Lamb waves is determined as the root mean square (RMS) value at each spatial point of the filtered wavefield, which can be written as:
where is the total time for each measurement.
An exemplary abnormalities energy map E is presented in Figure 8. It is worth noticing that, in contrast to a technique for damage delamination detection presented in [19], no wave energy attenuation compensation is used, which does not incorporate any additional signal transformation that can lead to inaccuracies in the final damage coefficient. Damage maps obtained with compensation technique are presented in Section 3 (Figure 14).
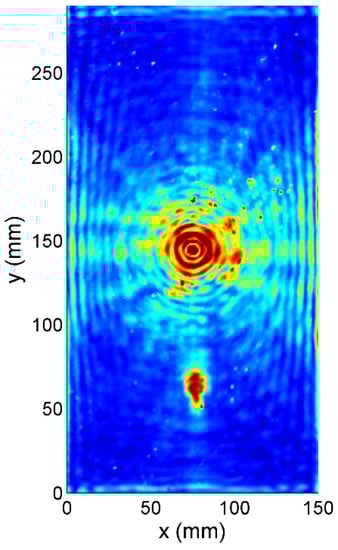
Figure 8.
The energy of abnormalities in propagating Lamb waves map.
It is worth noticing that, in the presented approach, direct information about propagation time is not used, due to wavefield image processing. However, this information is indirectly used when the filter mask is created based on a number of successive time frames, as well as during damage map determination where all the time frames are summed.
2.3. Self-Healing Efficiency Estimation
After damage maps are created for every measurement carried out during self-healing process monitoring, they are stacked, forming matrix , where T stands for time of the self-healing process.
2.3.1. Energy of Delaminated Area
To quantify the damage severity, the total energy in the chosen region is calculated in a function of T as:
where a, b, c and d are the boundaries of the inspected region (see Figure 10). Reference energy for a symmetrical undamaged region in another part of the specimen is evaluated in the same manner.
2.3.2. Self-Healing Rate
To estimate self-healing rate, reference energy is subtracted from all measurements. Due to the fact that the first measurement is obtained about 1 h after the impact occurrs, the initial damage energy Eextrap is also extrapolated by exponential curve fitting.
where is relative damage severity.
3. Experimental Investigations
3.1. Composite Specimens Manufacturing
Composite specimens were manufactured using woven glass fiber preform (8 plies, 250 × 310 mm) and EPIDIAN 52 epoxy resin-amine hardener Z1 as a matrix phase. Composites were prepared using the standard hand impregnation technique. For composites with embedded self-healing function, dry microcapsule powder was weighed (1 wt%) and sprinkled gently onto the surface between each ply. The microencapsulation procedure was adapted from that of Bolimowski (2015) [20]. Laminates, after impregnation, were vacuum bagged on a glass plate, degassed for 30 minutes and consolidated at 60 °C for 24 hours with post-curing for 2 hours at 80 °C under continuous vacuum. After curing, composites were removed from the vacuum bag, trimmed and cut to desired dimensions.
3.2. Measurement of Full Wavefield of Lamb Waves
An experimental set-up was prepared to automatically measure the full wavefield of propagating Lamb waves every 1 h for 29 h in total. Its diagram is presented in Figure 9. Scanning laser vibrometer, namely PSV-400, was used for out-of-plane vibration registration. A piezoelectric round disc (10 mm of diameter) attached to the specimen’s back surface was connected to arbitrary waveform generator through a signal amplifier for excitation purposes.
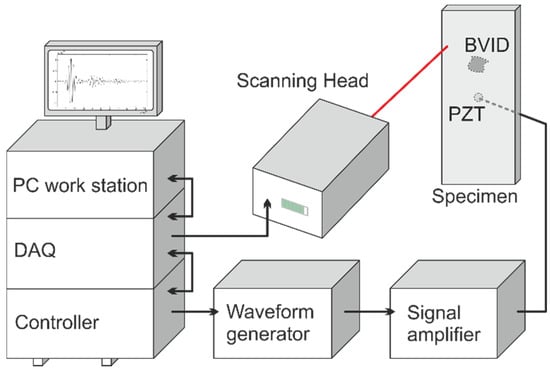
Figure 9.
Experimental set-up diagram.
Measurements were made on a regular grid of 291 × 151 points (1 mm spatial resolution), covering the entire front surface of the specimen. A five-cycle burst sine signal at 75 kHz central frequency was used to excite Lamb wave packages. To increase the signal-to-noise ratio, the specimen was covered with retroreflective tape and 3 times averaging was used during measurements. Wave packages were excited every 4 ms, which was enough for previously excited signals to completely attenuate. Bandpass filtering with cutoff frequencies of 40 and 110 kHz was also applied to registered time responses. At every point, 512 time samples were registered with 1.28 MHz sampling frequency.
To make sure that the energy of propagating waves did not change due to environmental changes (temperature), PZT aging, glue under PZT degradation and other factors, under ongoing experiments, the reference area energy plots for the 8 J impact tests are given. The reference area was chosen to be in the same distance from the excitation as BVID, and it is graphically presented for both damage scenarios in Figure 10.
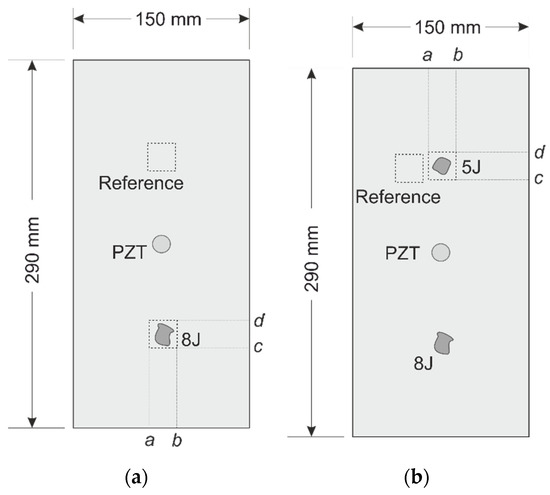
Figure 10.
Specimen with barely visible impact damage (BVID): (a) 8 J scenario; (b) 5 J scenario.
The full wavefields of propagating waves in the specimen with BVID induced at arbitrarily chosen time frames are presented in Figure 11a,b after 1 and 29 h, respectively.
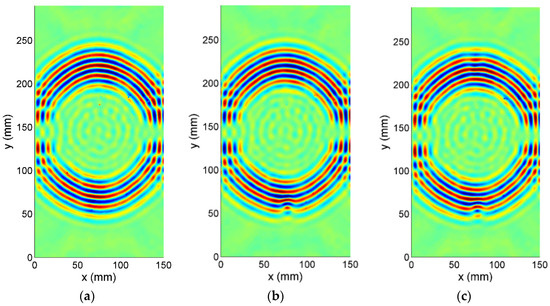
Figure 11.
Full wavefield images in space-space domain captured at t = 108 µs: (a) pristine condition; (b) 1 h after 8 J impact; (c) 1 h after 5 J impact.
3.3. Damage Scenarios
To create BVID in the tested sample, two drop impact tests were performed in a sequence. The first impact with 8 J energy was introduced to the bottom part of the specimen. After the self-healing monitoring period, another drop with 5 J energy was introduced on the opposite side of the PZT. The scheme of the specimen with the position of impacts is presented in Figure 10.
3.4. Results
Full wavefield images obtained at t = 108 µs, for three different specimen conditions (without damage, with 8 J impact and with healed 8 J impact and 5 J impact), are presented in Figure 11. It may be noted that the 8 J impact causes significant wavefront distortion at the impact area (Figure 11b) and after the curing process (Figure 11c).
The second damage scenario (5 J) produces much smaller wave distortions at impact area in the central top part of the wavefront. (Figure 11c).
Based on measurements of these three scenarios, simple energy maps of propagating Lamb waves (based on RMS of raw data) were prepared and are presented in Figure 12.
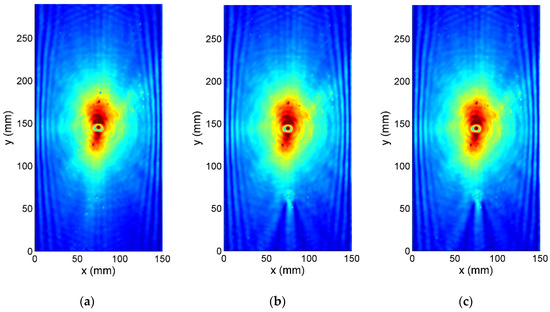
Figure 12.
RMS maps: (a) pristine condition; (b) 1 h after 8 J impact; (c) 1 h after 5 J impact.
It may be noted that raw RMS maps reveal changes in an energy distribution corresponding to the particular damage scenario. Exactly on the impact area, the energy is increased due to wave entrapment in the delaminated region. Behind BVIDs (from incident wave point of view), interference patterns are visible.
However, raw RMS maps are difficult to interpret, and it is inconvenient to give a quantitative value for damage severity based on those results. To overcome this problem, the proposed technique for extracting the information about wavefield changes was used. Obtained damage maps for three damage scenarios are presented in Figure 13. For comparison purposes, damage maps obtained with additional attenuation compensation are also presented in Figure 14. Additionally, close up pictures of the damaged region at three different time moments after the impact are given in Figure 15 and Figure 16 for 8 and 5 J impact areas, respectively.
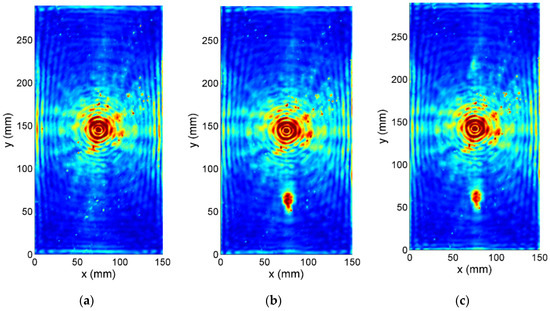
Figure 13.
Damage maps: (a) pristine condition; (b) 1 h after 8 J impact; (c) 1 h after 5 J impact.
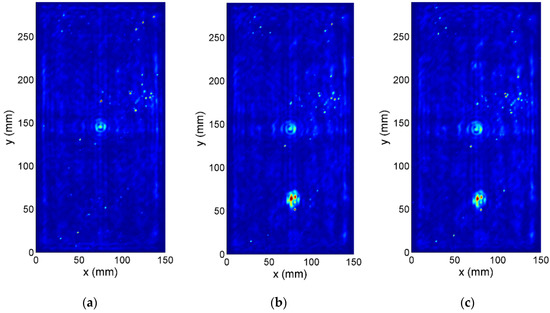
Figure 14.
Damage maps with attenuation compensation: (a) pristine condition; (b) 1 h after 8 J impact; (c) 1 h after 5 J impact.
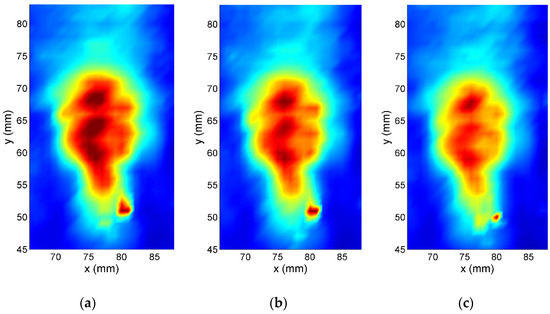
Figure 15.
Close-up of BVID (8 J) region (a) 1 h, (b) 6 h, (c) 29 h after the moment of impact.
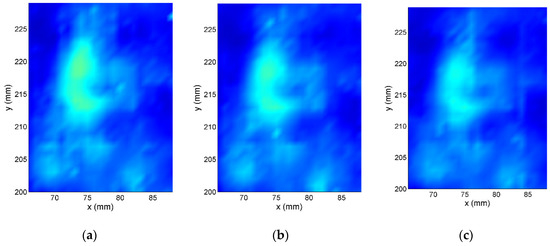
Figure 16.
Close-up of BVID (5 J) region (a) 1 h, (b) 6 h, (c) 29 h after the moment of impact.
It may be concluded that 8 J impact is detected with its size, shape and severity on both damage maps. The second impact scenario is hardly noticeable, so it is on the limit of this method.
Based on all data processed, the energy at damage area is presented (Figure 17) as a function of time (T), where T = 0 stands for the moment of impact. The results are put together with reference signals.
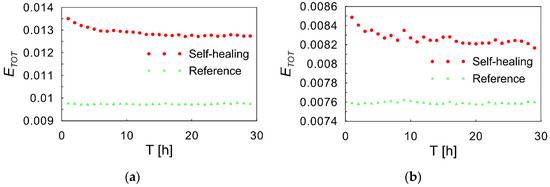
Figure 17.
Total damage map energy at impact region: (a) 8 J scenario; (b) 5 J scenario.
Using obtained energies for tested and reference states, relative damage severity was estimated (Equation (10)) and is given in Figure 18. It may be concluded that the self-healing process has exponential-like character, and most of the healing is realized during first 20 hours. In the case of 8 J impact, the rate of the healing was estimated to be around 20%, while at lower energy impact (5 J) it was estimated to be around 40%.
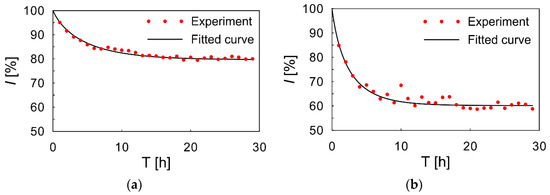
Figure 18.
Relative damage severity: (a) 8 J scenario; (b) 5 J scenario.
4. Conclusions
In this research, a novel method for nondestructive self-healing efficiency monitoring is proposed. This technique is based on the extraction of anomalies in the propagating Lamb waves, caused by delamination, from full wavefield scans. The presented method is an expansion of a previously published technique for damage detection, giving new tools for relative damage severity estimation. Tracking the severity of introduced BVID in self-healing material allowed for estimation of self-healing efficiency and monitoring its progress over time.
Experimental studies were performed on the GFRP plate with embedded microcapsules, in which two impact-induced defects were introduced. The self-healing process was monitored for 29 h from the impact moment. The estimated self-healing efficiencies were 20% and 40% for 8 and 5 J impact damage cases, respectively. However, it should be mentioned that further studies with destructive testing should be prepared in the future to give an exact correlation between the proposed index and the strength changes of the tested material.
Author Contributions
Conceptualization, M.R., P.K., R.K., P.B., A.B. and W.O.; methodology, P.K., M.R., R.K. and P.B.; software, M.R.; investigation, P.B., R.K., M.R. and P.K., writing—original draft preparation, M.R. and P.B.; writing—review and editing, P.K.; visualization, M.R.; supervision, W.O. and A.B.; project administration, A.B. and W.O.; All authors have read and agreed to the published version of the manuscript.
Funding
This research was funded by the Polish National Centre for Research and Development, grant number PBS3/A9/30/2015.
Conflicts of Interest
The authors declare no conflict of interest.
References
- Davies, G.A.O.; Olsson, R. Impact on composite structures. Aeronaut. J. 2004, 108, 541–563. [Google Scholar] [CrossRef]
- Richardson, M.O.W.; Wisheart, M.J. Review of low-velocity impact properties of composite materials. Compos. Part A Appl. Sci. Manuf. 1996, 27, 1123–1131. [Google Scholar] [CrossRef]
- Foote, P. New Guidelines for Implementation of Structural Health Monitoring in Aerospace Applications. SAE Int. J. Aerosp. 2013, 6, 525–533. [Google Scholar] [CrossRef]
- Trask, R.S.; Williams, G.J.; Bond, I.P. Bioinspired self-healing of advanced composite structures using hollow glass fibre. J. R. Soc. Interface 2007, 4, 363–371. [Google Scholar] [CrossRef] [PubMed]
- Wool, R.P.; O’Connor, K.M. A theory of crack healing in polymers. J. Appl. Phys. 1981, 52, 5953–5963. [Google Scholar] [CrossRef]
- Keller, M.W.; Crall, M.D. Self-Healing Composite Materials. In Comprehensive Composite Materials II; Beaumont, P.W.R., Zweber, C.H., Eds.; Elsevier: Oxford, UK, 2018; Volume 6, pp. 431–453. [Google Scholar]
- Kadi, M.E.; Blom, J.; Wastiels, J.; Aggelis, D.G. Use of early acoustic emission to evaluate the structural condition and self-healing performance of textile reinforced cements. Mech. Res. Commun. 2017, 81, 26–31. [Google Scholar] [CrossRef]
- Li, W.; Jiang, Z.; Yang, Z. Acoustic characterization of damage and healing of microencapsulation-based self-healing cement matrices. Cem. Concr. Compos. 2017, 84, 48–61. [Google Scholar] [CrossRef]
- Fan, S.; Li, M. X-ray computed microtomography of threedimensional microcracks and self-healing in engineered cementitious composites. Smart Mater. Struct. 2015, 24, 015021. [Google Scholar] [CrossRef]
- McCombe, G.P.; Rouse, J.; Trask, R.S.; Withers, P.J.; Bond, I.P. X-ray damage characterisation in self-healing fibre reinforced polymers. Compos. Part A Appl. Sci. Manuf. 2012, 43, 613–620. [Google Scholar] [CrossRef]
- Prajer, M.; Wu, X.; Garcia, S.J.; van der Zwaag, S. Direct and indirect observation of multiple local healing events in successively loaded fibre reinforced polymer model composites using healing agent-filled compartmented fibres. Compos. Sci. Technol. 2015, 106, 127–133. [Google Scholar] [CrossRef]
- Feiteira, J.; Tsangouri, E.; Gruyaert, E.; Lors, C.; Louis, G.; De Belie, N. Monitoring crack movement in polymer-based self-healing concrete through digital image correlation, acoustic emission analysis and SEM in-situ loading. Mater. Des. 2017, 115, 238–246. [Google Scholar] [CrossRef]
- Zedler, L.; Hager, M.D.; Schubert, U.S.; Harrington, M.J.; Schmitt, M.; Popp, J.; Dietzek, B. Monitoring the chemistry of self-healing by vibrational spectroscopy—Current state and perspectives. Mater. Today 2014, 17, 57–69. [Google Scholar] [CrossRef]
- Zainuddin, S.; Arefin, T.; Fahim, A.; Hosur, M.V.; Tyson, J.D.; Kumar, A.; Trovillion, J.; Jeelani, S. Recovery and improvement in low-velocity impact properties of e-glass/epoxy composites through novel self-healing technique. Compos. Struct. 2014, 108, 277–286. [Google Scholar] [CrossRef]
- Ostachowicz, W.; Radzienski, M.; Kudela, P. 50th Anniversary Article: Comparison Studies of Full Wavefield Signal Processing for Crack Detection. Strain 2014, 50, 275–291. [Google Scholar] [CrossRef]
- An, Y.-K. Impact-Induced Delamination Detection of Composites Based on Laser Ultrasonic Zero-Lag Cross-Correlation Imaging. Adv. Mater. Sci. Eng. 2016, 2016, 8. [Google Scholar] [CrossRef]
- Rogge, M.D.; Leckey, C.A.C. Characterization of impact damage in composite laminates using guided wavefield imaging and local wavenumber domain analysis. Ultrasonics 2013, 53, 1217–1226. [Google Scholar] [CrossRef] [PubMed]
- Tian, Z.; Yu, L.; Leckey, C. Rapid guided wave delamination detection and quantification in composites using global-local sensing. Smart Mater. Struct. 2016, 25, 085042. [Google Scholar] [CrossRef]
- Kudela, P.; Radzienski, M.; Ostachowicz, W. Impact induced damage assessment by means of Lamb wave image processing. Mech. Syst. Signal Process. 2018, 102, 23–36. [Google Scholar] [CrossRef]
- Kudela, P.; Radzienski, M.; Ostachowicz, W. Identification of cracks in thin-walled structures by means of wavenumber filtering. Mech. Syst. Signal Process. 2015, 50, 456–466. [Google Scholar] [CrossRef]
- Bolimowski, P.A.; Bond, I.P.; Wass, D.F. Robust synthesis of epoxy resin-filled microcapsules for application to self-healing materials. Philos. Trans. R. Soc. A Math. Phys. Eng. Sci. 2016, 374, 20150083. [Google Scholar] [CrossRef] [PubMed]
© 2020 by the authors. Licensee MDPI, Basel, Switzerland. This article is an open access article distributed under the terms and conditions of the Creative Commons Attribution (CC BY) license (http://creativecommons.org/licenses/by/4.0/).