Article

Effects of an Eco-Friendly Sanitizing Wash on Spinach Leaf Bacterial Community Structure and Diversity

1
Australian Centre for Antimicrobial Resistance Ecology, School of Animal and Veterinary Sciences, The University of Adelaide, Mudla Wirra Rd, Roseworthy 5371, Australia
2
Ecas4 Australia Pty. Ltd., Unit 8/1 London Road, Mile End South SA 5031, Australia
3
Health and Biomedical Innovation, UniSA Clinical and Health Sciences, University of South Australia, Adelaide 5000, Australia
*
Authors to whom correspondence should be addressed.
Appl. Sci. 2020, 10(8), 2986; https://doi.org/10.3390/app10082986
Submission received: 16 February 2020 / Revised: 15 April 2020 / Accepted: 21 April 2020 / Published: 24 April 2020
(This article belongs to the Special Issue Sustainable Environmental Solutions)

Abstract

:
Ready-to-eat (RTE) spinach is considered a high-risk food, susceptible to colonization by foodborne pathogens; however, other microbial populations present on the vegetable surface may interact with foodborne pathogens by inhibiting/inactivating their growth. In addition, sanitizers applied to minimally processed salad leaves should not disrupt this autochthonous barrier and should be maintained throughout the shelf life of the product. This investigation aimed at comparing the effects of a pH neutral electrochemically activated solution (ECAS), a peroxyacetic acid (PAA)-based commercial sanitizer (Ecolab Tsunami® 100), and tap water wash on the minimally processed spinach leaf microbiome profile for 10 days after washing. The bacterial microbiota composition on spinach samples was assessed by 16S rRNA pyrosequencing and downstream analyses. Predominant phyla observed in decreasing order of abundance were Proteobacteria, Bacteroidetes, Actinobacteria and Firmicutes corresponding with the dominant families Micrococcaceae, Clostridiales Family XII, Flavobacteriaceae, Pseudomonadaceae, and Burkholderiaceae. Bacterial species richness and evenness (alpha diversity) and bacterial community composition among all wash types were not significantly different. However, a significant difference was apparent between sampling days, corresponding to a loss of overall heterogeneity over time. Analysis of composition of microbiome (ANCOM) did not identify any amplicon sequence variants (ASVs) or families having significantly different abundance in wash types; however, differences (17 ASVs and five families) were found depending on sampling day. This was the first bacterial microbiome composition study focused on ECAS and PAA-based wash solutions. These wash alternatives do not significantly alter microbial community composition of RTE spinach leaves; however, storage at refrigerated temperature reduces bacterial species heterogeneity.

1. Introduction

A wide range of microbes, with distinct phylogenetic structure, is associated with the aerial organs (phyllosphere) of plants through parasitic or symbiotic interactions; in particular, bacteria are the most common microorganisms colonizing plant phyllosphere in comparison to fungi and archaea. The bacterial communities associated with edible leafy vegetables are less diversified than those of farm soil and coastal seawater habitats [1]. Actinobacteria, Bacteroidetes, Firmicutes, and Proteobacteria are the predominant bacterial phyla present in ready-to-eat (RTE) leafy vegetables (which are consumed raw, either treated or minimally processed) [2,3,4,5,6]. The core bacterial genera identified in most studies are Pseudomonas, Sphingomonas, Methylobacterium, Bacillus, Massilia, Arthrobacter, and Pantoea [2,3]. Human pathogens mostly associated with RTE leafy vegetables include Escherichia coli O157:H7, Listeria monocytogenes, and Salmonella spp. [7,8], but these are greatly affected by the vegetable type and bacterial community structure [9,10].
Lettuce and spinach are minimally processed RTE vegetables highly susceptible to colonization by foodborne pathogens [11]; therefore, various post-harvest sanitizing washing strategies are generally implemented to reduce spoilage and eliminate human pathogens. Today, the effectiveness of a post-harvest sanitizer is assessed based on its effect on the overall microbial populations, in addition to its propensity to reduce the microbial load and eliminate foodborne pathogens [12]. The composition of the microbiome community is assessed because the microbiome present on fresh produce is not only responsible for spoilage but rather acts as a natural biological barrier against spoilage organisms and pathogens, which constitute a smaller subset of the whole soil microbial population [13,14,15]. Furthermore, the bacterial microbiota on the surface of the plant inhibits or inactivates the growth of bacterial pathogen by producing acidic antimicrobial peptides and other secondary metabolites [16,17,18] that adversely affect the survival of the pathogen [19].
Bacterial population on RTE spinach is generally assessed using traditional culture-based techniques or specific polymerase chain reaction (PCR) to detect pathogens known for public health risk and quantify the population of indicator bacteria. Molecular techniques such as denaturing gradient gel electrophoresis and terminal restriction length polymorphism have been used for the analysis of 16S ribosomal RNA (rRNA) gene to understand the bacterial community of the phyllosphere on spinach leaves [20,21,22]. Contemporary next-generation sequencing techniques are now widely used for comprehensive analysis of the composition of bacterial community due to the increase in the depth of sequence readings and improved easier to use bioinformatics pipelines [23,24]. This method, in addition to providing information on the community structure, provides insights into the association of bacterial phyllosphere diversity with environmental factors [6,23], use of biocidal agents [6,23], and pesticides [6,25]. It also provides the interaction dynamics of the composition of the bacterial community with the various stages of plant growth, post-harvest, during processing and storage [3,23,26,27].
For leafy vegetable processing, chlorine- or peroxyacetic acid (PAA)-based sanitizers are commonly used. Chlorine is used for its effectiveness and low cost, whereas PAA for its activity over a wide pH range and limited reaction with organic matter. Electrochemically activated solution (ECAS) with an approximately neutral pH (6.5–7.5) has been suggested as a promising alternative washing solution with disinfection capability comparable to that of other commonly used disinfection chemicals such as chlorine and PAA [28,29,30,31,32]. Izumi [28] reported that neutral ECAS containing 50 mg/L of free available chlorine (FAC), completely inactivated the total bacteria on leaf surface. Guentzel et al. [31] reported a reduction of 4.0–5.0 Log10 CFU/mL of E. coli, S. typhimurium, S. aureus, L. monocytogenes, and E. faecalis inoculated on spinach leaves, working with 100 mg/L and 200 mg/L of FAC.
The sanitizers used in washing RTE vegetables have a different influence on bacterial microbiota. Some sections of the bacteria composition of plants affect the survival of pathogens through competition for limited nutrients or production of growth inhibitors [16,19,33], and others facilitate the growth of pathogens through the metabolism of different carbon sources [24]. Chlorine-based washing has previously been reported to reduce the number of microbes that inhibit the growth of pathogens in lettuce and spinach [18]. Gu et al. [25] observed changes in the bacteria community in spinach leaves washed with chlorine. Tatsika et al. [34] reported a reduction in the richness of the bacterial community of RTE spinach without affecting bacterial diversity after washing the spinach leaves with vinegar. However, the effect of washing with ECAS on the composition of the microbiome of RTE spinach leaves compared to that of PAA sanitizer has not previously been assessed.
This study evaluated the effect of an ECAS at neutral pH with proven efficacy against foodborne pathogens and in reducing the overall bacterial load in RTE spinach [28,35,36,37] focusing on the structure of the bacterial community present on RTE spinach leaves. We compared the changes in the profile of the bacterial microbiome in minimally processed fresh spinach leaves washed with tap water, PAA (50 mg/L), and ECAS (50 mg/L and 85 mg/L of FAC) on days 0, 5, and 10 after the sanitizing wash and storage at 4 ± 1 °C. Furthermore, a comparative analysis of the bacterial composition was performed through an analysis of the composition of microbiomes among all the treatment types and sampling days.

2. Materials and Methods

2.1. Sanitizers Treatment of Spinach Leaves

Freshly cut Tasmanian baby spinach leaves, grown in soil, stored and shipped at 4 ± 1 °C, were used within 24–48 h of receipt. ECAS (produced by Ecas4 Australia Pty Ltd., Mile End South, Adelaide, South Australia, Australia) was also stored at 4 ± 1 °C and used within one week of production, diluted in Milli-Q water (Milli-Q academic A10 deionizer, Millipore Corporation, Molsheim, France) to 50 mg/L and 85 mg/L of FAC. Peroxyacetic acid (Ecolab Tsunami® 100, which nominally contains 30–60% acetic acid, 10–30% peroxyacetic acid and 10–30% H2O2), commonly used as a post-harvest sanitization of fresh agriculture produce, was used at 50 mg/L of PAA. The temperature, pH, and oxidation-reduction potential (ORP) of ECAS, Tsunami® 100, and tap water were measured using a portable MC-80 m (TPS Pty Ltd., Brendale, Queensland, Australia). The quantities of free and total chlorine in ECAS were measured using a Free Chlorine Checker® HC-HI701 and a Total Chlorine Checker HC-HI711, both from Hanna Instruments (Keysborough, Victoria, Australia). The amount of PAA in Tsunami® 100 was measured using specific test strips (Hydrion PAA160 Peroxyacetic Acid (PAA) Sanitizer Test Strips, Brooklyn, New York, USA).
Three samples of spinach leaves (200 g each) were washed with 800 mL of either tap water (control, pH 7.4 ± 0.1) or sanitizers (52 ± 2 mg/L of PAA, ORP of 492 ± 15 mV, pH 3.6 ± 0.1; ECAS with 48 ± 4 mg/L of FAC, ORP of 833 ± 13, pH 7.1 ± 0.2; and ECAS with 82 ± 4 mg/L of FAC, ORP of 864 ± 13, pH 7.0 ± 0.2) at 4 ± 1 °C for 60 s, and the excess liquid removed using a salad spinner at 70 rpm for 30 s. Samples (3 × 25 g) from each treatment were homogenized in 225 mL of sterile 0.1% peptone water for 60 s in a stomacher (BA 6021 Stomacher, Seward Ltd., Worthing, UK) immediately after treatment (day 0) and stored at −20 °C. Spinach samples from each treatment were stored at 4 ± 1 °C and further processed on day 5 and day 10, as described by Ogunniyi et al. [37].

2.2. Samples Preparation for Variable V3-V4 Region Sequencing

Samples stored at −20 °C were thawed in a shaking incubator kept at 20 °C for about 45 min. Samples from each type of treatment and for the various sampling days were centrifuged at 15,000× g for 15 min; the supernatants were discarded, and the pellets were frozen at −20 °C for DNA extraction. The DNA from the samples was then isolated and purified using the Qiagen QIAamp DNA Mini Kit (Cat. #51304, Germantown, MD, USA) as per the manufacturer’s instructions. DNA concentrations were measured using the multi-mode microplate reader (CLARIOstar Plus).
The amplicon-sequence PCR was performed using the 16S DNA V3-V4 region primers from Klindworth et al. [38] and following the guidelines provided in “16S Metagenomic Sequencing Library Preparation” (Part #15044223 Rev. B) [39]. PCR products were confirmed to produce a single amplicon size of ~460 bp after electrophoresis on a 2.0% agarose gel. Aliquots (25 µL) of all samples were subjected to clean-up PCR, index PCR, second clean-up PCR and MiSeq 16S metagenomic sequencing at the South Australian Health and Medical Research Institute (SAHMRI), Adelaide, South Australia. The data analyzed were based on Illumina Miseq sequences of 300 bp paired amplicon sequences from the V3 and V4 region of 16S rRNA gene from baby spinach leaf samples with and without sanitizing treatments. The profile of the demultiplexed fastq paired-end reads was assessed using FastQC [40] for sequence quality scores and adapter contents. First, the forward reads were truncated at position 260 and the reverse at position 220 to remove low quality reads (<26 Phred). Trimming was set up for the first 20 nucleotides for forward reads and 10 nucleotides for reverse reads to remove primer sequences and low-quality reads. The trim and filter parameters were performed jointly on the paired-end read by setting a maximum of two errors expected per read [41], so that both paired-end reads passes the filter for the pair to pass. Downstream analysis to infer the amplicon sequence variants (ASVs) was performed in R version 3.5.3 [42] using the DADA2 workflow that resolves variants that differ by a single nucleotide [43]. Taxonomic assignments were made for the sequence variants data implementing the naïve Bayesian classifier method [44] using the SILVA reference data set (version 132) [45] formatted for DADA2 [46]. The DECIPHER R package [47] was used for the alignment of multiple sequences, and a phylogenetic tree was built using the phanghorn R package [48]. The phyloseq R package [49] was used to synthesize sample data, phylogeny and taxonomic assignment objects into a single phyloseq object. Further downstream analyses and graphical visualization of the microbiome data were performed in phyloseq [49] and Shiny-phyloseq [50] R packages.

2.3. Statistical Analysis

Calculations of alpha diversity indexes were performed in R versions 3.5.3 [42] with the phyloseq R package [49]. The Shannon and inverse Simpson indexes were compared among the variables since these indexes consider the richness and evenness that are powerful in providing insights into the structure of the microbial community [51,52]. In addition, the number of ASVs (species) was estimated using the observed richness and Chao1 richness estimator. The alpha diversities among the groups of samples were statistically tested using the analysis of variance (ANOVA) test to evaluate any differences in the microbial composition among treatment types and sampling days, as both variables (treatment type and sampling day) had more than two levels and the data distribution was normal according to the Shapiro–Wilk normality test. Tukey’s honest significance test as a post hoc test was performed on the ANOVA results to compare within-group alpha diversity.
Measurements of samples similarity (beta diversity) with the R phyloseq and vegan packages [53] were also performed at ASV level based on non-metric multidimensional scaling (NMDS) Bray–Curtis dissimilarity [54] and Unifrac distances [55], which include abundance and phylogenetic information respectively, in addition to taxon counts. Statistical significance testing among the groups, such as the type of sanitization and the days post sanitizing treatment, was performed using permutational multivariate analysis of variance (PERMANOVA) [56] using the adonis function in the R package vegan. The community pattern of microbial composition among the groups using taxon dissimilarity information was visualized by NMDS Bray–Curtis and Unifrac ordination methods. In addition, microbiota heterogeneity, a measure of dissimilarity of the beta diversity (Bray–Curtis) of each sample with respect to the group, was compared between the various types of treatment (sanitizing and control washes) and days of sampling to evaluate the differences in homogeneity of each treatment group and homogeneity of sampling day using the R package microbiome [57]. Statistical tests for multiple variables within the type of treatment and sampling days were performed by the betadisper function on distance matrix (Bray–Curtis), and an ANOVA was performed to compare the variances between pairs of groups using the permutest function by setting the pairwise variable to true and the number of permutations to 1000 on R package vegan [56].
Analysis of differentially abundant taxa among the types of sanitization and days 0, 5, and 10 post treatment, at ASV and family level, were performed using analysis of composition of microbiomes (ANCOM) [58] plugin in QIIME 2 [59], at ASV and genus levels. For ANCOM analysis, ASVs present in less than three samples and ASV frequencies below fifty were removed before the analysis.

2.4. Data Submission

The access number for raw reads submitted to GenBank-SRA is PRJNA576552.

3. Results

We characterized the overall bacterial composition of minimally processed spinach leaves using high-throughput amplicon sequences from the V3–V4 region of the 16S rRNA gene. Moreover, changes in bacterial composition at phyla and families levels were compared for the washed samples and the control (unwashed) on day 0, day 5 and day 10 post sanitization, and between the types of washing (ECAS, Tsunami® 100, and Tap Water). In addition, the differences in bacterial diversity associated with the days post-treatment and the types of sanitizer were evaluated.

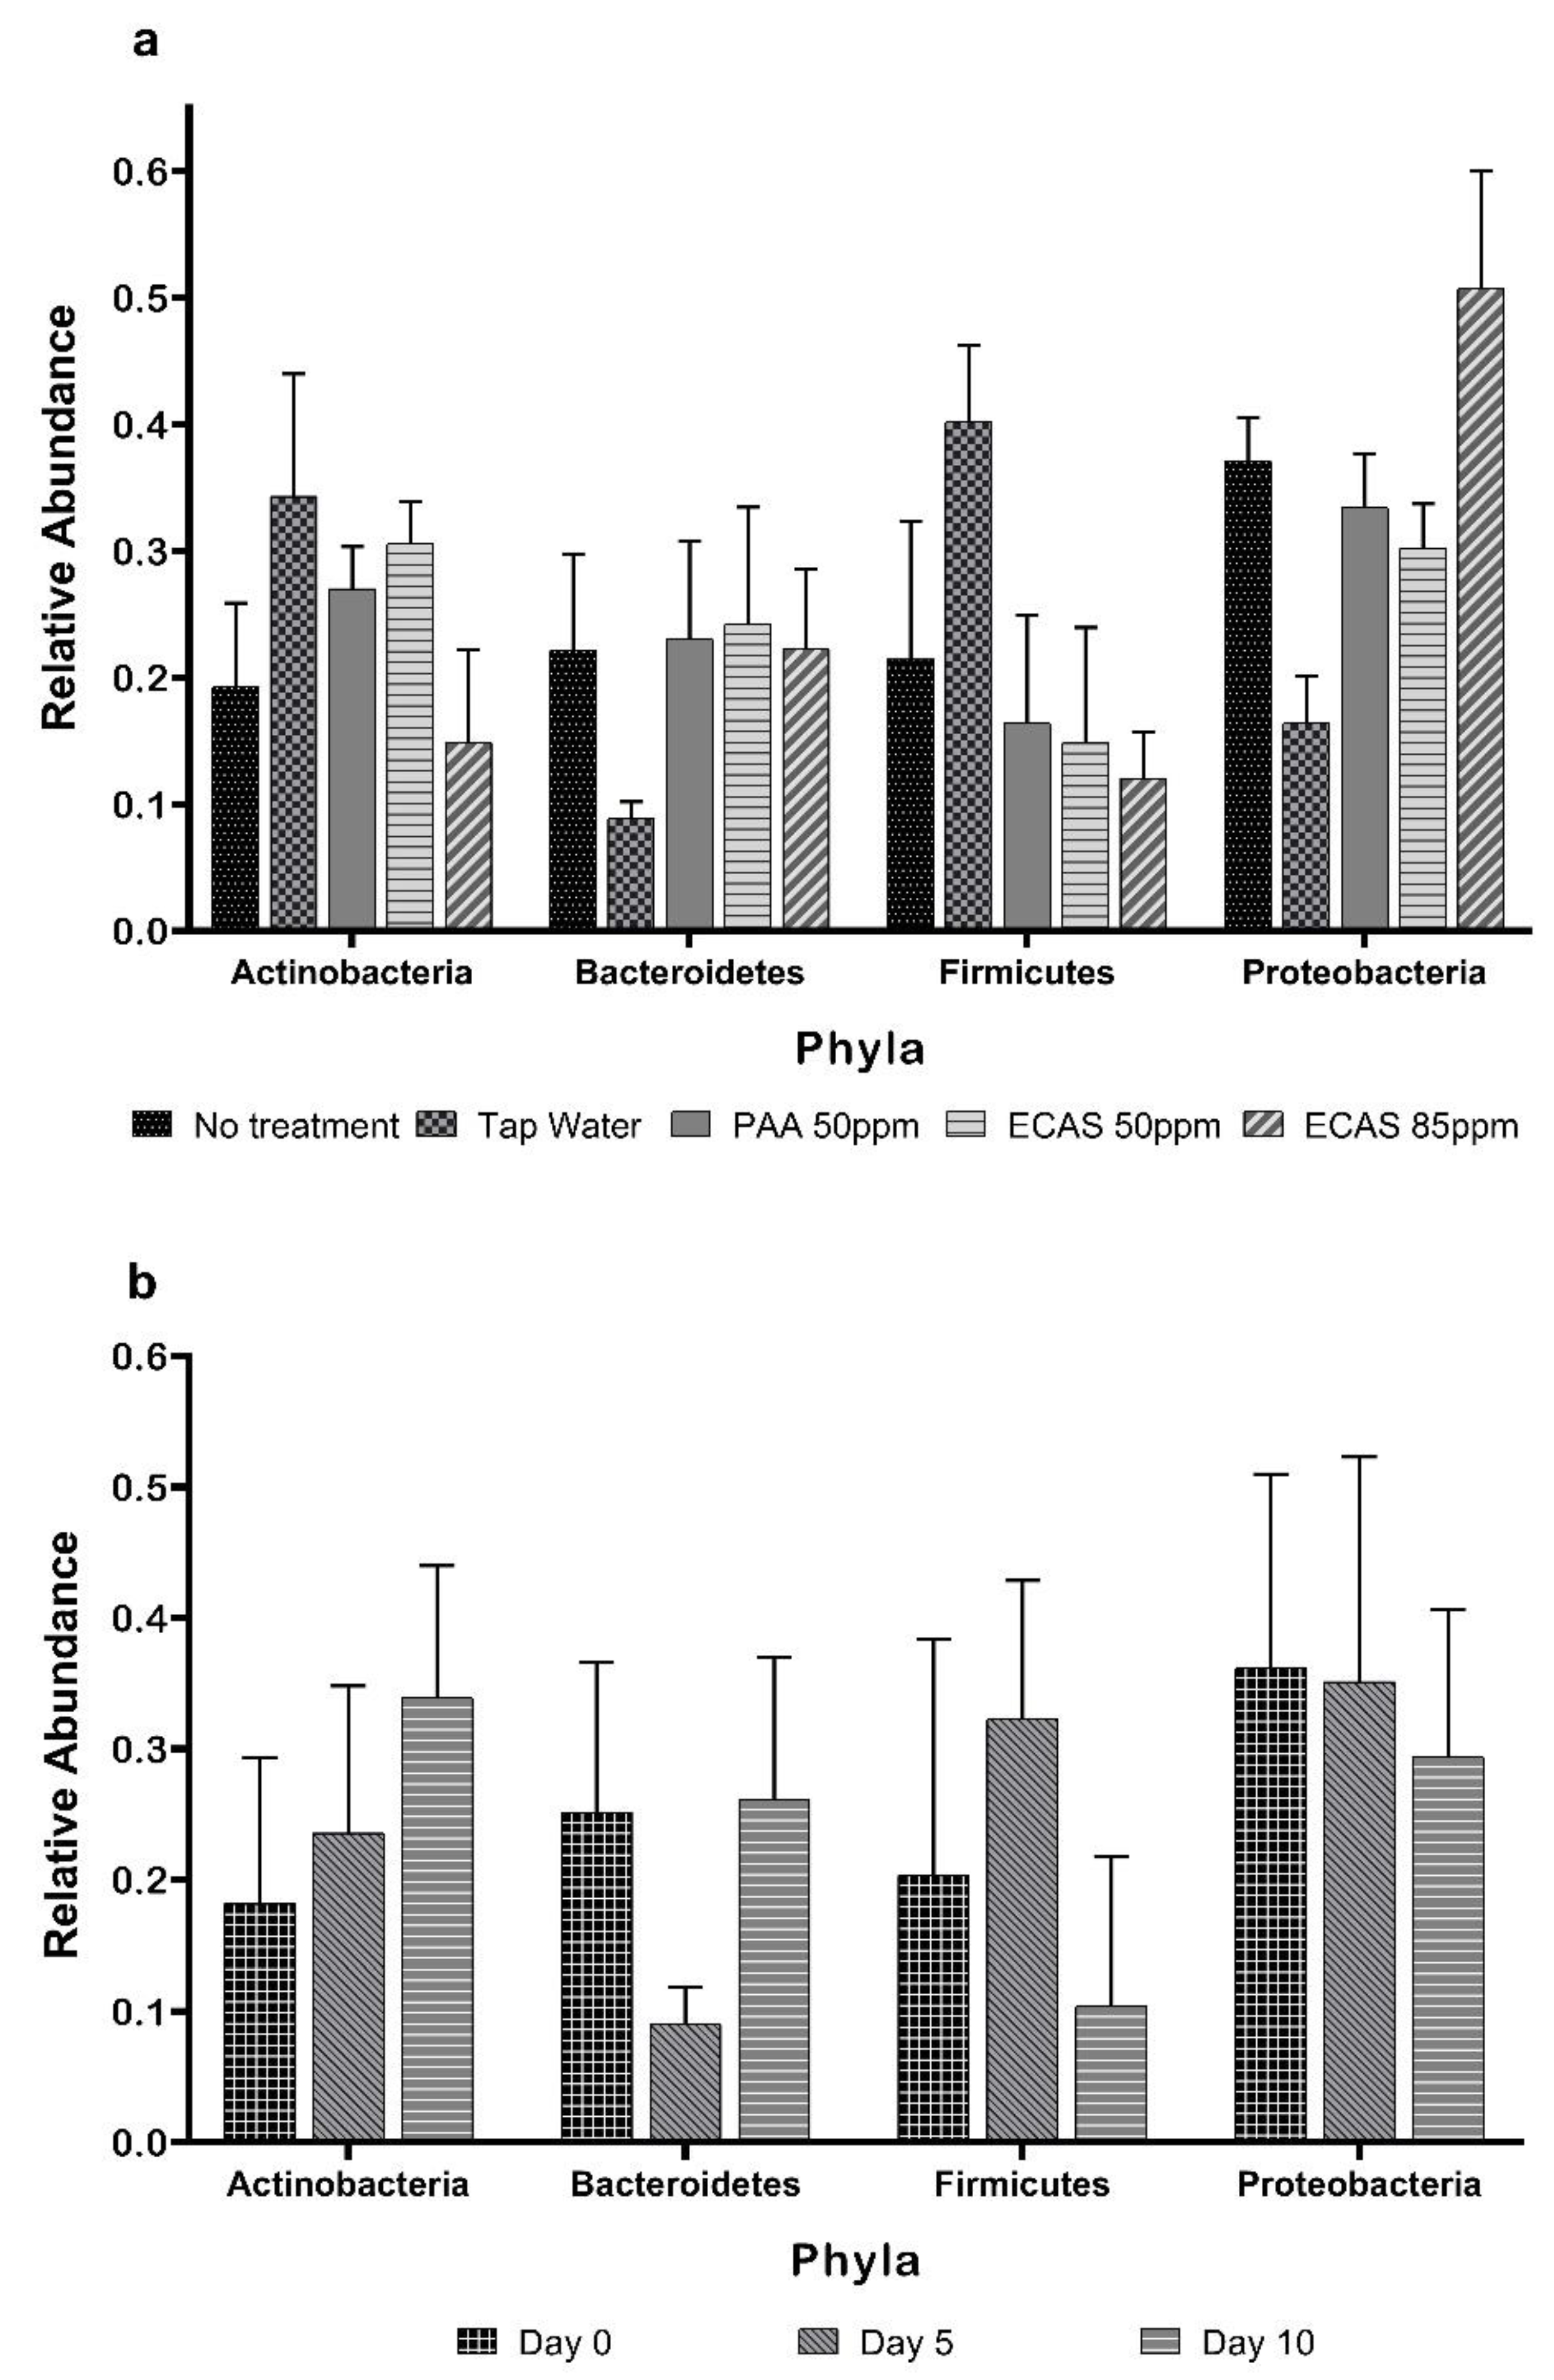
3.1. Composition of Spinach Bacterial Community

Overall, a total of 1,093,364 ASVs were observed, with a maximum of 113,737 and minimum of 39,474 reads. After removing uncharacterized phyla and contaminants and normalizing the data to the lowest number of reads (1000), the total number of ASVs reduced to 383,290 with a minimum of 1044 (observed for samples washed with ECAS at 85 mg/L of FAC on day 0) and a maximum of 50,871 (observed for samples washed with ECAS at 50 mg/L of FAC on day 5). The above reads were assigned to 12 distinct phyla, with the majority identified as Proteobacteria (2949 distinct ASVs), followed by Bacteroidetes (1876 ASVs), Actinobacteria (756 ASVs) and Firmicutes (396 ASVs). All other phyla had ≤8 ASVs (Table 1) and were excluded from further analysis [27] as the percentage abundance of these phyla were approximately 0.1% which would not affect the biological interpretation. All ASVs were assigned to one of 65 bacterial family identified and 84% of reads were further assigned to different bacterial genus with 158 genera identified. The five most abundant families identified were Micrococcaceae (28.2%), Clostridiales Family XII (19.7%), Flavobacteriaceae (17.9%), Pseudomonadaceae (12.8%), and Burkholderiaceae (10.1%). The five most abundant genera identified were Exiguobacterium (19.7%), Flavobacterium (17.7%), Arthobacter (15.4%), Pseudomonas (12.6%), and Paeniglutamicibacter (10.3%) (Table S1).
The overall relative abundances (RA) of phyla observed for all types of sanitization wash are presented in Figure 1a, and the relative abundances for the samples collected immediately after treatment (day 0) as well as on day 5 and day 10 after storage at 4 °C are presented in Figure 1b. On day 0, the phyla Proteobacteria had the highest RA (0.36 ± 0.07), while the phyla Actinobacteria had the lowest RA (0.18 ± 0.05). On day 5, Proteobacteria was still the most abundant phyla (0.35 ± 0.08), whereas phyla Bacteroidetes was the least abundant (0.09 ± 0.01). However, on day 10, Actinobacteria was the most abundant phyla (0.34 ± 0.05) and Firmicutes was the least abundant phyla (0.10 ± 0.05). The relative abundances of bacterial taxonomy at order level for sanitization wash types and sampling days are presented in Supplementary Figure S1.

3.2. Alpha Diversity

The alpha diversity metrics (Figure S2) and the Shapiro–Wilk tests for normality showed that the data were normally distributed. The alpha diversity measures for all samples are presented in Table 2. The mean ratio between observed to expected (Chao1) richness was >0.99 for all samples. The lowest Shannon (3.4), Inverse Simpson (17.6), and richness (Chao1 = 60) indexes were recorded for samples that were not washed (control) on day 0. The highest Shannon (5.6) and richness (771) indexes were recorded for the samples that were washed in ECAS at 85 mg/L of FAC on day 0, while the highest Inverse Simpson index (134.5) was observed for the no-wash control on day 5. Species richness (Shannon diversity and Inverse Simpson indexes) and species evenness (Chao1 and abundance-based coverage estimator, ACE) measures of the bacterial community structure were assessed for the four types of treatment plus control and the three sampling days. For all samples washed with sanitizers, the Shannon and Inverse Simpson diversity measures were higher than those found for the no-wash and tap water wash, but these measures were not significantly different (ANOVA and Tukey’s honestly significant difference (HSD)). Similar results on species richness (Chao1 and ACE) were observed, with no significant differences between all types of washing (Kruskal–Wallis and pairwise Wilcox (FDR corrected) (Table S2).

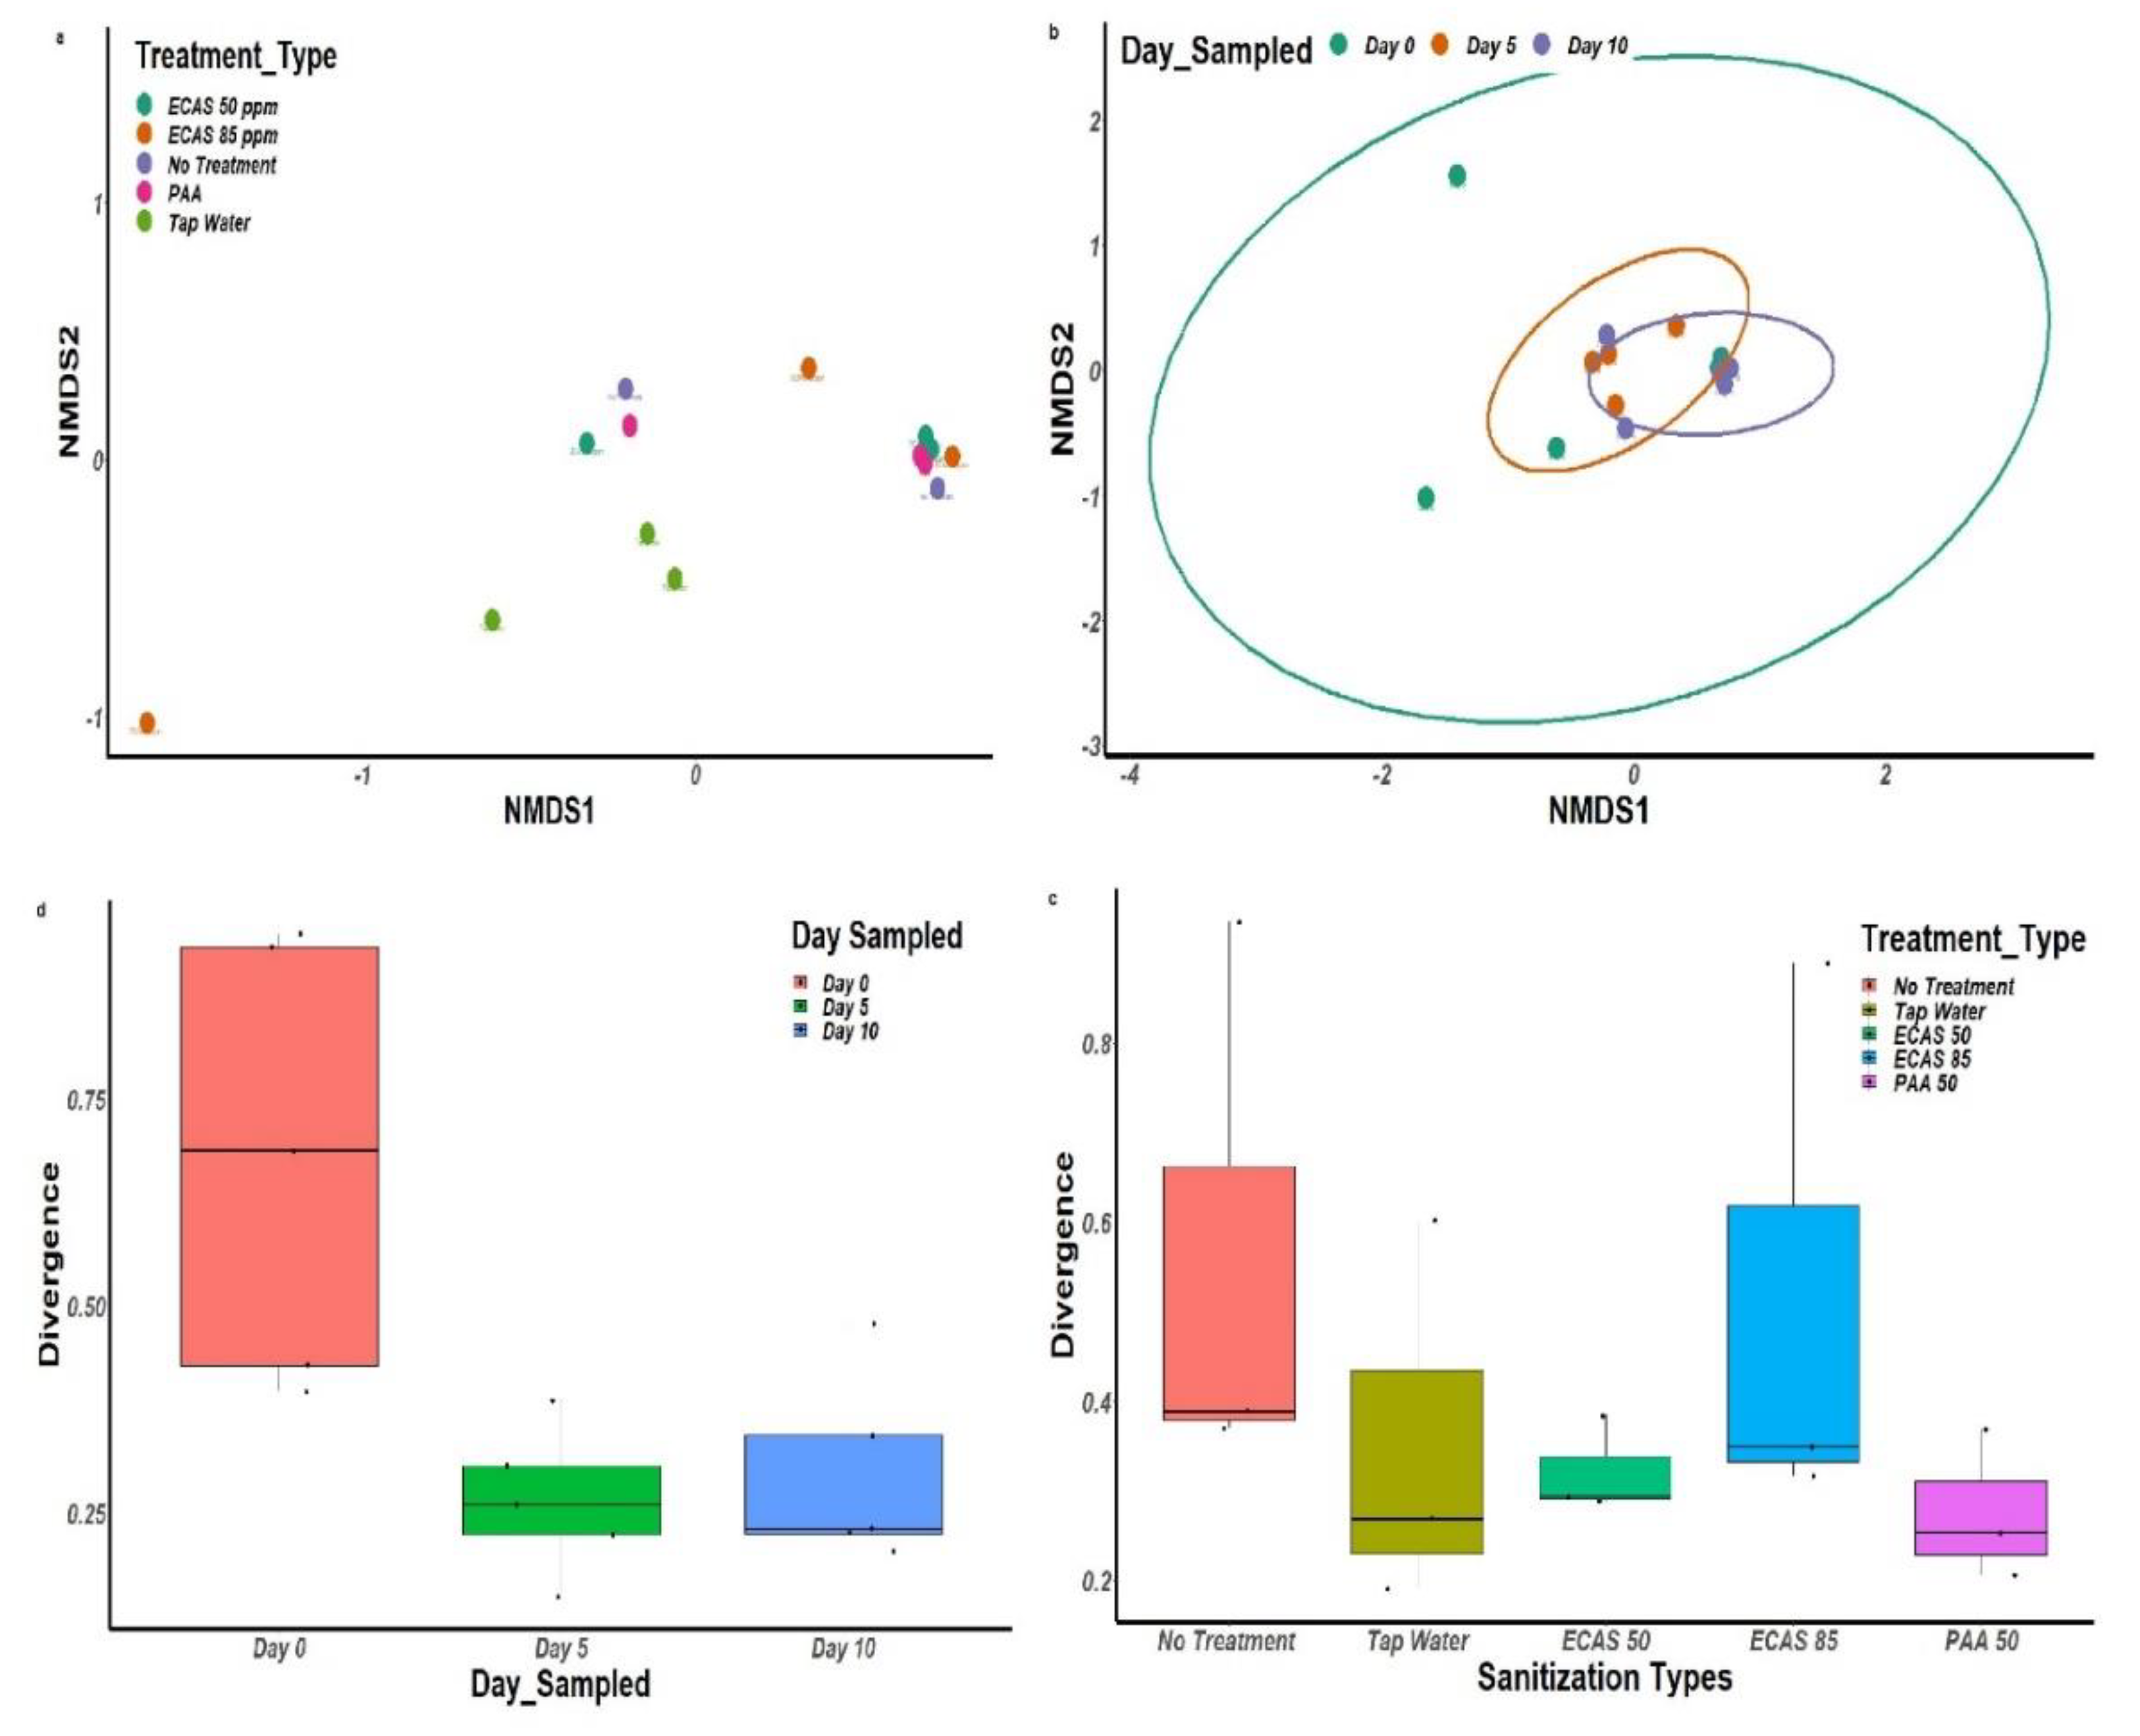
3.3. Bacterial Diversity Associated with Treatment Type and Sampling Day

The PERMANOVA analyses of microbial communities for the different types of treatment were not significantly different among all the variables tested (p = 0.053). PERMANOVA analysis of Bray–Curtis distances for sampling days determined that the microbial communities were significantly different on sampling days (p = 0.006) (Table 3a). Moreover, non-metric multidimensional scaling (NMDS) cluster analysis showed that the microbial communities for different treatment groups did not cluster into distinct treatment groups (Figure 2a); however, the bacterial communities on day 5 and day 10 assembled distinctly, with a divergent microbial community observed for day 0 (Figure 2b). Also the quantification of the group divergence between the treatment types (ECAS at 50 and 85 mg/L of FAC, tap water and PAA washing) plotted as a box and whisker diagram showed that the group homogeneity among treatment types did not differ (Figure 2c). However, it shows that the microbiota of the ECAS and PAA wash treatments were more homogenous, whereas the tap water wash and the no wash (control) samples were more divergent (Figure 2c). The group divergence measurement for the sampling days shows that samples on day 0 had a higher value (>0.7), indicating that the composition was more heterogeneous. On the contrary, samples on day 5 and day 10 had lower divergence values (>0.3 and >0.2, respectively), indicating homogenous microbiota (Figure 2d).
The statistical homogeneity test of the multivariate dispersion of microbial composition among the types of treatment and the sampling days showed that the variances between the different washing treatments were not significantly different. In the case of the sampling days, the composition changes between day 5 and day 10 were not significantly different, but changes between day 0 and day 5 and between day 0 and day 10 were significantly different (p < 0.05) (Table 3b).

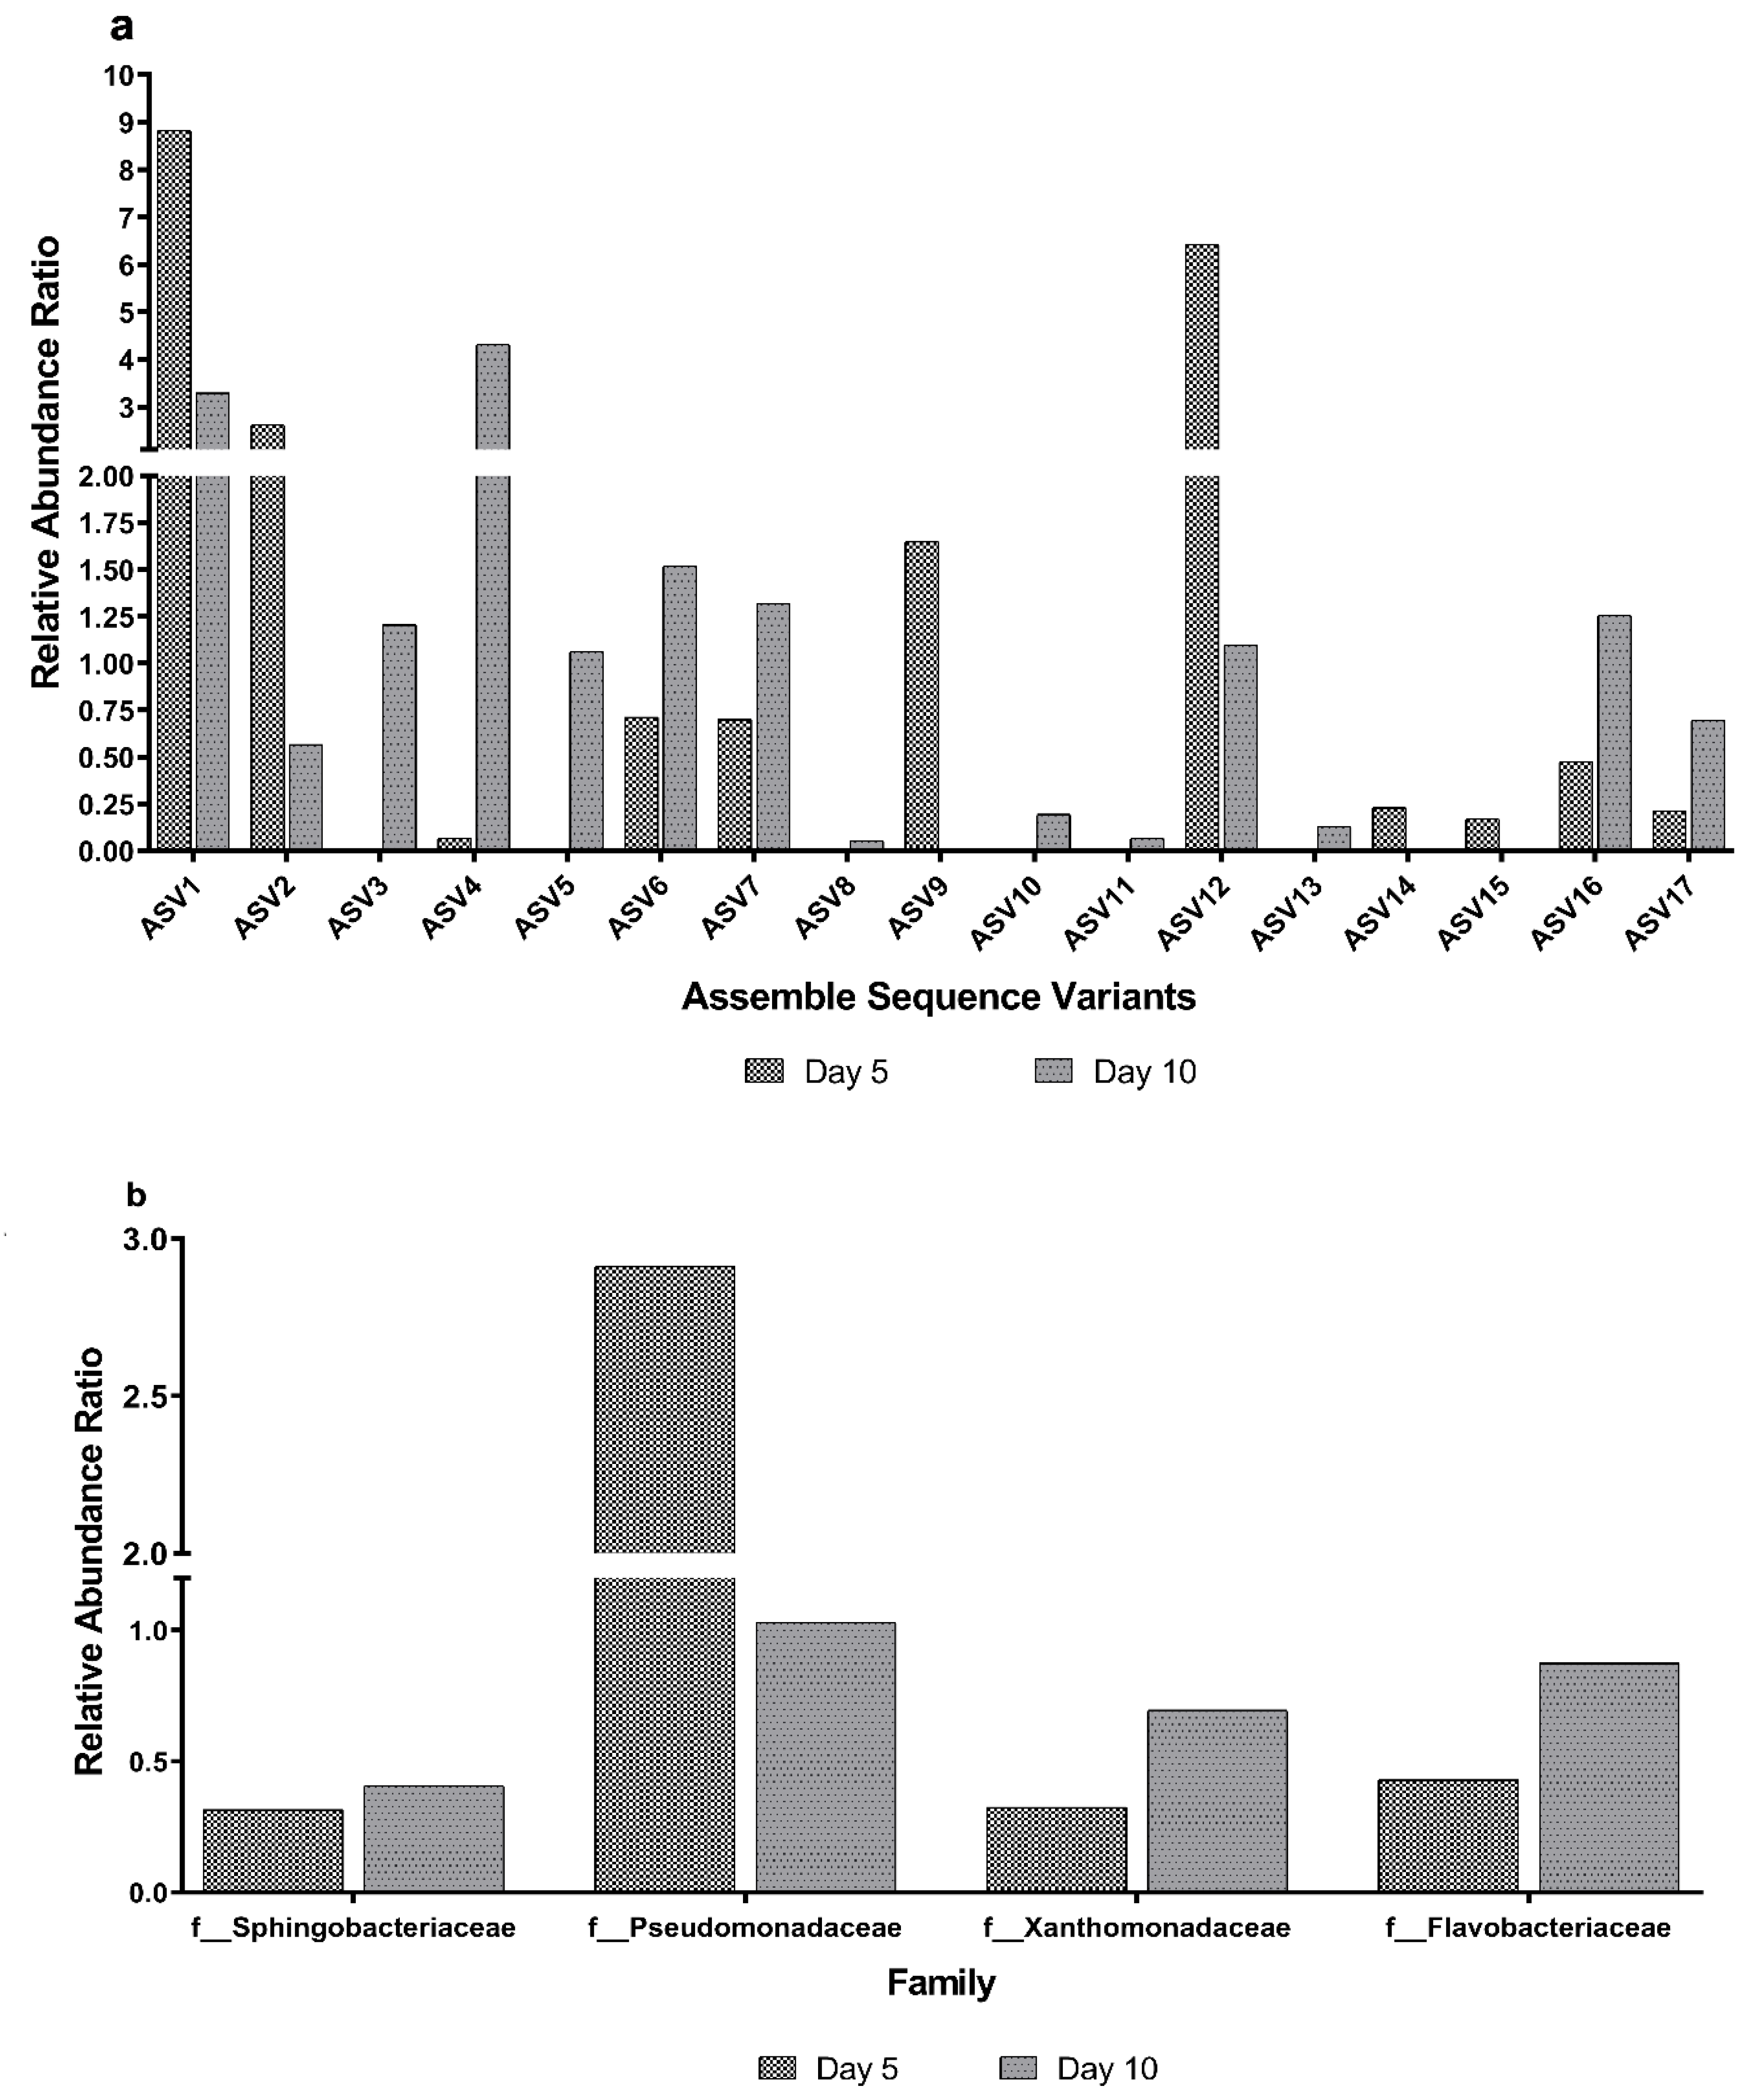
3.4. Taxa Differences Among the Different Sampling Days

ANCOM performed with a false discovery rate (FDR) of 0.05 identified 17 ASVs and four families with significantly different abundances (ANCOM W ≥ 5) among the different sampling days (Table 4). No significantly different ASVs and families were identified for the various washing treatments. The relative abundance ratios of ASVs and taxa rank family were calculated using day 0 as the basis for displaying the relative abundance in Figure 3a,b, respectively. Out of 17 ASVs identified as significantly different, 4 ASVs on day 5, and 8 ASVs on day 10 had an increase in relative abundance. An ASV identified as belonging to the Pseudomonadaceae family (unclassified genus) had the highest relative abundance (RA ratio of 8.82), followed by an ASV belonging to the Moraxellaceae family (Alkanindiges illinoisensis—RA ratio of 6.41) on day 5. ASVs identified as belonging to the Flavobacteriaceae (unclassified genus) and Pseudomonadaceae (unclassified genus) families had RAs of 4.3 and 3.2, respectively. ANCOM family-level analysis revealed that Pseudomonadaceae had the highest relative abundance (2.9) on day 5. The relative abundance of three additional families (Spingobacteriaceae, Flavobacteriaceae and Xanthomonadaceae) on day 5 and day 10 were lower than on day 0 (Table 4).

4. Discussion

This study investigated the microbiome profiles of RTE spinach leaves washed with different sanitizers (ECAS, PAA) and compared with leaves washed with tap water and not washed at all (control), at three time points over 10 days (day 0, day 5, and day 10). Although a higher proportion of ASVs was found compared to previous studies [26,27], their richness and evenness (alpha diversity) did not significantly differ among the types of sanitizer and the sampling points. We also found that the types of sanitizing washing, apart from a reduced heterogeneity over time, did not significantly influence the community structure of the bacteria (beta diversity). ANCOM analyses identified that the composition of ASVs and families changed significantly over the sampling days.
The number of ASVs identified (>2000) in the present study was much higher than that observed in the spinach leaf microbiome profiling studies by Gu et al. [26] and Söderqvist et al. [27], who identified 673 and 190 operational taxonomic units respectively. In addition, 12 phyla were identified in this study compared to the four phyla observed by Söderqvist et al. [27] and 14 phyla detected by Gu et al. [26]; however, the number of predominant phyla (n = 4) and their relative proportions are similar in all three studies. In agreement with previous observations, the phylum Proteobacteria showed the highest total abundance on day 0, followed by phyla Bacteroidetes, Firmicutes, and Actinobacteria [3,6,26,34]. The basal bacterial microbiome of RTE spinach leaves is therefore very similar to that of other minimally processed fruits and vegetables [3,6,27,34,60].
Our analyses also showed that the Shannon and Inverse Simpson diversity indexes and richness (ACE and Chao1) measures did not differ significantly among all spinach samples. Furthermore, the community composition of bacteria (beta diversity) for all types of washing did not differ significantly, indicating that ECAS treatments did not affect bacterial microbial diversity. This could be seen as a good outcome, since it has been suggested that the microbiome on fresh produce is not responsible for spoilage but acts as a natural biological barrier against spoilage organisms and pathogens [13,14,15]. On the other hand, a significant grouping of spinach microbial community structures was observed for sampling days and reduction over time of the heterogeneity of bacterial composition. The reduction in heterogeneity can be attributed to the reduction in the relative abundance of phylum Proteobacteria on day 5 and day 10, in accordance with the reduction observed by Gu et al. [26] in RTE spinach leaves washed with chlorine and stored at 4 °C for a week. Moreover, the microbiome community on day 10 clustered distinctly due to a significant increase in the relative abundance of Bacteroidetes, similar to that observed by Gu et al. [26] when the spinach leaves were stored at 4 °C for a week.
ANCOM is a method based on compositional log-ratios to detect differences in relative abundance and has been used to detect taxa abundance in the spinach microbiome at ASV and family level. Taxa at ASV and family level for the different types of treatment were not significantly different, but differences in ASVs and family-related abundances were identified at different sampling days. ASVs identified as Pseudomonadaceae and Moraxellaceae families, and the order Bacillales (unclassified family) had a high relative abundance on day 5. The increase in the relative abundance of these families of bacteria (Pseudomonadaceae and Moraxellaceae) has been correlated strongly with the spoilage of leafy vegetables at cold storage temperatures [34]. Increases in the relative abundance of the order Bacillales were also observed by Söderqvist et al. [27] and have been positively correlated with the increase in the viable counts of bacteria causing food safety concerns (Yersinia enterocolitica, Listeria monocytogenes and E. coli O157:H7) [27]. A significant increase was observed for four ASVs (classified as Pseudomonadaceae, Flavobacteriaceae, Micrococcaceae and Oxalobacteraceae) on day 10 and it is interesting to note that the relative abundance of the order Flavobacteriales was negatively correlated with foodborne pathogens in a previous study [27]. The predominance of Micrococcaceae and Oxalobacteraceae may be explained by their ability to grow at extremely low temperatures [61]; they are considered putative protectors against Rhizoctonia (fungal) rot of root crops [62]. The abundance of the family Xanthomonadaceae was significantly reduced on day 10, as observed by Lopez-Velasco et al. [3] and Schwartz et al. [60]. Similarly, the abundance of Spingobacteriaceae was significantly reduced, and the order Sphingobacteriales was correlated positively to Escherichia coli O157:H7 counts and negatively to L. monocytogenes and Y. enterocolitica counts [27].

5. Conclusions

To our knowledge, this study represents the first documented profile of the bacterial microbiome present on minimally processed RTE Australian spinach treated with ECAS. We have shown that washing with a neutral ECAS did not significantly change the composition of the bacterial communities compared to washing with PAA (Tsunami® 100) and tap water. In addition, complete changes over time in the community composition of bacterial species have been documented during storage at refrigeration temperature (4 ± 1 °C) on day 5 and day 10 after washing treatments, compared to day 0. The information that ECAS does not change the structure of the bacterial community could help select an environmentally friendly biocidal agent capable of meeting the aesthetic needs of current consumers and production industries.

Supplementary Materials

The following are available online at https://www.mdpi.com/2076-3417/10/8/2986/s1, Figure S1. Relative Abundance ratio of bacterial taxonomy level order for sanitization wash types and sampling days.; Figure S2. Visualization of Shannon and Inverse–Simpson diversity (alpha-diversity) and Chao and ACE richness metrics of all samples.; Table S1. Total abundances and percentage abundances of most abundant taxa at family and genus level.; Table S2. Probability values of analysis of variance (ANOVA), Tukey’s HSD test on ANOVA of Shannon diversity index, Kruskal–Wallis H test, and Wilcoxon pairwise rank-sum test of Chao1 richness comparing alpha diversity metrics among the types of sanitizing treatment (Treatment Types) and day post-sanitation treatment (Day Sampled). Alpha diversity was not significantly different among the types of treatment and the sampling days, as determined by ANOVA and Tukey’s HSD test.

Author Contributions

Conceptualization, S.T. and A.D.O.; Data curation, S.T.; Formal analysis, S.T.; Methodology, S.T. and A.D.O.; Supervision, D.J.T. and P.D.; Visualization, S.T.; Writing, original draft, S.T.; Writing, review and editing, S.T., A.D.O, S.F., P.D., and D.J.T. All authors have read and agreed to the published version of the manuscript.

Funding

Ecas4 Australia Pty Ltd. funded the study, including the 16s rRNA pyrosequencing.

Acknowledgments

S.T. was supported by the Endeavour Postgraduate Scholarship. ANCOM analysis was performed with supercomputer resources provided by the Phoenix HPC service of the University of Adelaide. We would like to acknowledge Mark Van der Hoek (David Gunn Genomics Facility, South Australian Health and Medical Research Institute, Australia) for his generous technical guidance on preparing samples for genomic analysis.

Conflicts of Interest

Page: 12, Ecas4 Australia Pty Ltd. played no role in the study design, data collection and interpretation, and decision to submit the article for publication. The authors declare no conflict of interest.

References

  1. Lindow, S.E.; Brandl, M.T. Microbiology of the Phyllosphere. Appl. Environ. Microbiol. 2003, 69, 1875–1883. [Google Scholar] [CrossRef] [PubMed] [Green Version]
  2. Delmotte, N.; Knief, C.; Chaffron, S.; Innerebner, G.; Roschitzki, B.; Schlapbach, R.; Von Mering, C.; Vorholt, J.A. Community proteogenomics reveals insights into the physiology of phyllosphere bacteria. Proc. Natl. Acad. Sci. USA 2009, 106, 16428–16433. [Google Scholar] [CrossRef] [PubMed] [Green Version]
  3. Lopez-Velasco, G.; Welbaum, G.; Boyer, R.; Mane, S.; Ponder, M.A. Changes in spinach phylloepiphytic bacteria communities following minimal processing and refrigerated storage described using pyrosequencing of 16S rRNA amplicons. J. Appl. Microbiol. 2011, 110, 1203–1214. [Google Scholar] [CrossRef] [PubMed]
  4. Rastogi, G.; Sbodio, A.; Tech, J.J.; Suslow, T.V.; Coaker, G.L.; Leveau, J.H.J. Leaf microbiota in an agroecosystem: Spatiotemporal variation in bacterial community composition on field-grown lettuce. ISME J. 2012, 6, 1812–1822. [Google Scholar] [CrossRef]
  5. Whipps, J.; Hand, P.; Pink, D.; Bending, G. Phyllosphere microbiology with special reference to diversity and plant genotype. J. Appl. Microbiol. 2008, 105, 1744–1755. [Google Scholar] [CrossRef] [PubMed] [Green Version]
  6. Leff, J.W.; Fierer, N. Bacterial Communities Associated with the Surfaces of Fresh Fruits and Vegetables. PLoS ONE 2013, 8, e59310. [Google Scholar] [CrossRef] [Green Version]
  7. Cordano, A. Occurrence of Listeria monocytogenes in food in Chile. Int. J. Food Microbiol. 2001, 70, 175–178. [Google Scholar] [CrossRef]
  8. De Oliveira, M.A.; De Souza, V.M.; Bergamini, A.M.M.; De Martinis, E.C.P. Microbiological quality of ready-to-eat minimally processed vegetables consumed in Brazil. Food Control. 2011, 22, 1400–1403. [Google Scholar] [CrossRef]
  9. Klerks, M.M.; Franz, E.; Van Gent-Pelzer, M.; Zijlstra, C.; Van Bruggen, A.H.C. Differential interaction of Salmonella enterica serovars with lettuce cultivars and plant-microbe factors influencing the colonization efficiency. ISME J. 2007, 1, 620–631. [Google Scholar] [CrossRef] [Green Version]
  10. Mitra, R.; Cuesta-Alonso, E.; Wayadande, A.; Talley, J.; Gilliland, S.; Fletcher, J. Effect of Route of Introduction and Host Cultivar on the Colonization, Internalization, and Movement of the Human Pathogen Escherichia coli O157:H7 in Spinach. J. Food Prot. 2009, 72, 1521–1530. [Google Scholar] [CrossRef]
  11. Hackl, E.; Hölzl, C.; Konlechner, C.; Sessitsch, A. Food of plant origin: Production methods and microbiological hazards linked to food-borne disease. Reference: CFT/EFSA/BIOHAZ/2012/01 Lot 1 (Food of plant origin with high water content such as fruits, vegetables, juices and herbs). EFSA Support. Publ. 2013, 10, 402E. [Google Scholar] [CrossRef] [Green Version]
  12. Gaglio, R.; Miceli, A.; Sardina, M.T.; Francesca, N.; Moschetti, G.; Settanni, L. Evaluation of microbiological and physico-chemical parameters of retail ready-to-eat mono-varietal salads. J. Food Process. Preserv. 2019, 43, e13955. [Google Scholar] [CrossRef]
  13. Andrews, J.H.; Harris, R.F. The Ecology and Biogeography of Microorganisms on Plant Surfaces. Annu. Rev. Phytopathol. 2000, 38, 145–180. [Google Scholar] [CrossRef] [PubMed]
  14. Janisiewicz, W.J.; Korsten, L. Biological Control of Postharvest Diseases of Fruits. Annu. Rev. Phytopathol. 2002, 40, 411–441. [Google Scholar] [CrossRef] [Green Version]
  15. Barth, M.; Hankinson, T.R.; Hong, Z.; Breidt, F. Microbiological Spoilage of Fruits and Vegetables. In Compendium of the Microbiological Spoilage of Foods and Beverages; Springer: Berlin, Germany, 2009; pp. 135–183. [Google Scholar]
  16. Schuenzel, K.M.; Harrison, M.A. Microbial Antagonists of Foodborne Pathogens on Fresh, Minimally Processed Vegetables. J. Food Prot. 2002, 65, 1909–1915. [Google Scholar] [CrossRef]
  17. Scolari, G.; Vescovo, M. Microbial antagonism of Lactobacillus Casei added to fresh vegetables. Ital. J. Food Sci. 2004, 16, 465–475. [Google Scholar]
  18. Johnston, M.A.; Harrison, M.A.; Morrow, R.A. Microbial Antagonists of Escherichia coli O157:H7 on Fresh-Cut Lettuce and Spinach. J. Food Prot. 2009, 72, 1569–1575. [Google Scholar] [CrossRef]
  19. Cooley, M.B.; Miller, W.G.; Mandrell, R.E. Colonization of Arabidopsis thaliana with Salmonella enterica and Enterohemorrhagic Escherichia coli O157:H7 and Competition by Enterobacter asburiae. Appl. Environ. Microbiol. 2003, 69, 4915–4926. [Google Scholar] [CrossRef] [PubMed] [Green Version]
  20. Jackson, C.R.; Randolph, K.C.; Osborn, S.L.; Tyler, H.L. Culture dependent and independent analysis of bacterial communities associated with commercial salad leaf vegetables. BMC Microbiol. 2013, 13, 274. [Google Scholar] [CrossRef] [PubMed] [Green Version]
  21. Rudi, K.; Flateland, S.L.; Hanssen, J.F.; Bengtsson, G.; Nissen, H. Development and Evaluation of a 16S Ribosomal DNA Array-Based Approach for Describing Complex Microbial Communities in Ready-To-Eat Vegetable Salads Packed in a Modified Atmosphere. Appl. Environ. Microbiol. 2002, 68, 1146–1156. [Google Scholar] [CrossRef] [PubMed] [Green Version]
  22. Handschur, M.; Piñar, G.; Gallist, B.; Lubitz, W.; Haslberger, A.G. Culture free DGGE and cloning based monitoring of changes in bacterial communities of salad due to processing. Food Chem. Toxicol. 2005, 43, 1595–1605. [Google Scholar] [CrossRef] [PubMed]
  23. Truchado, P.; Gil, M.I.; Suslow, T.; Allende, A. Impact of chlorine dioxide disinfection of irrigation water on the epiphytic bacterial community of baby spinach and underlying soil. PLoS ONE 2018, 13, e0199291. [Google Scholar] [CrossRef] [PubMed]
  24. Lopez-Velasco, G. Molecular Characterization of Spinach (Spinacia Oleracea) Microbial Community Structure and Its Interaction with Escherichia Coli O157:H7 in Modified Atmosphere Conditions. Ph.D. Thesis, Virginia Polytechnic Institute and State University, Blacksburg, VA, USA, 2010. Available online: https://vtechworks.lib.vt.edu/handle/10919/37601 (accessed on 19 September 2019).
  25. Gu, L.; Bai, Z.; Jin, B.; Hu, Q.; Wang, H.; Zhuang, G.; Zhang, H. Assessing the impact of fungicide enostroburin application on bacterial community in wheat phyllosphere. J. Environ. Sci. 2010, 22, 134–141. [Google Scholar] [CrossRef]
  26. Gu, G.; Ottesen, A.; Bolten, S.; Ramachandran, P.; Reed, E.; Rideout, S.; Luo, Y.; Patel, J.; Brown, E.; Nou, X. Shifts in spinach microbial communities after chlorine washing and storage at compliant and abusive temperatures. Food Microbiol. 2018, 73, 73–84. [Google Scholar] [CrossRef]
  27. Söderqvist, K.; Osman, O.A.; Wolff, C.; Bertilsson, S.; Vågsholm, I.; Boqvist, S. Emerging microbiota during cold storage and temperature abuse of ready-to-eat salad. Infect. Ecol. Epidemiol. 2017, 7, 1328963. [Google Scholar] [CrossRef] [Green Version]
  28. Izumi, H.; Kiba, T.; Hashimoto, S. Efficacy of electrolyzed water as a disinfectant for fresh-cut spinach. ACIAR Proc. 2000, 100, 216–221. [Google Scholar]
  29. Rahman, S.; Ding, T.; Oh, D.-H. Inactivation effect of newly developed low concentration electrolyzed water and other sanitizers against microorganisms on spinach. Food Control. 2010, 21, 1383–1387. [Google Scholar] [CrossRef]
  30. Gómez-López, V.M.; Marín, A.; Medina-Martínez, M.S.; Gil, M.I.; Allende, A. Generation of trihalomethanes with chlorine-based sanitizers and impact on microbial, nutritional and sensory quality of baby spinach. Postharvest Boil. Technol. 2013, 85, 210–217. [Google Scholar] [CrossRef]
  31. Guentzel, J.L.; Lam, K.L.; Callan, M.A.; Emmons, S.A.; Dunham, V.L. Reduction of bacteria on spinach, lettuce, and surfaces in food service areas using neutral electrolyzed oxidizing water. Food Microbiol. 2008, 25, 36–41. [Google Scholar] [CrossRef]
  32. Park, E.-J.; Alexander, E.; Taylor, G.; Costa, R.; Kang, D.-H. Effects of organic matter on acidic electrolysed water for reduction of foodborne pathogens on lettuce and spinach. J. Appl. Microbiol. 2008, 105, 1802–1809. [Google Scholar] [CrossRef]
  33. Babic, I.; Watada, A.E.; Buta, J.G. Growth of Listeria monocytogenes Restricted by Native Microorganisms and Other Properties of Fresh-Cut Spinach. J. Food Prot. 1997, 60, 912–917. [Google Scholar] [CrossRef] [PubMed]
  34. Tatsika, S.; Karamanoli, K.; Karayanni, H.; Genitsaris, S. Metagenomic Characterization of Bacterial Communities on Ready-to-Eat Vegetables and Effects of Household Washing on their Diversity and Composition. Pathogens 2019, 8, 37. [Google Scholar] [CrossRef] [PubMed] [Green Version]
  35. Rivera-Garcia, A.; Santos-Ferro, L.; Ramirez-Orejel, J.C.; Agredano-Moreno, L.T.; Jimenez-Garcia, L.F.; Paez-Esquiliano, D.; Andrade-Esquivel, E.; Cano-Buendia, J.A. The effect of neutral electrolyzed water as a disinfectant of eggshells artificially contaminated with Listeria monocytogenes. Food Sci. Nutr. 2019, 7, 2252–2260. [Google Scholar] [CrossRef] [PubMed] [Green Version]
  36. Premier, R. Evaluation of Vegetable Washing Chemicals. In Australia: Horticulture Australia Ltd. 2013. Available online: https://www.ausvegvic.com.au/pdf/r%26d_VG09086_vegetable_wash_water_extract.pdf (accessed on 12 September 2019).
  37. Ogunniyi, A.D.; Tenzin, S.; Khazandi, M.; Ferro, S.; Venter, H.; Pi, H.; Amorico, T.; Deo, P.; Trott, D.J. A pH-neutral electrolyzed oxidizing water significantly reduces microbial contamination of fresh spinach leaves. Food Microbiol. 2020. under review (Accessed on 25/02/2020). [Google Scholar]
  38. Klindworth, A.; Pruesse, E.; Schweer, T.; Peplies, J.; Quast, C.; Horn, M.; Glöckner, F.O. Evaluation of general 16S ribosomal RNA gene PCR primers for classical and next-generation sequencing-based diversity studies. Nucleic Acids Res. 2012, 41, e1. [Google Scholar] [CrossRef]
  39. Amplicon, P.; Clean-Up, P.; Index, P. 16s Metagenomic Sequencing Library Preparation. 2013. Available online: https://support.illumina.com/documents/documentation/chemistry_documentation/16s/16s-metagenomic-library-prep-guide-15044223-b.pdf (accessed on 17 November 2018).
  40. Andrews, S. FastQC a Quality Control Tool for High Throughput Sequence Data. Available online: https://www.bioinformatics.babraham.ac.uk/projects/fastqc/ (accessed on 22 January 2019).
  41. Edgar, R.C.; Flyvbjerg, H. Error filtering, pair assembly and error correction for next-generation sequencing reads. Bioinformatics 2015, 31, 3476–3482. [Google Scholar] [CrossRef] [Green Version]
  42. Core Team, R. R: A Language and Environment for Statistical Computing. R Foundation for Statistical Computing, Vienna. 2019. Available online: https://www.R-project.org/ (accessed on 14 February 2019).
  43. Callahan, B.J.; McMurdie, P.; Rosen, M.J.; Han, A.W.; Johnson, A.J.; Holmes, S. DADA2: High-resolution sample inference from Illumina amplicon data. Nat. Methods 2016, 13, 581–583. [Google Scholar] [CrossRef] [Green Version]
  44. Wang, Q.; Garrity, G.M.; Tiedje, J.M.; Cole, J.R. Naïve Bayesian Classifier for Rapid Assignment of rRNA Sequences into the New Bacterial Taxonomy. Appl. Environ. Microbiol. 2007, 73, 5261–5267. [Google Scholar] [CrossRef] [Green Version]
  45. Quast, C.; Pruesse, E.; Yilmaz, P.; Gerken, J.; Schweer, T.; Yarza, P.; Peplies, J.; Glöckner, F.O. The SILVA ribosomal RNA gene database project: Improved data processing and web-based tools. Nucleic Acids Res. 2012, 41, D590–D596. [Google Scholar] [CrossRef]
  46. Callahan, B. Silva taxonomic training data formatted for DADA2 (Silva version 132). Zenodo 2018. [Google Scholar] [CrossRef]
  47. Wright, E.S. Using DECIPHER v2.0 to analyze big biological sequence data in R. R Journal 2016, 8, 352–359. Available online: https://journal.r-project.org/archive/2016-1/wright.pdf (accessed on 3 March 2019). [CrossRef] [Green Version]
  48. Schliep, K. phangorn: Phylogenetic analysis in R. Bioinformatics 2010, 27, 592–593. [Google Scholar] [CrossRef] [PubMed] [Green Version]
  49. McMurdie, P.; Holmes, S. phyloseq: An R Package for Reproducible Interactive Analysis and Graphics of Microbiome Census Data. PLoS ONE 2013, 8, e61217. [Google Scholar] [CrossRef] [PubMed] [Green Version]
  50. McMurdie, P.; Holmes, S. Shiny-phyloseq: Web application for interactive microbiome analysis with provenance tracking. Bioinformatics 2014, 31, 282–283. [Google Scholar] [CrossRef]
  51. Lozupone, C.A.; Knight, R. Species divergence and the measurement of microbial diversity. FEMS Microbiol. Rev. 2008, 32, 557–578. [Google Scholar] [CrossRef]
  52. Knight, R.; Vrbanac, A.; Taylor, B.C.; Aksenov, A.; Callewaert, C.; Debelius, J.; González, A.; Kosciolek, T.; McCall, L.-I.; McDonald, D.; et al. Best practices for analysing microbiomes. Nat. Rev. Genet. 2018, 16, 410–422. [Google Scholar] [CrossRef] [Green Version]
  53. Oksanen, J.; Blanchet, F.; Friendly, M.; Kindt, R.; Legendre, P.; McGlinn, D.; Minchin, P.; O’Hara, R.; Simpson, G.; Solymos, P. Ordination methods, diversity analysis and other functions for community and vegetation ecologists. In Vegan: Community Ecology Package. 2019. Available online: https://www.researchgate.net/publication/319525938_vegan_Community_Ecology_Package_Ordination_methods_diversity_analysis_and_other_functions_for_community_and_vegetation_ecologists_Version_22-4_URL_httpsCRANR-projectorgpackagevegan/link/59b0e308a6fdcc3f888bf5da/download (accessed on 3 March 2019).
  54. Bray, J.R.; Curtis, J.T. An Ordination of the Upland Forest Communities of Southern Wisconsin. Ecol. Monogr. 1957, 27, 325–349. [Google Scholar] [CrossRef]
  55. Lozupone, C.; Knight, R. UniFrac: A New Phylogenetic Method for Comparing Microbial Communities. Appl. Environ. Microbiol. 2005, 71, 8228–8235. [Google Scholar] [CrossRef] [Green Version]
  56. Anderson, M.J. Permutational Multivariate Analysis of Variance (PERMANOVA). In Wiley StatsRef: Statistics Reference Online; John Wiley & Sons, Ltd.: Hoboken, NJ, USA, 2014; pp. 1–15. [Google Scholar]
  57. Lahti, L.; Shetty, S.; Blake, T.; Salojarvi, J. Microbiome R package. 2012–2019. [Google Scholar] [CrossRef]
  58. Mandal, S.; Van Treuren, W.; White, R.A.; Eggesbø, M.; Knight, R.; Peddada, S.D. Analysis of composition of microbiomes: A novel method for studying microbial composition. Microb. Ecol. Health Dis. 2015, 26, 27663. [Google Scholar] [CrossRef] [Green Version]
  59. Bolyen, E.; Rideout, J.R.; Dillon, M.R.; Bokulich, N.A.; Abnet, C.C.; Al-Ghalith, G.A.; Alexander, H.; Alm, E.J.; Arumugam, M.; Asnicar, F.; et al. Reproducible, interactive, scalable and extensible microbiome data science using QIIME. Nat. Biotechnol. 2019, 37, 852–857. [Google Scholar] [CrossRef]
  60. Jarvis, K.; Daquigan, N.; White, J.R.; Morin, P.M.; Howard, L.M.; Manetas, J.E.; Ottesen, A.; Ramachandran, P.; Grim, C.J. Microbiomes Associated With Foods From Plant and Animal Sources. Front. Microbiol. 2018, 9, 2540. [Google Scholar] [CrossRef] [PubMed] [Green Version]
  61. Schwartz, E.; Van Horn, D.J.; Buelow, H.N.; Okie, J.G.; Gooseff, M.; Barrett, J.E.; Takacs-Vesbach, C. Characterization of growing bacterial populations in McMurdo Dry Valley soils through stable isotope probing with (18) O-water. FEMS Microbiol. Ecol. 2014, 89, 415–425. [Google Scholar] [CrossRef] [PubMed] [Green Version]
  62. Araujo, R.; Dunlap, C.; Barnett, S.; Franco, C. Decoding Wheat Endosphere-Rhizosphere Microbiomes in Rhizoctonia solani-Infested Soils Challenged by Streptomyces Biocontrol Agents. Front. Plant Sci. 2019, 10, 1038. [Google Scholar] [CrossRef] [PubMed] [Green Version]
Figure 1. Relative abundance of phyla (Proteobacteria, Bacteroidetes, Firmicutes, Actinobacteria) for samples collected (a) after the sanitizing wash (no wash, tap water, peroxyacetic acid (PAA) at 50 mg/L, ECAS at 50 mg/L and 85 mg/L of free available chlorine (FAC)), and (b) immediately after the treatment (day 0) and on days 5 and 10 post sanitizing wash.
Applsci 10 02986 g001
Figure 2. Microbial community cluster analysis of assembled sequence variants (ASV) non-metric multidimensional scaling (NMDS) based on Bray-Curtis dissimilarity index for (a) electrochemically activated solution (ECAS), tap water, and PAA washing, and (b) sampling days. Dispersion of the beta diversity group based on Bray–Curtis dissimilarity index for (c) ECAS, tap water, and PAA washing, and (d) sampling days.
Applsci 10 02986 g002
Figure 3. The relative abundance (RA) ratio of (a) ASVs (17 ASVs with taxa identification in Table 4) and (b) taxa rank family (4) identified as significantly different in abundance on sampling days 5 and 10 by ANCOM analysis at a false discovery rate (FDR) of 0.05. The RA ratio is calculated as RA on day 5 or day 10 divided by RA on day 0. f-family.
Applsci 10 02986 g003
Table 1. Abundance and percentage abundances of phyla present in spinach leaf samples identified from 16S rRNA gene sequences analyzed using DADA2 package in R and taxonomic assignment performed according to the SILVA rRNA database.
PhylumPhyla AbundancePercentage Abundance
Actinobacteria75612.59
Bacteroidetes187631.25
Deinococcus-Thermus70.12
Firmicutes3966.60
Fusobacteria40.07
Patescibacteria80.13
Planctomycetes70.12
Proteobacteria294949.13
Table 2. Alpha diversity metrics of species richness (Shannon and Inverse Simpson & Fisher) and evenness (Chao1 and abundance-based coverage estimator, ACE) for all samples.
Treatment TypeSampling DayChao1ACEShannonInvSimpsonFisher
Tap water0128.00128.293.8626.3822.58
5371.08371.894.4539.4961.56
10337.42338.754.3841.9051.58
ECAS 50 mg/L0771.06771.865.59125.72128.92
5487.38488.944.4738.8475.21
10542.10542.795.42118.1596.19
ECAS 85 mg/L060.0060.003.4217.6613.74
5445.04446.175.31134.5677.66
10630.76633.555.42113.40133.90
PAA 50 mg/L0577.32578.445.2891.5994.20
5368.25369.164.6950.6158.87
10468.20469.065.1988.4683.08
No treatment (control)064.0064.003.5422.5115.04
5342.00342.004.5035.7353.66
10415.60416.575.1180.8673.09
Table 3. (a) Permutational multivariate analysis of variance (PERMANOVA) results based on Bray-Curtis dissimilarities using abundance data for treatment types and sampling days. (b) Analysis of variance (ANOVA) pairwise comparison tests of dispersion of microbial composition among sampling days (significant if p value < 0.05).
(a)
(a)
DfSum SqF.ModelR2P
Treatment Type40.4551.8130.3300.053
Sampling Day20.4213.3590.3050.006
Residual80.502
Total141.378
Df—degrees of freedom; Sum Sq—sum of squares; F.Model—F value by permutation. R2—the effect size. Boldface indicates statistical significance with p < 0.05 based on 1000 permutations.
(b)
(b)
Sampling Dayp-Value (Observed)p-Value (Permutated)
Day 0–Day 50.0220.029
Day 0–Day 100.0310.027
Day 5–Day 100.8560.854
Boldface indicates statistical significance with p < 0.05 based on 1000 permutations.
Table 4. Taxa (17 ASVs) and genera (5 genera) identified as significantly different in abundance on sampling days 0, 5 and 10 by analysis of composition of microbiomes (ANCOM) analysis at a false discovery rate (FDR) of 0.05. The higher the W value, the more significant are the differences in abundance levels between the sampling days.
ASVs * Relative Abundance (RA)Reject Hypothesis
Taxon aWDay 0Day 5Day 10
f Pseudomonadaceae; g unclassified (ASV1)370.00100.00870.0032TRUE **
g Alkanindiges; s illinoisensis (ASV2)140.00300.00790.0017TRUE **
f Flavobacteriaceae; g unclassified (ASV3)130.00160.00000.0019TRUE **
f Flavobacteriaceae; g unclassified (ASV4)120.00020.00000.0009TRUE **
g Herminiimonas; s aquatilis (ASV5)100.00110.00000.0012TRUE **
f Micrococcaceae; g Arthrobacter (ASV6)100.01070.00760.0162TRUE**
f Oxalobacteraceae; g unclassified (ASV7)100.01420.00990.0187TRUE **
f Flavobacteriaceae; g Persicivirga(ASV8)100.00280.00000.0001TRUE **
o Bacillales; f unclassified (ASV9)100.00100.00170.0000TRUE **
g Achromobacter; s xylosoxidans (ASV10)70.00090.00000.0002TRUE **
g Flavobacterium; s frigidarium (ASV11)70.00100.00000.0001TRUE **
g Alkanindiges; s illinoisensis (ASV12)60.00600.03880.0066TRUE **
f Flavobacteriaceae; g unclassified (ASV13)60.00130.00000.0002TRUE **
f Pseudomonadaceae; g unclassified (ASV14)60.00220.00050.0000TRUE **
g Flavobacterium; s frigidarium (ASV15)50.00130.00020.0000TRUE **
f Micrococcaceae; g Arthrobacter (ASV16)50.14050.06670.1766TRUE **
f Flavobacteriaceae; g unclassified (ASV17)50.00100.00020.0007TRUE **
Family
TaxonW
o Sphingobacteriales; f Sphingobacteriaceae60.58100.18270.2363TRUE **
o Pseudomonadales; f Pseudomonadaceae50.20250.58940.2082TRUE **
o Xanthomonadales; f Xanthomonadaceae20.49530.16040.3443TRUE **
o Flavobacteriales; f Flavobacteriaceae20.43430.18610.3796TRUE **
* Amplicon sequence variants, a Taxa are identified from Greengenes database. ** Indicate rejected null hypothesis. o-order, f-family, g-genus, s-species.

