Cumulative Inaccuracies in Implementation of Additive Manufacturing Through Medical Imaging, 3D Thresholding, and 3D Modeling: A Case Study for an End-Use Implant

 ,
,  ,
, 
Abstract
Featured Application
Abstract

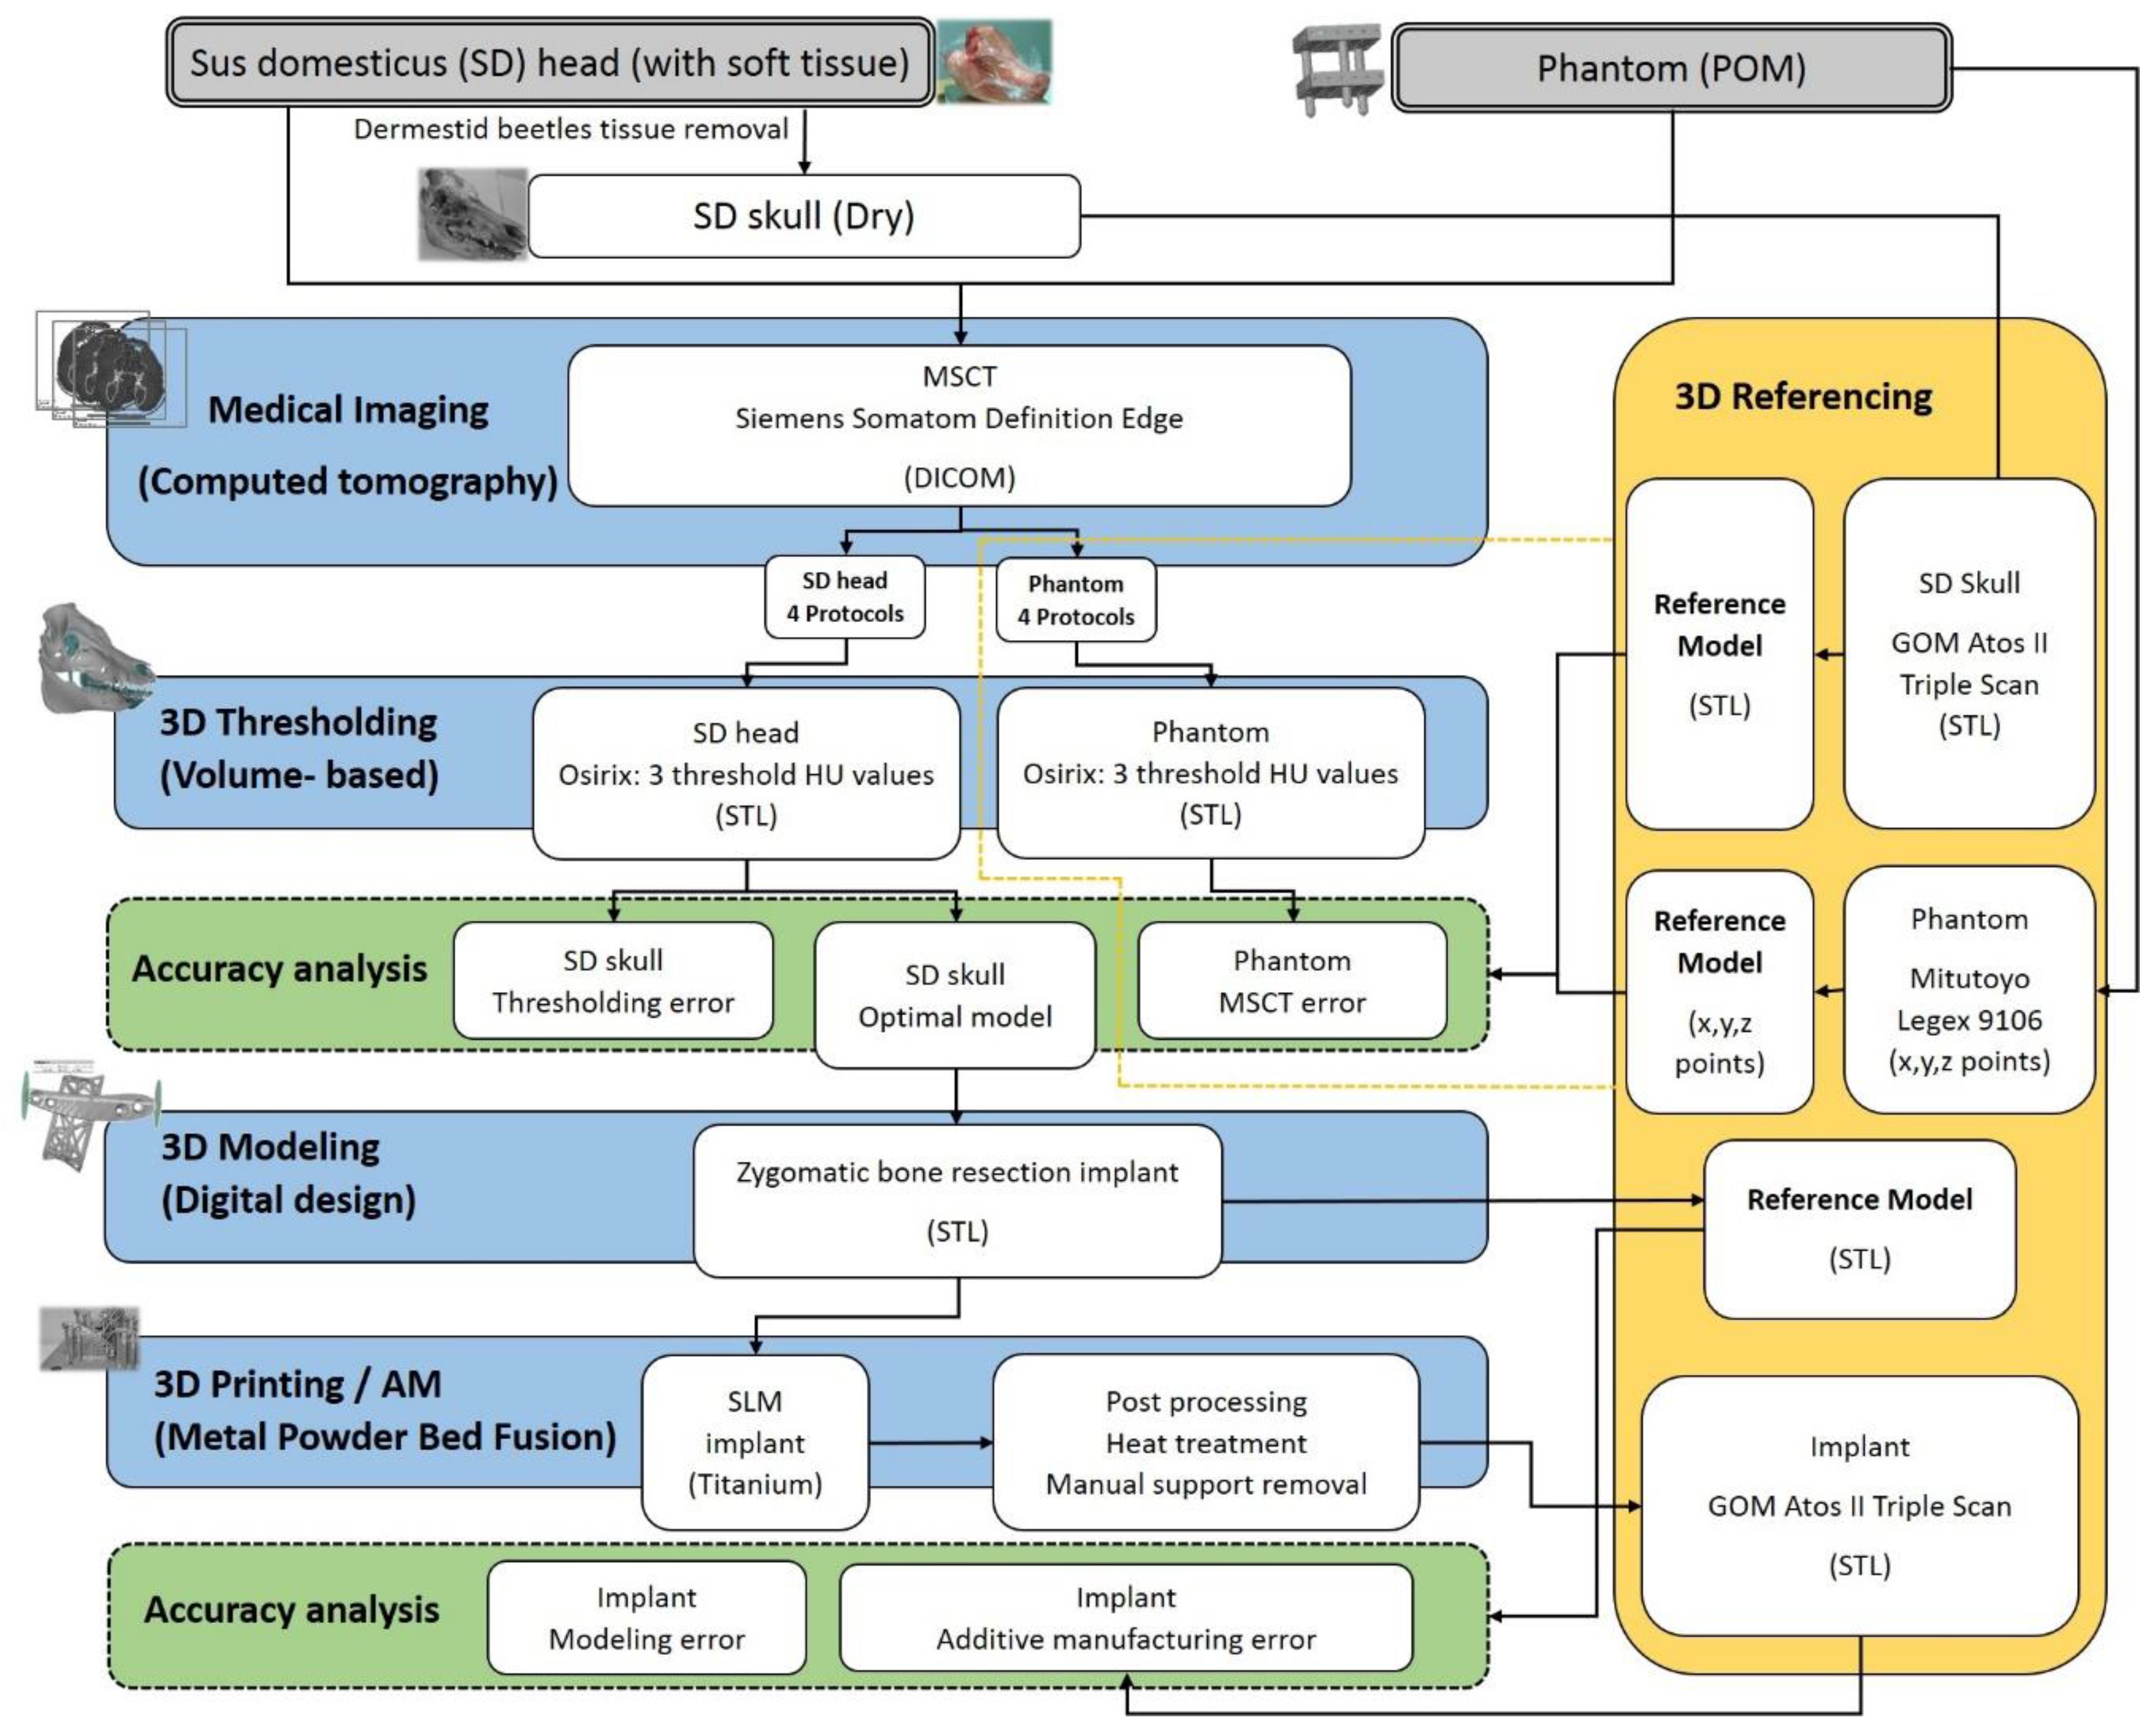
1. Introduction
2. Materials and Methods
2.1. The Sus Domesticus
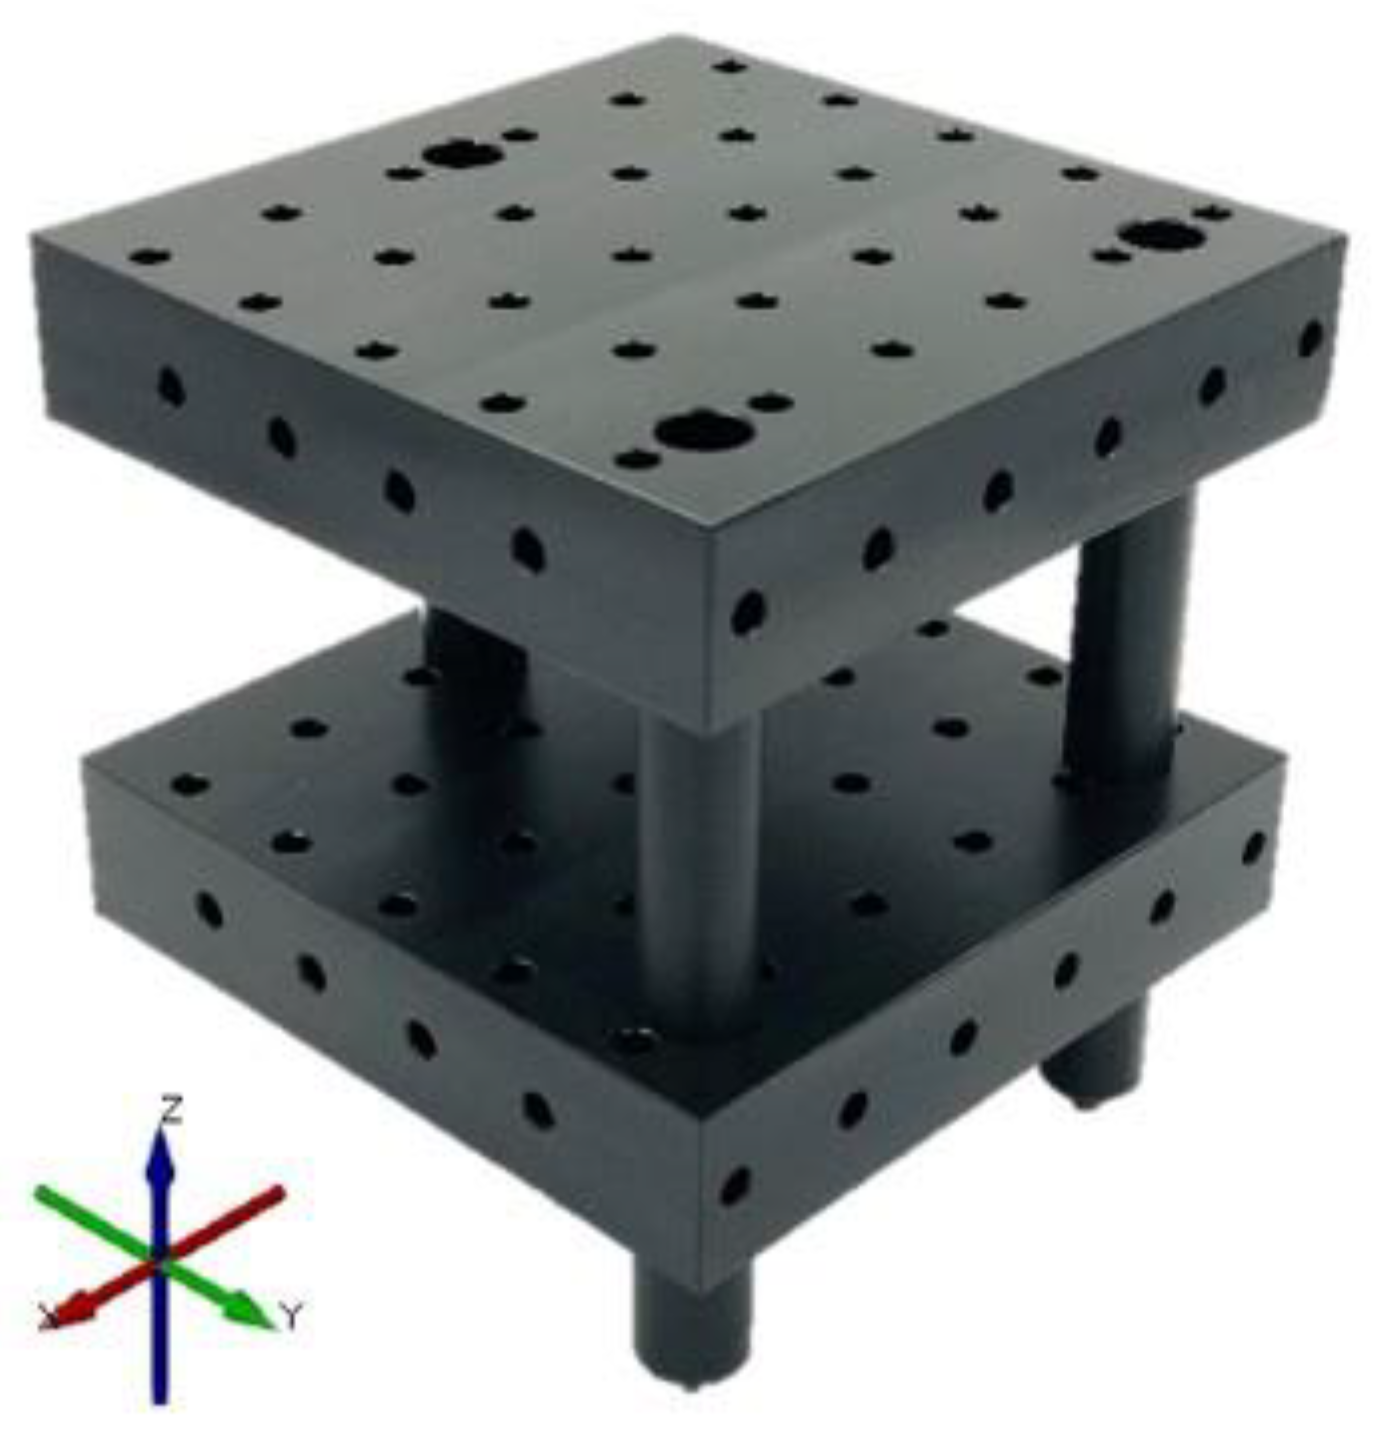
2.2. The Quality Assurance Phantom
2.3. Medical Imaging
2.4. 3D Thresholding
2.5. 3D Modeling of the Implant
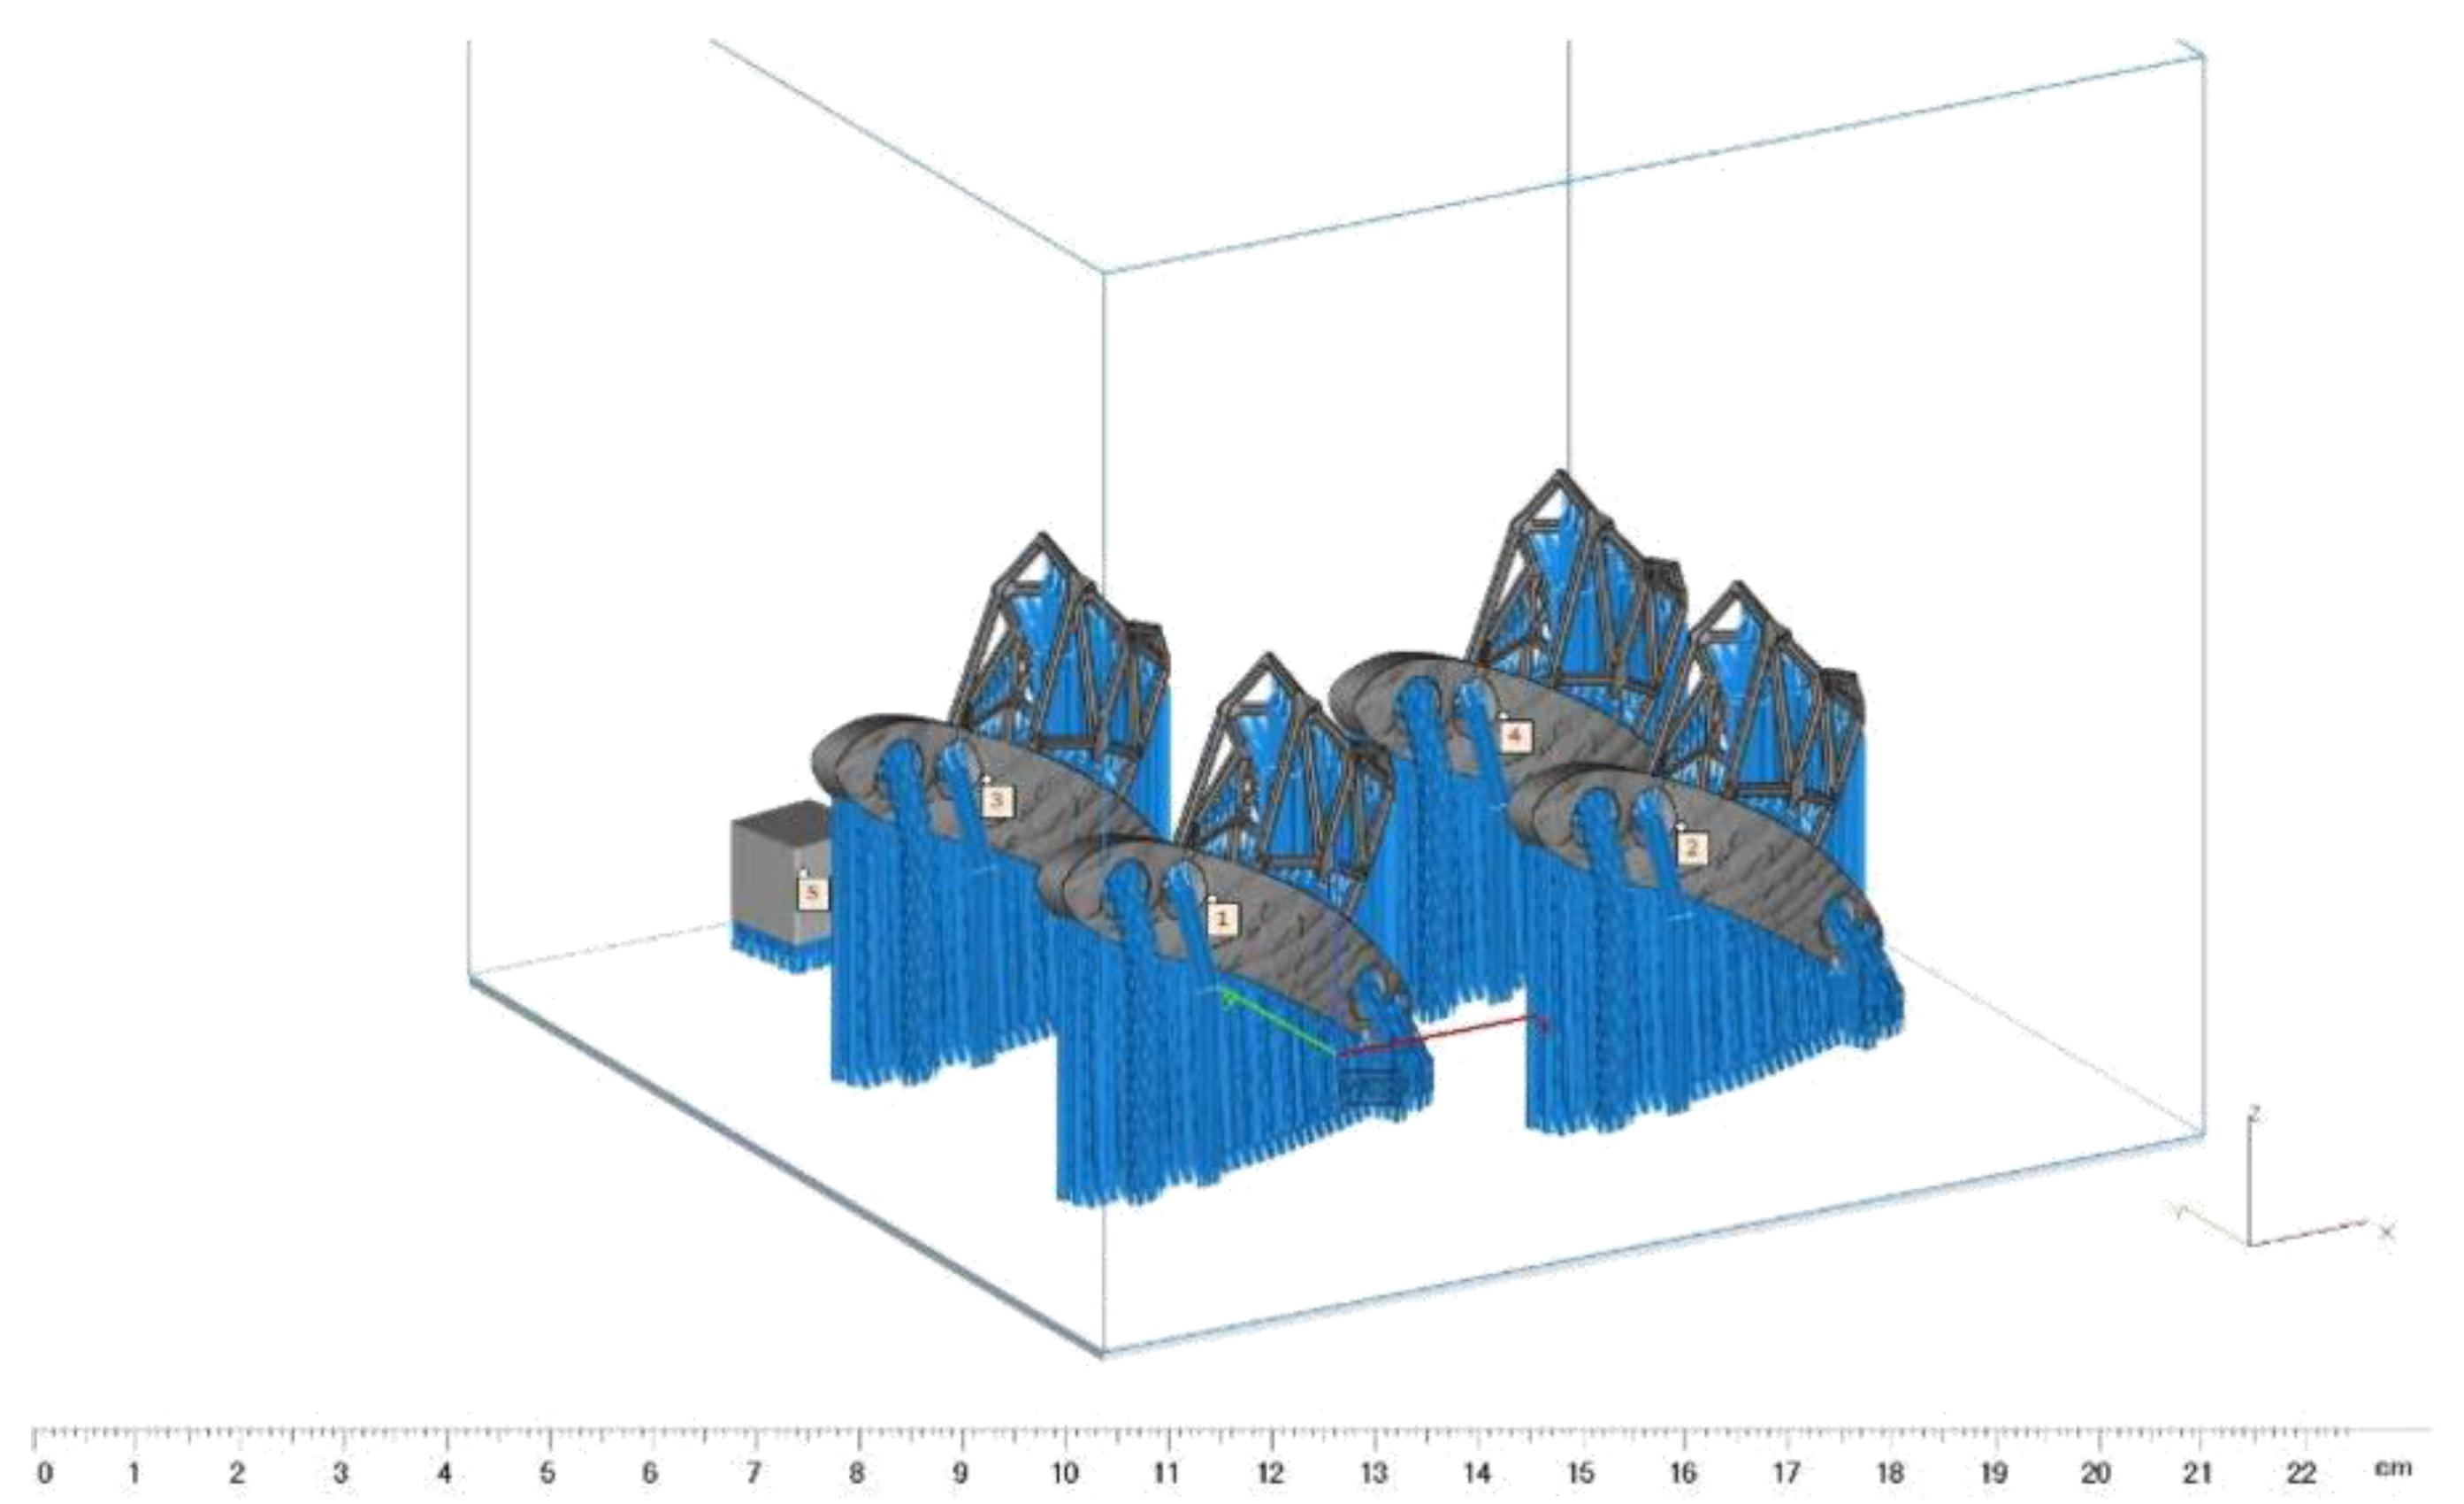
2.6. Additive Manufacturing of the Implant
2.7. The Reference Measurements and Cumulative Error
3. Results
3.1. The CT Imaging Error
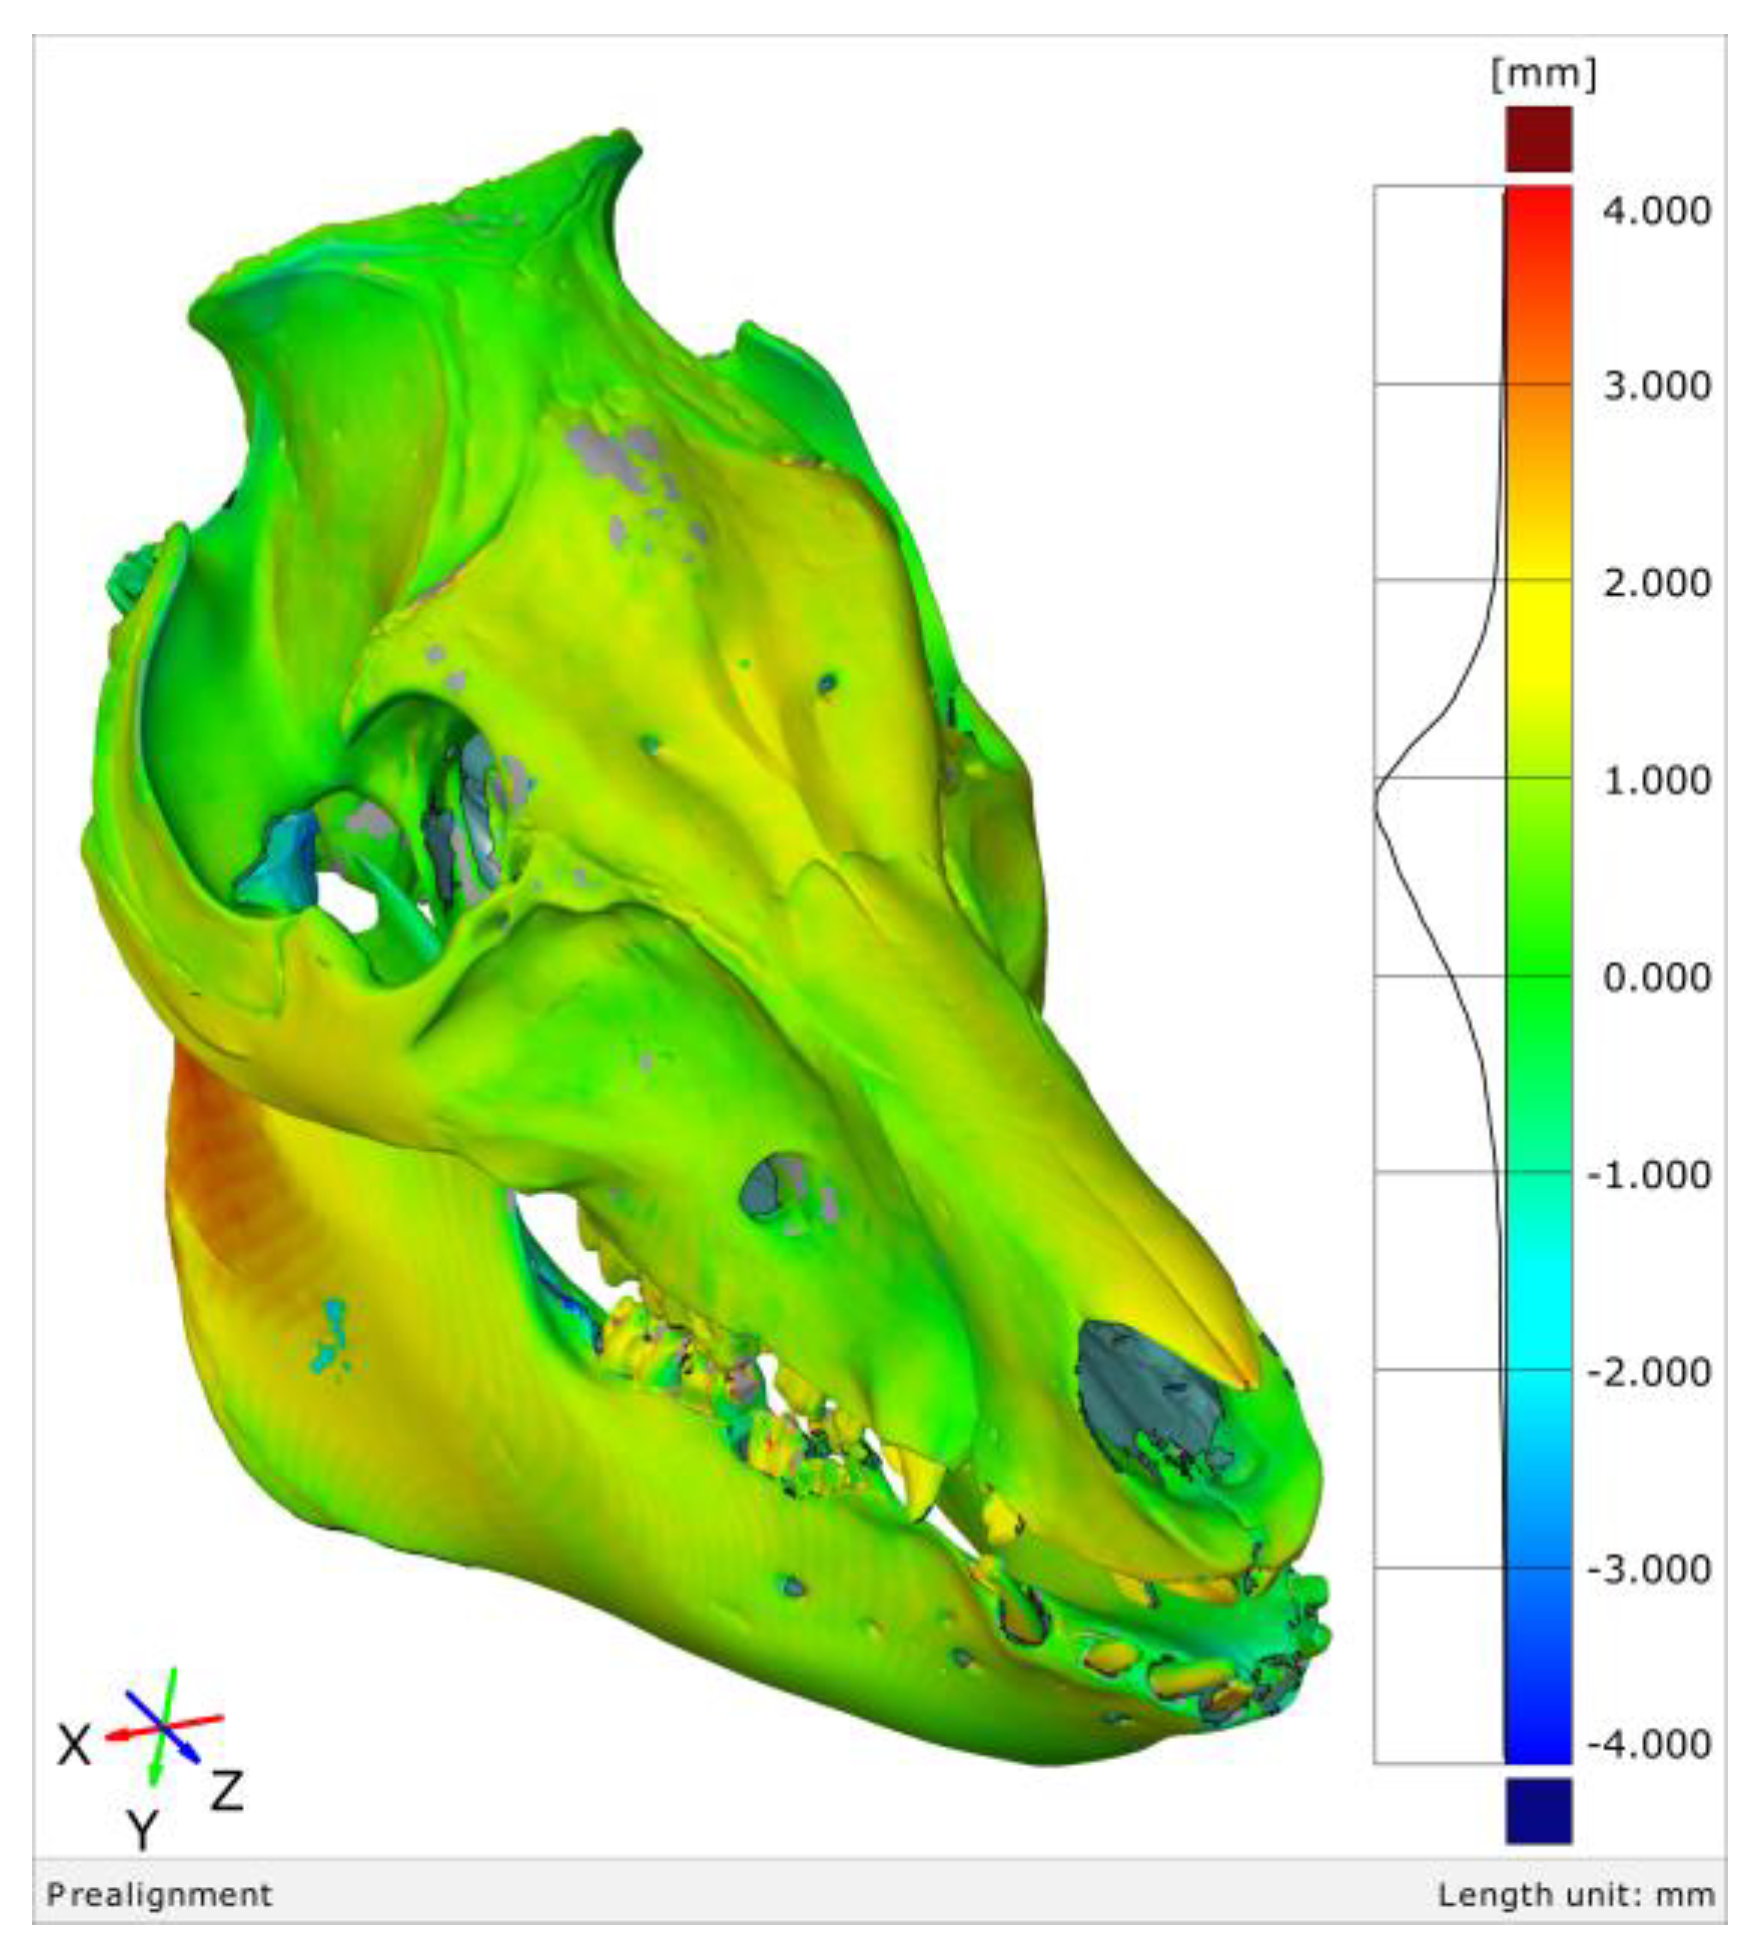
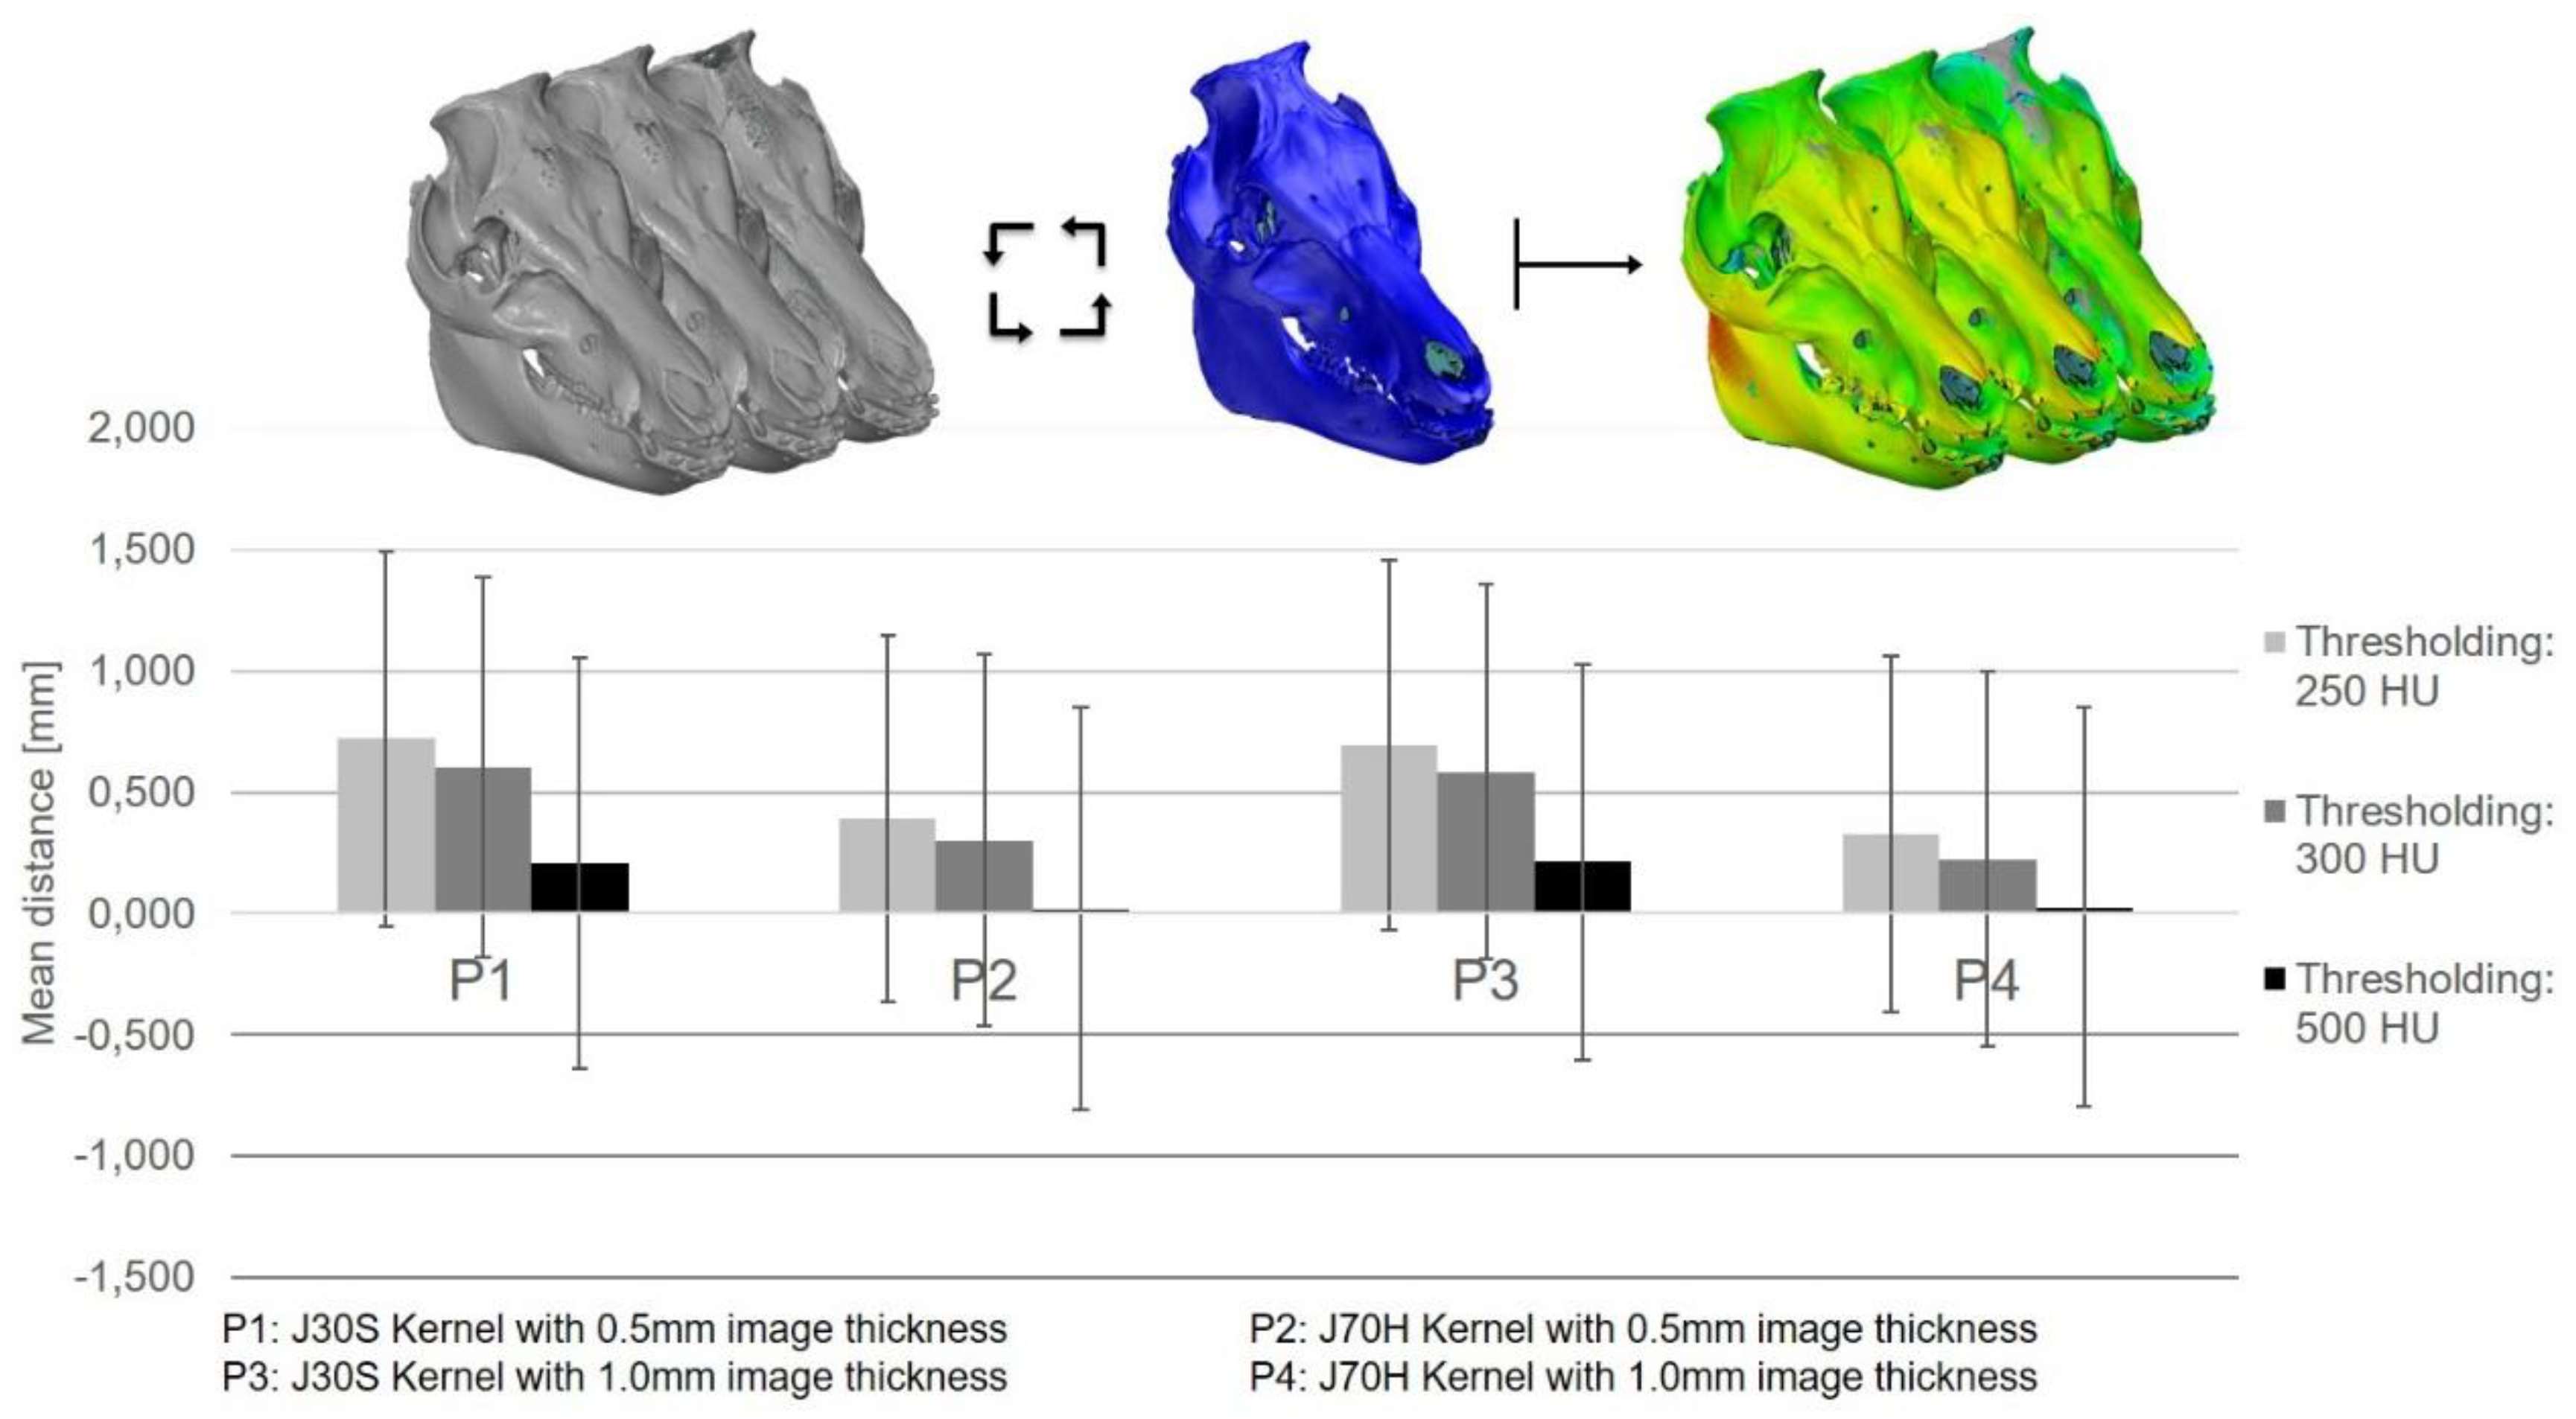
3.2. The 3D Thresholding Error
3.3. The 3D Modeling Error
3.4. The Additive Manufacturing Error
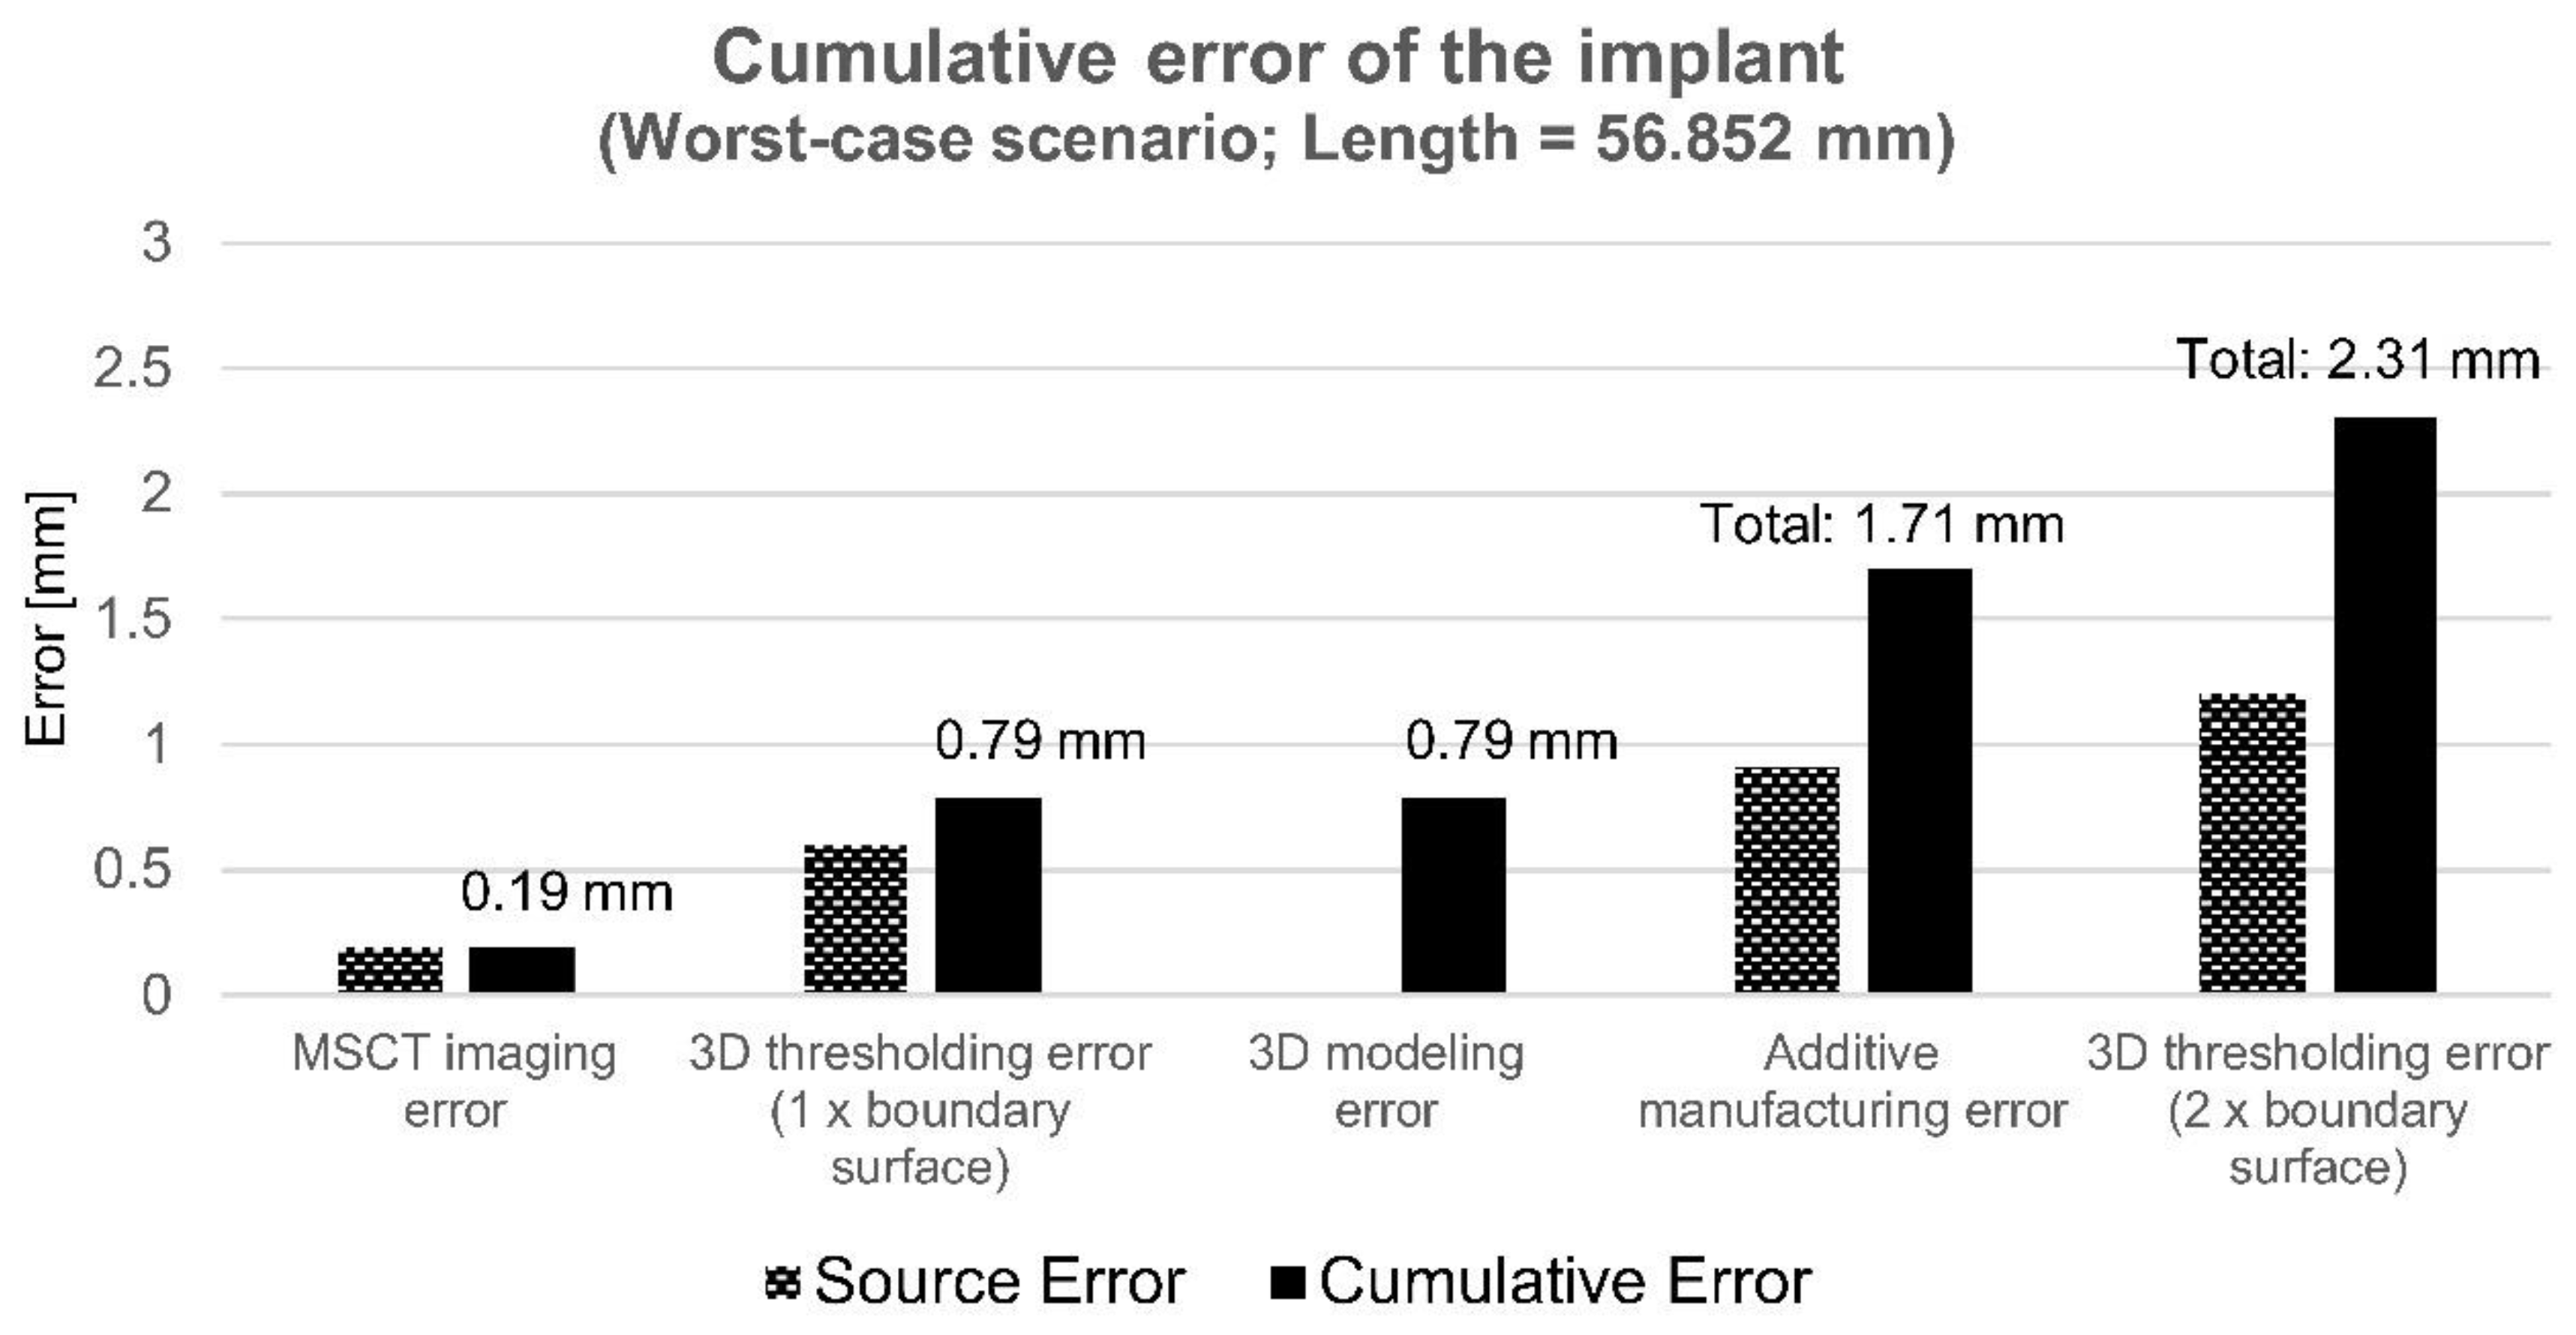
3.5. Uncertainty and Cumulative Error of the Implant
4. Discussion
4.1. CT Imaging
4.2. 3D Thresholding
4.3. 3D Modeling
4.4. Additive Manufacturing
4.5. Uncertainty and Cumulative Error
4.6. Verification
4.7. Craniomaxillofacial Implants
5. Conclusions
Author Contributions
Funding
Conflicts of Interest
References
- ISO/TC 261 ISO/ASTM 52900:2015(E). Additive Manufacturing-General Principles-Terminology, 2nd ed.; ISO/ASTM International: Vernier, Geneva, Switzerland, 2015. [Google Scholar]
- Wohlers Associates Inc. Wohlers Report; Wohlers Associates Inc.: Fort Collins, CO, USA, 2019. [Google Scholar]
- Kruth, J.P. Material Incress Manufacturing by Rapid Prototyping Techniques. CIRP Ann. 1991, 40, 603–614. [Google Scholar] [CrossRef]
- Attaran, M. The rise of 3-D printing: The advantages of additive manufacturing over traditional manufacturing. Bus. Horiz. 2017, 60, 677–688. [Google Scholar] [CrossRef]
- Kumke, M.; Watschke, H.; Hartogh, P.; Bavendiek, A.-K.; Vietor, T. Methods and tools for identifying and leveraging additive manufacturing design potentials. Int. J. Interact. Des. Manuf. 2018, 12, 481–493. [Google Scholar] [CrossRef]
- Hague, R.; Mansour, S.; Saleh, N. Material and design considerations for rapid manufacturing. Int. J. Prod. Res. 2004, 42, 4691–4708. [Google Scholar] [CrossRef]
- Mellor, S.; Hao, L.; Zhang, D. Additive manufacturing: A framework for implementation. Int. J. Prod. Econ. 2014, 149, 194–201. [Google Scholar] [CrossRef]
- Weller, C.; Kleer, R.; Piller, F.T. Economic implications of 3D printing: Market structure models in light of additive manufacturing revisited. Int. J. Prod. Econ. 2015, 164, 43–56. [Google Scholar] [CrossRef]
- Pérès, F.; Noyes, D. Envisioning e-logistics developments: Making spare parts in situ and on demand. Comput. Ind. 2006, 57, 490–503. [Google Scholar] [CrossRef]
- Poukens, J.; Laeven, P.; Beerens, M.; Nijenhuis, G.; Sloten, J.V.; Stoelinga, P.; Kessler, P. A classification of cranial implants based on the degree of difficulty in computer design and manufacture. Int. J. Med. Robot. Comput. Assist. Surg. 2008, 4, 46–50. [Google Scholar] [CrossRef]
- Warnke, P.H.; Douglas, T.; Wollny, P.; Sherry, E.; Steiner, M.; Galonska, S.; Becker, S.T.; Springer, I.N.; Wiltfang, J.; Sivananthan, S. Rapid Prototyping: Porous Titanium Alloy Scaffolds Produced by Selective Laser Melting for Bone Tissue Engineering. Tissue Eng. Part C Methods 2009, 15, 115–124. [Google Scholar] [CrossRef]
- Salmi, M.; Tuomi, J.; Paloheimo, K.-S.; Paloheimo, M.; Björkstrand, R.; Mäkitie, A.A.; Mesimäki, K.; Kontio, R. Digital design and rapid manufacturing in orbital wall reconstruction. In Innovative Developments in Design and Manufacturing—Advanced Research in Virtual and Rapid Prototyping; CRC Press: Boca Raton, FL, USA, 2010; pp. 339–342. [Google Scholar]
- Lethaus, B.; ter Laak, M.P.; Laeven, P.; Beerens, M.; Koper, D.; Poukens, J.; Kessler, P. A treatment algorithm for patients with large skull bone defects and first results. J. Cranio-Maxillofac. Surg. 2011, 39, 435–440. [Google Scholar] [CrossRef]
- Salmi, M.; Tuomi, J.; Paloheimo, K.; Björkstrand, R.; Paloheimo, M.; Salo, J.; Kontio, R.; Mesimäki, K.; Mäkitie, A.A. Patient-specific reconstruction with 3D modeling and DMLS additive manufacturing. Rapid Prototyp. J. 2012, 18, 209–214. [Google Scholar] [CrossRef]
- Figliuzzi, M.; Mangano, F.; Mangano, C. A novel root analogue dental implant using CT scan and CAD/CAM: Selective laser melting technology. Int. J. Oral Maxillofac. Surg. 2012, 41, 858–862. [Google Scholar] [CrossRef] [PubMed]
- Mangano, F.G.; Cirotti, B.; Sammons, R.L.; Mangano, C. Custom-made, root-analogue direct laser metal forming implant: A case report. Lasers Med. Sci. 2012, 27, 1241–1245. [Google Scholar] [CrossRef] [PubMed]
- Otawa, N.; Sumida, T.; Kitagaki, H.; Sasaki, K.; Fujibayashi, S.; Takemoto, M.; Nakamura, T.; Yamada, T.; Mori, Y.; Matsushita, T. Custom-made titanium devices as membranes for bone augmentation in implant treatment: Modeling accuracy of titanium products constructed with selective laser melting. J. Cranio-Maxillofac. Surg. 2015, 43, 1289–1295. [Google Scholar] [CrossRef] [PubMed]
- Pettersson, A.B.V.; Salmi, M.; Vallittu, P.; Serlo, W.; Tuomi, J.; Mäkitie, A.A. Main Clinical Use of Additive Manufacturing (Three-Dimensional Printing) in Finland Restricted to the Head and Neck Area in 2016–2017. Scand. J. Surg. 2019, 1457496919840958. [Google Scholar] [CrossRef] [PubMed]
- Hollander, D.A.; von Walter, M.; Wirtz, T.; Sellei, R.; Schmidt-Rohlfing, B.; Paar, O.; Erli, H.-J. Structural, mechanical and in vitro characterization of individually structured Ti–6Al–4V produced by direct laser forming. Biomaterials 2006, 27, 955–963. [Google Scholar] [CrossRef] [PubMed]
- Traini, T.; Mangano, C.; Sammons, R.L.; Mangano, F.; Macchi, A.; Piattelli, A. Direct laser metal sintering as a new approach to fabrication of an isoelastic functionally graded material for manufacture of porous titanium dental implants. Dent. Mater. 2008, 24, 1525–1533. [Google Scholar] [CrossRef]
- Shibli, J.A.; Mangano, C.; D’avila, S.; Piattelli, A.; Pecora, G.E.; Mangano, F.; Onuma, T.; Cardoso, L.A.; Ferrari, D.S.; Aguiar, K.C.; et al. Influence of direct laser fabrication implant topography on type IV bone: A histomorphometric study in humans. J. Biomed. Mater. Res. Part. A 2010, 93, 607–614. [Google Scholar] [CrossRef]
- Mullen, L.; Stamp, R.C.; Brooks, W.K.; Jones, E.; Sutcliffe, C.J. Selective Laser Melting: A regular unit cell approach for the manufacture of porous, titanium, bone in-growth constructs, suitable for orthopedic applications. J. Biomed. Mater. Res. Part B Appl. Biomater. 2009, 89B, 325–334. [Google Scholar] [CrossRef]
- Mangano, F.; Chambrone, L.; van Noort, R.; Miller, C.; Hatton, P.; Mangano, C. Direct Metal Laser Sintering Titanium Dental Implants: A Review of the Current Literature. Int. J. Biomater. 2014, 2014, 461534. [Google Scholar] [CrossRef]
- Tuomi, J.; Paloheimo, K.-S.; Björkstrand, R.; Salmi, M.; Paloheimo, M.; Mäkitie, A.A. Medical Applications of Rapid Prototyping—from Applications to Classification. In Proceedings of the VR 2009 Innovative Developments in Design and Manufacturing: Advanced Research in Virtual and Rapid Prototyping, Leira, Portugal, 6–10 October 2009; Volume 4, pp. 701–704. [Google Scholar]
- Tuomi, J.; Paloheimo, K.-S.; Vehviläinen, J.; Björkstrand, R.; Salmi, M.; Huotilainen, E.; Kontio, R.; Rouse, S.; Gibson, I.; Mäkitie, A.A. A Novel Classification and Online Platform for Planning and Documentation of Medical Applications of Additive Manufacturing. Surg. Innov. 2014, 21, 553–559. [Google Scholar] [CrossRef] [PubMed]
- Akmal, J.S.; Salmi, M.; Mäkitie, A.; Björkstrand, R.; Partanen, J. Implementation of Industrial Additive Manufacturing: Intelligent Implants and Drug Delivery Systems. J. Funct. Biomater. 2018, 9, 41. [Google Scholar] [CrossRef]
- Eufinger, H.; Wehmöller, M.; Machtens, E. Individual prostheses and resection templates for mandibular resection and reconstruction. Br. J. Oral Maxillofac. Surg. 1997, 35, 413–418. [Google Scholar] [CrossRef]
- Hallermann, W.; Olsen, S.; Bardyn, T.; Taghizadeh, F.; Banic, A.; Iizuka, T. A new method for computer-aided operation planning for extensive mandibular reconstruction. Plast. Reconstr. Surg. 2006, 117, 2431–2437. [Google Scholar] [CrossRef] [PubMed]
- Hannen, E.J.M. Recreating the original contour in tumor deformed mandibles for plate adapting. Int. J. Oral Maxillofac. Surg. 2006, 35, 183–185. [Google Scholar] [CrossRef] [PubMed]
- Lee, K.-W.; Wang, S.; Fox, B.C.; Ritman, E.L.; Yaszemski, M.J.; Lu, L. Poly(propylene fumarate) Bone Tissue Engineering Scaffold Fabrication Using Stereolithography: Effects of Resin Formulations and Laser Parameters. Biomacromolecules 2007, 8, 1077–1084. [Google Scholar] [CrossRef] [PubMed]
- Liu, X.; Gui, L.; Mao, C.; Peng, X.; Yu, G. Applying Computer Techniques in Maxillofacial Reconstruction Using a Fibula Flap: A Messenger and an Evaluation Method. J. Craniofac. Surg. 2009, 20, 372–377. [Google Scholar] [CrossRef]
- Esses, S.J.; Berman, P.; Bloom, A.I.; Sosna, J. Clinical Applications of Physical 3D Models Derived From MDCT Data and Created by Rapid Prototyping. Am. J. Roentgenol. 2011, 196, W683–W688. [Google Scholar] [CrossRef]
- Abou-ElFetouh, A.; Barakat, A.; Abdel-Ghany, K. Computer-guided rapid-prototyped templates for segmental mandibular osteotomies: A preliminary report. Int. J. Med. Robot. Comput. Assist. Surg. 2011, 7, 187–192. [Google Scholar] [CrossRef]
- Zhou, L.; Shang, H.; He, L.; Bo, B.; Liu, G.; Liu, Y.; Zhao, J. Accurate Reconstruction of Discontinuous Mandible Using a Reverse Engineering/Computer-Aided Design/Rapid Prototyping Technique: A Preliminary Clinical Study. J. Oral Maxillofac. Surg. 2010, 68, 2115–2121. [Google Scholar] [CrossRef]
- Scarfe, W.C.; Farman, A.G.; Sukovic, P. Clinical Applications of Cone-Beam Computed Tomography in Dental Practice. J. Can. Dent. Assoc. 2006, 72, 6. [Google Scholar]
- Johnson, T.R.C. Dual-Energy CT: General Principles. Am. J. Roentgenol. 2012, 199, S3–S8. [Google Scholar] [CrossRef] [PubMed]
- Liang, X.; Jacobs, R.; Hassan, B.; Li, L.; Pauwels, R.; Corpas, L.; Souza, P.C.; Martens, W.; Shahbazian, M.; Alonso, A.; et al. A comparative evaluation of Cone Beam Computed Tomography (CBCT) and Multi-Slice CT (MSCT): Part I. On subjective image quality. Eur. J. Radiol. 2010, 75, 265–269. [Google Scholar] [CrossRef]
- Lofthag-Hansen, S.; Thilander-Klang, A.; Gröndahl, K. Evaluation of subjective image quality in relation to diagnostic task for cone beam computed tomography with different fields of view. Eur. J. Radiol. 2011, 80, 483–488. [Google Scholar] [CrossRef] [PubMed]
- Van Eijnatten, M.; Koivisto, J.; Karhu, K.; Forouzanfar, T.; Wolff, J. The impact of manual threshold selection in medical additive manufacturing. Int. J. Comput. Assist. Radiol. Surg. 2017, 12, 607–615. [Google Scholar] [CrossRef] [PubMed]
- Bujtár, P.; Simonovics, J.; Zombori, G.; Fejer, Z.; Szucs, A.; Bojtos, A.; Batista, W.O.; Váradi, K.; Sándor, G.K.B. Internal or in-scan validation: A method to assess CBCT and MSCT gray scales using a human cadaver. Oral Surg. Oral Med. Oral Pathol. Oral Radiol. 2014, 117, 768–779. [Google Scholar] [CrossRef] [PubMed]
- Bamba, J.; Araki, K.; Endo, A.; Okano, T. Image quality assessment of three cone beam CT machines using the SEDENTEXCT CT phantom. Dentomaxillofac. Radiol. 2013, 42, 20120445. [Google Scholar] [CrossRef]
- De Las Heras Gala, H.; Torresin, A.; Dasu, A.; Rampado, O.; Delis, H.; Girón, I.H.; Theodorakou, C.; Andersson, J.; Holroyd, J.; Nilsson, M.; et al. Quality Control in Cone-Beam Computed Tomography (CBCT), EFOMP-ESTRO-IAEA Protocol. Phys. Med. 2017, 39, 67–72. [Google Scholar] [CrossRef]
- IEC 60601-2-44:2009+AMD1:2012+AMD2:2016 CSV. Medical Electrical Equipment—Part 2-44: Particular Requirements for the Basic Safety and Essential Performance of X-ray Equipment for Computed Tomography, 3rd ed.; International Electrotechnical Commission: Geneva, Switzerland, 2016. [Google Scholar]
- Batista, W.O.; Navarro, M.V.T.; Maia, A.F. Development and implementation of a low-cost phantom for quality control in cone beam computed tomography. Radiat. Prot. Dosim. 2013, 157, 552–560. [Google Scholar] [CrossRef]
- Homolka, P.; Nowotny, R. Production of phantom materials using polymer powder sintering under vacuum. Phys. Med. Biol. 2002, 47, N47–N52. [Google Scholar] [CrossRef]
- Kragskov, J.; Sindet-Pedersen, S.; Gyldensted, C.; Jensen, K.L. A comparison of three-dimensional computed tomography scans and stereolithographic models for evaluation of craniofacial anomalies. J. Oral Maxillofac. Surg. 1996, 54, 402–411. [Google Scholar] [CrossRef]
- Pauwels, R.; Nackaerts, O.; Bellaiche, N.; Stamatakis, H.; Tsiklakis, K.; Walker, A.; Bosmans, H.; Bogaerts, R.; Jacobs, R.; Horner, K.; et al. Variability of dental cone beam CT grey values for density estimations. Br. J. Radiol. 2013, 86, 20120135. [Google Scholar] [CrossRef] [PubMed]
- Huotilainen, E.; Salmi, M.; Lindahl, J. Three-dimensional printed surgical templates for fresh cadaveric osteochondral allograft surgery with dimension verification by multivariate computed tomography analysis. Knee 2019, 26, 923–932. [Google Scholar] [CrossRef] [PubMed]
- Chougule, V.N.; Mulay, A.V.; Ahuja, B.B. Three dimensional point cloud generations from CT scan images for bio-cad modeling. In Proceedings of the International Conference on Additive Manufacturing Technologies, Banglore, India, 7–8 October 2013; p. 5. [Google Scholar]
- Lorensen, W.E.; Cline, H.E. Marching Cubes: A High Resolution 3D Surface Construction Algorithm. Comput. Graph. 1987, 21, 7. [Google Scholar] [CrossRef]
- Sahoo, P.K.; Soltani, S.; Wong, A.K.C. A Survey of Thresholding Techniques. Comput. Vis. Graph. Image Process. 1998, 41, 233–260. [Google Scholar] [CrossRef]
- BIPM; IEC; IFCC; ILAC; ISO; IUPAC; IUPAP; OIML. Evaluation of Measurement Data—Guide to the Expression of Uncertainty in Measurement; Joint Committee for Guides in Metrology: Sèvres Cedex, France, 2008. [Google Scholar]
- George, E.; Liacouras, P.; Rybicki, F.J.; Mitsouras, D. Measuring and Establishing the Accuracy and Reproducibility of 3D Printed Medical Models. RadioGraphics 2017, 37, 1424–1450. [Google Scholar] [CrossRef]
- Pinto, J.M.; Arrieta, C.; Andia, M.E.; Uribe, S.; Ramos-Grez, J.; Vargas, A.; Irarrazaval, P.; Tejos, C. Sensitivity analysis of geometric errors in additive manufacturing medical models. Med. Eng. Phys. 2015, 37, 328–334. [Google Scholar] [CrossRef]
- Chen, H.; van Eijnatten, M.; Aarab, G.; Forouzanfar, T.; de Lange, J.; van der Stelt, P.; Lobbezoo, F.; Wolff, J. Accuracy of MDCT and CBCT in three-dimensional evaluation of the oropharynx morphology. Eur. J. Orthod. 2018, 40, 58–64. [Google Scholar] [CrossRef]
- Arrieta, C.; Uribe, S.; Ramos-Grez, J.; Vargas, A.; Irarrazaval, P.; Parot, V.; Tejos, C. Quantitative assessments of geometric errors for rapid prototyping in medical applications. Rapid Prototyp. J. 2012, 18, 431–442. [Google Scholar] [CrossRef]
- Huotilainen, E.; Jaanimets, R.; Valášek, J.; Marcián, P.; Salmi, M.; Tuomi, J.; Mäkitie, A.; Wolff, J. Inaccuracies in additive manufactured medical skull models caused by the DICOM to STL conversion process. J. Cranio-Maxillofac. Surg. 2014, 42, e259–e265. [Google Scholar] [CrossRef]
- Salmi, M.; Paloheimo, K.-S.; Tuomi, J.; Wolff, J.; Mäkitie, A. Accuracy of medical models made by additive manufacturing (rapid manufacturing). J. Cranio-Maxillofac. Surg. 2013, 41, 603–609. [Google Scholar] [CrossRef] [PubMed]
- Braian, M.; Jönsson, D.; Kevci, M.; Wennerberg, A. Geometrical accuracy of metallic objects produced with additive or subtractive manufacturing: A comparative in vitro study. Dent. Mater. 2018, 34, 978–993. [Google Scholar] [CrossRef] [PubMed]
- The International Bureau of Weights and Measures. The International Systems of Units (SI), 9th ed.; The International Bureau of Weights and Measures (BIPM): Sèvres Cedex, France, 2019; Available online: https://www.bipm.org/utils/common/pdf/si-brochure/SI-Brochure-9-EN.pdf (accessed on 24 April 2019).
- Sładek, J.A. Coordinate Metrology: Accuracy of Systems and Measurements; Springer Tracts in Mechanical Engineering; Springer: Berlin/Heidelberg, Germany, 2016; ISBN 978-3-662-48463-0. [Google Scholar]
- Savio, E.; De Chiffre, L.; Schmitt, R. Metrology of freeform shaped parts. CIRP Ann. 2007, 56, 810–835. [Google Scholar] [CrossRef]
- Aguilar, J.J.; Torres, F.; Lope, M.A. Stereo vision for 3D measurement: Accuracy analysis, calibration and industrial applications. Measurement 1996, 18, 193–200. [Google Scholar] [CrossRef]
- Akar, A.; Baltaş, H.; Çevik, U.; Korkmaz, F.; Okumuşoğlu, N.T. Measurement of attenuation coefficients for bone, muscle, fat and water at 140, 364 and 662keV -ray energies. J. Quant. Spectrosc. Radiat. Transf. 2006, 102, 203–211. [Google Scholar] [CrossRef]
- Lagravère, M.; Fang, Y.; Carey, J.; Toogood, R.; Packota, G.; Major, P. Density conversion factor determined using a cone-beam computed tomography unit NewTom QR-DVT 9000. Dentomaxillofac. Radiol. 2006, 35, 407–409. [Google Scholar] [CrossRef]
- Lagravère, M.O.; Carey, J.; Ben-Zvi, M.; Packota, G.V.; Major, P.W. Effect of object location on the density measurement and Hounsfield conversion in a NewTom 3G cone beam computed tomography unit. Dentomaxillofac. Radiol. 2008, 37, 305–308. [Google Scholar] [CrossRef]
- Akmal, J.S.; Salmi, M.; Hemming, B.; Teir, L.; Suomalainen, A.; Kortesniemi, M.; Partanen, J.; Lassila, A. Cumulative inaccuracies in implementation of additive manufacturing through medical imaging, 3D thresholding, and 3D modeling: A case study for an end-use implant. Mendeley Data 2020. [Google Scholar] [CrossRef]
- Lassila, A.; Kari, M.; Koivula, H.; Koivula, U.; Kortström, J.; Leinonen, E.; Manninen, J.; Manssila, J.; Mansten, T.; Meriläinen, T.; et al. Design and performance of an advanced metrology building for MIKES. Measurement 2011, 44, 399–425. [Google Scholar] [CrossRef]
- Das, M.; Ley-Zaporozhan, J.; Gietema, H.A.; Czech, A.; Mühlenbruch, G.; Mahnken, A.H.; Katoh, M.; Bakai, A.; Salganicoff, M.; Diederich, S.; et al. Accuracy of automated volumetry of pulmonary nodules across different multislice CT scanners. Eur. Radiol. 2007, 17, 1979–1984. [Google Scholar] [CrossRef]
- Liang, X.; Lambrichts, I.; Sun, Y.; Denis, K.; Hassan, B.; Li, L.; Pauwels, R.; Jacobs, R. A comparative evaluation of Cone Beam Computed Tomography (CBCT) and Multi-Slice CT (MSCT). Part II: On 3D model accuracy. Eur. J. Radiol. 2010, 75, 270–274. [Google Scholar] [CrossRef] [PubMed]
- Kang, S.-H.; Kim, M.-K.; Kim, H.-J.; Zhengguo, P.; Lee, S.-H. Accuracy Assessment of Image-Based Surface Meshing for Volumetric Computed Tomography Images in the Craniofacial Region. J. Craniofac. Surg. 2014, 25, 2051–2055. [Google Scholar] [CrossRef] [PubMed]
- Van Eijnatten, M.; van Dijk, R.; Dobbe, J.; Streekstra, G.; Koivisto, J.; Wolff, J. CT image segmentation methods for bone used in medical additive manufacturing. Med. Eng. Phys. 2018, 51, 6–16. [Google Scholar] [CrossRef] [PubMed]
- Gelaude, F.; Vander Sloten, J.; Lauwers, B. Accuracy assessment of CT-based outer surface femur meshes. Comput. Aided Surg. 2008, 13, 188–199. [Google Scholar] [CrossRef] [PubMed]
- Fadel, G.M.; Kirschman, C. Accuracy issues in CAD to RP translations. Rapid Prototyp. J. 1996, 2, 4–17. [Google Scholar] [CrossRef]
- Ullah, R.; Akmal, J.S.; Laakso, S.V.A.; Niemi, E. Anisotropy of additively manufactured AlSi10Mg: Threads and surface integrity. Int. J. Adv. Manuf. Technol. 2020. [Google Scholar] [CrossRef]
- Vilaro, T.; Colin, C.; Bartout, J.D. As-Fabricated and Heat-Treated Microstructures of the Ti-6Al-4V Alloy Processed by Selective Laser Melting. Metall. Mater. Trans. A 2011, 42, 3190–3199. [Google Scholar] [CrossRef]
- Chen, L.Y.; Huang, J.C.; Lin, C.H.; Pan, C.T.; Chen, S.Y.; Yang, T.L.; Lin, D.Y.; Lin, H.K.; Jang, J.S.C. Anisotropic response of Ti-6Al-4V alloy fabricated by 3D printing selective laser melting. Mater. Sci. Eng. A 2017, 682, 389–395. [Google Scholar] [CrossRef]
- Wu, M.-W.; Lai, P.-H.; Chen, J.-K. Anisotropy in the impact toughness of selective laser melted Ti–6Al–4V alloy. Mater. Sci. Eng. A 2016, 650, 295–299. [Google Scholar] [CrossRef]
- Popovich, A.A.; Sufiiarov, V.S.; Borisov, E.V.; Polozov, I.A.; Masaylo, D.V.; Grigoriev, A.V. Anisotropy of mechanical properties of products manufactured using selective laser melting of powdered materials. Russ. J. Non-Ferr. Met. 2017, 58, 389–395. [Google Scholar] [CrossRef]
- Calle, M.A.G.; Salmi, M.; Mazzariol, L.M.; Kujala, P. Miniature reproduction of raking tests on marine structure: Similarity technique and experiment. Eng. Struct. 2020, 212, 110527. [Google Scholar] [CrossRef]
- Barker, T.M.; Earwaker, W.J.S.; Lisle, D.A. Accuracy of stereolithographic models of human anatomy. Australas. Radiol. 1994, 38, 106–111. [Google Scholar] [CrossRef] [PubMed]
- Chang, P.S.-H.; Parker, T.H.; Patrick, C.W.; Miller, M.J. The Accuracy of Stereolithography in Planning Craniofacial Bone Replacement. J. Craniofac. Surg. 2003, 14, 164–170. [Google Scholar] [CrossRef] [PubMed]
- Choi, J.-Y.; Choi, J.-H.; Kim, N.-K.; Kim, Y.; Lee, J.-K.; Kim, M.-K.; Lee, J.-H.; Kim, M.-J. Analysis of errors in medical rapid prototyping models. Int. J. Oral Maxillofac. Surg. 2002, 31, 23–32. [Google Scholar] [CrossRef] [PubMed]
- El-Katatny, I.; Masood, S.H.; Morsi, Y.S. Error analysis of FDM fabricated medical replicas. Rapid Prototyp. J. 2010, 16, 36–43. [Google Scholar] [CrossRef]
- Ibrahim, D.; Broilo, T.L.; Heitz, C.; de Oliveira, M.G.; de Oliveira, H.W.; Nobre, S.M.W.; dos Santos Filho, J.H.G.; Silva, D.N. Dimensional error of selective laser sintering, three-dimensional printing and PolyJet™ models in the reproduction of mandibular anatomy. J. Cranio-Maxillofac. Surg. 2009, 37, 167–173. [Google Scholar] [CrossRef]
- Nizam, A.; Gopal, R.N.; Naing, L.; Hakim, A.B.; Samsudin, A.R. Dimensional Accuracy of the Skull Models Produced by Rapid Prototyping Technology Using Stereolithography Apparatus. Arch. Orofac. Sci. 2006, 1, 60–66. [Google Scholar]
- Ono, I.; Gunji, H.; Suda, K.; Kaneko, F. Method for preparing an exact-size model using helical volume scan computed tomography. Plast. Reconstr. Surg. 1994, 93, 1363–1371. [Google Scholar] [CrossRef]
- Osman, R.B.; van der Veen, A.J.; Huiberts, D.; Wismeijer, D.; Alharbi, N. 3D-printing zirconia implants; a dream or a reality? An In-Vitro study evaluating the dimensional accuracy, surface topography and mechanical properties of printed zirconia implant and discs. J. Mech. Behav. Biomed. Mater. 2017, 75, 521–528. [Google Scholar] [CrossRef]
- Silva, D.N.; Gerhardt de Oliveira, M.; Meurer, E.; Meurer, M.I.; Lopes da Silva, J.V.; Santa-Bárbara, A. Dimensional error in selective laser sintering and 3D-printing of models for craniomaxillary anatomy reconstruction. J. Cranio-Maxillofac. Surg. 2008, 36, 443–449. [Google Scholar] [CrossRef]
- Taft, R.M.; Kondor, S.; Grant, G.T. Accuracy of rapid prototype models for head and neck reconstruction. J. Prosthet. Dent. 2011, 106, 399–408. [Google Scholar] [CrossRef]
- Van Eijnatten, M.; Rijkhorst, E.-J.; Hofman, M.; Forouzanfar, T.; Wolff, J. The accuracy of ultrashort echo time MRI sequences for medical additive manufacturing. Dentomaxillofac. Radiol. 2016, 45, 20150424. [Google Scholar] [CrossRef] [PubMed]
- Waitzman, A.A.; Posnick, J.C.; Armstrong, D.C.; Pron, G.E. Craniofacial skeletal measure-ments based on computed tomography: Part I. Accuracy and reproducibility. Cleft Palate Craniofac. J. 1992, 29, 112–117. [Google Scholar] [CrossRef]
- Stoor, P.; Suomalainen, A.; Lindqvist, C.; Mesimäki, K.; Danielsson, D.; Westermark, A.; Kontio, R.K. Rapid prototyped patient specific implants for reconstruction of orbital wall defects. J. Cranio-Maxillofac. Surg. 2014, 42, 1644–1649. [Google Scholar] [CrossRef]
- Tahmaseb, A.; Wu, V.; Wismeijer, D.; Coucke, W.; Evans, C. The accuracy of static computer-aided implant surgery: A systematic review and meta-analysis. Clin. Oral Implant. Res. 2018, 29, 416–435. [Google Scholar] [CrossRef]
- Mitsouras, D.; Liacouras, P.; Imanzadeh, A.; Giannopoulos, A.A.; Cai, T.; Kumamaru, K.K.; George, E.; Wake, N.; Caterson, E.J.; Pomahac, B.; et al. Medical 3D Printing for the Radiologist. RadioGraphics 2015, 35, 1965–1988. [Google Scholar] [CrossRef]
- Elgalal, M.; Kozakiewicz, M.; Olszycki, M.; Walkowiak, B.; Stefanczyk, L. Custom implant design and surgical pre-planning using rapid prototyping and anatomical models for the repair of orbital floor fractures. Eur. Radiol. 2009, 19, S397. [Google Scholar]
- Ciocca, L.; Marchetti, C.; Mazzoni, S.; Baldissara, P.; Gatto, M.R.A.; Cipriani, R.; Scotti, R.; Tarsitano, A. Accuracy of fibular sectioning and insertion into a rapid-prototyped bone plate, for mandibular reconstruction using CAD-CAM technology. J. Cranio-Maxillofac. Surg. 2015, 43, 28–33. [Google Scholar] [CrossRef] [PubMed]
- Stoor, P.; Suomalainen, A.; Mesimäki, K.; Kontio, R. Rapid prototyped patient specific guiding implants in critical mandibular reconstruction. J. Cranio-Maxillofac. Surg. 2017, 45, 63–70. [Google Scholar] [CrossRef] [PubMed]


| MSCT-Siemens Somatom Definition Edge System Parameters | |||||||||
|---|---|---|---|---|---|---|---|---|---|
| Input | Protocol [No.] | Reconstruction Kernel | Image Thickness [mm] | Cuts [No.] | Voxel [mm] | Pixels | Field of View [cm × cm] | Voltage [kV] | Current [mA] |
| SD head | 1 | J30S | 0.5 | 870 | 0.625 | 512 × 512 × 870 | 32 × 43.5 | 120 | 180.00 |
| 2 | J70H | ||||||||
| 3 | J30S | 1.0 | 435 | 512 × 512 × × 435 | 57.00 | ||||
| 4 | J70H | 41.00 | |||||||
| Phantom | 1 | J30S | 0.5 | 364 | 0.488 | 512 × 512 × 364 | 25 × 18.2 | 180.00 | |
| 2 | J70H | 0.488 | |||||||
| 3 | J30S | 1.0 | 182 | 0.488 | 512 × 512 × 182 | 43.00 | |||
| 4 | J70S | 0.488 | 54.00 | ||||||
| Description | Thresholding Values [HU] | Resolution | Decimate Resolution | Smooth Iteration | ||
|---|---|---|---|---|---|---|
| 1 | 2 | 3 | ||||
| SD head | 250 | 300 | 500 | Normal | 0.50 | 20 |
| Phantom | 0 | −300 | −500 | Normal | 0.50 | 20 |
| ISO/ASTM AM Method | Machine | Software | Material | Layer Thickness | Other Parameters | Post Processing | |
|---|---|---|---|---|---|---|---|
| Powder bed fusion | SLM Solutions 125HL | Materialise Magics 22.0 | Ti-6Al-4V (Grade 5) | 0.03 mm | Standard process parameters Platform heating: 200 °C Particle size: Dv(10) = 32.5 µm, Dv(50) = 44.3 µm, Dv(90) =59.9 µm Number of layers: 1460 | Heat Treatment and manual support removal |
| Linear and Orthogonal Inaccuracies of the MSCT System (Siemens Somatom Definition Edge) with Reference to the Tactile CMM | |||||||||||||
|---|---|---|---|---|---|---|---|---|---|---|---|---|---|
| CT Protocol [No.] | Thresholding Value [HU] | Linearity | Orthogonality | ||||||||||
| X | Y | Z | X-Y | X-Z | Y-Z | ||||||||
| Magnification Error | Standard Deviation [mm] | Magnification Error | Standard Deviation [mm] | Magnification Error | Standard Deviation [mm] | Mean Deviation [deg.] | Standard Deviation [deg.] | Mean Deviation [deg.] | Standard Deviation [deg.] | Mean Deviation [deg.] | Standard Deviation [deg.] | ||
| 1 | 0 | −0.000017 | 0.024945 | 0.000075 | 0.054782 | 0.000359 | 0.077900 | −0.036500 | 0.073871 | −0.114250 | 0.211747 | 0.110250 | 0.223148 |
| −300 | −0.000025 | 0.020638 | −0.000005 | 0.015842 | 0.000163 | 0.017081 | −0.057750 | 0.066198 | −0.081750 | 0.165480 | 0.047750 | 0.155483 | |
| −500 | −0.000008 | 0.016195 | −0.000053 | 0.020381 | 0.000209 | 0.024013 | −0.054000 | 0.072139 | −0.076750 | 0.152666 | 0.047750 | 0.122698 | |
| 2 | 0 | −0.000032 | 0.149389 | −0.000282 | 0.115312 | 0.000158 | 0.028564 | −0.119000 | 0.190236 | −0.121750 | 0.282271 | 0.017750 | 0.586016 |
| −300 | −0.000100 | 0.144068 | −0.000045 | 0.090145 | 0.000070 | 0.059579 | −0.114000 | 0.144295 | −0.081750 | 0.175262 | 0.082750 | 0.453010 | |
| −500 | −0.000089 | 0.130743 | −0.000026 | 0.077123 | −0.000155 | 0.066167 | −0.105250 | 0.143773 | −0.071750 | 0.138047 | 0.080250 | 0.335720 | |
| 3 | 0 | −0.000022 | 0.026015 | 0.000081 | 0.057677 | 0.000275 | 0.044926 | −0.030250 | 0.071310 | −0.139250 | 0.231013 | 0.042750 | 0.219556 |
| −300 | −0.000030 | 0.022180 | −0.000012 | 0.016529 | 0.000170 | 0.014841 | −0.054000 | 0.062482 | −0.101750 | 0.161752 | 0.037750 | 0.141827 | |
| −500 | −0.000012 | 0.018685 | 0.000034 | 0.015205 | 0.000161 | 0.017748 | −0.050250 | 0.070565 | −0.104250 | 0.151295 | 0.052750 | 0.105253 | |
| 4 | 0 | −0.000145 | 0.115172 | −0.000110 | 0.086849 | 0.000303 | 0.150967 | −0.126500 | 0.146657 | −0.109250 | 0.267943 | 0.040250 | 0.520764 |
| −300 | −0.000214 | 0.129425 | 0.000051 | 0.094715 | 0.000220 | 0.031582 | −0.105250 | 0.121500 | −0.084250 | 0.110711 | 0.085250 | 0.331187 | |
| −500 | −0.000205 | 0.133742 | −0.000138 | 0.095017 | 0.000156 | 0.021733 | −0.096500 | 0.133458 | −0.091750 | 0.086931 | 0.067750 | 0.271922 | |
| Min. | −500 | −0.000100 | 0.016195 | −0.000282 | 0.015842 | −0.000155 | 0.017081 | −0.119000 | 0.066198 | −0.121750 | 0.138047 | 0.017750 | 0.122698 |
| Max. | 0 | −0.000008 | 0.149389 | 0.000075 | 0.115312 | 0.000359 | 0.077900 | −0.036500 | 0.190236 | −0.071750 | 0.282271 | 0.110250 | 0.586016 |
| Sensitivity Analysis of the SD Skull | |||||||
|---|---|---|---|---|---|---|---|
| Iteration | Optically Scanned Dry Skull Mesh (STL) Properties | Mean Distance Deviation [mm] | Standard Deviation [mm] | Difference [%] | |||
| Max. Edge Length [mm] | Number of Triangles [-] | Number of Points [-] | Mean | Standard Deviation | |||
| Standard | - | 988577 | 502772 | 0.602 | 0.914 | - | - |
| 1 | 1 | 1147107 | 582037 | 0.620 | 0.891 | 2.990 % | 2.516 % |
| 2 | 0.5 | 1915921 | 966444 | 0.621 | 0.863 | 3.156 % | 5.580 % |
| 3 | 0.1 | 2940303 | 1478635 | 0.602 | 0.907 | 0.000 % | 0.766 % |
| 4 | 0.05 | 8809479 | 4413223 | 0.602 | 0.905 | 0.000 % | 0.985 % |
| 5 | 0.01 | 26428255 | 13222611 | 0.601 | 0.906 | −0.166 % | 0.875 % |
| 6 | 0.005 | 79284523 | 39650745 | 0.603 | 0.904 | 0.166 % | 1.094 % |
| 3D Thresholding Inaccuracies of the Segmented SD Head with Reference to the Dry Skull | |||||||||
|---|---|---|---|---|---|---|---|---|---|
| CT Protocol [No.] | Thresholding Value [HU] | Mean Distance [mm] | Distance STD Deviation [mm] | Area of Valid Distance [mm2] | Area of Valid Distance Per Protocol [mm2] | Integrated Distance [mm3] | Integrated Distance Per Protocol [mm3] | Integrated ABS Distance [mm3] | Integrated ABS Distance Per Protocol [mm3] |
| 1 | 250 | 0.725 | 0.901 | 222723.74 | 651185.71 | 175538.97 | 372419.02 | 210469.72 | 541060.77 |
| 300 | 0.602 | 0.914 | 221392.80 | 148337.84 | 190894.02 | ||||
| 500 | 0.144 | 1.045 | 207069.17 | 48542.21 | 139697.03 | ||||
| 2 | 250 | 0.315 | 0.834 | 224349.47 | 658176.30 | 79264.94 | 134508.51 | 150408.45 | 437871.85 |
| 300 | 0.200 | 0.884 | 222958.92 | 52302.18 | 149661.33 | ||||
| 500 | −0.060 | 1.026 | 210867.91 | 2941.39 | 137802.07 | ||||
| 3 | 250 | 0.753 | 0.915 | 221545.81 | 644297.56 | 180320.20 | 377687.74 | 214133.79 | 546576.67 |
| 300 | 0.621 | 0.938 | 219990.68 | 151162.87 | 193556.80 | ||||
| 500 | 0.137 | 1.082 | 202761.07 | 46204.67 | 138886.08 | ||||
| 4 | 250 | 0.379 | 0.882 | 222152.28 | 644780.59 | 94670.03 | 169215.69 | 156413.25 | 433835.75 |
| 300 | 0.281 | 0.901 | 220258.90 | 73681.31 | 147459.80 | ||||
| 500 | −0.084 | 1.071 | 202369.41 | 864.35 | 129962.70 | ||||
| Min. | 250 | −0.084 | 0.834 | 202369.410 | 644297.560 | 864.350 | 134508.510 | 129962.700 | 433835.750 |
| Max. | 500 | 0.753 | 1.082 | 224349.470 | 658176.300 | 180320.200 | 377687.740 | 214133.790 | 546576.670 |
| Sensitivity Analysis of the End-Use Implant | |||||
|---|---|---|---|---|---|
| Iteration | CAD Implant Mesh (STL) Properties | Mean Distance [mm] | Standard Deviation [mm] | ||
| Max. Edge Length [mm] | Number of Triangles [-] | Number of Points [-] | |||
| Original | - | 13368 | 6584 | 0.031 | 0.100 |
| 1 | 0.5 | 13672 | 6736 | 0.034 | 0.101 |
| 2 | 0.4 | 371204 | 185490 | 0.043 | 0.063 |
| 3 | 0.3 | 526942 | 263351 | 0.043 | 0.065 |
| 4 | 0.2 | 1015062 | 507408 | 0.042 | 0.062 |
| 5 | 0.1 | 3660090 | 1829738 | 0.042 | 0.062 |
| Magnification Error of the Additively Manufactured End-Use Implant | ||
|---|---|---|
| Base Implant Orientation | Axis | Magnification Error [-] |
 | X | 0.0005 |
| Y | 0.0010 | |
| Z | 0.0150 | |
| Uncertainty and Error Budget of the End-Use Implant | |||||
|---|---|---|---|---|---|
| Entity | Process | Error Source | Implant Error (L: 56.852 mm) [mm] | Non-Length Dependent Dtandard Uncertainty [mm] | Length Dependent Standard Uncertainty |
| QA Phantom | CT Imaging: Multi-slice computed tomography | Volumetric | 0.191 | 0.0779 | 0.00117 |
| SD head | 3D Thresholding: Volume-based segmentation | DICOM to STL conversion (CT Protocol 1: 300 HU) | 0.602 | 0.602 | - |
| Implant | 3D Modeling: Digital design (Surface modeling) | CAD | 0.00005 | 0.0000029 | - |
| 3D Printing/Additive manufacturing: Metal PBF | End-use implant | 0.914 | 0.0612 | 0.00866 | |
| Cumulative | 1.71 | - | - | ||
| Cumulative involving two boundary surfaces | 2.31 | ||||
| Combined standard uncertainty | 0.610 | 0.0087 | |||
| Combined standard uncertainty (L: 56.852 mm) | 0.787 mm | ||||
| Source | Anatomical Model | Imaging Medium | Imaging Modality | Measurement Principle | ISO/ASTM Additive Manufacturing Technology | Absolute Mean Difference (mm) * | Relative Mean Difference (%) * | Measurement Instrument(s) |
|---|---|---|---|---|---|---|---|---|
| Present study | Skull and end-use zygomatic arch resection implant | Skull with and without soft tissue | CT and optical 3D coordinates measuring system | Principles of GUM applied to a tactile-probed Phantom for CT imaging, surface comparison for 3D thresholding, software for 3D modeling, and surface comparison for additive manufacturing | Titanium PBF | uc = 0.610 + (0.0087)L uc (L = 56.852; 1 BS) = 0.787 uc (L = 56.852; 2 BS) = 1.307 Worst-case error: 1.71 for one BS and 2.31 for two BS | uc = 0.610 + (0.87%)L uc (L = 56.852; 1 BS) = 1.4% uc (L = 56.852; 2 BS) = 2.3% Worst-case error: 3.0% for one BS and 4.1% for two BS | CMM and optical 3D coordinates measuring system |
| Barker et al. [81] | Skull | Water | CT | Repeated measurements between anatomical landmarks | Vat photopolymerization | 1.8 (0.10–4.62) | 0.6–3.7 | Caliper |
| Chang et al. [82] | Skull | With and without soft tissue | CT and caliper | Repeated measurements between anatomical landmarks | Binder jetting | 1.54 (0.00–8.70) | 3.4 (00.0–23.6) | Caliper |
| Choi et al. [83] | Skull and mandible | Air | CT | Repeated measurements between anatomical landmarks | Vat photopolymerization | 0.62 ± 0.35 (0.04–1.22) | 0.9 ± 0.5 (0.0–1.9) | Caliper |
| El-Katatny et al. [84] | Skull Mandible | With soft tissue | CT | Repeated measurements between artificial grooved holes on anatomical landmarks | Material extrusion | 0.11 ± 0.05 0.08 ± 0.03 | 0.24 ± 0.16 0.22 ± 0.11 | Digital caliper |
| Ibrahim et al. [85] | Mandible | Air | CT | Repeated measurements between anatomical landmarks | Binder jetting Material jetting Polymer PBF | 0.91 ± 0.59 (0.44–2.52) 1.44 ± 1.11 (0.02–3.19) 1.23 ± 1.15 (0.03–3.92) | 1.8 ± 1.3 (0.4–4.4) 3.1 ± 2.7 (0.0–7.4) 2.1 ± 1.9 (0.0–5.3) | Digital caliper and a dial test indicator attached to an electric milling machine |
| Nizam et al. [86] | Skull | Air | CT | Repeated measurements between anatomical landmarks | Vat photopolymerization | 0.23 ± 1.37 | 0.08 ± 1.25 | Digital caliper |
| Ono et al. [87] | Skull | Water | CT | Repeated measurements between anatomical landmarks | Vat photopolymerization | - | <3 | - |
| Osman et al. [88] | Dental implant | - | - | Surface comparison | Ceramic vat photopolymerization | 0.1 † | - | Optical scanner |
| Pinto et al. [54] | Phalanx | Air | CT | Voxel and surface comparison for each modified building parameter, i.e., acquisition, segmentation, triangulation, printing, and infiltration | Binder jetting | −2.71 and 3.03 ‡ | - | CT |
| Salmi et al. [58] | Skull | Air | CT | Repeated measurements between artificial reference points on anatomical landmarks | Polymer PBF Material jetting Binder jetting | - | 0.79 ± 0.26 and 0.80 ± 0.32 § 0.67 ± 0.43 and 0.69 ± 0.44 ** 0.18 ± 0.12 and 0.18 ± 0.13 ** | CMM |
| Silva et al. [89] | Skull | Air | CT | Repeated measurements between anatomical landmarks | Polyamide PBF Binder jetting | 1.25 ± 0.83 (0.19–2.94) 1.55 ± 0.70 (0.38–2.33) | 2.1 ± 1.4 (0.2–3.9) 3.1 ± 2.6 (0.5–6.9) | Digital caliper |
| Taft et al. [90] | Skull | Air | CT | Repeated measurements between artificial reference points on anatomical landmarks | Vat photopolymerization x-axis y-axis z-axis | 0.09 ± 0.07 (0.00–0.29) 0.12 ± 0.10 (0.00–0.33) 0.41 ± 0.15 (0.09–0.70) | - | CMM |
| van Eijnatten et al. [91] | Mandible | Air | CT Magnetic resonance Optical scanning | Surface comparison | Binder jetting CT-derived Magnetic resonance-derived Optical scanning-derived | 0.88 †† 1.73 †† 0.46 †† | - | Optical 3D scanner |
| Waitzman et al. [92] | Skull | Air | CT | Repeated measurements between anatomical landmarks | - | - | 0.9 (0.1–3.0) | Caliper |
© 2020 by the authors. Licensee MDPI, Basel, Switzerland. This article is an open access article distributed under the terms and conditions of the Creative Commons Attribution (CC BY) license (http://creativecommons.org/licenses/by/4.0/).
Share and Cite
Akmal, J.S.; Salmi, M.; Hemming, B.; Teir, L.; Suomalainen, A.; Kortesniemi, M.; Partanen, J.; Lassila, A. Cumulative Inaccuracies in Implementation of Additive Manufacturing Through Medical Imaging, 3D Thresholding, and 3D Modeling: A Case Study for an End-Use Implant. Appl. Sci. 2020, 10, 2968. https://doi.org/10.3390/app10082968
Akmal JS, Salmi M, Hemming B, Teir L, Suomalainen A, Kortesniemi M, Partanen J, Lassila A. Cumulative Inaccuracies in Implementation of Additive Manufacturing Through Medical Imaging, 3D Thresholding, and 3D Modeling: A Case Study for an End-Use Implant. Applied Sciences. 2020; 10(8):2968. https://doi.org/10.3390/app10082968
Chicago/Turabian StyleAkmal, Jan Sher, Mika Salmi, Björn Hemming, Linus Teir, Anni Suomalainen, Mika Kortesniemi, Jouni Partanen, and Antti Lassila. 2020. "Cumulative Inaccuracies in Implementation of Additive Manufacturing Through Medical Imaging, 3D Thresholding, and 3D Modeling: A Case Study for an End-Use Implant" Applied Sciences 10, no. 8: 2968. https://doi.org/10.3390/app10082968
APA StyleAkmal, J. S., Salmi, M., Hemming, B., Teir, L., Suomalainen, A., Kortesniemi, M., Partanen, J., & Lassila, A. (2020). Cumulative Inaccuracies in Implementation of Additive Manufacturing Through Medical Imaging, 3D Thresholding, and 3D Modeling: A Case Study for an End-Use Implant. Applied Sciences, 10(8), 2968. https://doi.org/10.3390/app10082968