Driver Facial Expression Analysis Using LFA-CRNN-Based Feature Extraction for Health-Risk Decisions


Abstract
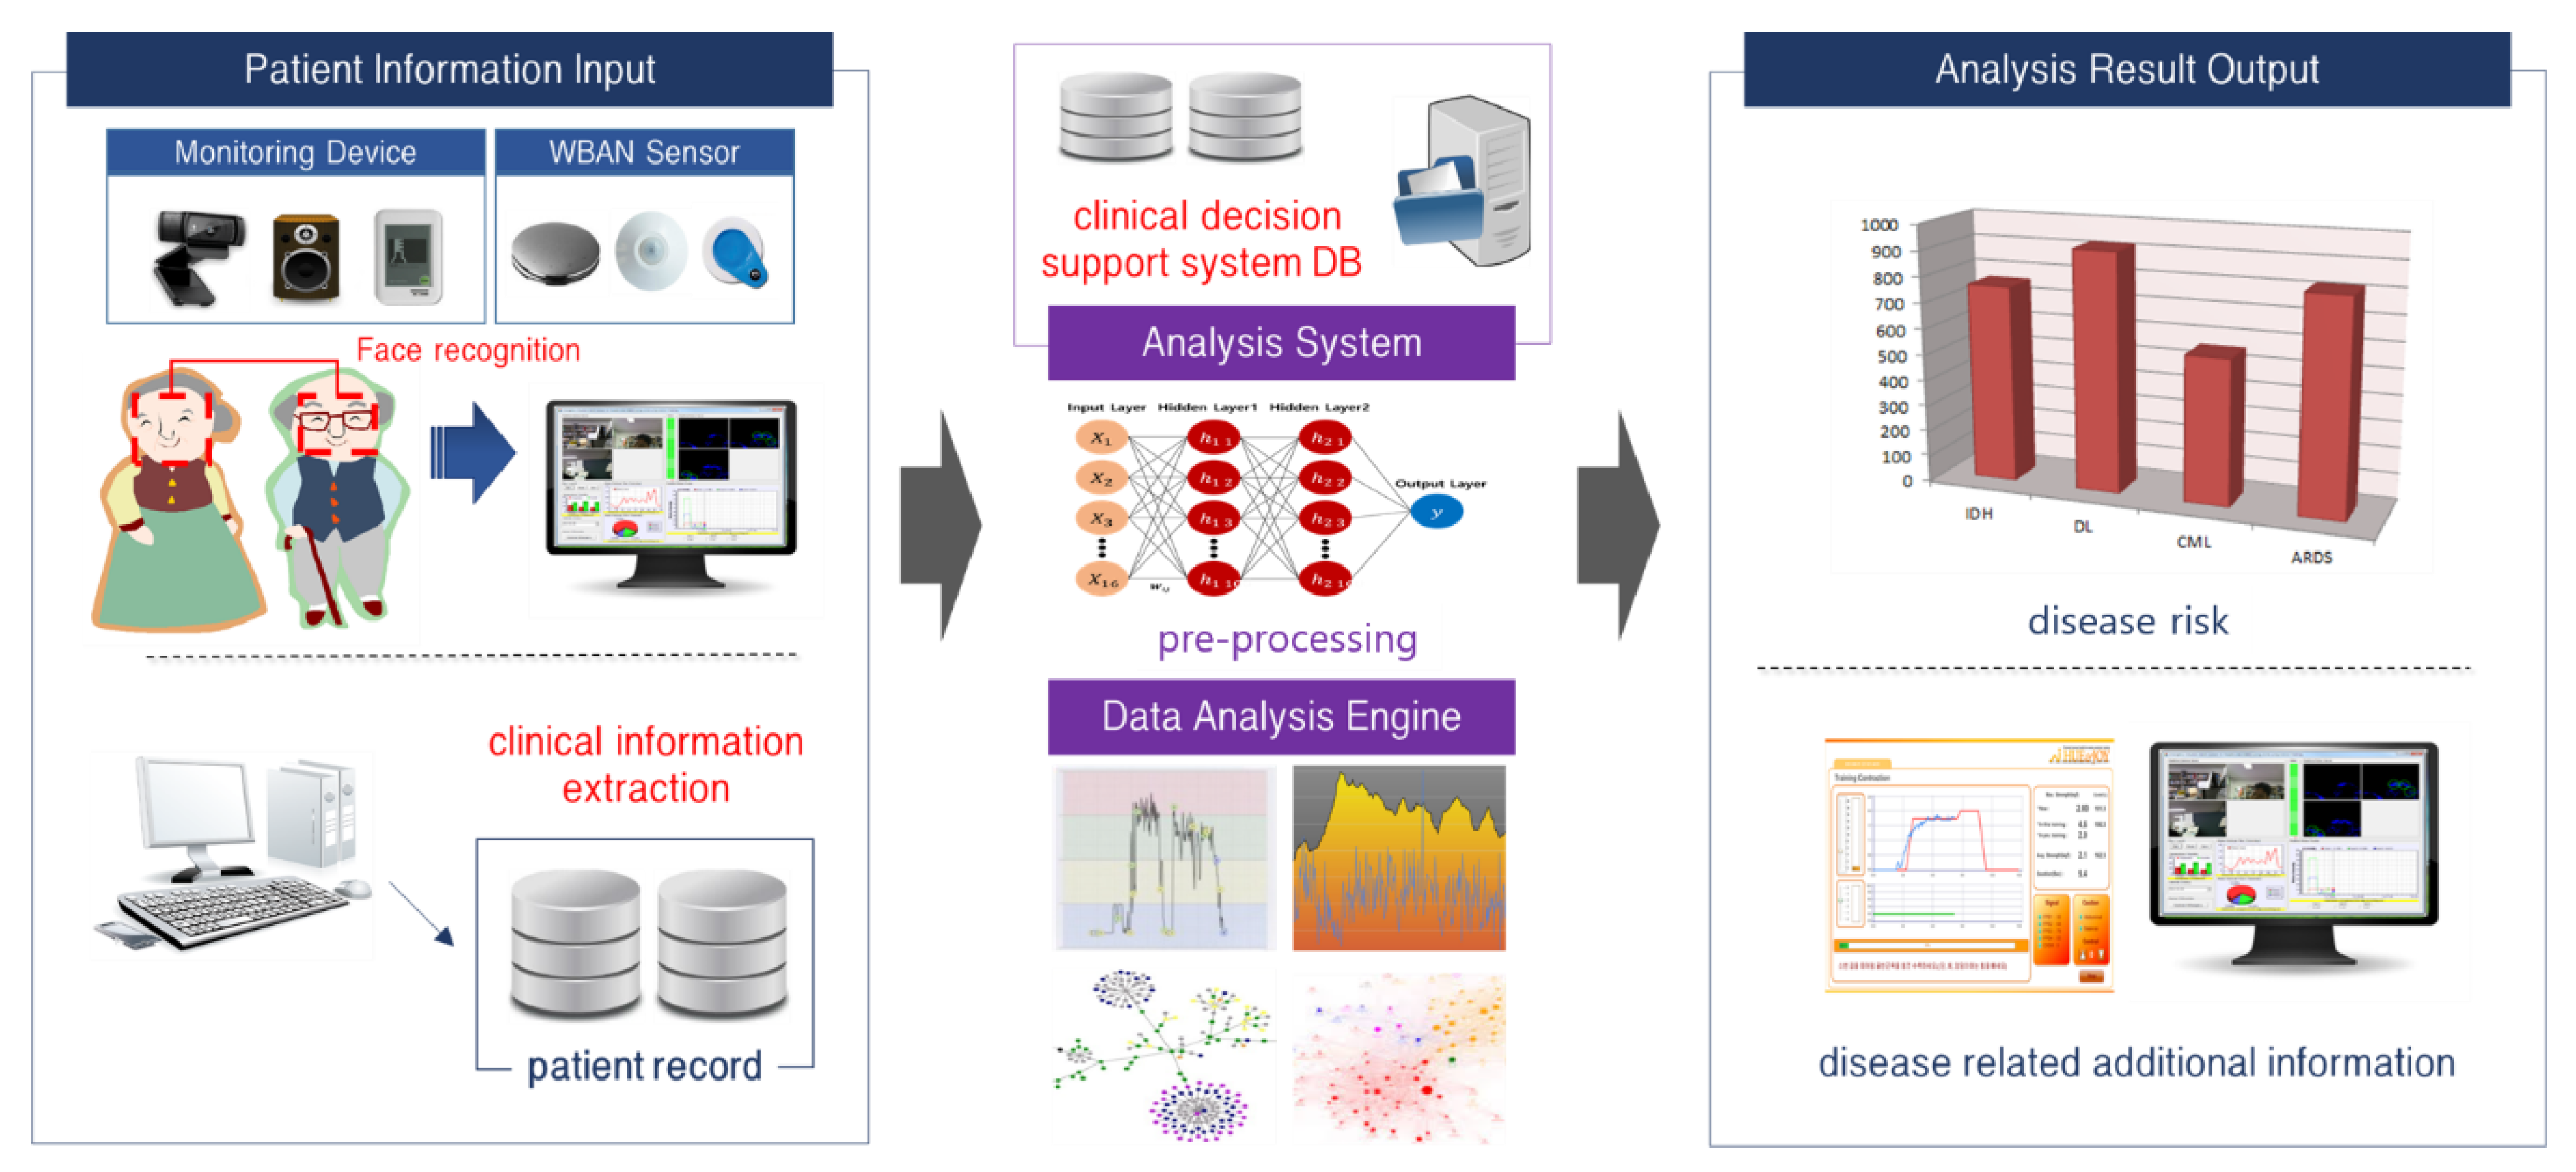
1. Introduction
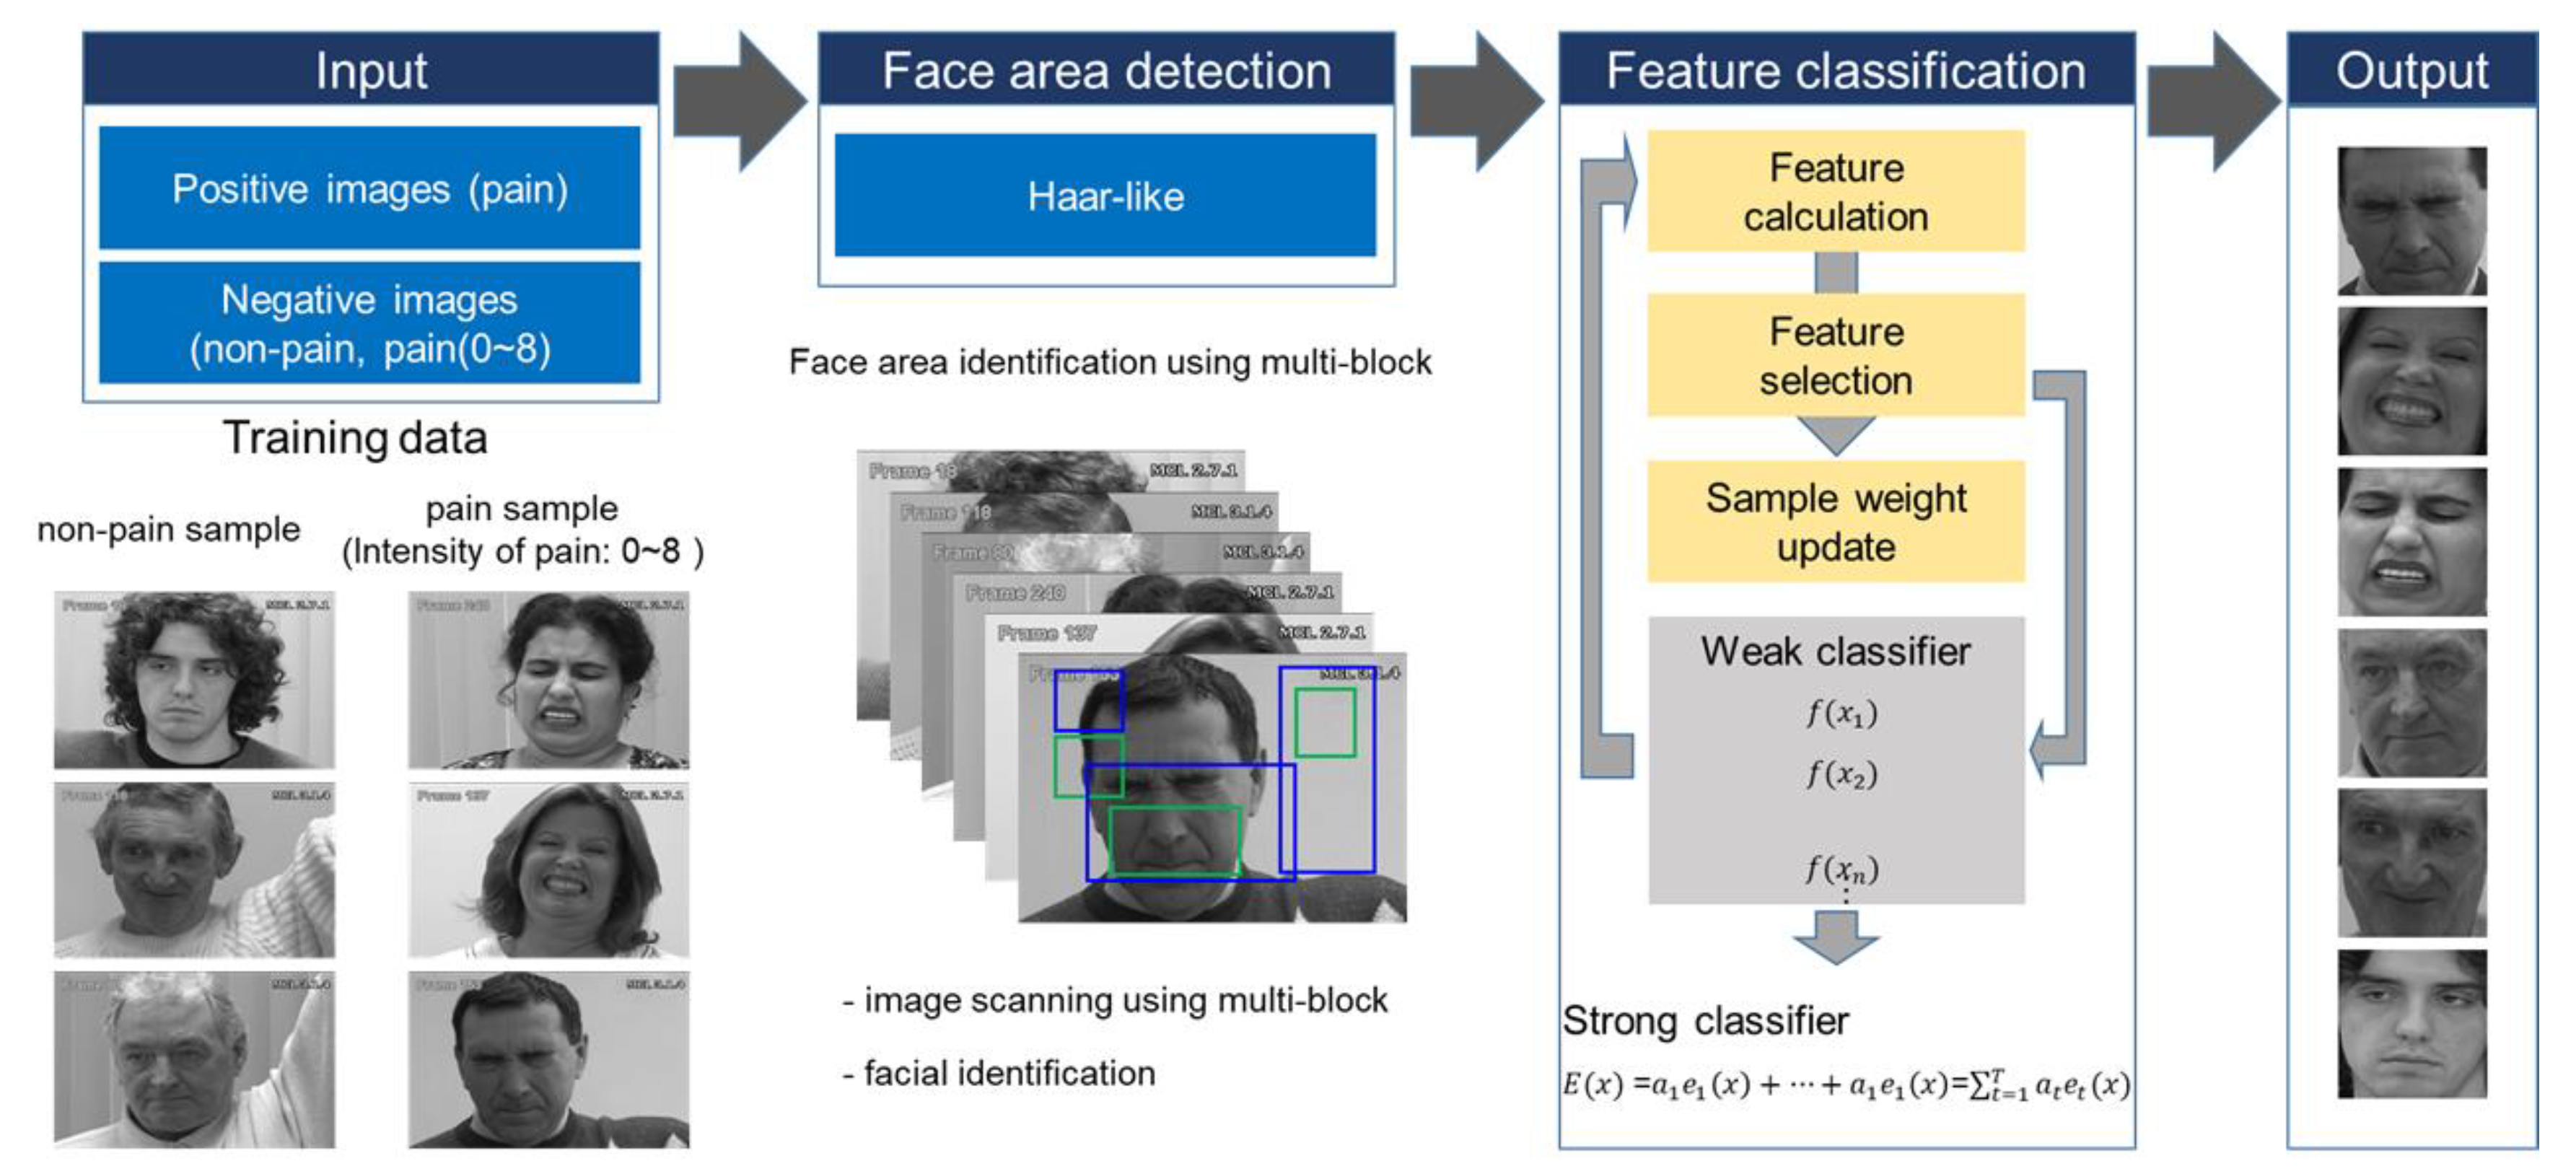
2. Related Research
2.1. Face Analysis Research Trends
2.2. Facial Expression Analysis and Emotion-Based Services
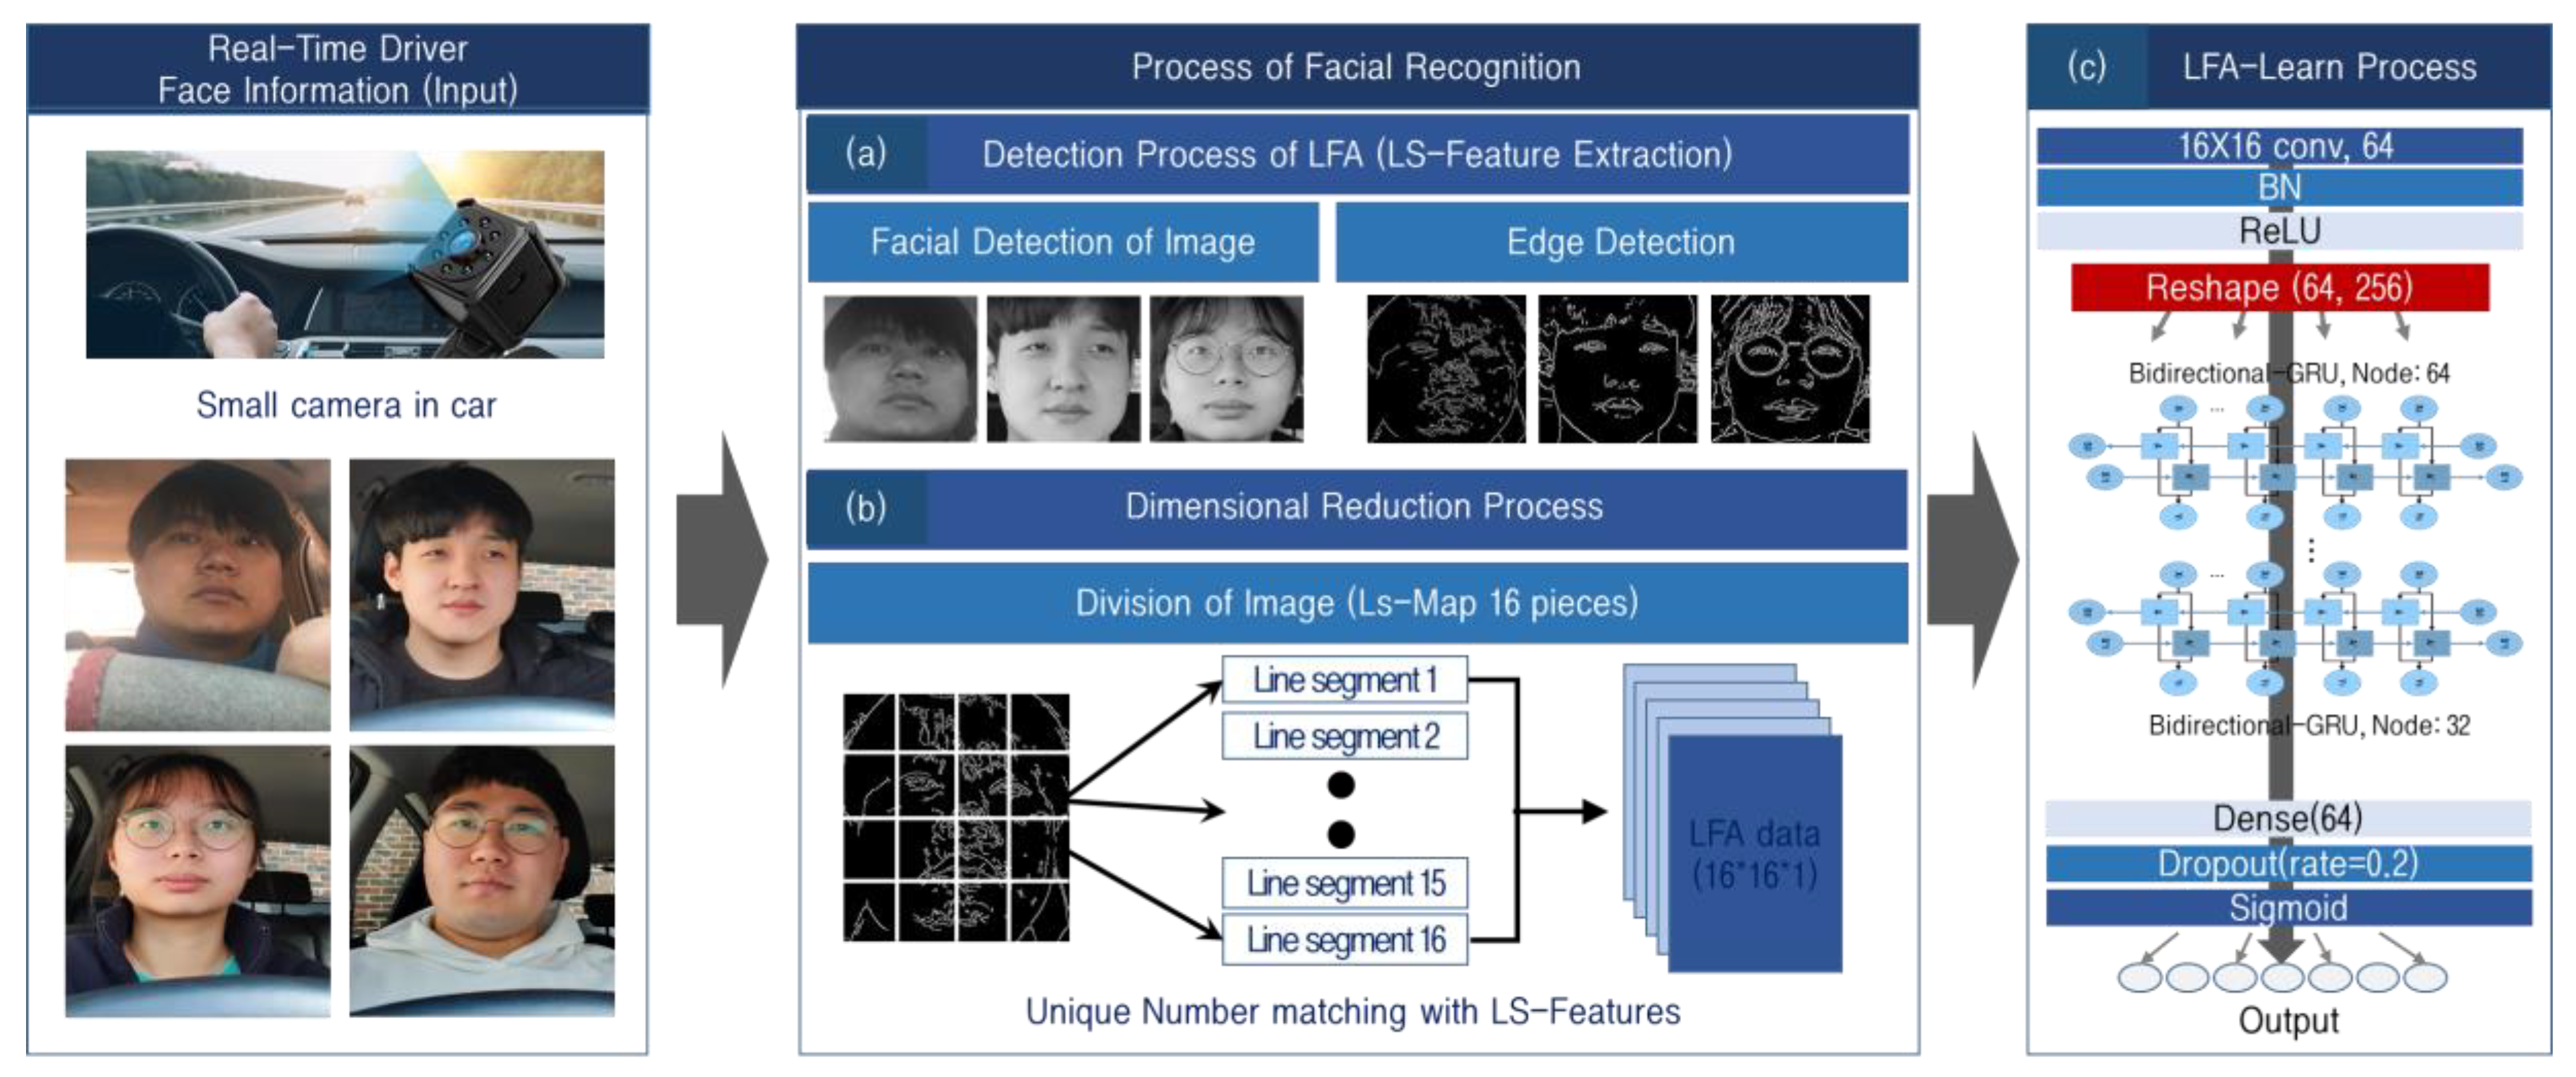
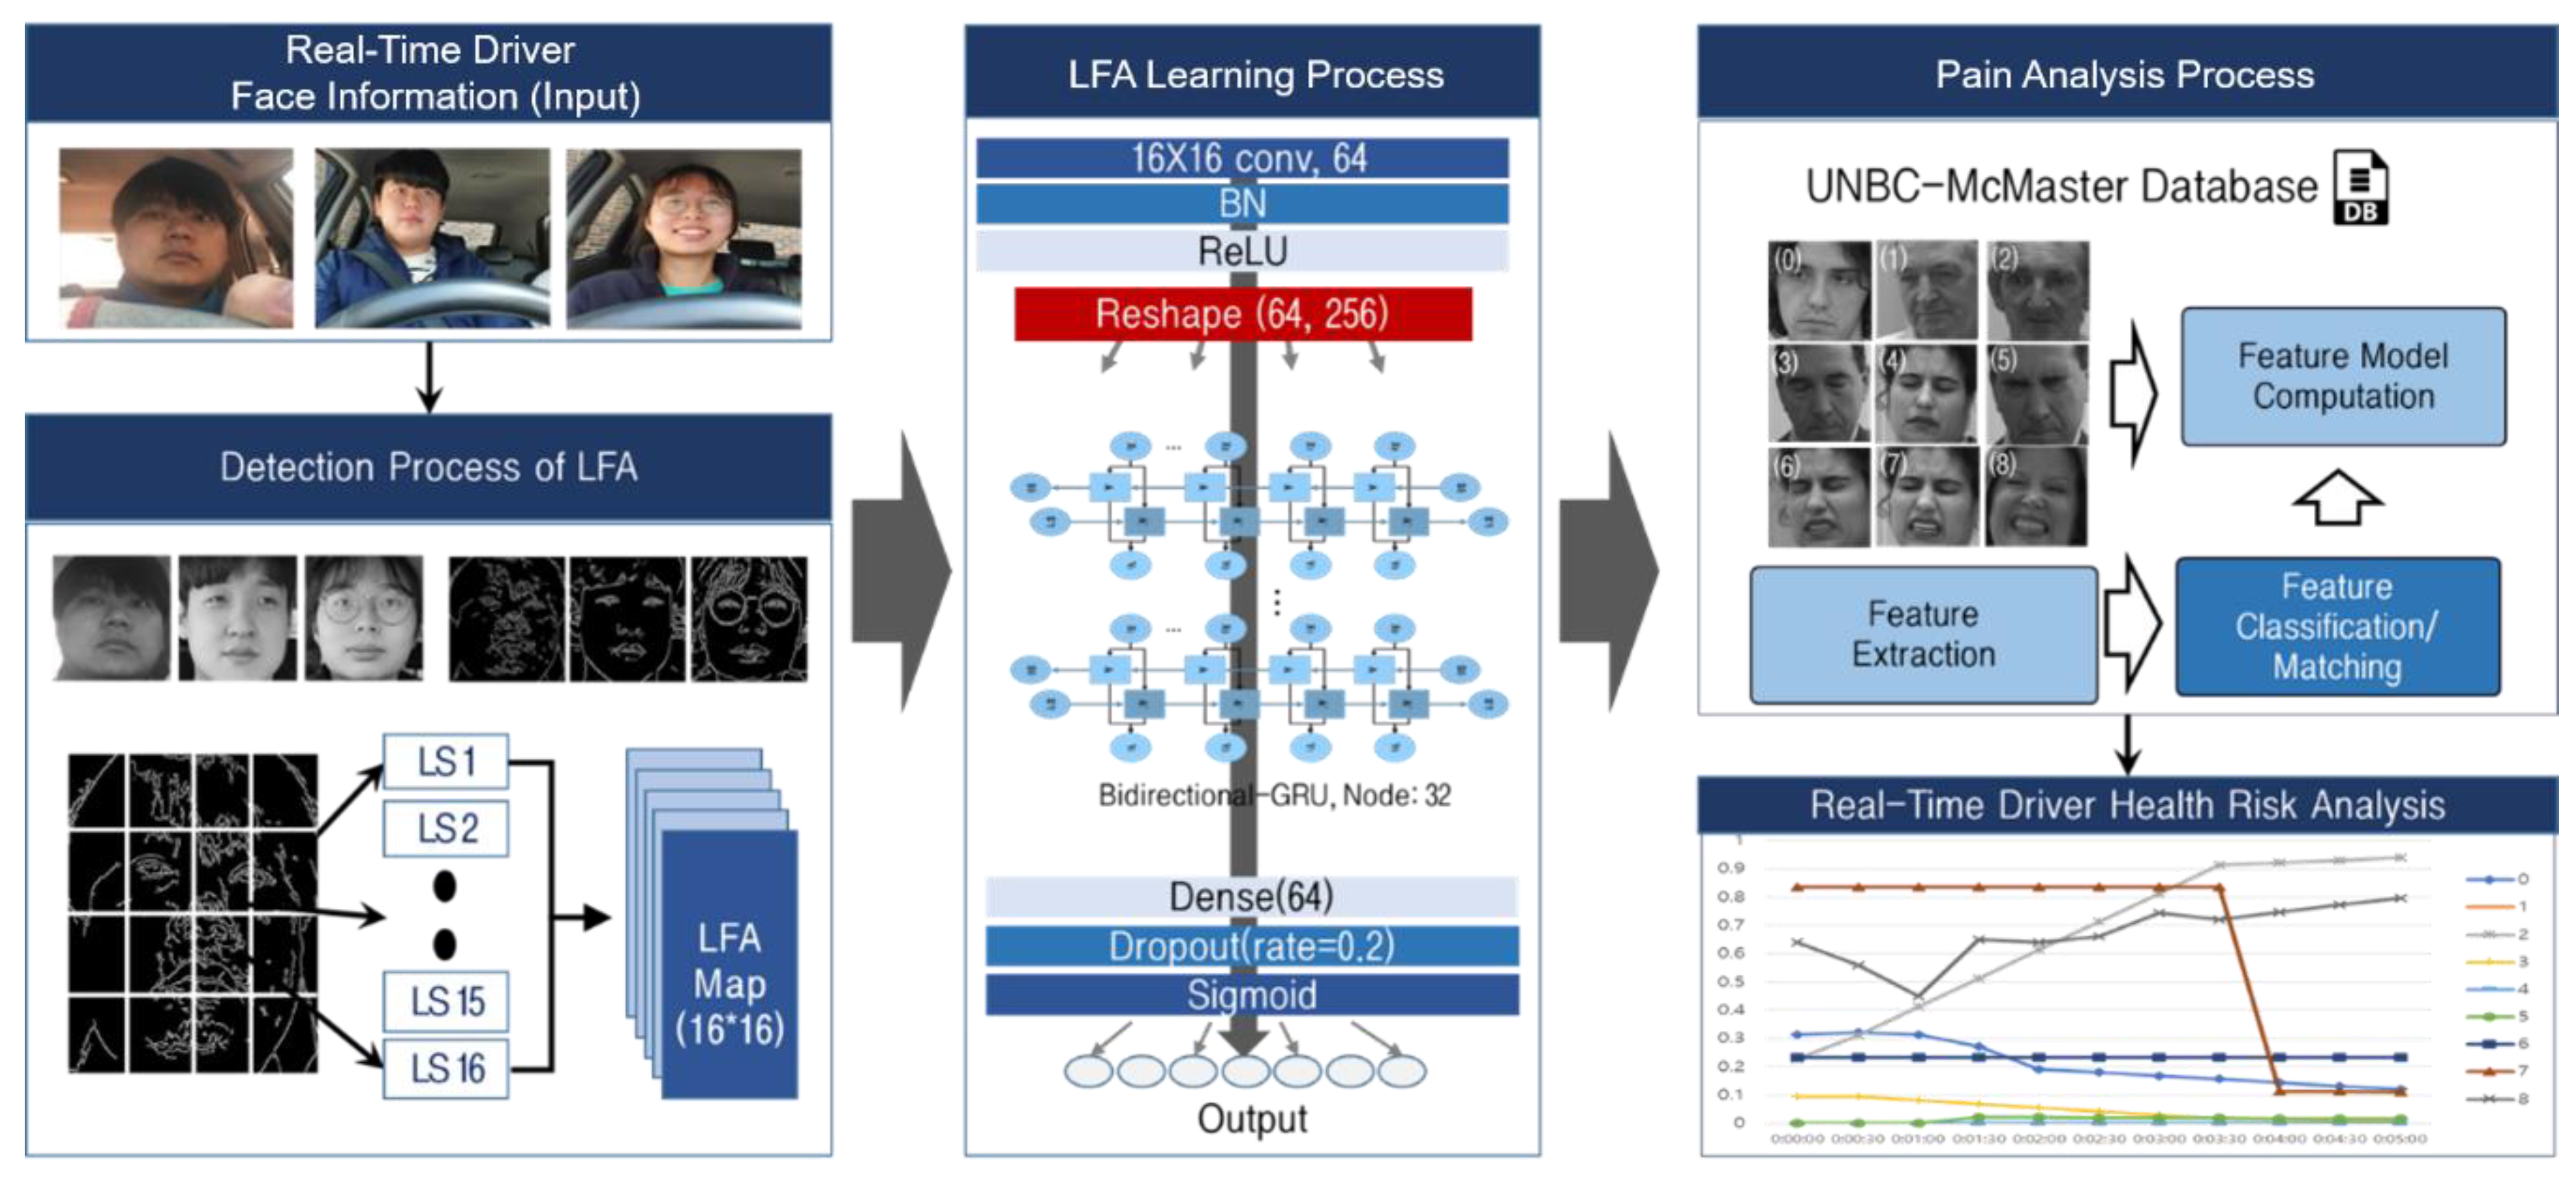
3. Driver Health-Risk Analysis Using Facial Expression Recognition-Based LFA-CRNN
3.1. Real-Time Stream Image Data Pre-Processing for Facial Expression Recognition-Based Health Risk Extraction
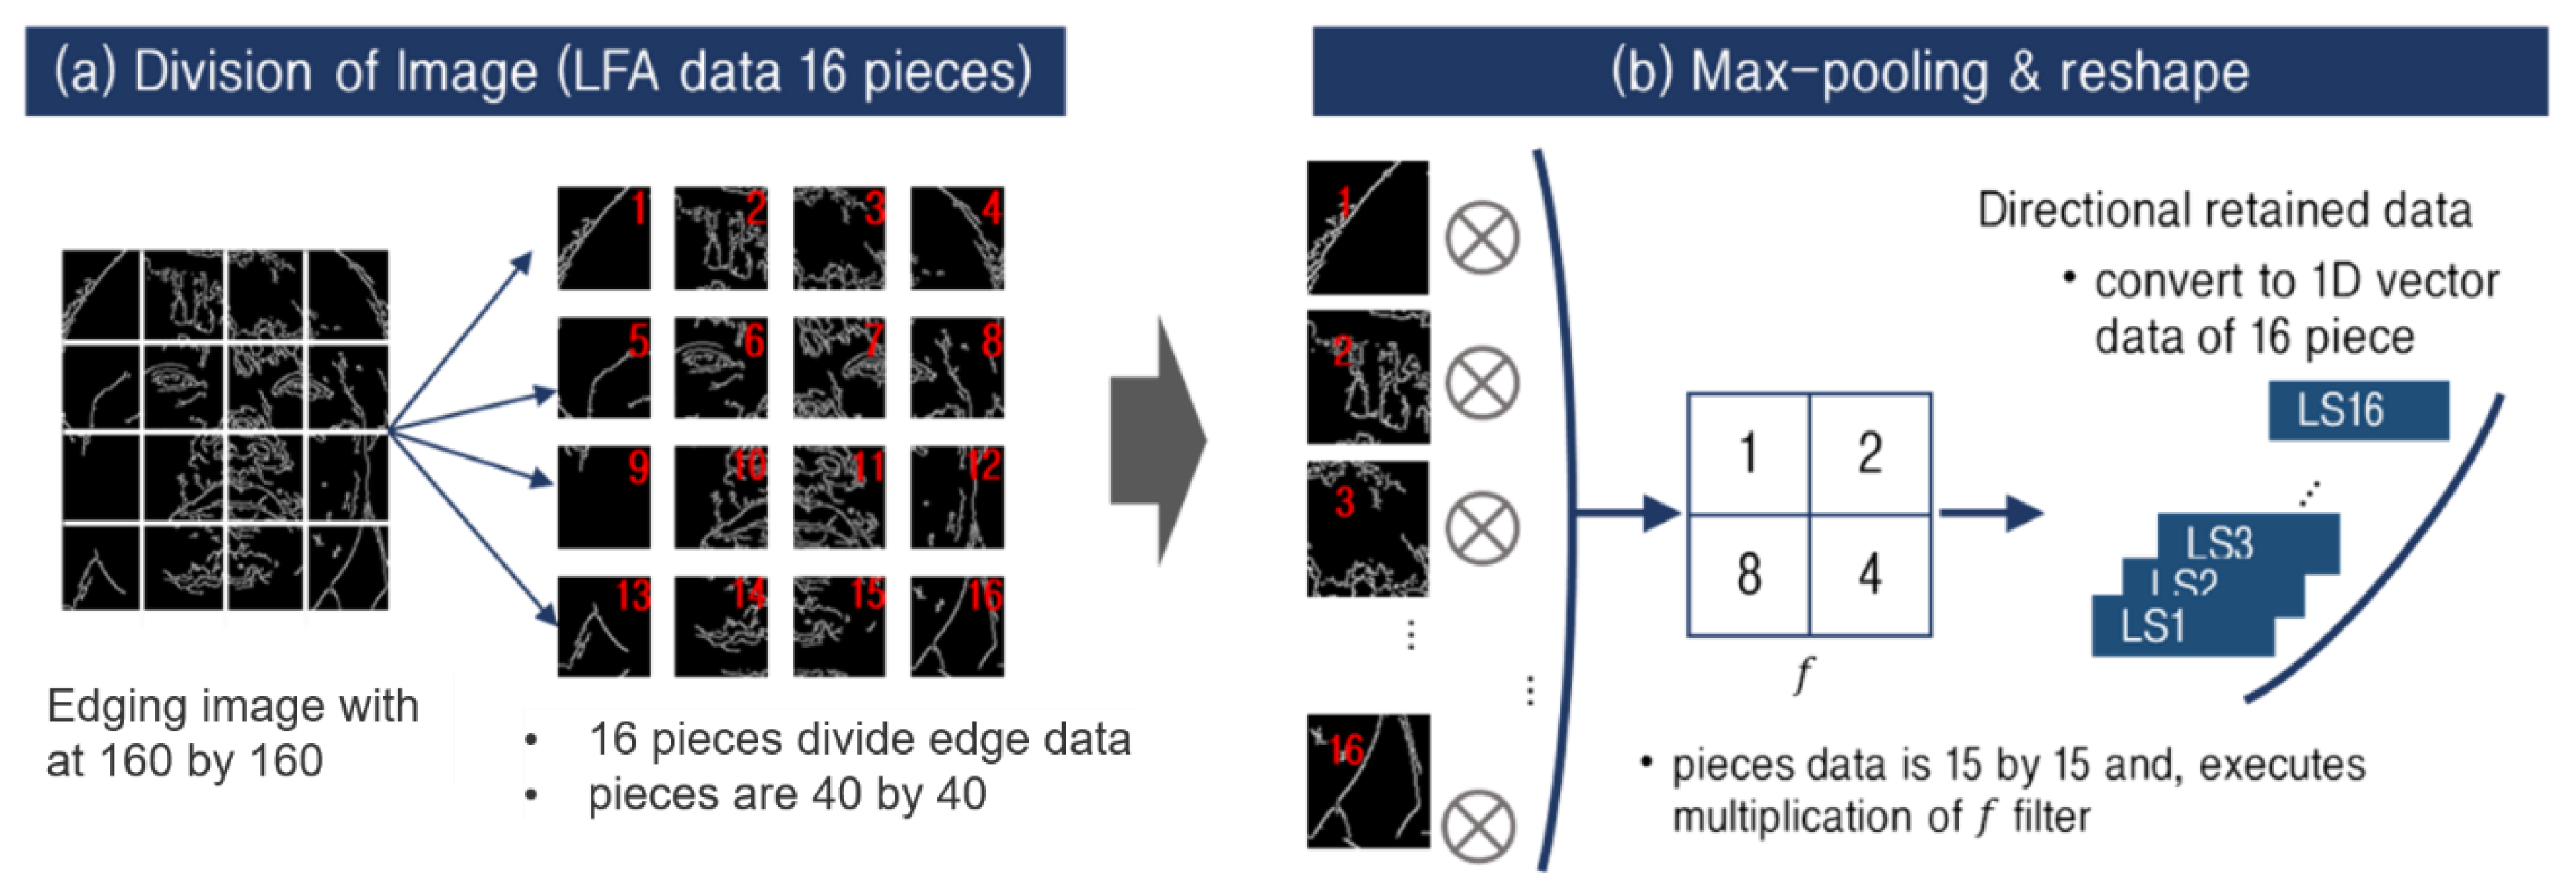
3.2. Line-Segment Feature Analysis (LFA) Algorithm for Real-Time Stream Image Analysis Load Reduction
3.2.1. Pain Feature Extraction through LFA
| Algorithm 1 Image Division Algorithm |
| Input: [x1, x2, …, xn] def Division and Max-pooling of image Y = List() for xi in [x1, x2, …, xn] do sub = List() for w from 0 to Dw do // Dw, Dh denote the size of the image to be divided. for h from 0 to Dh do // fw, fh denote the size of the filter. sub.append(xi[w∗fw: (w + 1)∗fw, h∗fh: (h + 1)∗fh]) Y.append(sub) Y = Max-pooling(Y, stride = (2,2), padding = ‘same’) Output: Y[Y1, Y2, …, Yn] |
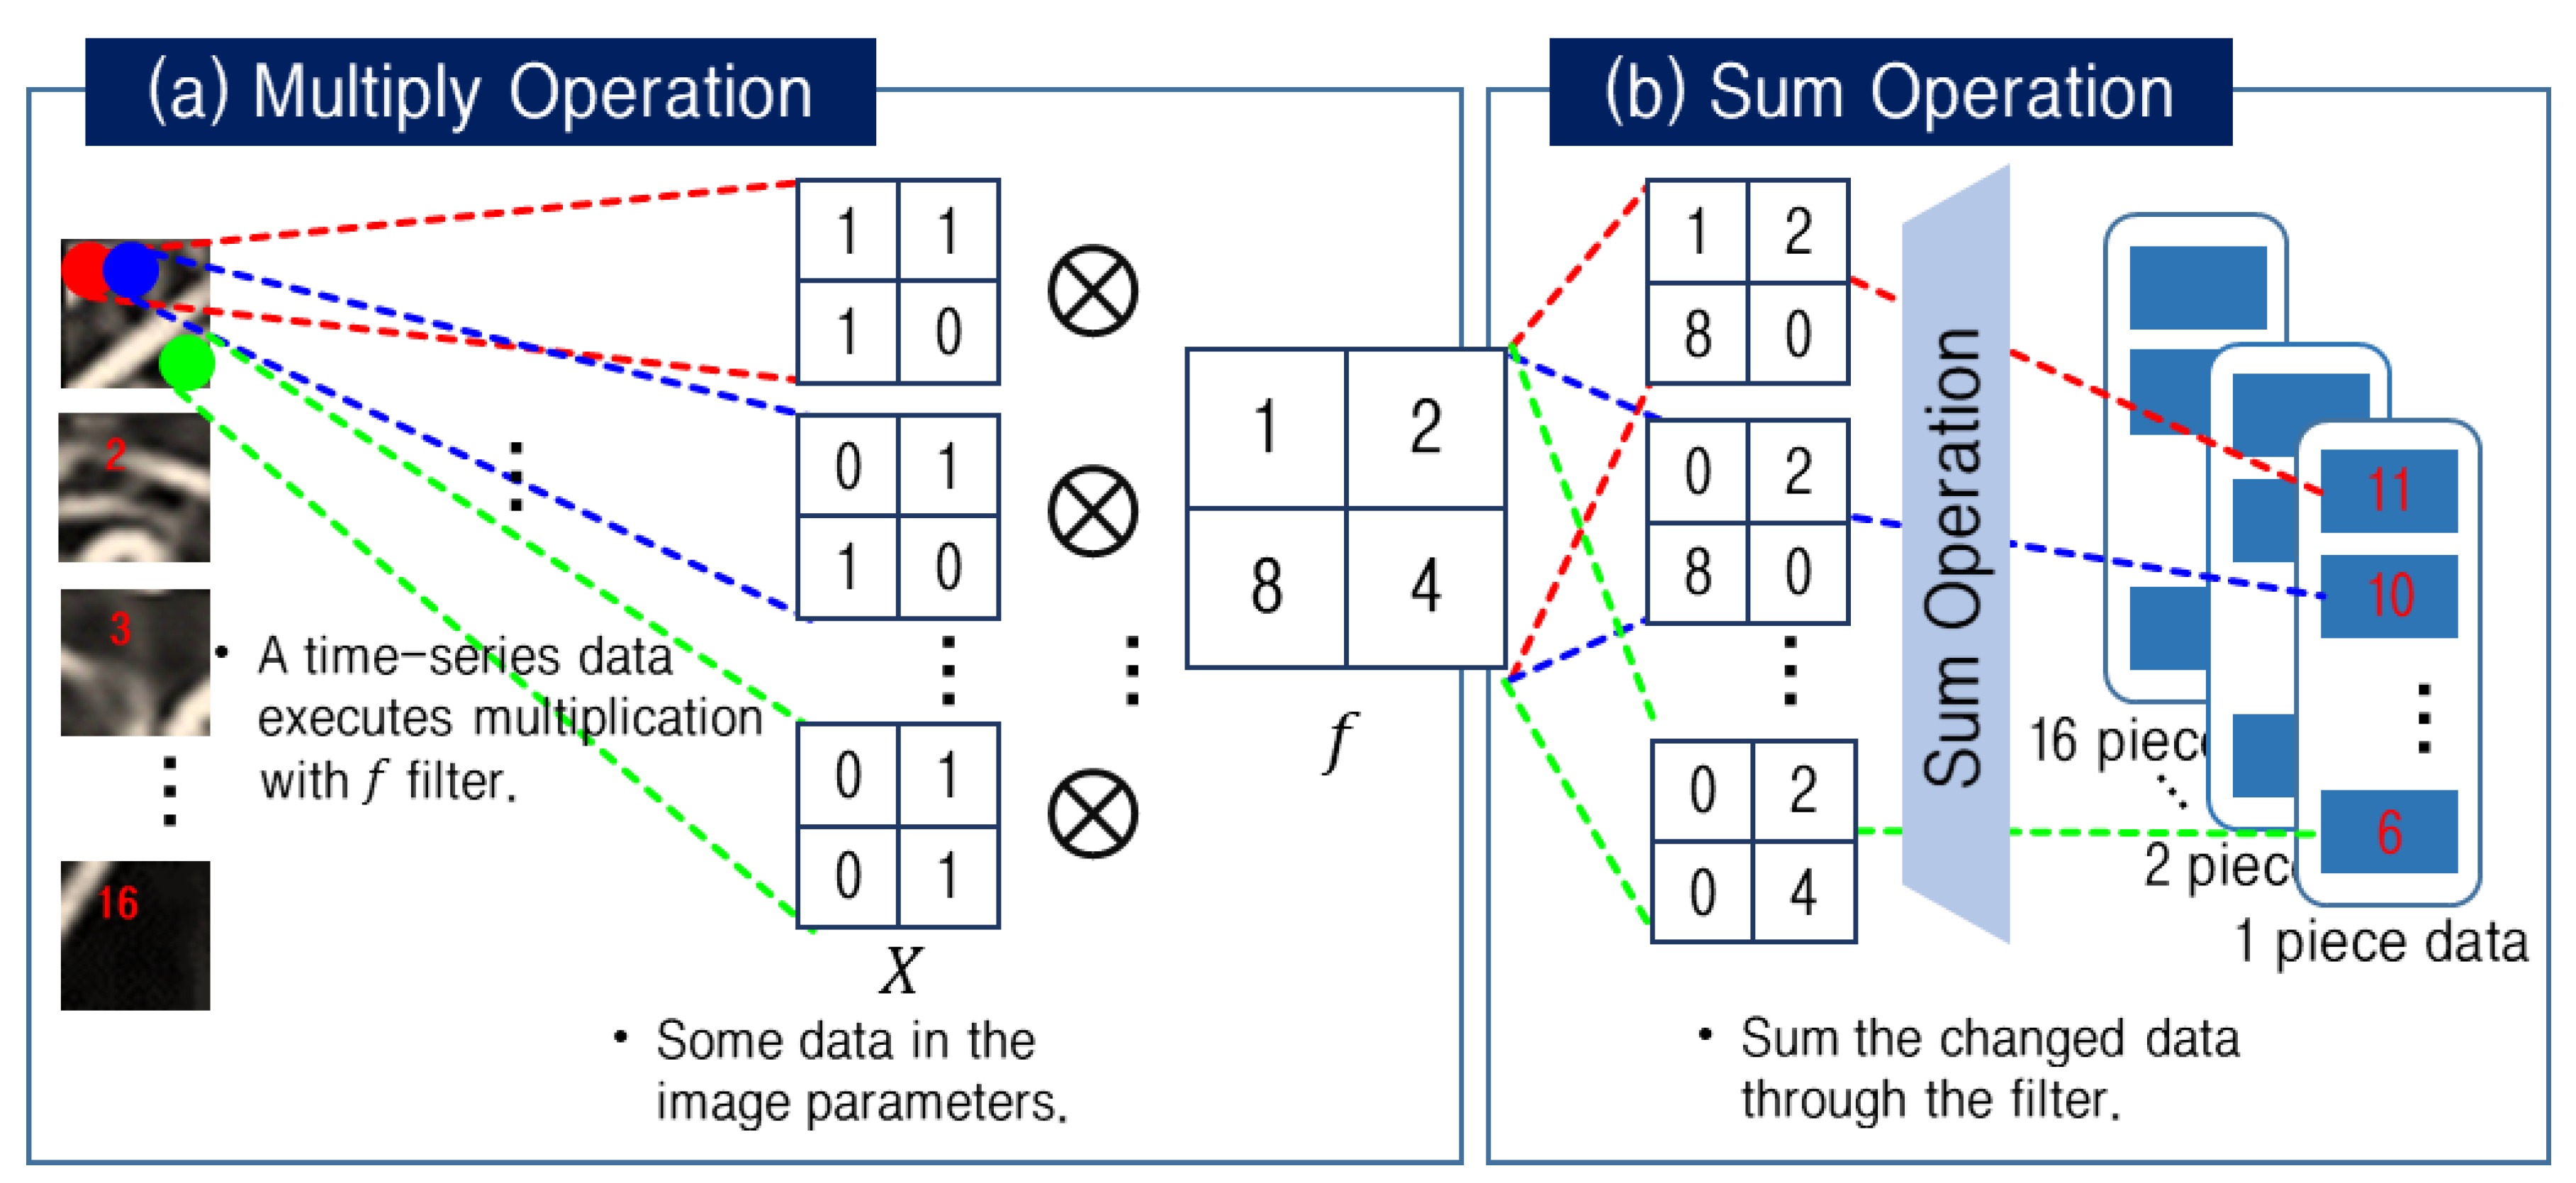
3.2.2. Line-Segment Aggregation-Based Reduced Data Generation for Pain Feature-Extracted Data Processing Load Reduction
| Algorithm 2 1D Vector Conversion Algorithm |
| Input: [x1 = [p1, p2, …, p16], x2 = [p1, p2, …, p16], …, xn = [p1, p2, …, p16]] def Convert image to a 1D vector Label = [1, 2, 8, 4] Y = List() for xi in [x1, x2, …, xn] do // Sub1 is a list to save the result of a piece of the image. sub1 = List () for pi in xi do // Sub2 is a list to save the result of the image of the matched piece // with label data. sub2 = List () for w from 0 to W-fw+1 do for h from 0 to H-fh+1 do p = pi[w:w + fw, h:h + fh] p = p.reshape(−1) ∗ Label sub2.append(sum(p)) sub1.append(sub2) Y.append(sub1) Output: Y[Y1, Y2, …, Yn] |
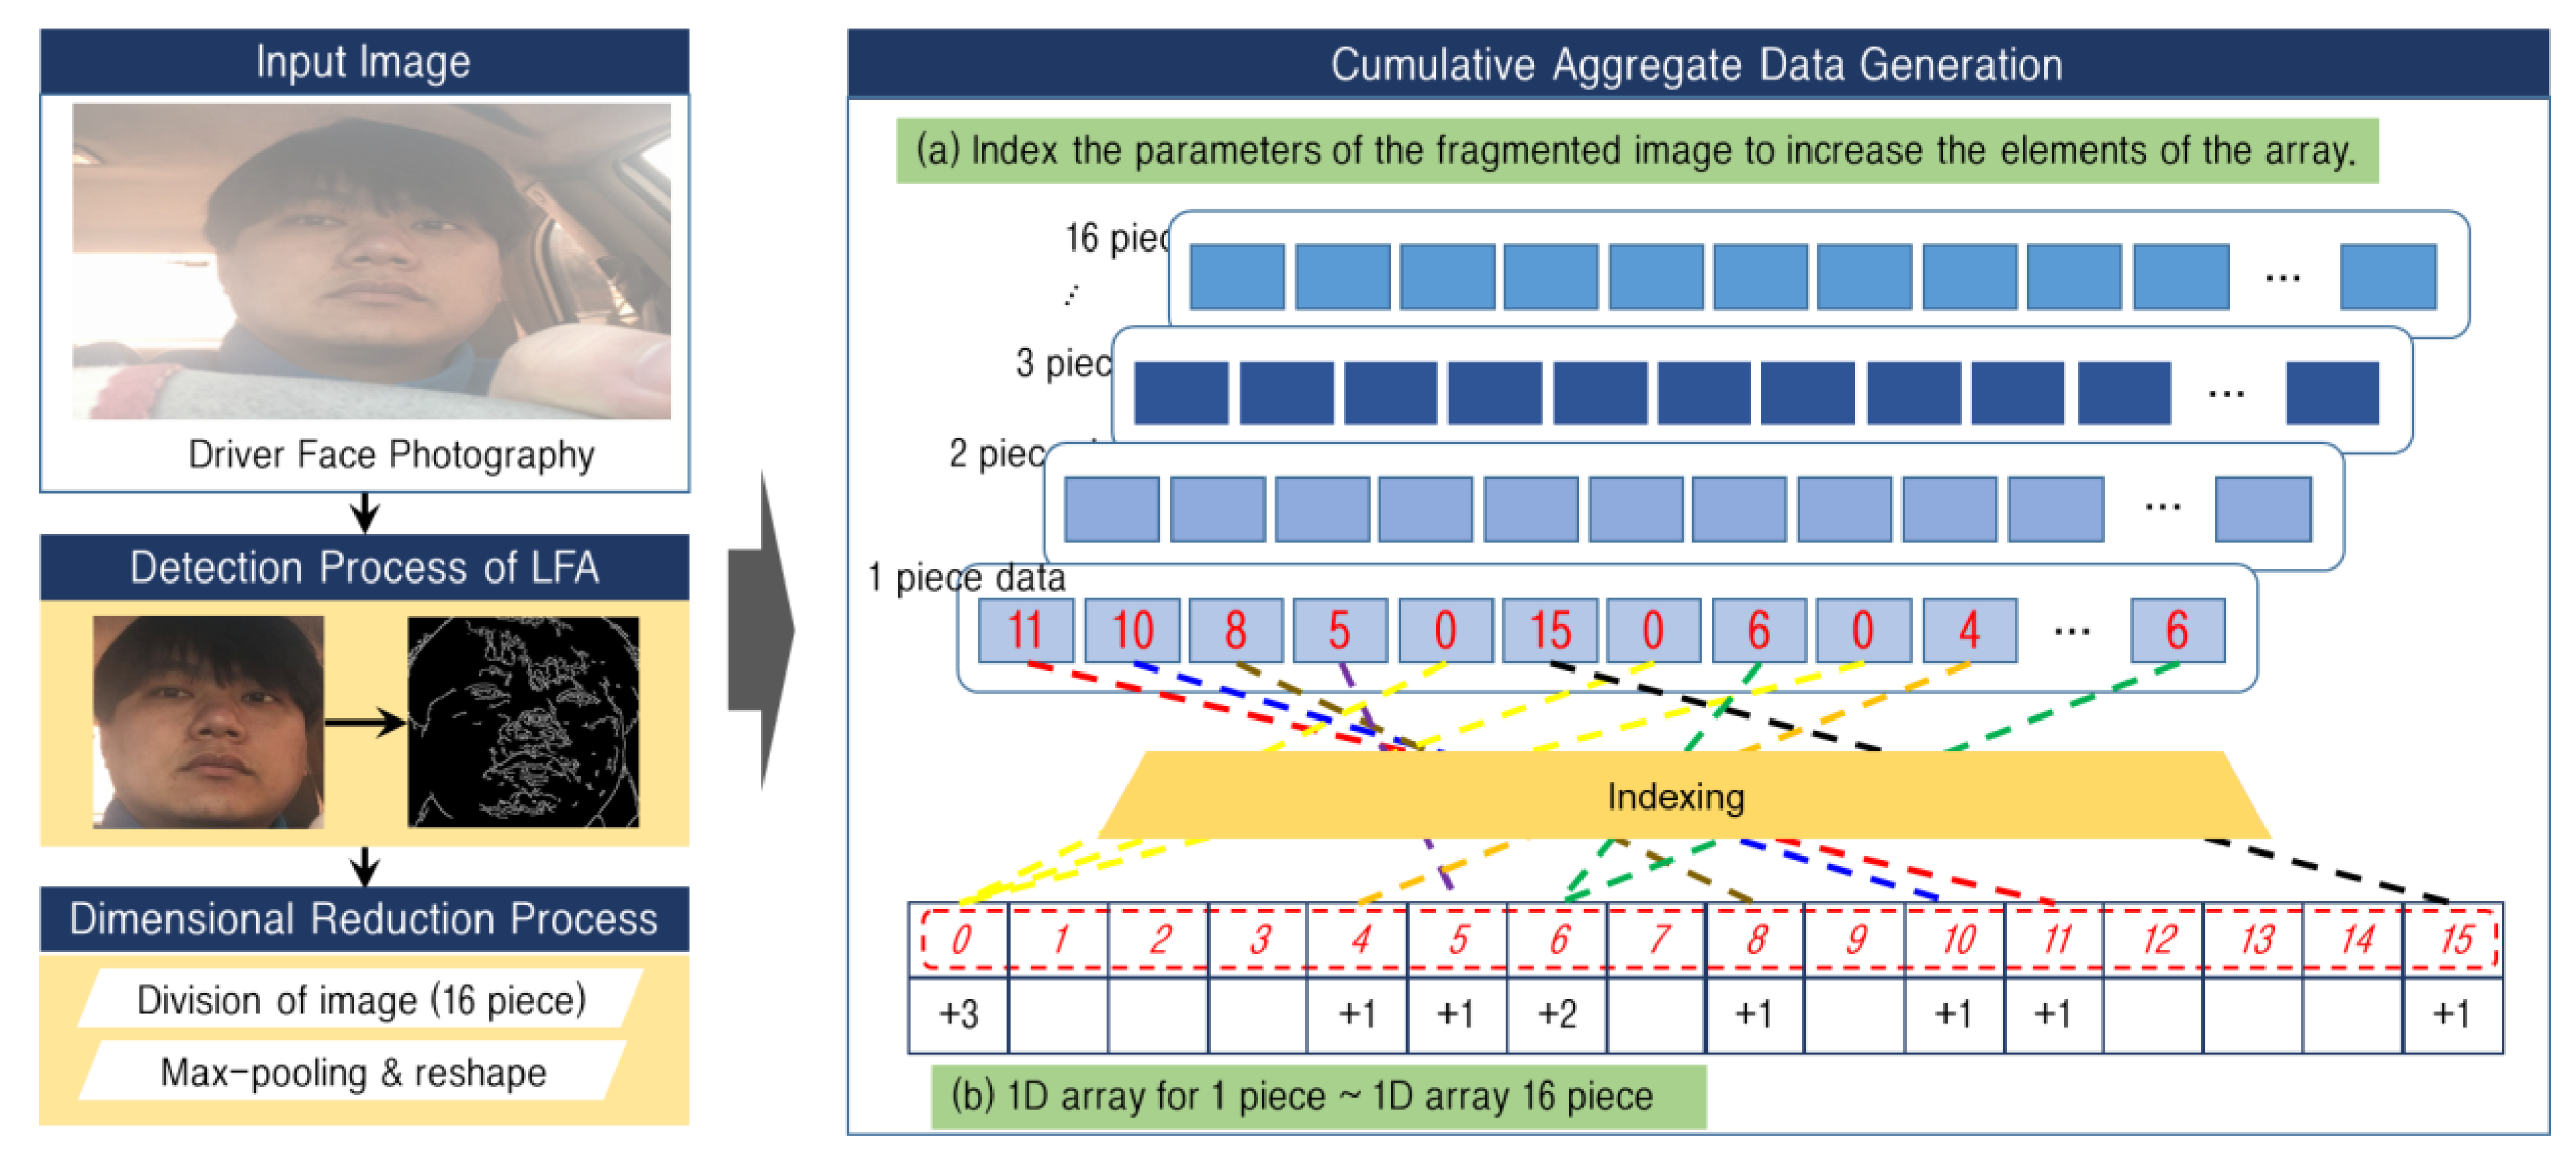
3.2.3. Unique Number-Based Data Compression and Feature Map Generation for Image Dimensionality Reduction
| Algorithm 3 Cumulative Aggregation Algorithm |
| Input: [x1 = [p1 = [v1, v2, … vm], p2, …, p16], x2, …, xn] def Cumulative aggregation used to make LFA data Y = List() for xi in [x1, x2, …, xn] do sub1 = List() for p in xi do sub2 = array(16){0, …} for i from p do sub2[i]++ sub1.append(sub2) Y.append(sub1) Output: Y |
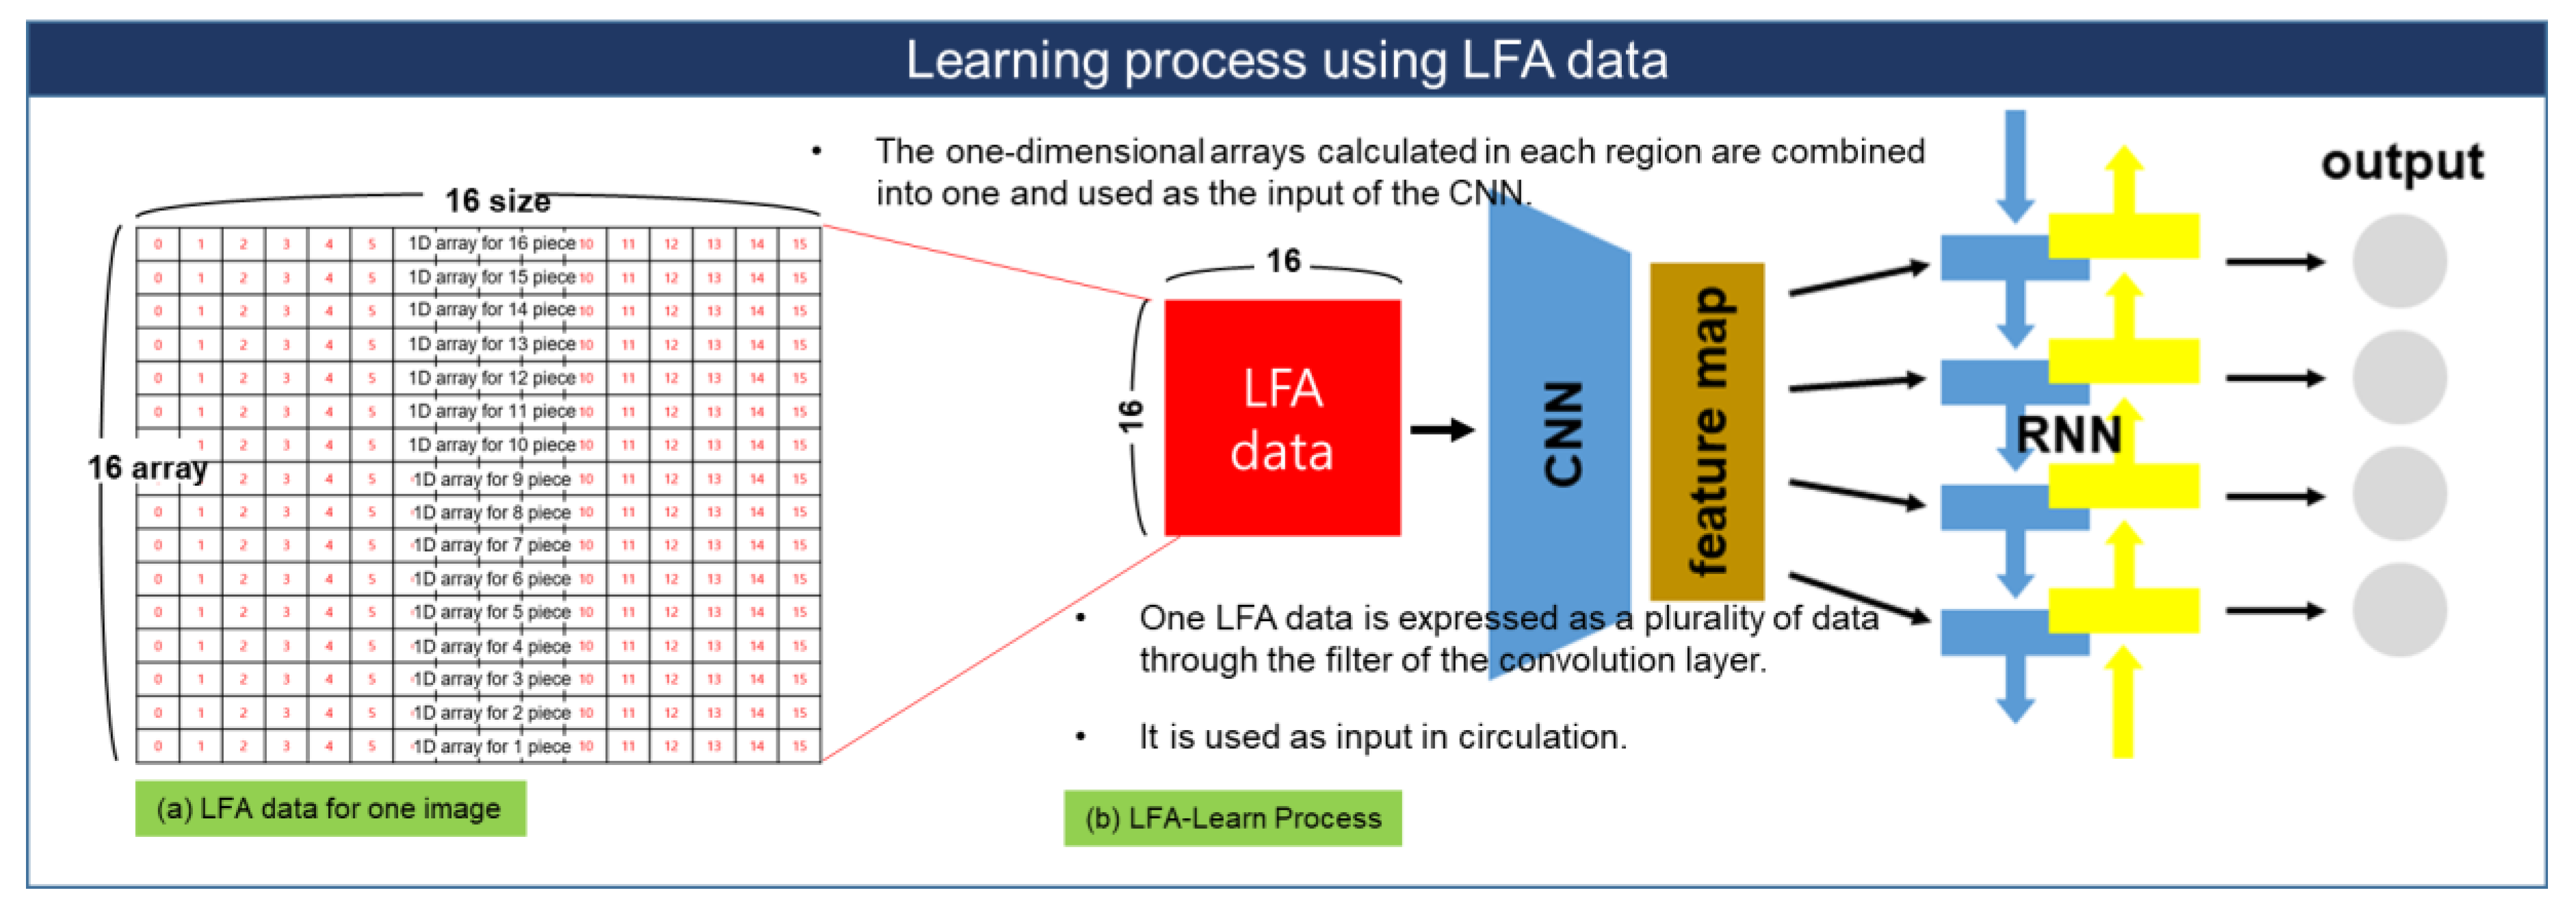
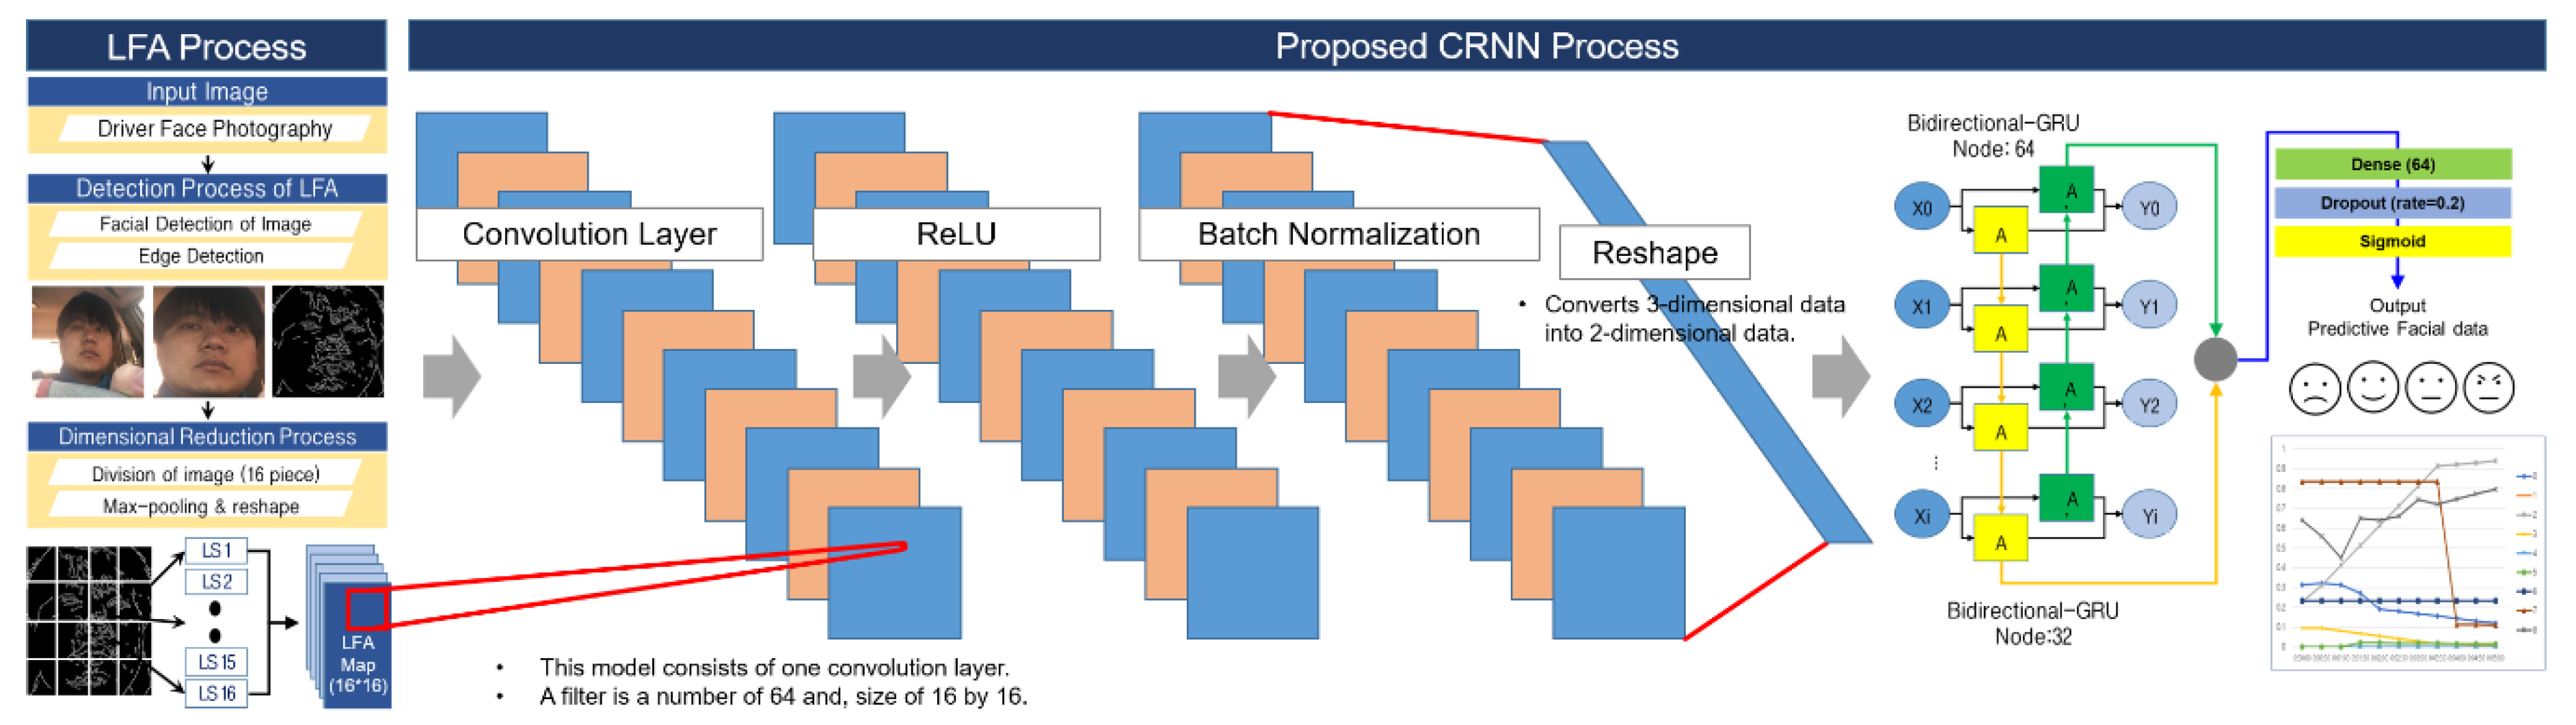
3.3. LFA-CRNN Model for Driver Pain Status Analysis
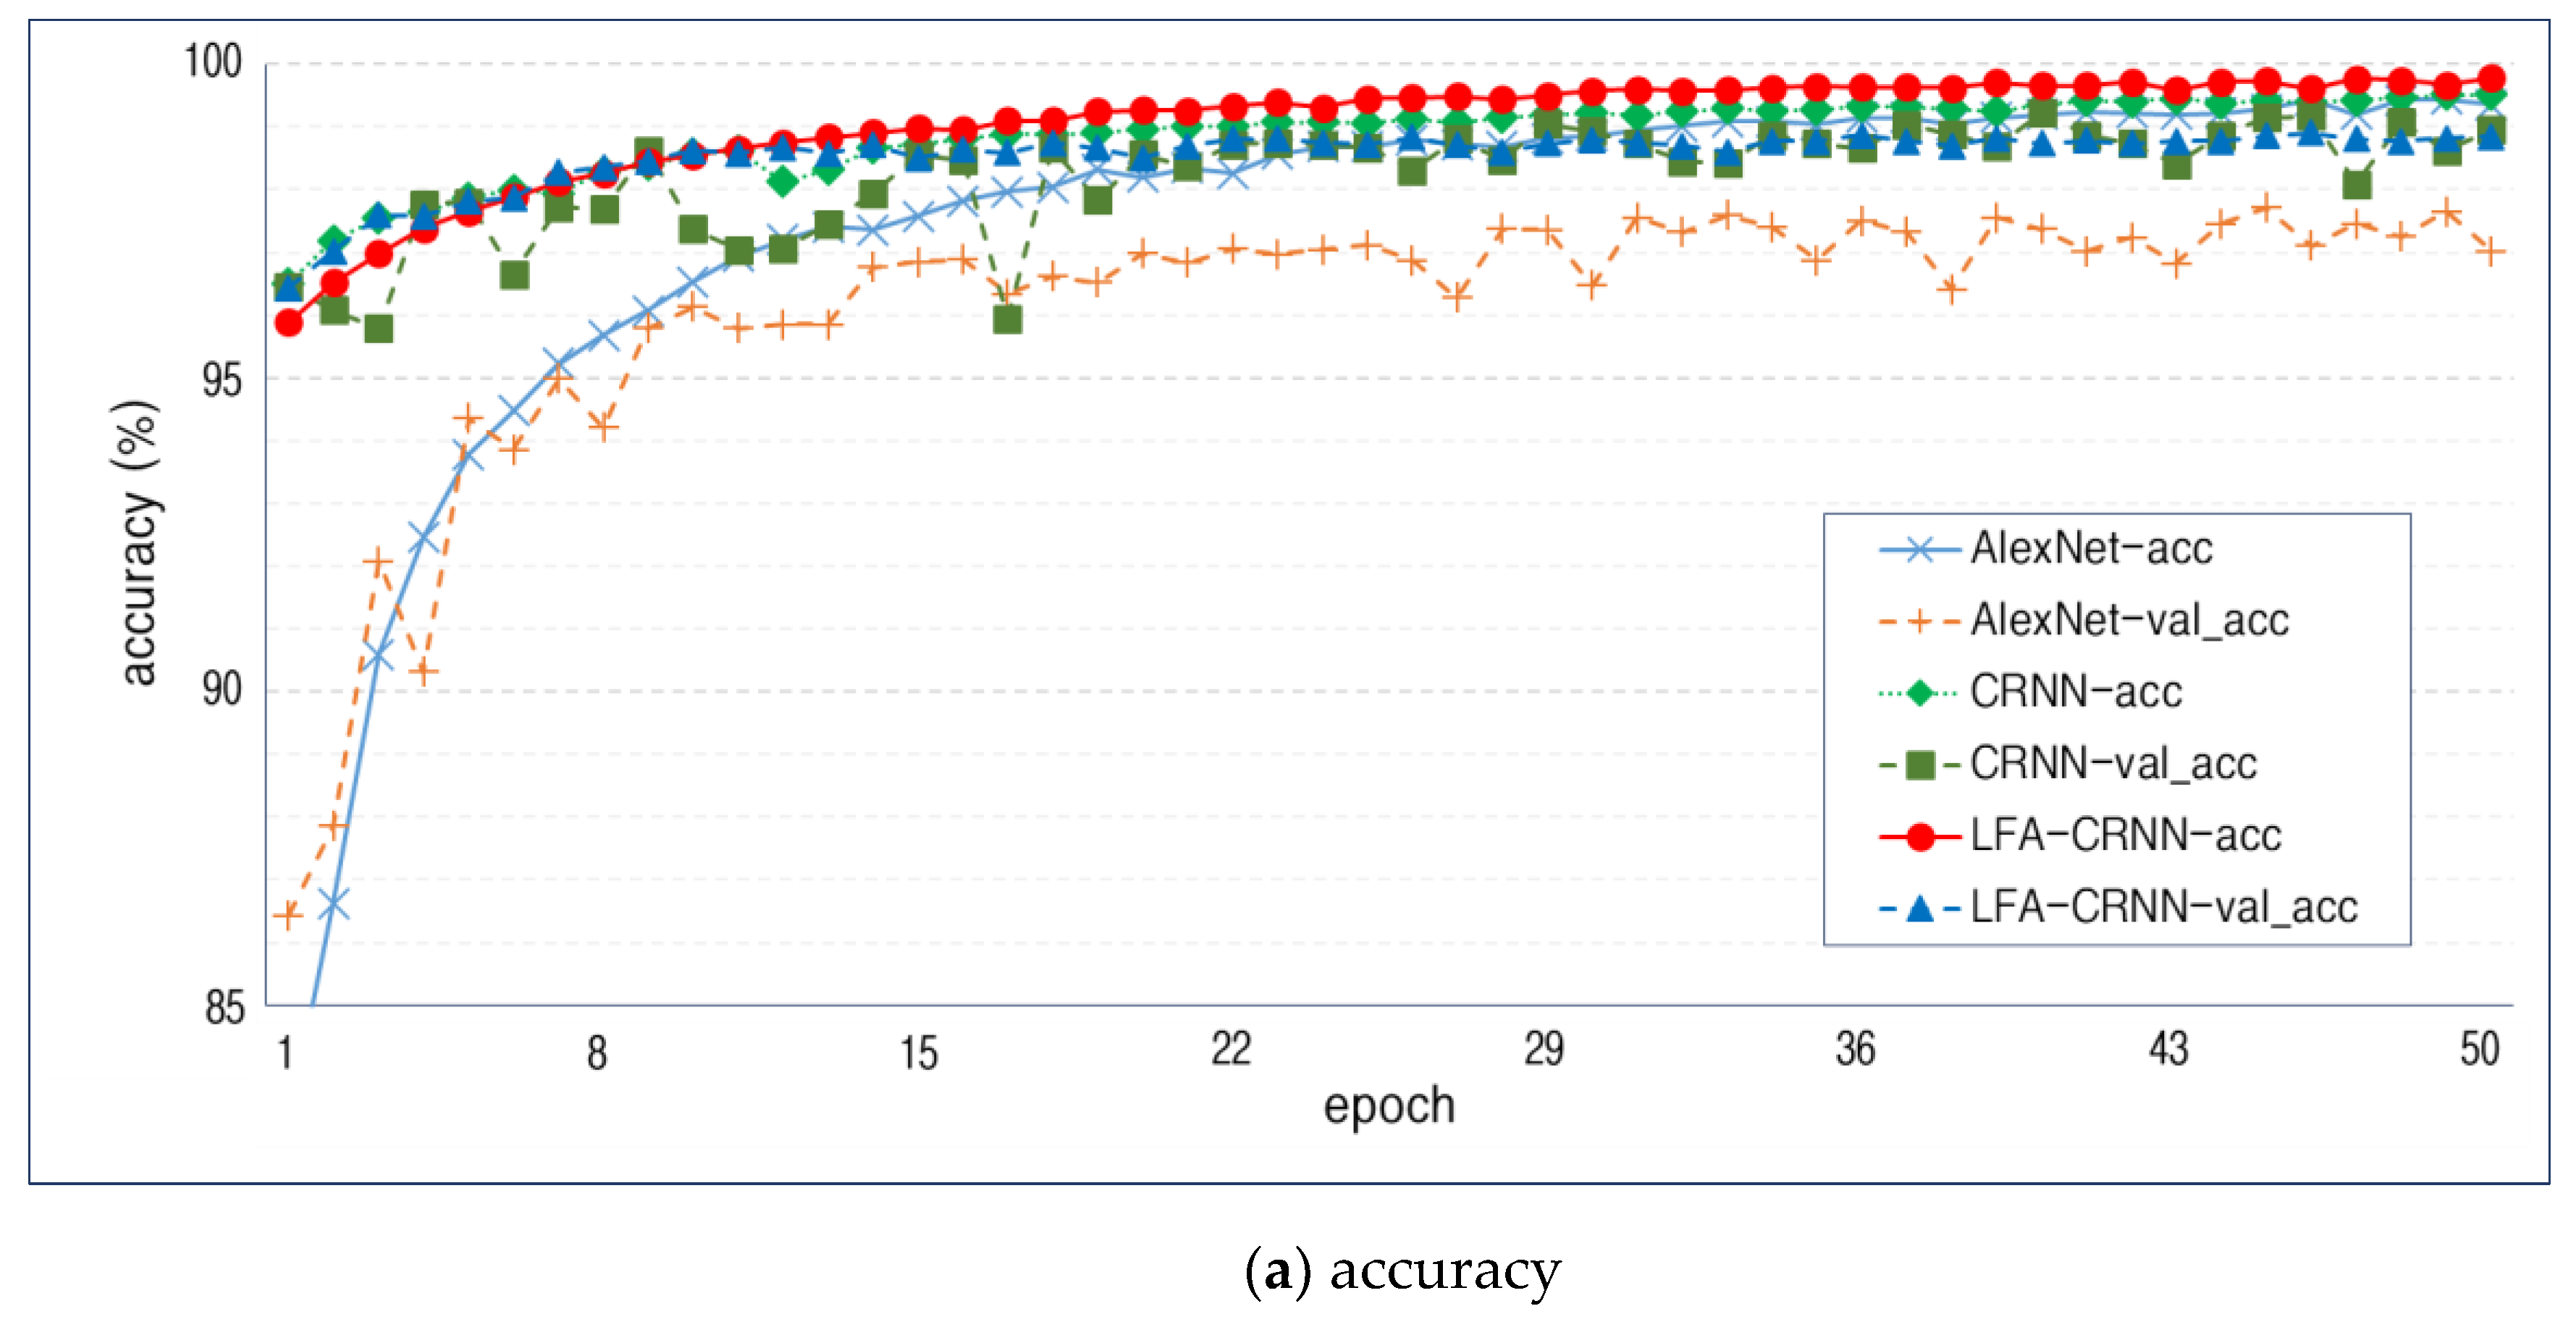
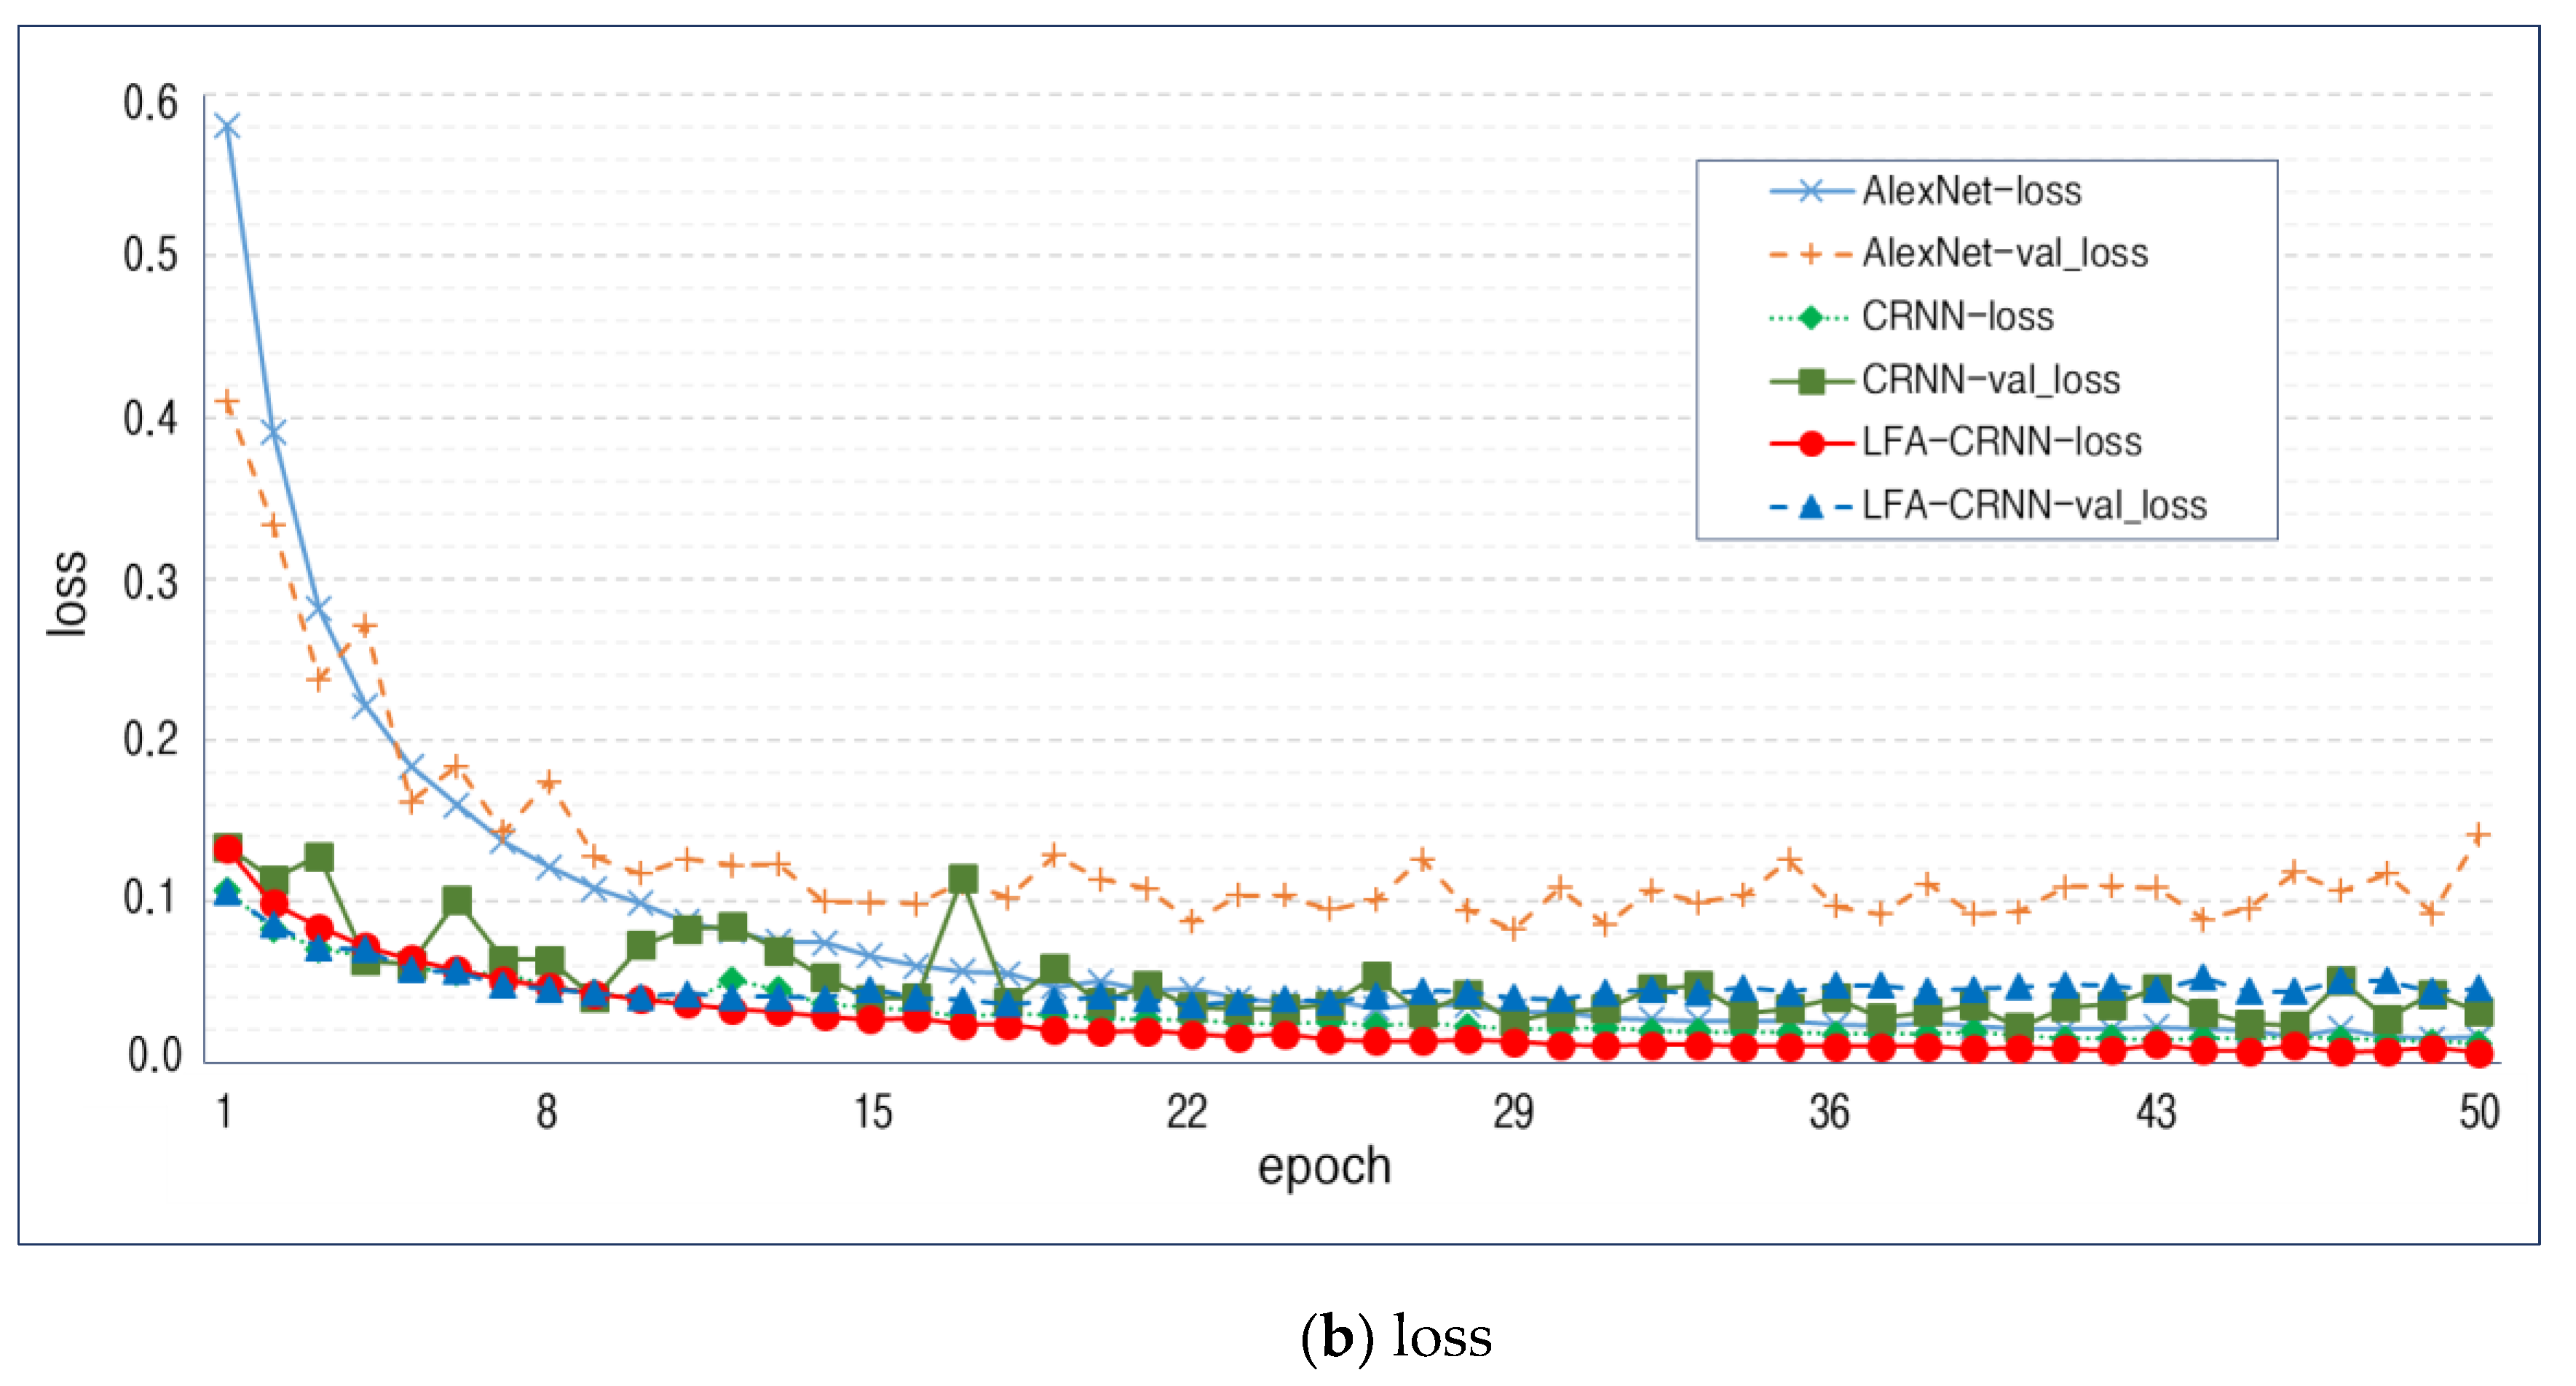
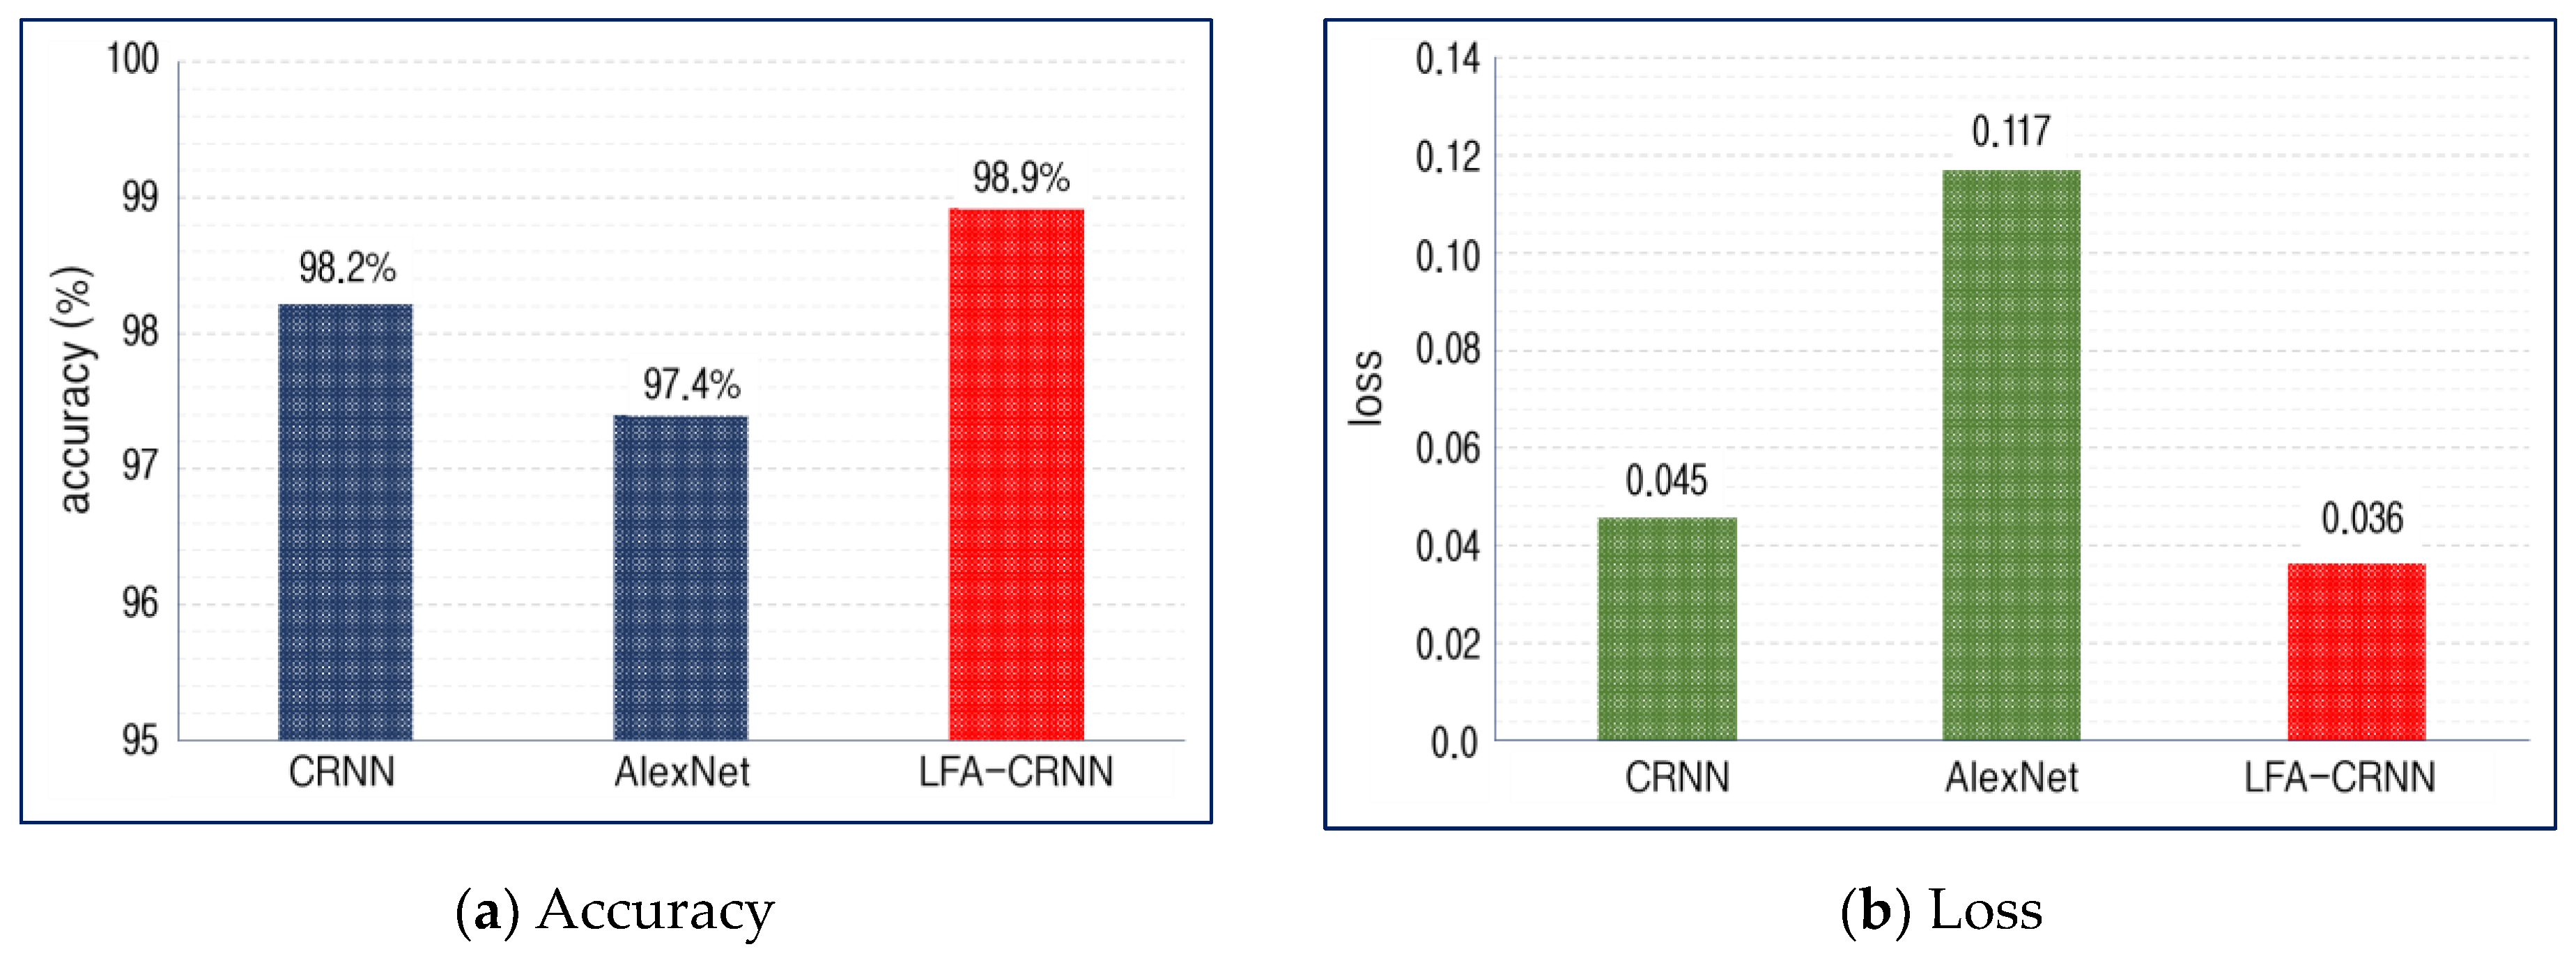
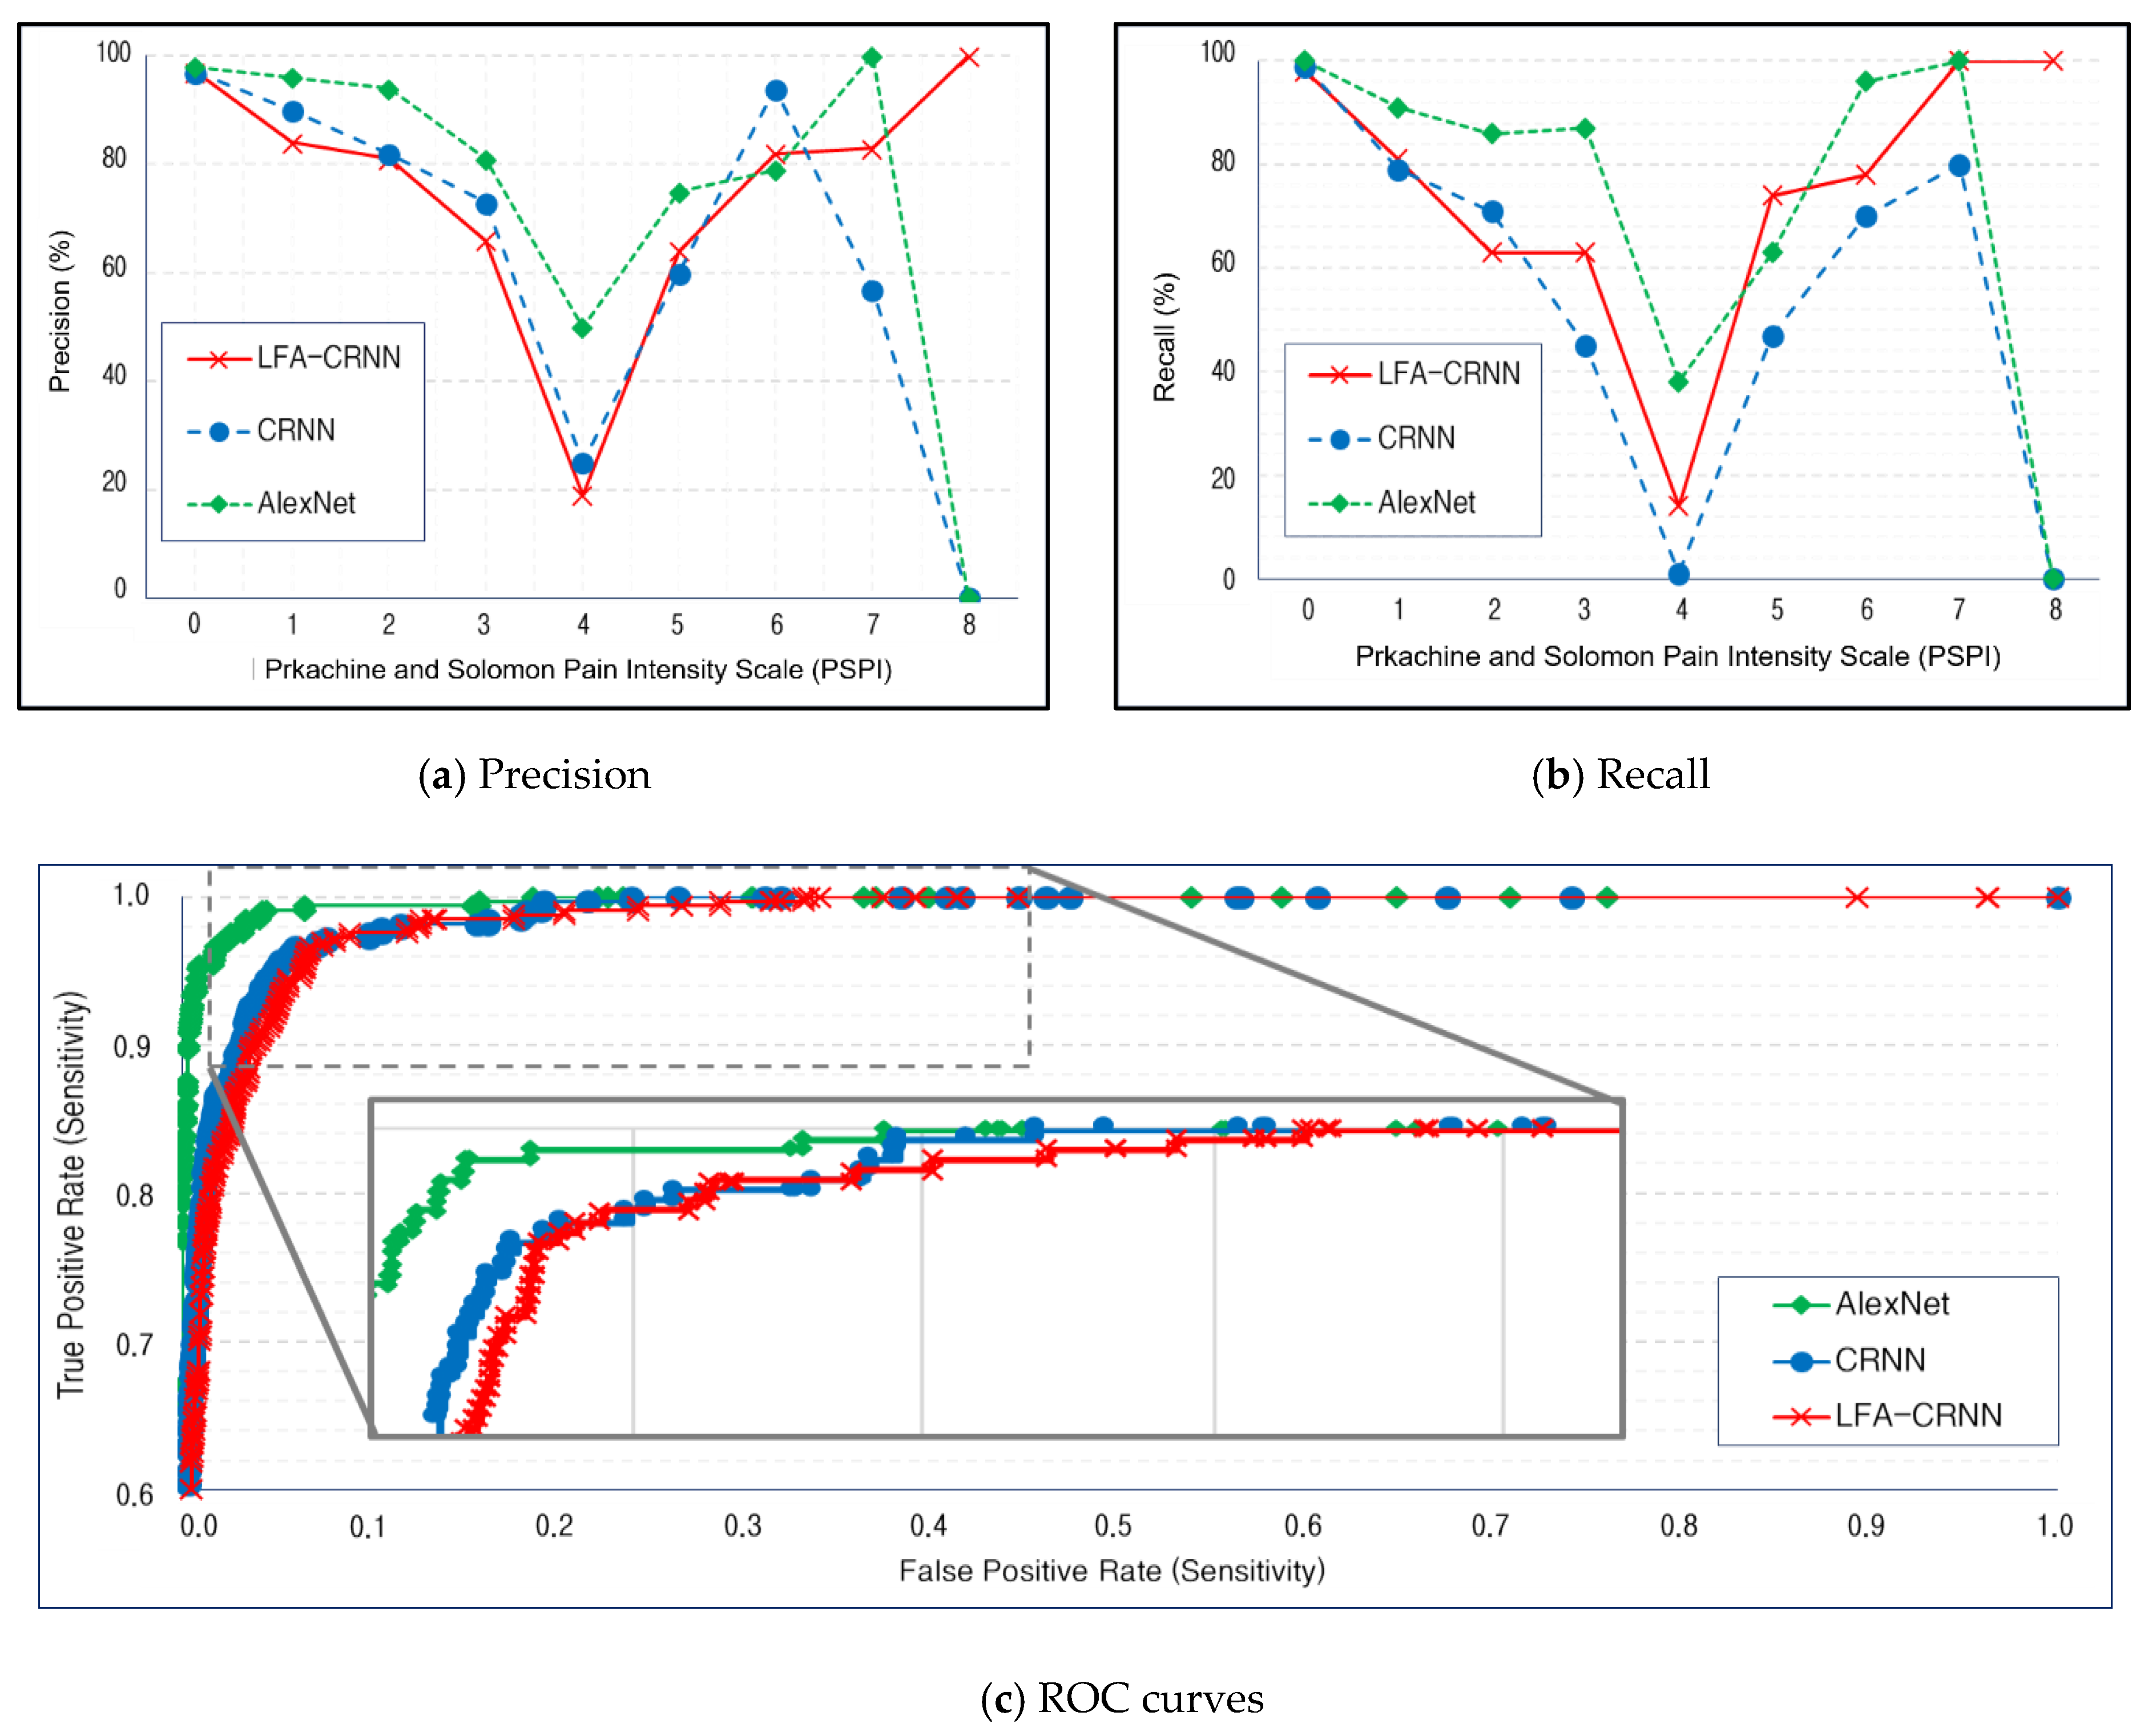
4. Simulation and Performance Evaluation
5. Conclusions
Author Contributions
Funding
Conflicts of Interest
References
- Yeem, M.J.; Song, H.J. The Effect of facial emotion Recognition of Real-face Expression and Emoticons on Interpersonal Competence: Mobile Application Based research for Middle School Students. J. Emot. Behav. Disord. 2019, 35, 265–284. [Google Scholar]
- Olderbak, S.G.; Wilhelm, O.; Hildebrandt, A.; Quoidbach, J. Sex differences in facial emotion perception ability across the lifespan. Cogn. Emot. 2018, 33, 579–588. [Google Scholar] [CrossRef]
- Poria, S.; Majumder, N.; Mihalcea, R.; Hovy, E.; Majumderd, N.; Mihalceae, R. Emotion Recognition in Conversation: Research Challenges, Datasets, and Recent Advances. IEEE Access 2019, 7, 100943–100953. [Google Scholar] [CrossRef]
- Kang, X.; Ren, F.; Wu, Y. Exploring Latent Semantic Information for Textual Emotion Recognition in Blog Articles IEEE/CAA. J. Autom. Sin. 2018, 5, 204–216. [Google Scholar]
- Guo, J.; Lei, Z.; Wan, J.; Avots, E.; Hajarolasvadi, N.; Knyazev, B.; Kuharenko, A.; Junior, J.C.S.J.; Baró, X.; Demirel, H.; et al. Dominant and Complementary Emotion Recognition from Still Images of Faces. IEEE Access 2018, 6, 26391–26403. [Google Scholar] [CrossRef]
- Perlovsky, L.; Schoeller, F. Unconscious emotions of human learning. Phys. Life Rev. 2019, 31, 257–262. [Google Scholar] [CrossRef]
- Chung, K.; Park, R.C. P2P-based open health cloud for medicine management. Peer-to-Peer Netw. Appl. 2019, 13, 610–622. [Google Scholar] [CrossRef]
- Kim, J.; Jang, H.; Kim, J.T.; Pan, H.-J.; Park, R.C. Big-Data Based Real-Time Interactive Growth Management System in Wireless Communications. Wirel. Pers. Commun. 2018, 105, 655–671. [Google Scholar] [CrossRef]
- Kim, J.-C.; Chung, K. Prediction Model of User Physical Activity using Data Characteristics-based Long Short-term Memory Recurrent Neural Networks. KSII Trans. Internet Inf. Syst. 2019, 13, 2060–2077. [Google Scholar] [CrossRef]
- Baek, J.-W.; Chung, K. Context Deep Neural Network Model for Predicting Depression Risk Using Multiple Regression. IEEE Access 2020, 8, 18171–18181. [Google Scholar] [CrossRef]
- Baek, J.-W.; Chung, K. Multimedia recommendation using Word2Vec-based social relationship mining. Multimed. Tools Appl. 2020, 1–17. [Google Scholar] [CrossRef]
- Kang, J.-S.; Shin, D.H.; Baek, J.-W.; Chung, K. Activity Recommendation Model Using Rank Correlation for Chronic Stress Management. Appl. Sci. 2019, 9, 4284. [Google Scholar] [CrossRef]
- Chung, K.; Kim, J. Activity-based nutrition management model for healthcare using similar group analysis. Technol. Health Care 2019, 27, 473–485. [Google Scholar] [CrossRef]
- Haz, H.; Ahuja, S. Latest trends in emotion recognition methods: Case study on emotiw challenge. Adv. Comput. Res. 2020, 10, 34–50. [Google Scholar] [CrossRef][Green Version]
- Song, X.; Chen, Y.; Feng, Z.-H.; Hu, G.; Zhang, T.; Wu, X.-J. Collaborative representation based face classification exploiting block weighted LBP and analysis dictionary learning. Pattern Recognit. 2019, 88, 127–138. [Google Scholar] [CrossRef]
- Nassih, B.; Amine, A.; Ngadi, M.; Hmina, N. DCT and HOG Feature Sets Combined with BPNN for Efficient Face Classification. Procedia Comput. Sci. 2019, 148, 116–125. [Google Scholar] [CrossRef]
- Lenc, L.; Kral, P. Automatic face recognition system based on the SIFT features. Comput. Electr. Eng. 2015, 46, 256–272. [Google Scholar] [CrossRef]
- Taigman, Y.; Yang, M.; Ranzato, M.; Wolf, L. DeepFace: Closing the Gap to Human-Level Performance in Face Verification. In Proceedings of the 2014 IEEE Conference on Computer Vision and Pattern Recognition, Columbus, OH, USA, 23–28 June 2014; Institute of Electrical and Electronics Engineers (IEEE): Piscataway, NJ, USA, 2014; pp. 1701–1708. [Google Scholar]
- Schroff, F.; Kalenichenko, D.; Philbin, J. FaceNet: A unified embedding for face recognition and clustering. In Proceedings of the 2015 IEEE Conference on Computer Vision and Pattern Recognition (CVPR), Boston, MA, USA, 7–12 June 2015; pp. 815–823. [Google Scholar]
- Luttrell, J.; Zhou, Z.; Zhang, C.; Gong, P.; Zhang, Y.; Iv, J.B.L. Facial Recognition via Transfer Learning: Fine-Tuning Keras_vggface. In Proceedings of the 2017 International Conference on Computational Science and Computational Intelligence (CSCI), Las Vegas, NV, USA, 14–16 December 2017; pp. 576–579. [Google Scholar]
- Sun, Y.; Wang, X.; Tang, X. Deep Learning Face Representation by Joint Identification-Verification. arXiv 2014, arXiv:1406.4773. [Google Scholar]
- Sun, Y.; Liang, D.; Wang, X.; Tang, X. DeepID3: Face Recognition with Very Deep Neural Networks. In Proceedings of the 2015 IEEE Conference on Computer Vision and Pattern Recognition (CVPR), Boston, MA, USA, 7–12 June 2015. [Google Scholar]
- Khan, R.U.; Zhang, X.; Kumar, R. Analysis of ResNet and GoogleNet models for malware detection. J. Comput. Virol. Hacking Tech. 2018, 15, 29–37. [Google Scholar] [CrossRef]
- Muhammad, G.; Alsulaiman, M.; Amin, S.U.; Ghoneim, A.; Alhamid, M.F. A Facial-Expression Monitoring System for Improved Healthcare in Smart Cities. IEEE Access 2017, 5, 10871–10881. [Google Scholar] [CrossRef]
- Lim, K.-T.; Won, C. Face Image Analysis using Adaboost Learning and Non-Square Differential LBP. J. Korea Multimed. Soc. 2016, 19, 1014–1023. [Google Scholar] [CrossRef][Green Version]
- Kang, H.; Lim, K.-T.; Won, C. Learning Directional LBP Features and Discriminative Feature Regions for Facial Expression Recognition. J. Korea Multimed. Soc. 2017, 20, 748–757. [Google Scholar] [CrossRef]
- Jabon, M.E.; Bailenson, J.N.; Pontikakis, E.; Takayama, L.; Nass, C. Facial expression analysis for predicting unsafe driving behavior. IEEE Pervasive Comput. 2010, 10, 84–95. [Google Scholar] [CrossRef]
- Agbolade, O.; Nazri, A.; Yaakob, R.; Ghani, A.A.; Cheah, Y.K. 3-Dimensional facial expression recognition in human using multi-points warping. BMC Bioinform. 2019, 20, 619. [Google Scholar] [CrossRef] [PubMed]
- Park, B.-H.; Oh, S.-Y.; Kim, I.-J. Face alignment using a deep neural network with local feature learning and recurrent regression. Expert Syst. Appl. 2017, 89, 66–80. [Google Scholar] [CrossRef]
- Wang, Y.; Li, Y.; Song, Y.; Rong, X. Facial Expression Recognition Based on Random Forest and Convolutional Neural Network. Informatics 2019, 10, 375. [Google Scholar] [CrossRef]
- Jeong, M.; Ko, B.C. Driver’s Facial Expression Recognition in Real-Time for Safe Driving. Sensors 2018, 18, 4270. [Google Scholar] [CrossRef]
- Ra, S.T.; Kim, H.J.; Lee, S.H. A Study on Deep Learning Structure of Multi-Block Method for Improving Face Recognition. Inst. Korean Electr. Electron. Eng. 2018, 22, 933–940. [Google Scholar]
- Facereader. Available online: https://www.noldus.com/facereader/ (accessed on 16 December 2019).
- Neighbor System of Korea. Available online: http://www.neighbor21.co.kr/ (accessed on 3 January 2020).
- Chung, K.; Shin, D.H.; Park, R.C. Detection of Emotion Using Multi-Block Deep Learning in a Self-Management Interview App. Appl. Sci. 2019, 9, 4830. [Google Scholar] [CrossRef]
- Yuan, Q.; Xiao, N. Scaling-Based Weight Normalization for Deep Neural Networks. IEEE Access 2019, 7, 7286–7295. [Google Scholar] [CrossRef]
- Pan, S.; Zhang, W.; Zhang, W.; Xu, L.; Fan, G.; Gong, J.; Zhang, B.; Gu, H. Diagnostic Model of Coronary Microvascular Disease Combined with Full Convolution Deep Network with Balanced Cross-Entropy Cost Function. IEEE Access 2019, 7, 177997–178006. [Google Scholar] [CrossRef]
- Zhang, S.; Wang, Y.; Liu, M.; Bao, Z. Data-Based Line Trip Fault Prediction in Power Systems Using LSTM Networks and SVM. IEEE Access 2017, 6, 7675–7686. [Google Scholar] [CrossRef]
- Hu, Y.; Jin, Z.; Wang, Y. State Fusion Estimation for Networked Stochastic Hybrid Systems with Asynchronous Sensors and Multiple Packet Dropouts. IEEE Access 2018, 6, 10402–10409. [Google Scholar] [CrossRef]
- Liu, L.; Luo, Y.; Shen, X.; Sun, M.; Li, B. β-Dropout: A Unified Dropout. IEEE Access 2019, 7, 36140–36153. [Google Scholar] [CrossRef]
- Peng, D.; Liu, Z.; Wang, H.; Qin, Y.; Jia, L. A Novel Deeper One-Dimensional CNN with Residual Learning for Fault Diagnosis of Wheelset Bearings in High-Speed Trains. IEEE Access 2019, 7, 10278–10293. [Google Scholar] [CrossRef]
- Shi, B.; Bai, X.; Yao, C. An End-to-End Trainable Neural Network for Image-Based Sequence Recognition and Its Application to Scene Text Recognition. IEEE Trans. Pattern Anal. Mach. Intell. 2017, 39, 2298–2304. [Google Scholar] [CrossRef]
- Han, X.; Zhong, Y.; Cao, L.; Zhang, L. Pre-Trained AlexNet Architecture with Pyramid Pooling and Supervision for High Spatial Resolution Remote Sensing Image Scene Classification. Remote. Sens. 2017, 9, 848. [Google Scholar] [CrossRef]
- Lucey, P.; Cohn, J.F.; Prkachin, K.M.; Solomon, P.E.; Matthews, I. Painful data: The UNBC-McMaster shoulder pain expression archive database. Face Gesture 2011, 57–64. [Google Scholar] [CrossRef]
- Fawcett, T. An introduction to ROC analysis. Pattern Recognit. Lett. 2006, 27, 861–874. [Google Scholar] [CrossRef]


| Scanned Area | Summing Data | Line Type | Scanned Area | Summing Data | Line Type |
|---|---|---|---|---|---|
| 0000 | 0 | Non-Active | 1000 | 8 | Point |
| 0001 | 1 | Point | 1001 | 9 | Vertical |
| 0010 | 2 | Point | 1010 | 10 | Diagonal |
| 0011 | 3 | Horizontal | 1011 | 11 | Curve |
| 0100 | 4 | Point | 1100 | 12 | Horizontal |
| 0101 | 5 | Diagonal | 1101 | 13 | Curve |
| 0110 | 6 | Vertical | 1110 | 14 | Curve |
| 0111 | 7 | Curve | 1111 | 15 | Active (Side) |
© 2020 by the authors. Licensee MDPI, Basel, Switzerland. This article is an open access article distributed under the terms and conditions of the Creative Commons Attribution (CC BY) license (http://creativecommons.org/licenses/by/4.0/).
Share and Cite
Kim, C.-M.; Hong, E.J.; Chung, K.; Park, R.C. Driver Facial Expression Analysis Using LFA-CRNN-Based Feature Extraction for Health-Risk Decisions. Appl. Sci. 2020, 10, 2956. https://doi.org/10.3390/app10082956
Kim C-M, Hong EJ, Chung K, Park RC. Driver Facial Expression Analysis Using LFA-CRNN-Based Feature Extraction for Health-Risk Decisions. Applied Sciences. 2020; 10(8):2956. https://doi.org/10.3390/app10082956
Chicago/Turabian StyleKim, Chang-Min, Ellen J. Hong, Kyungyong Chung, and Roy C. Park. 2020. "Driver Facial Expression Analysis Using LFA-CRNN-Based Feature Extraction for Health-Risk Decisions" Applied Sciences 10, no. 8: 2956. https://doi.org/10.3390/app10082956
APA StyleKim, C.-M., Hong, E. J., Chung, K., & Park, R. C. (2020). Driver Facial Expression Analysis Using LFA-CRNN-Based Feature Extraction for Health-Risk Decisions. Applied Sciences, 10(8), 2956. https://doi.org/10.3390/app10082956