Mass Transport Optimization for Redox Flow Battery Design

 ,
,  ,
, 
 ,
,
Abstract
:Featured Application
Abstract
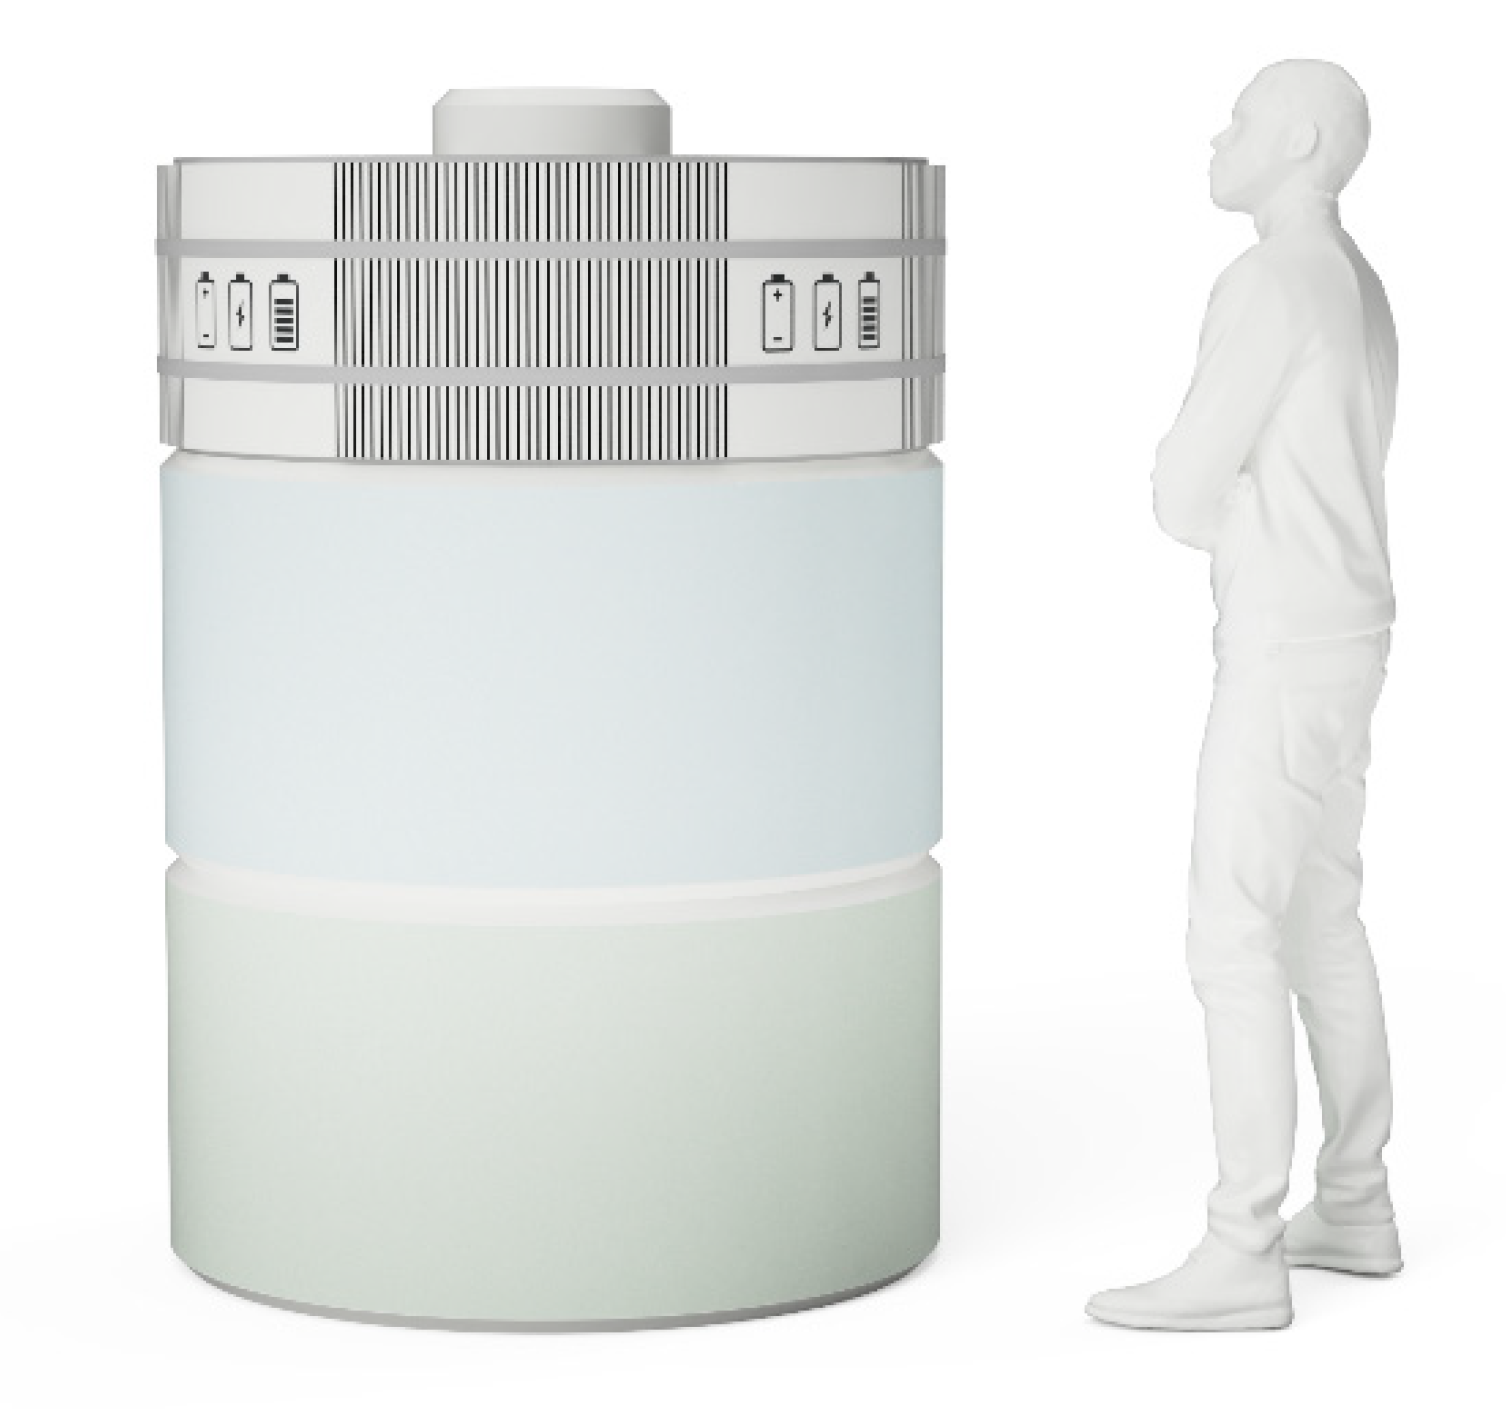
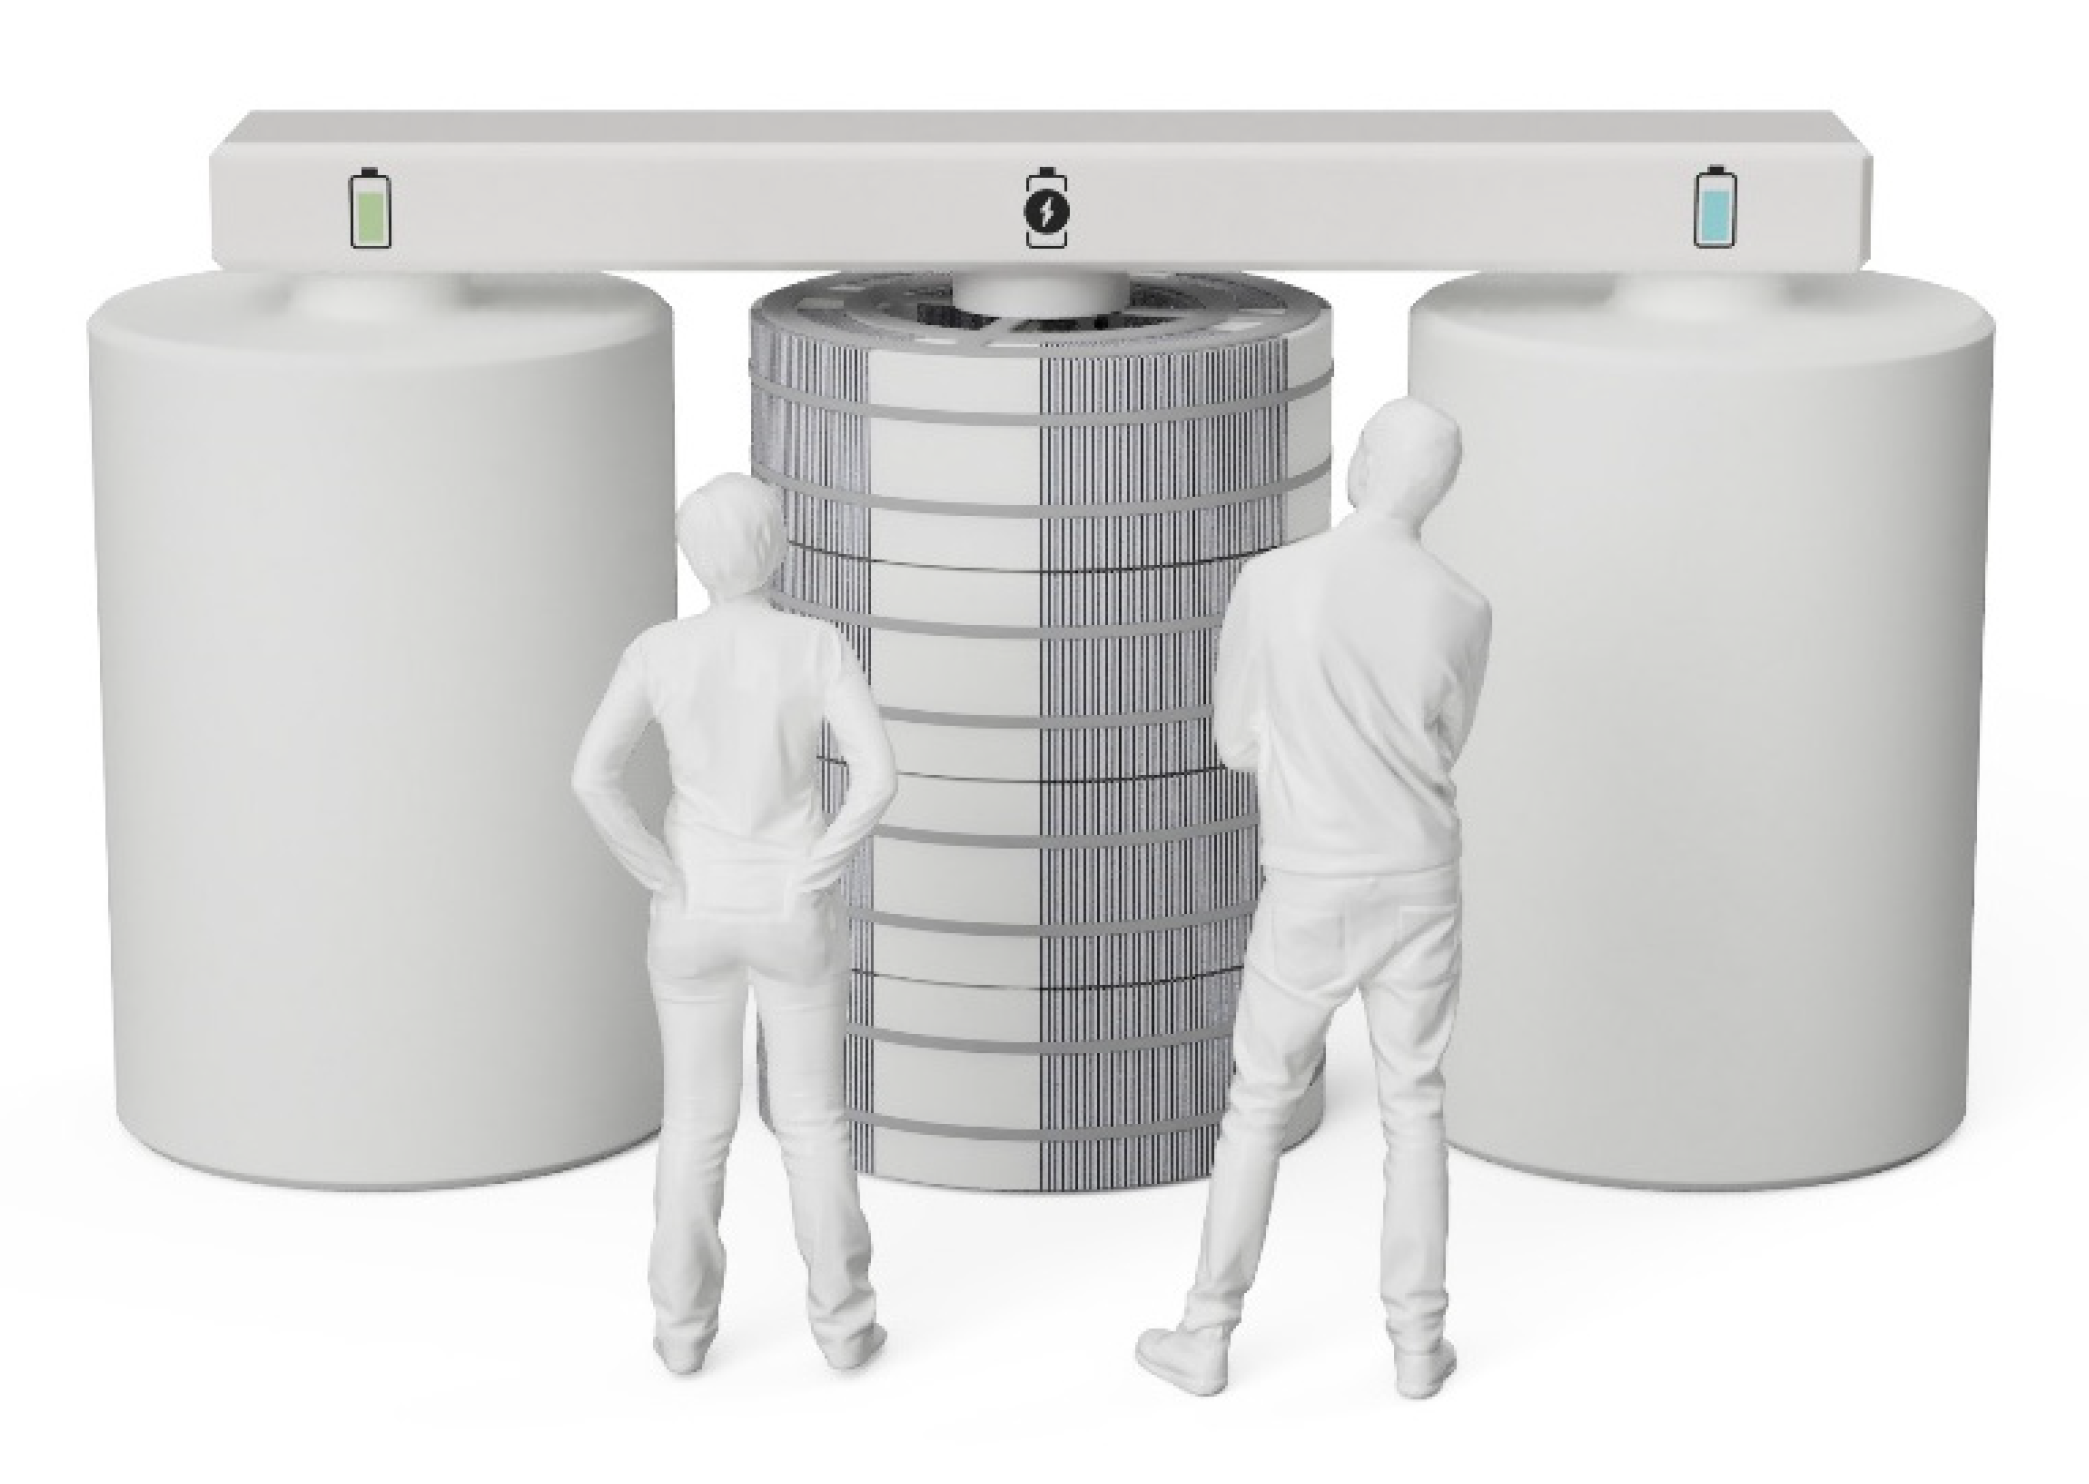
1. Introduction
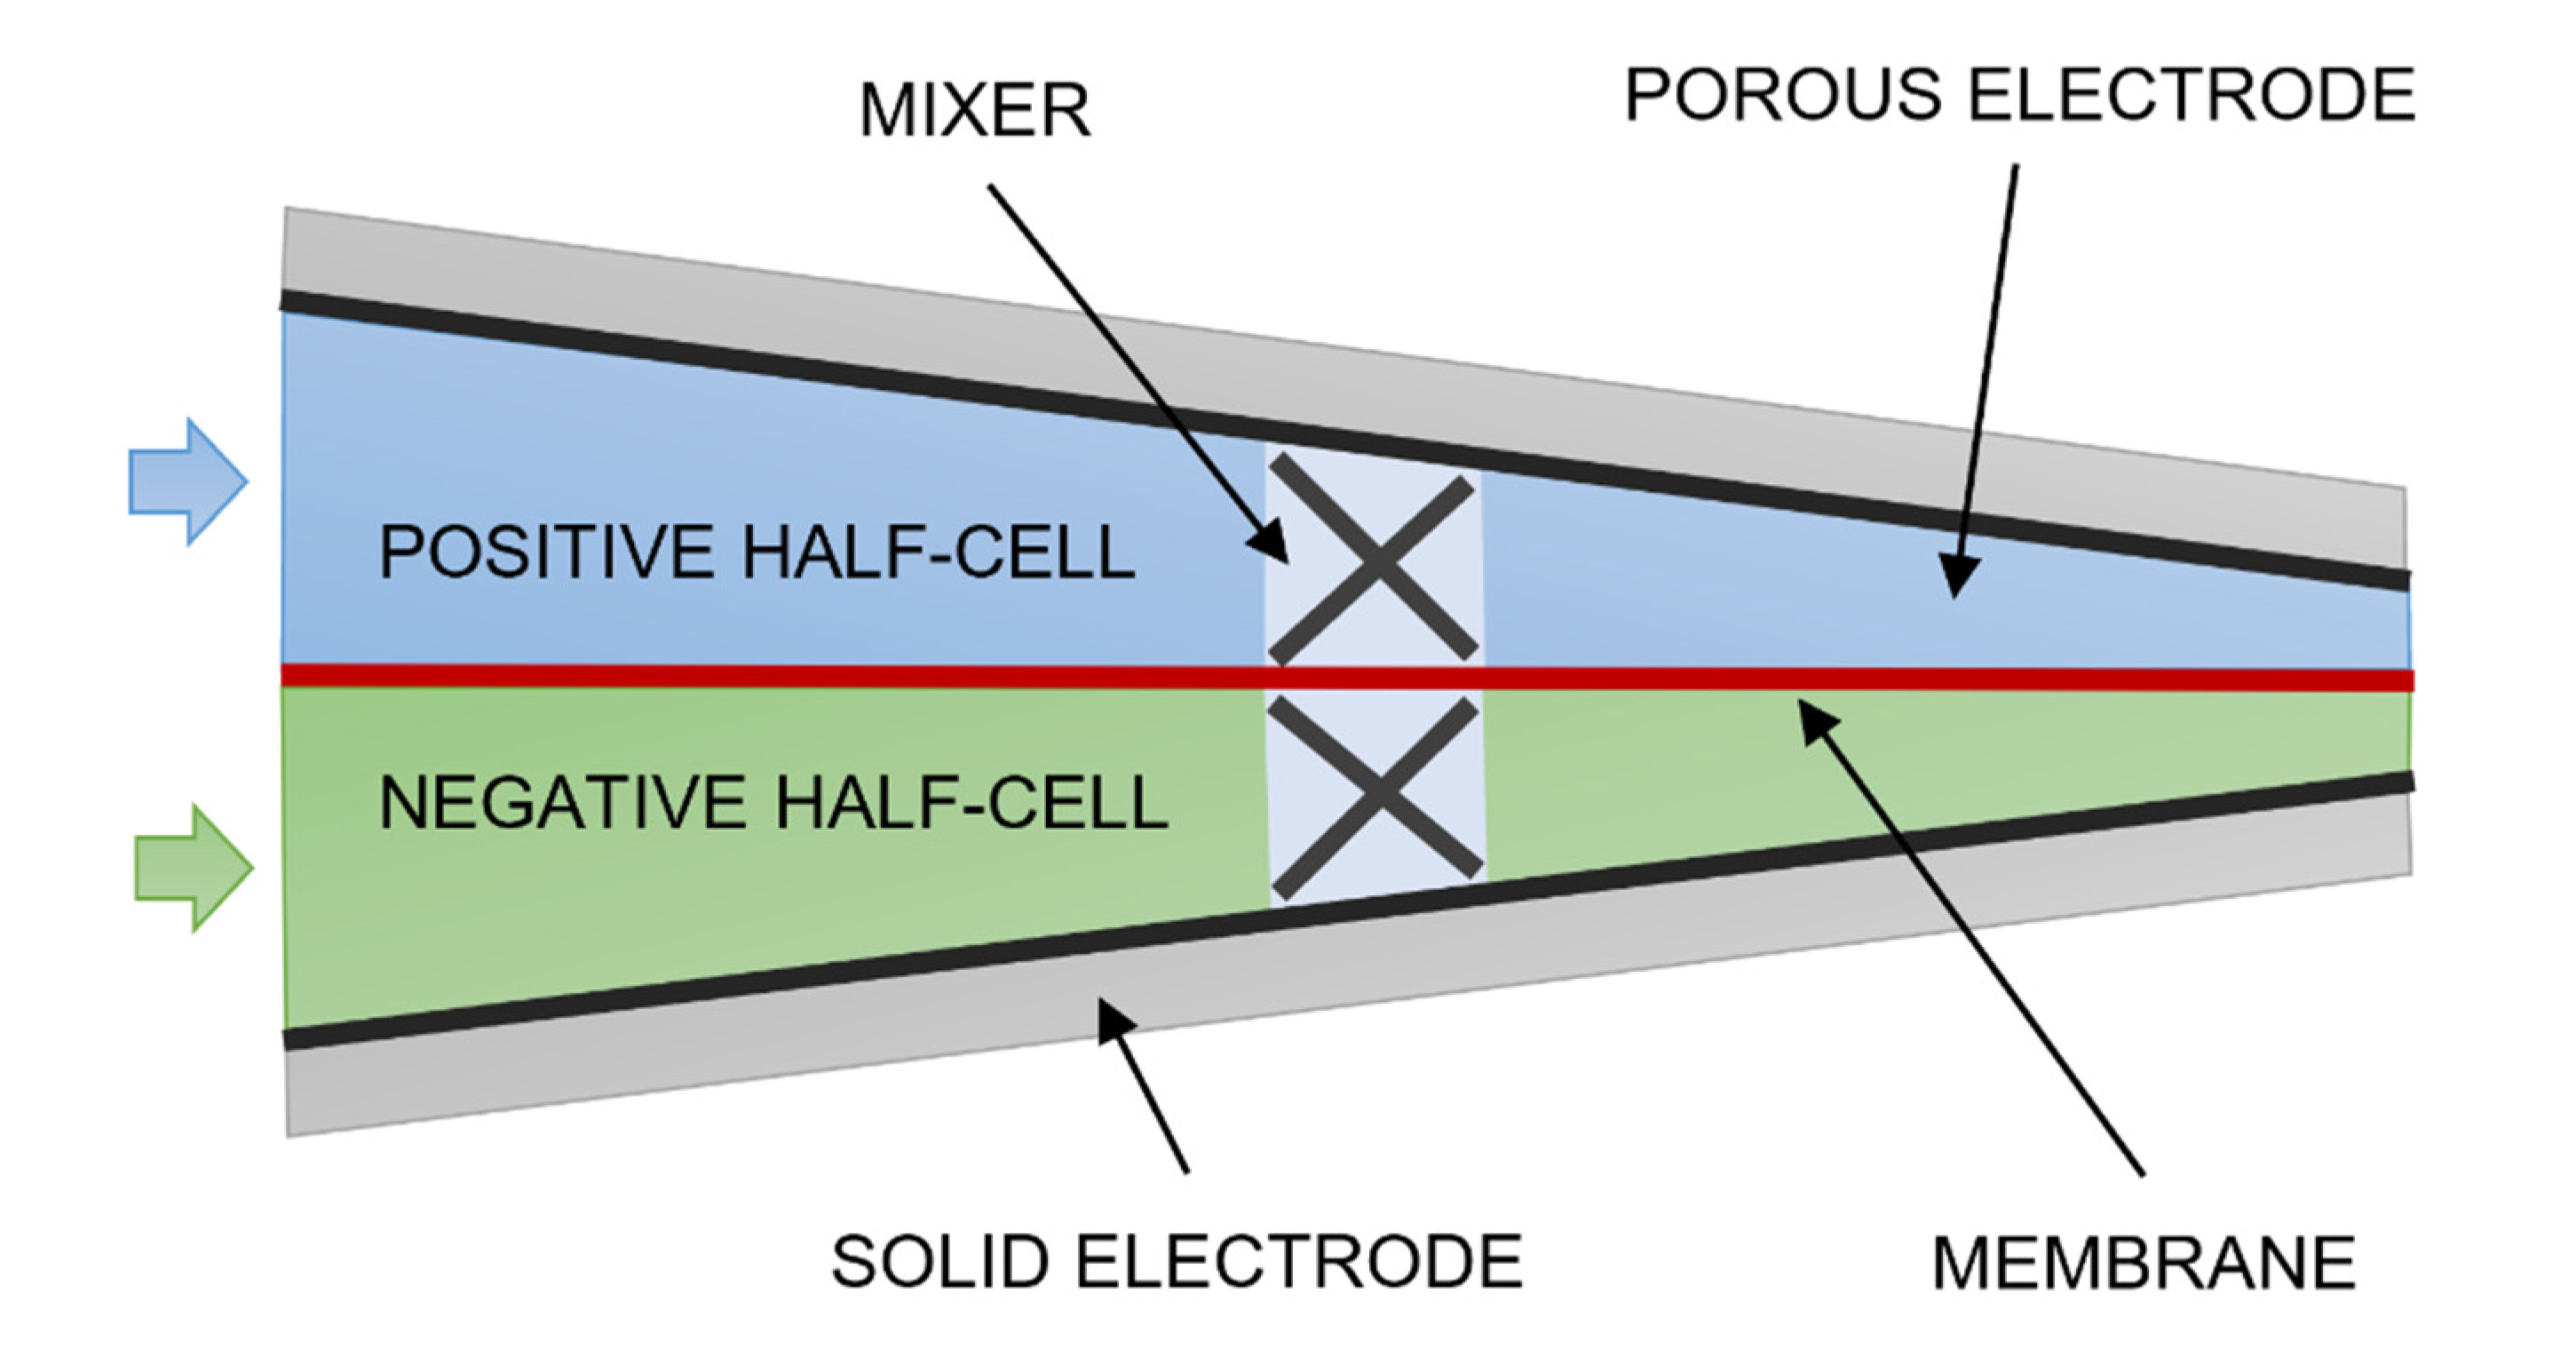
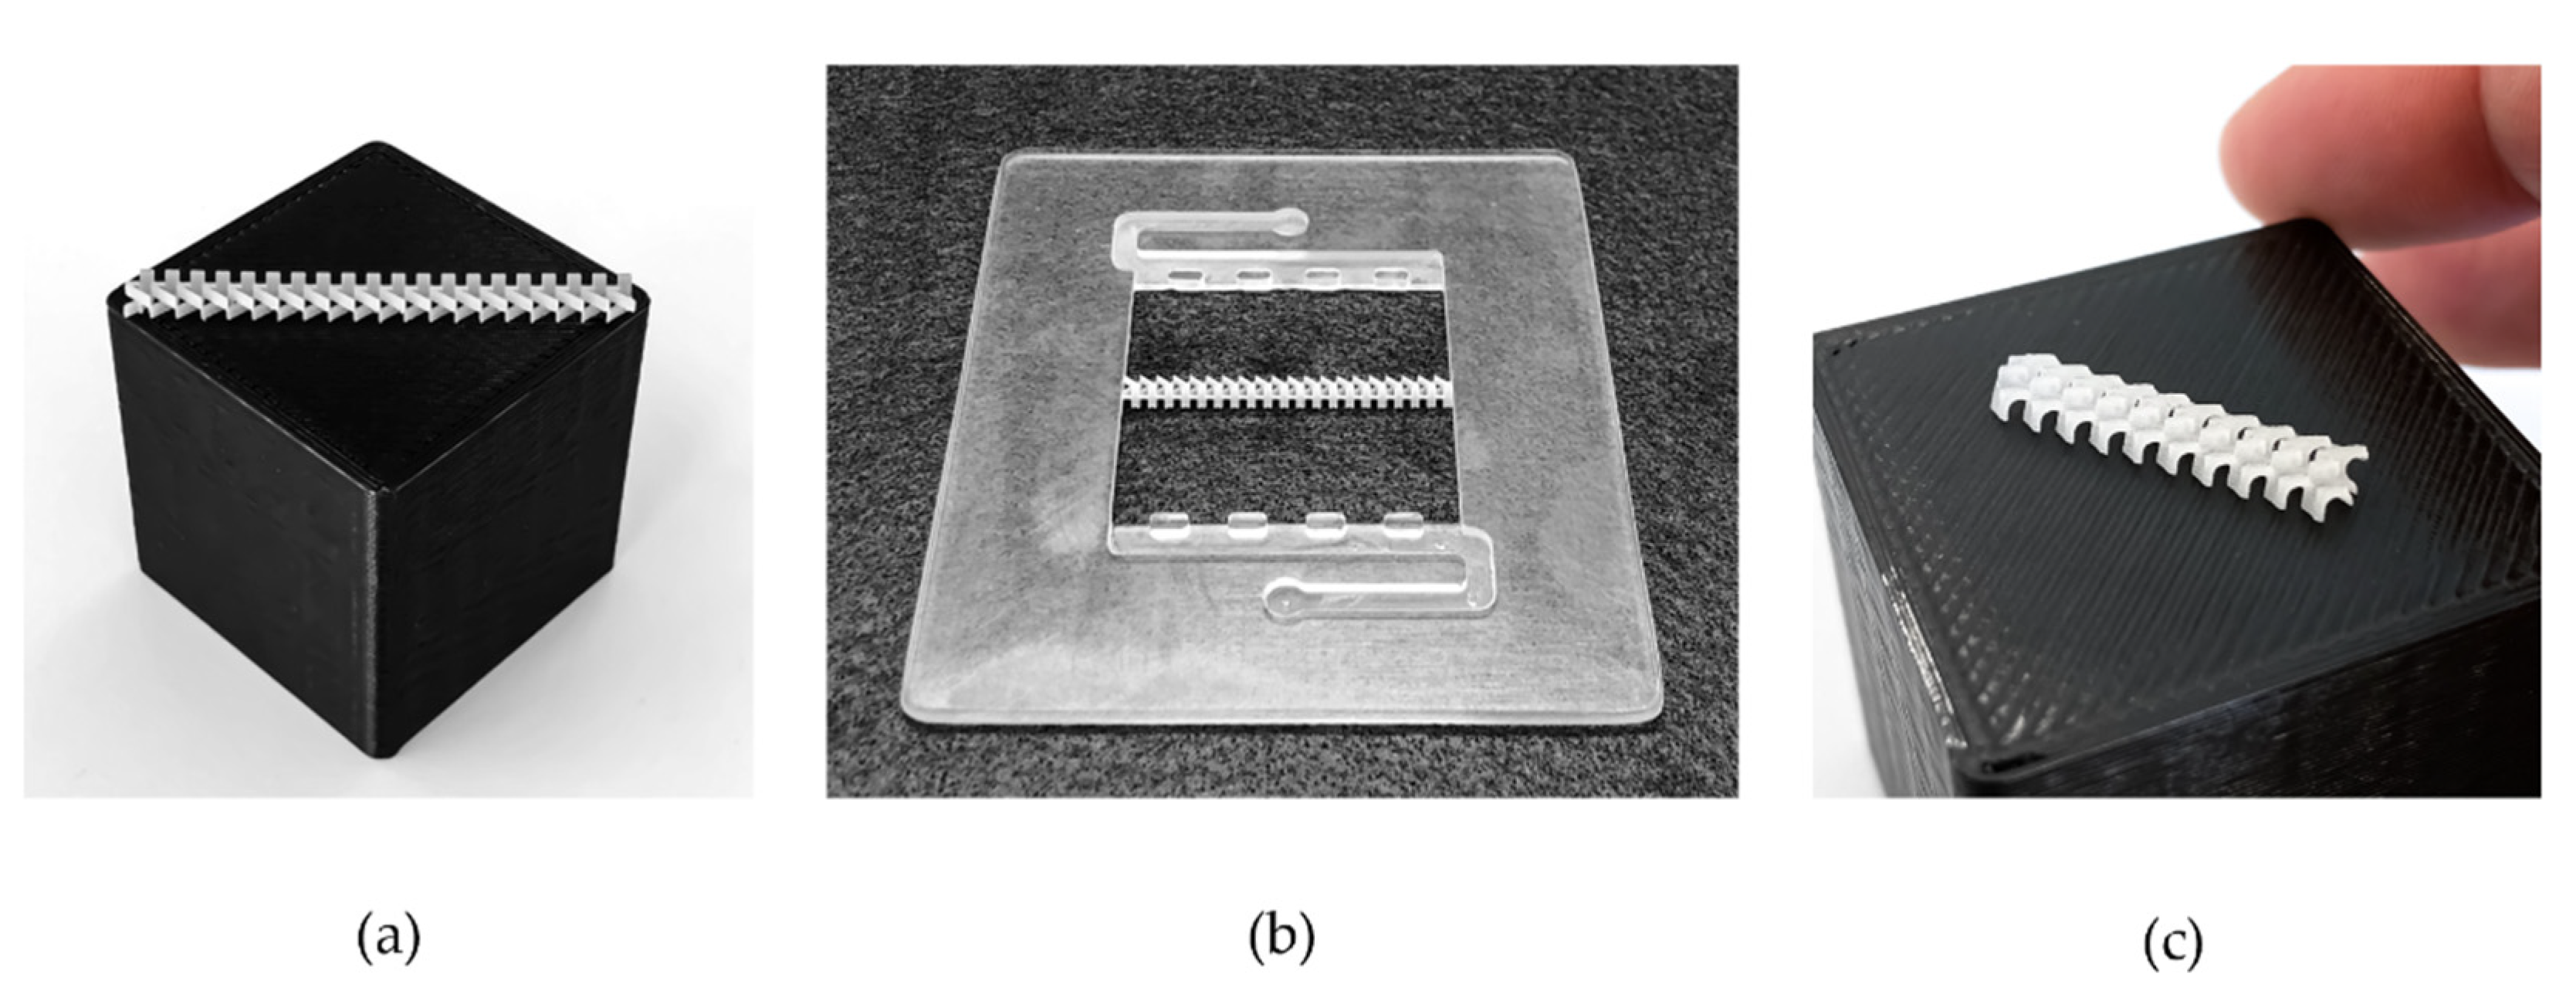
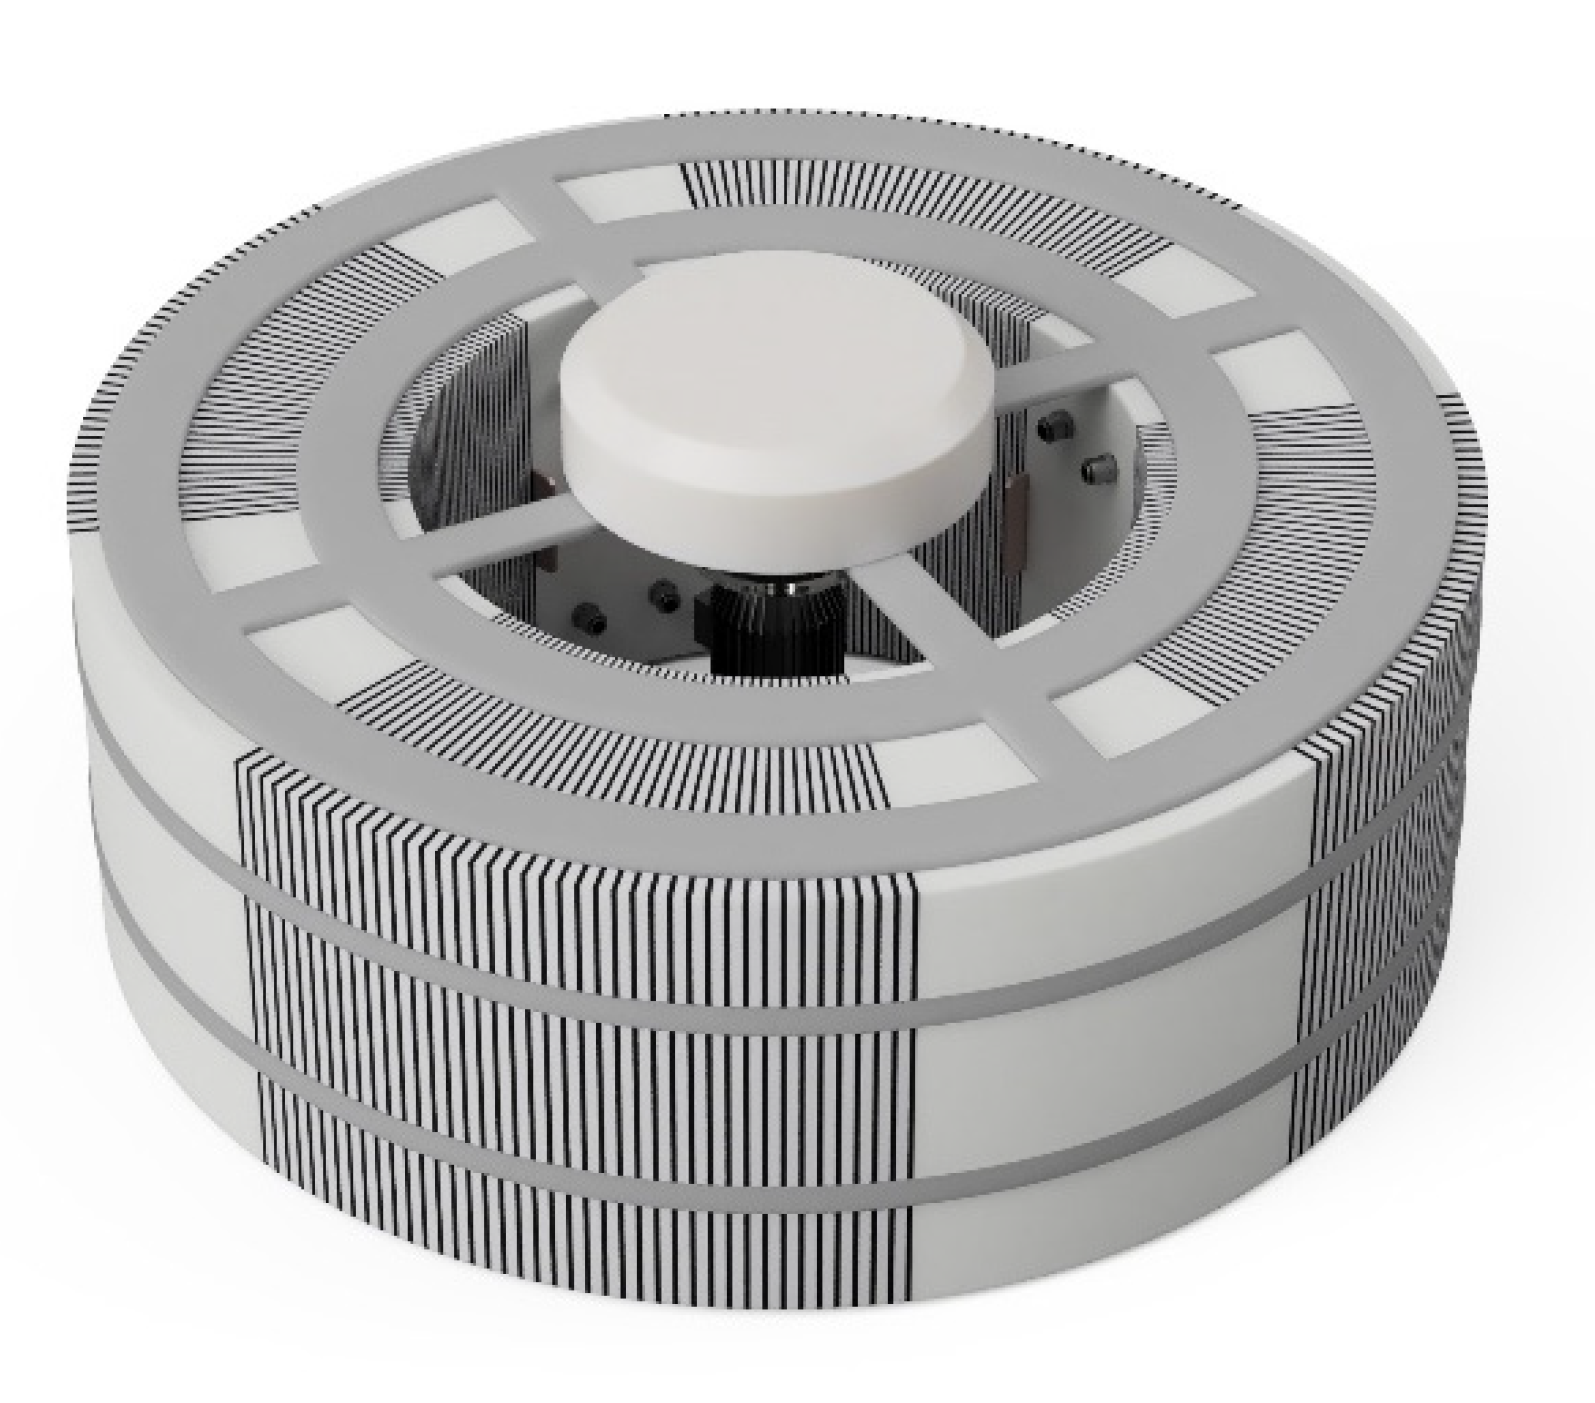
2. Materials and Methods
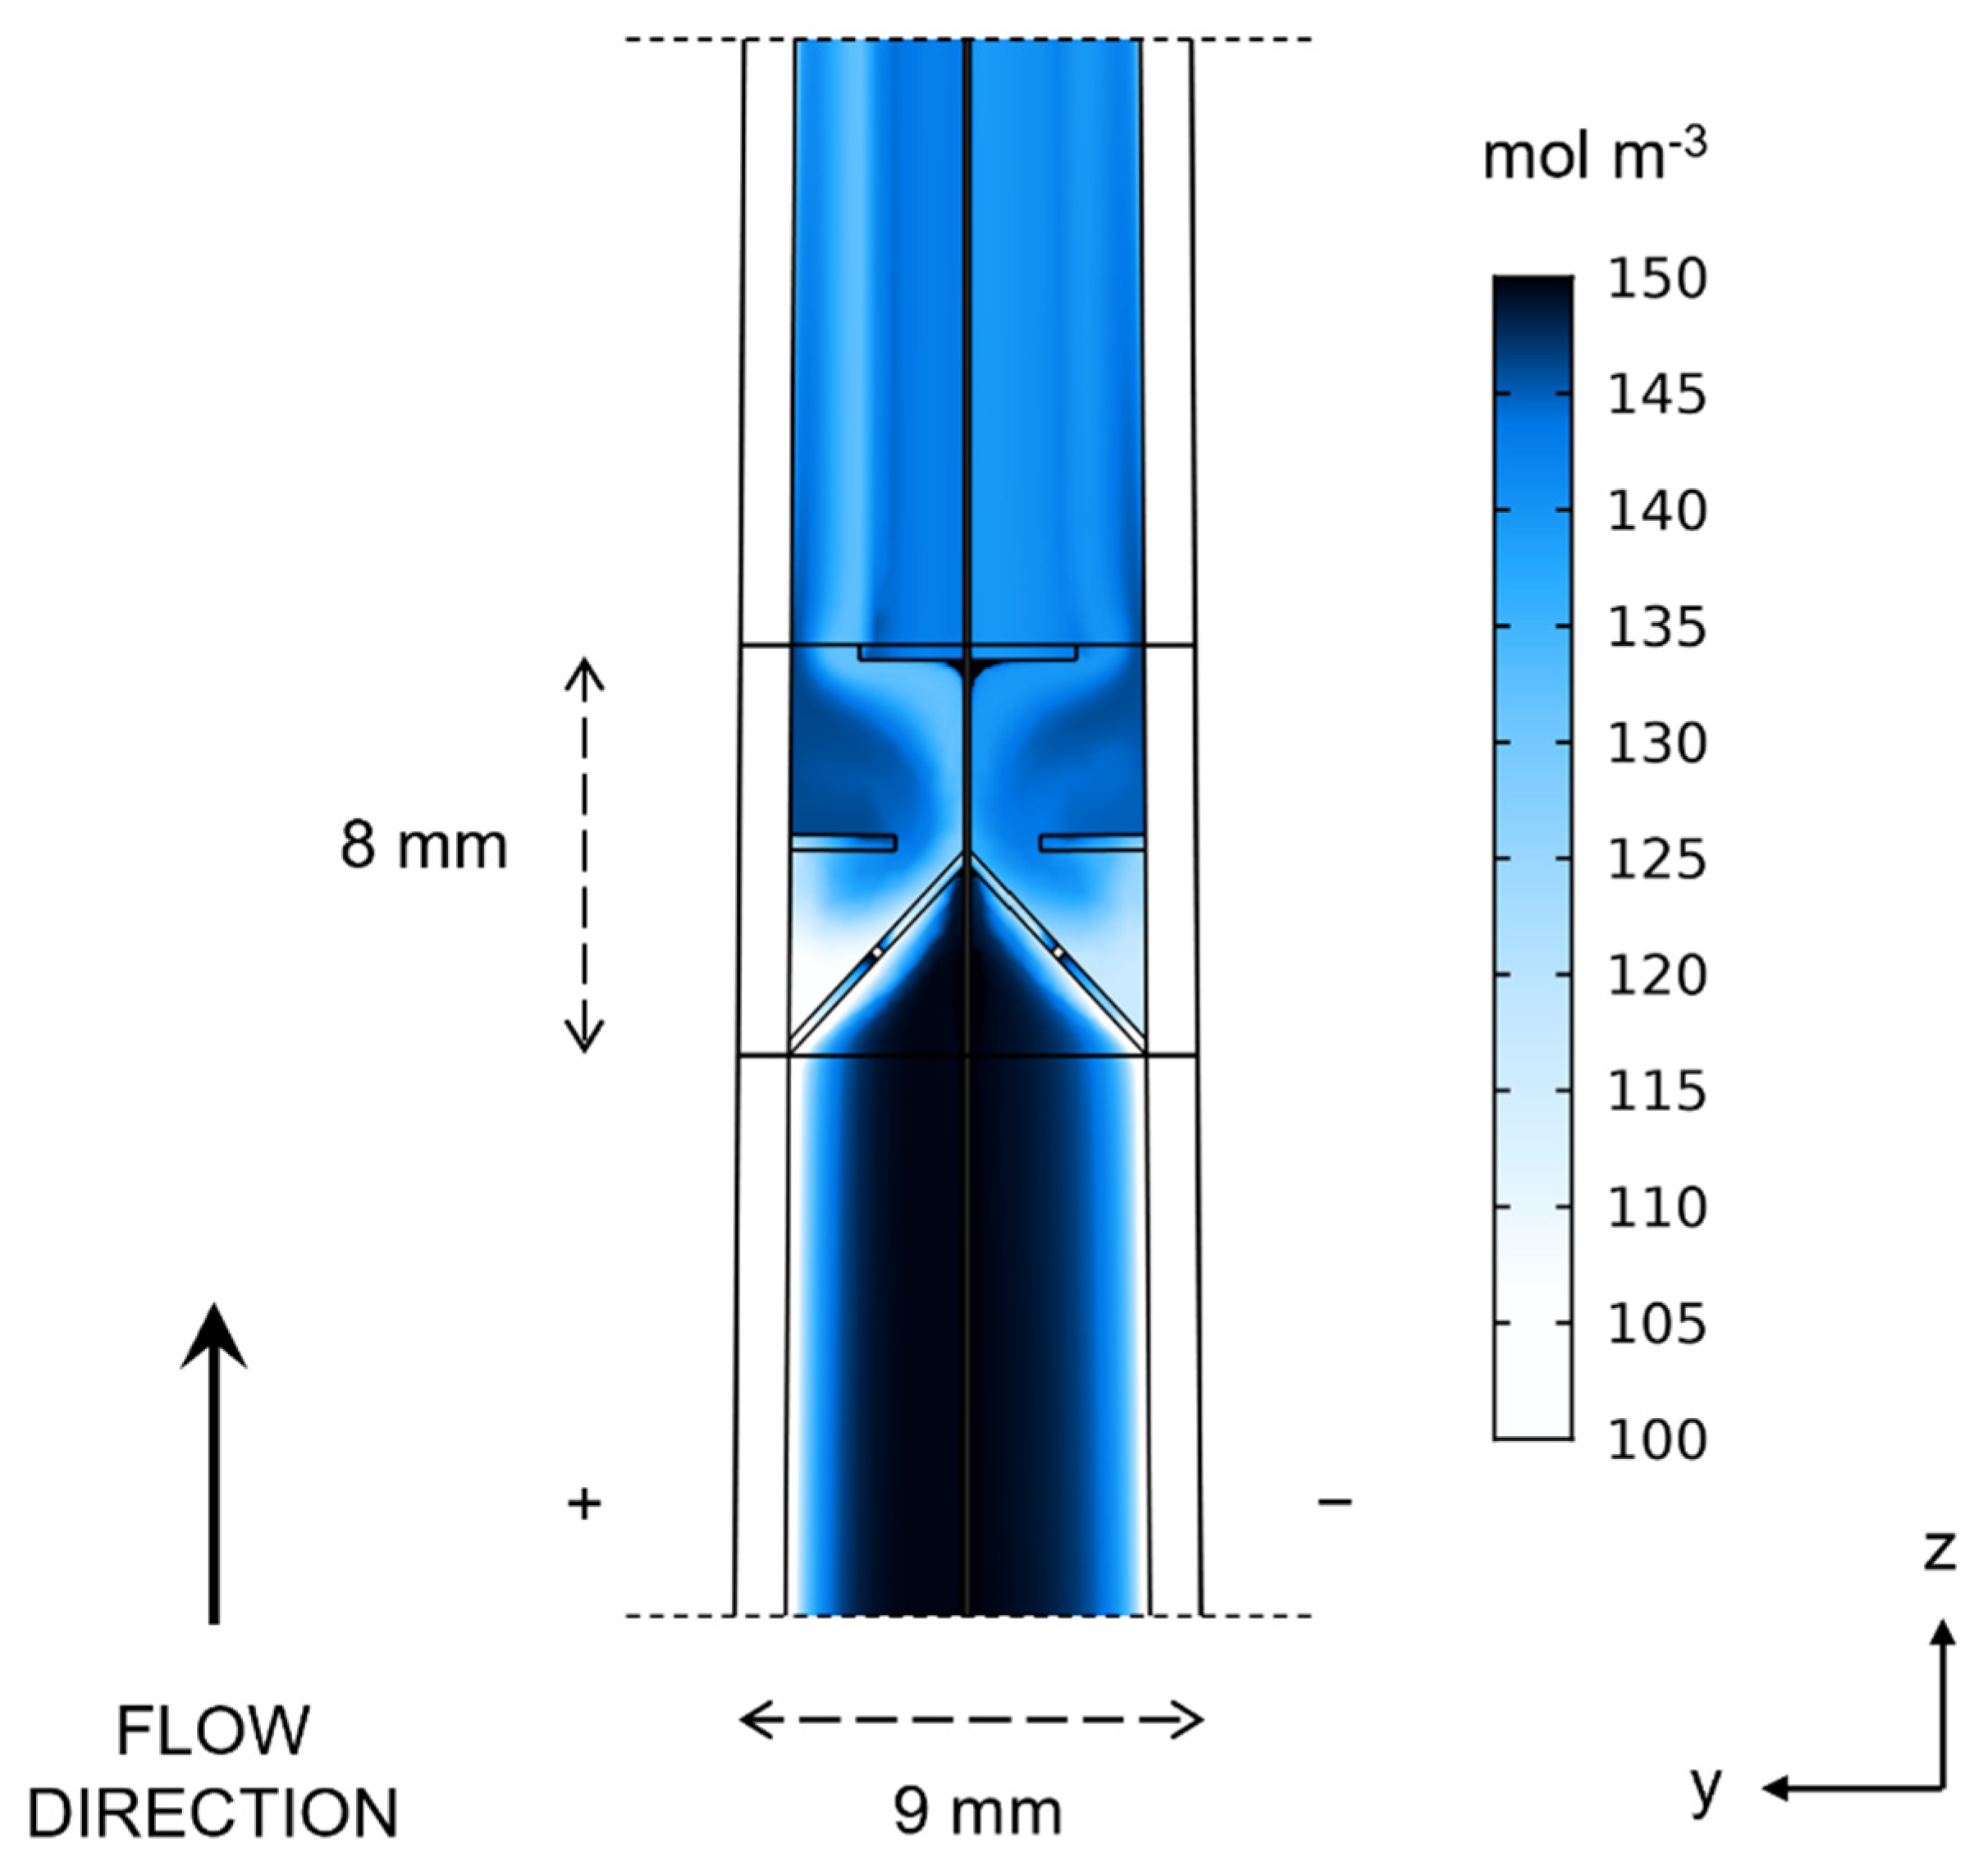
- Case 1—conventional rectangular reference geometry uniformly compressed at 15% (3.4 mm thick), the average of the 0% to 30% compression used in the wedge geometries.
- Case 2—wedge-shaped geometry with 0% compression (4 mm) at the inlet and 30% compression at the outlet (2.8 mm).
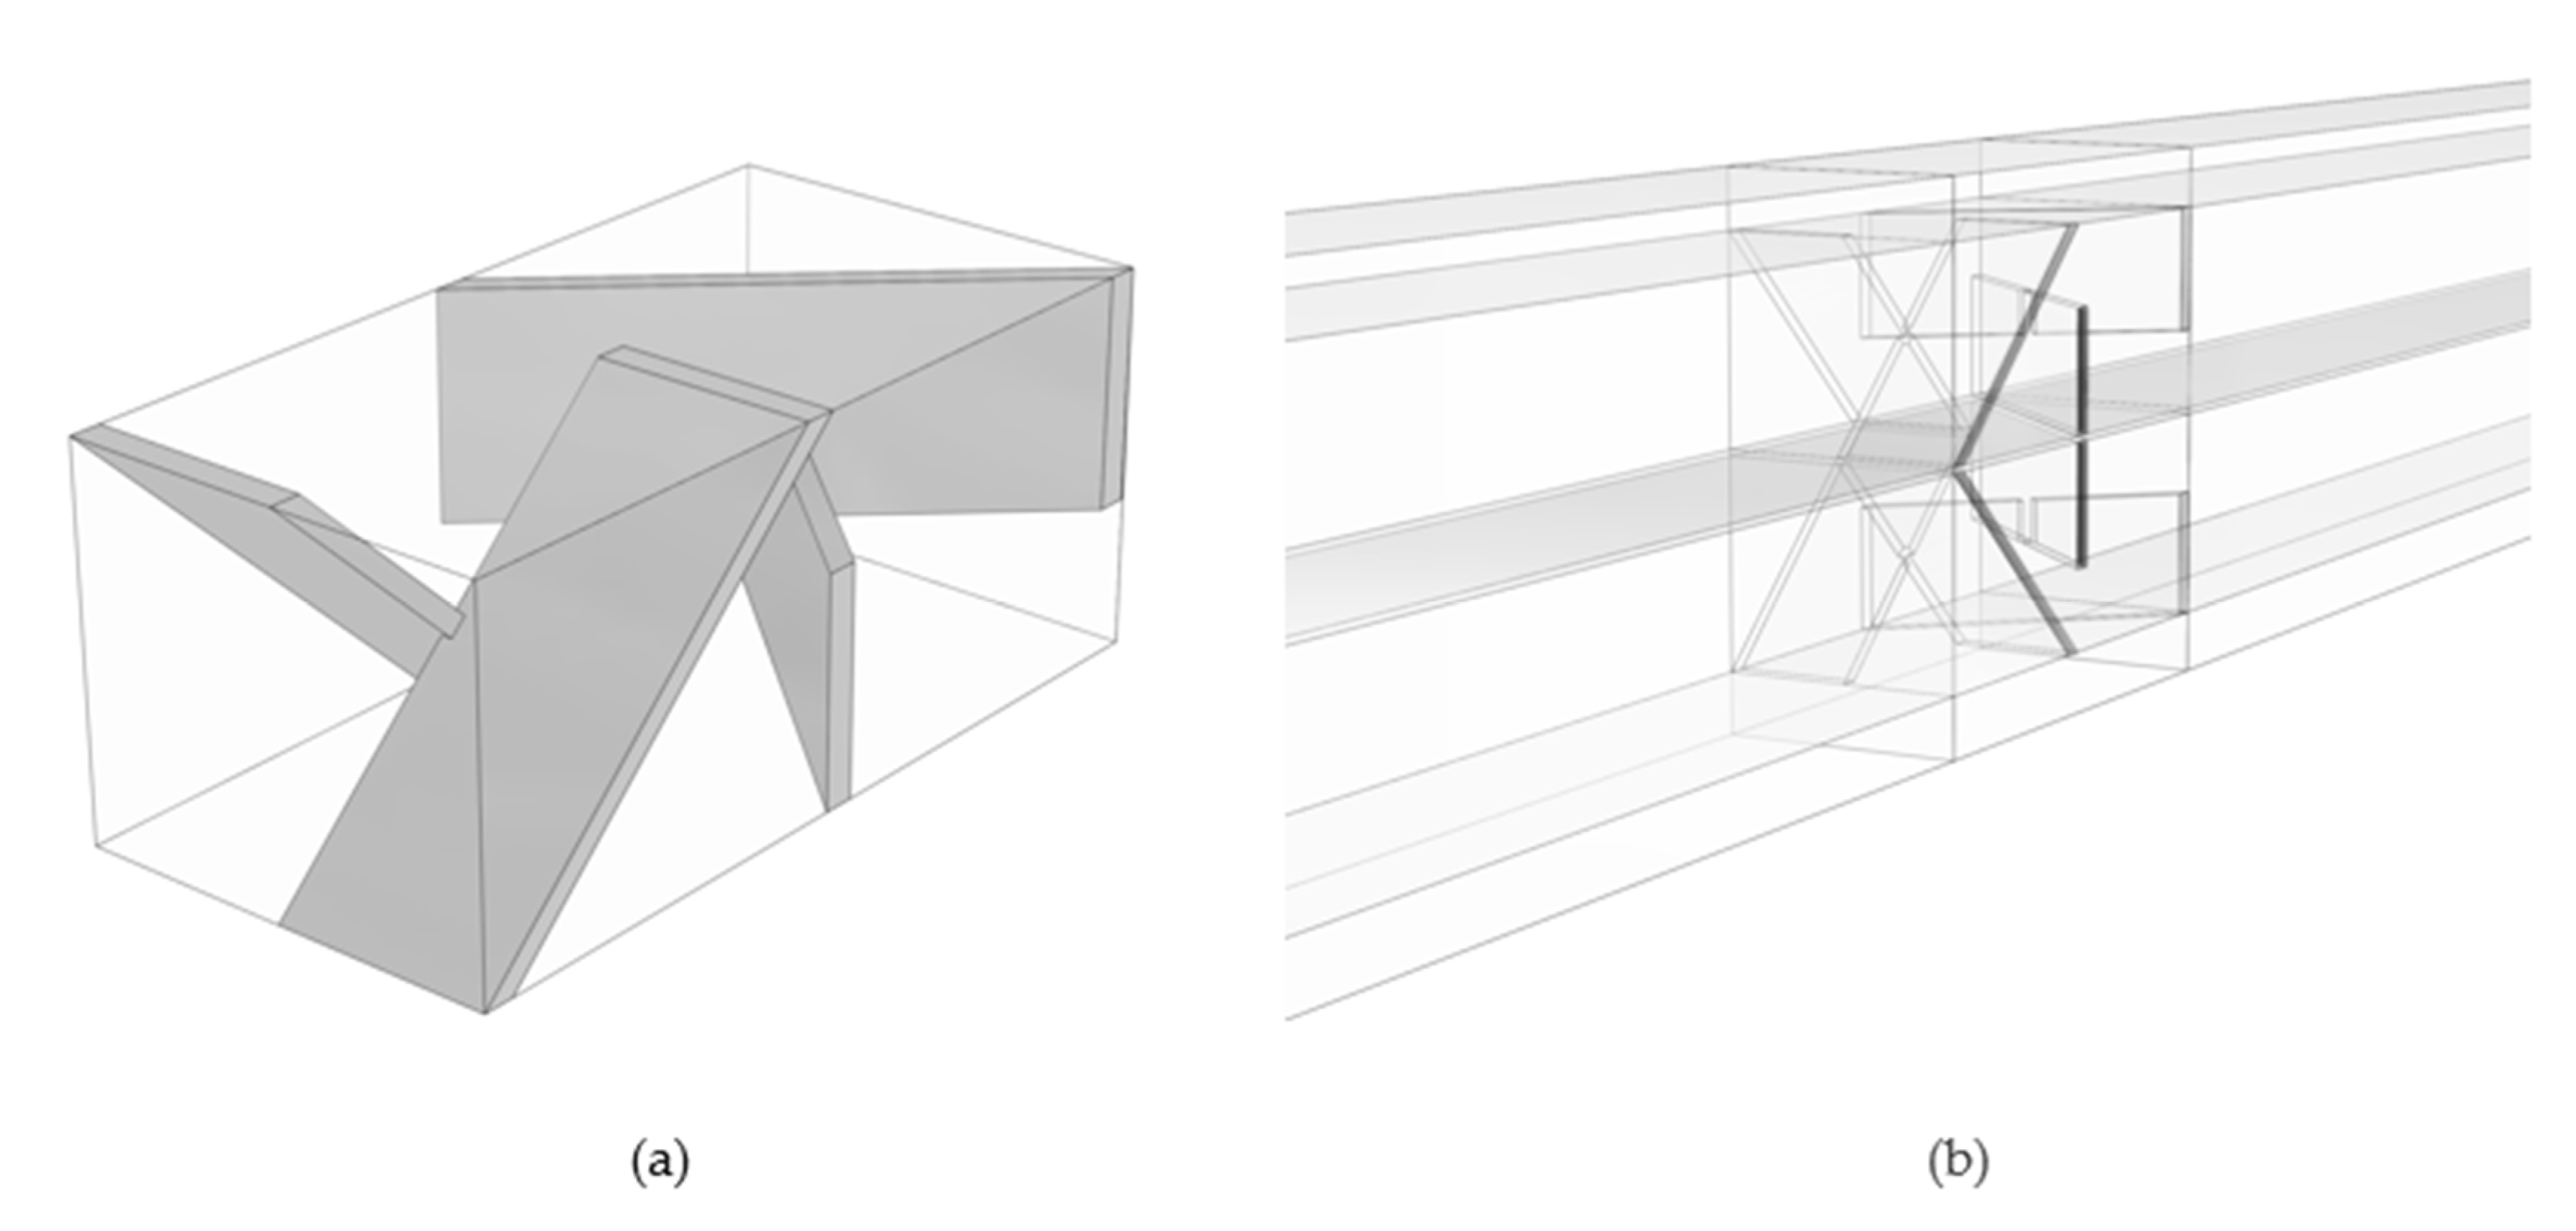
- Case 3—wedge-shaped geometry with 0% to 30% compression with a blade-style mixer bounded by an 8 mm fluid domain.
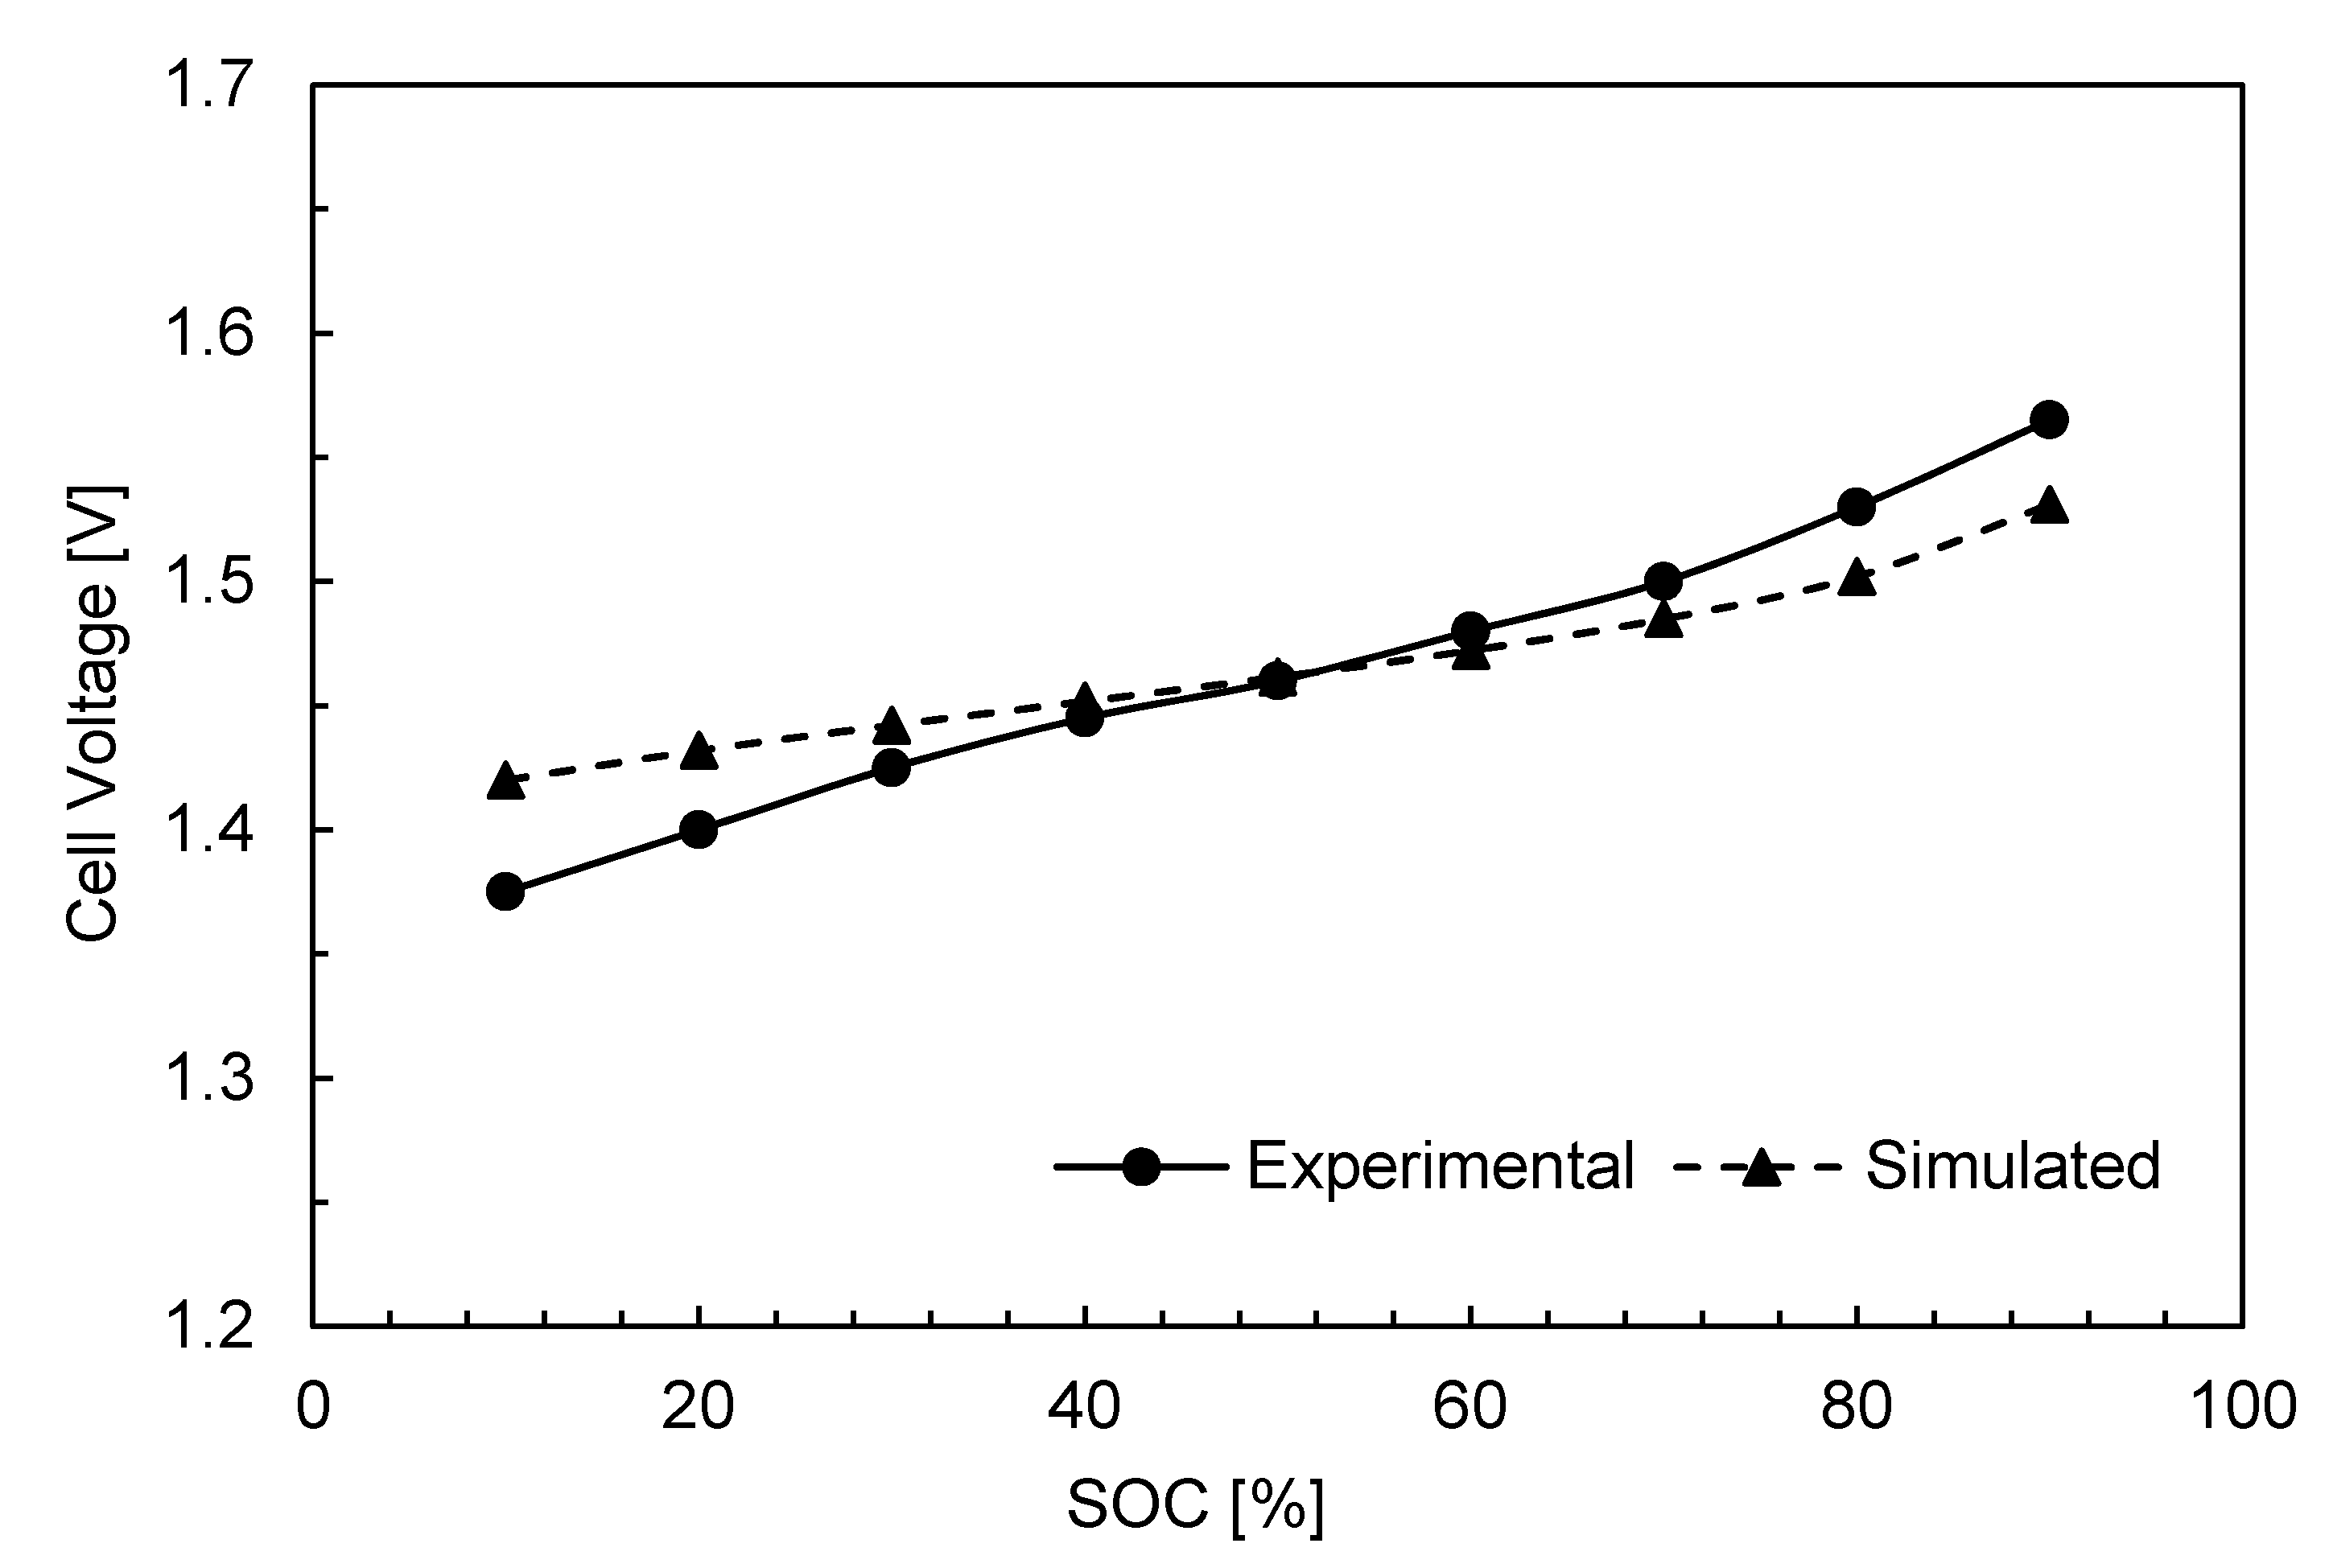
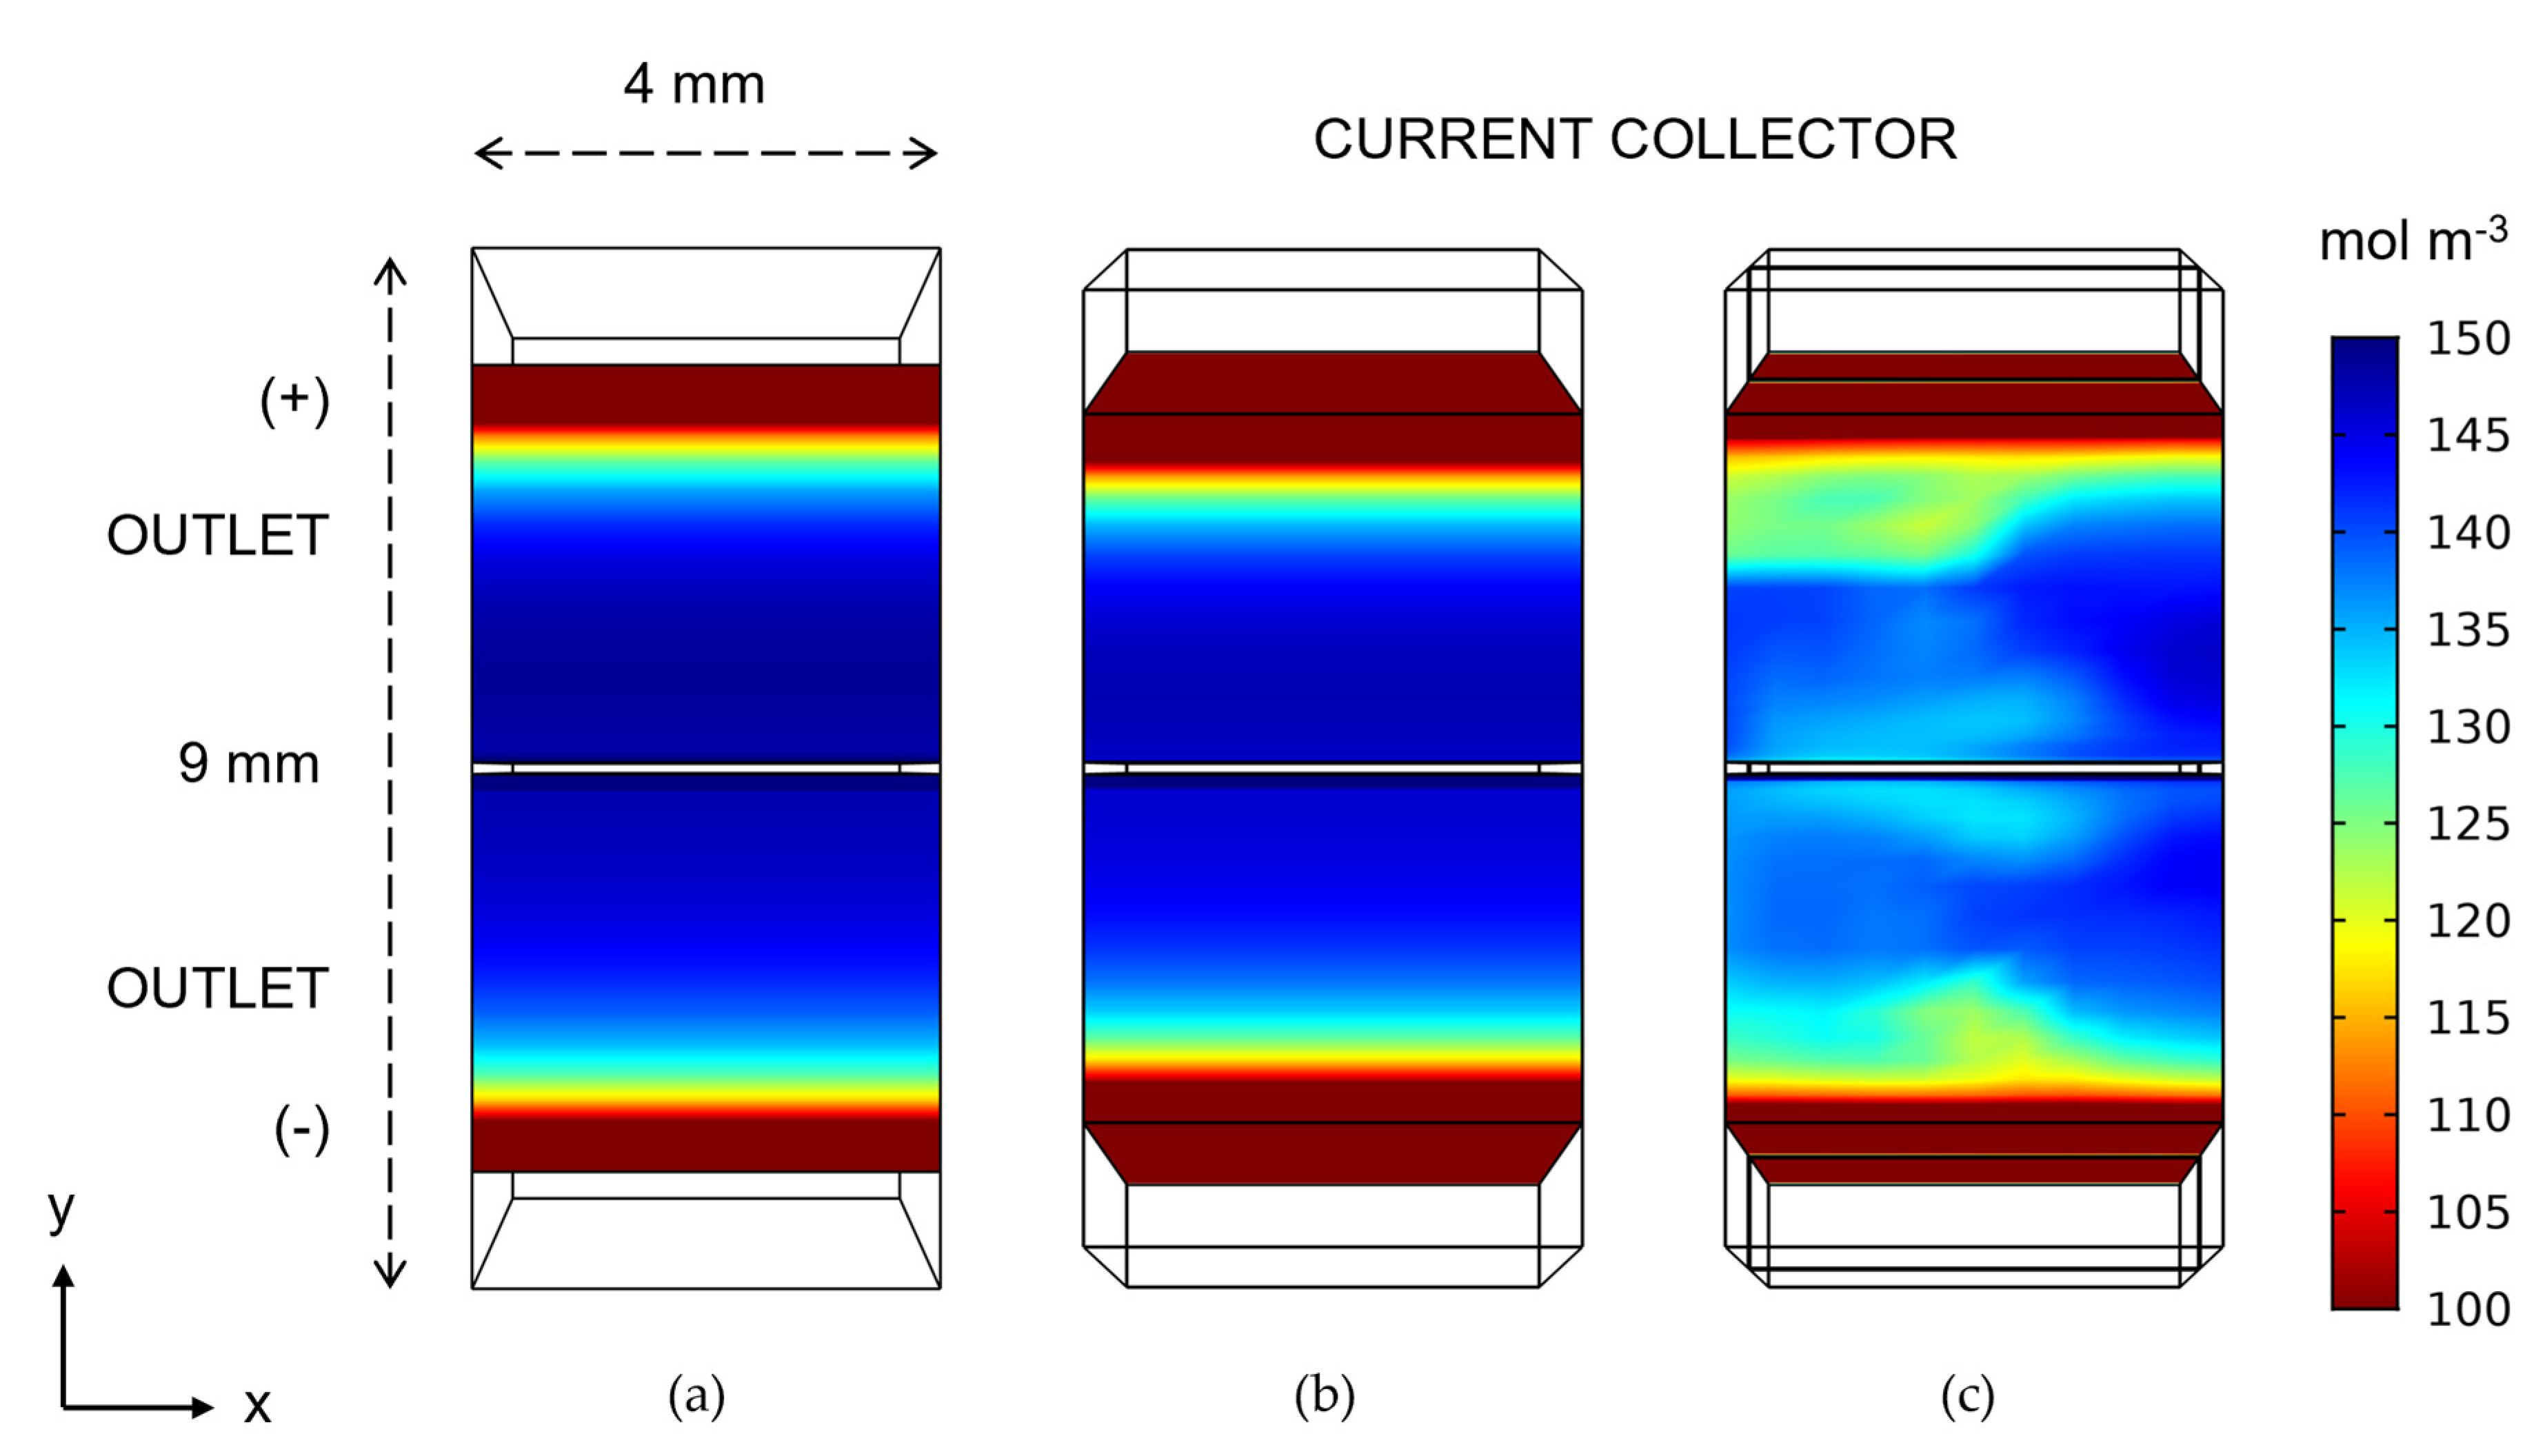
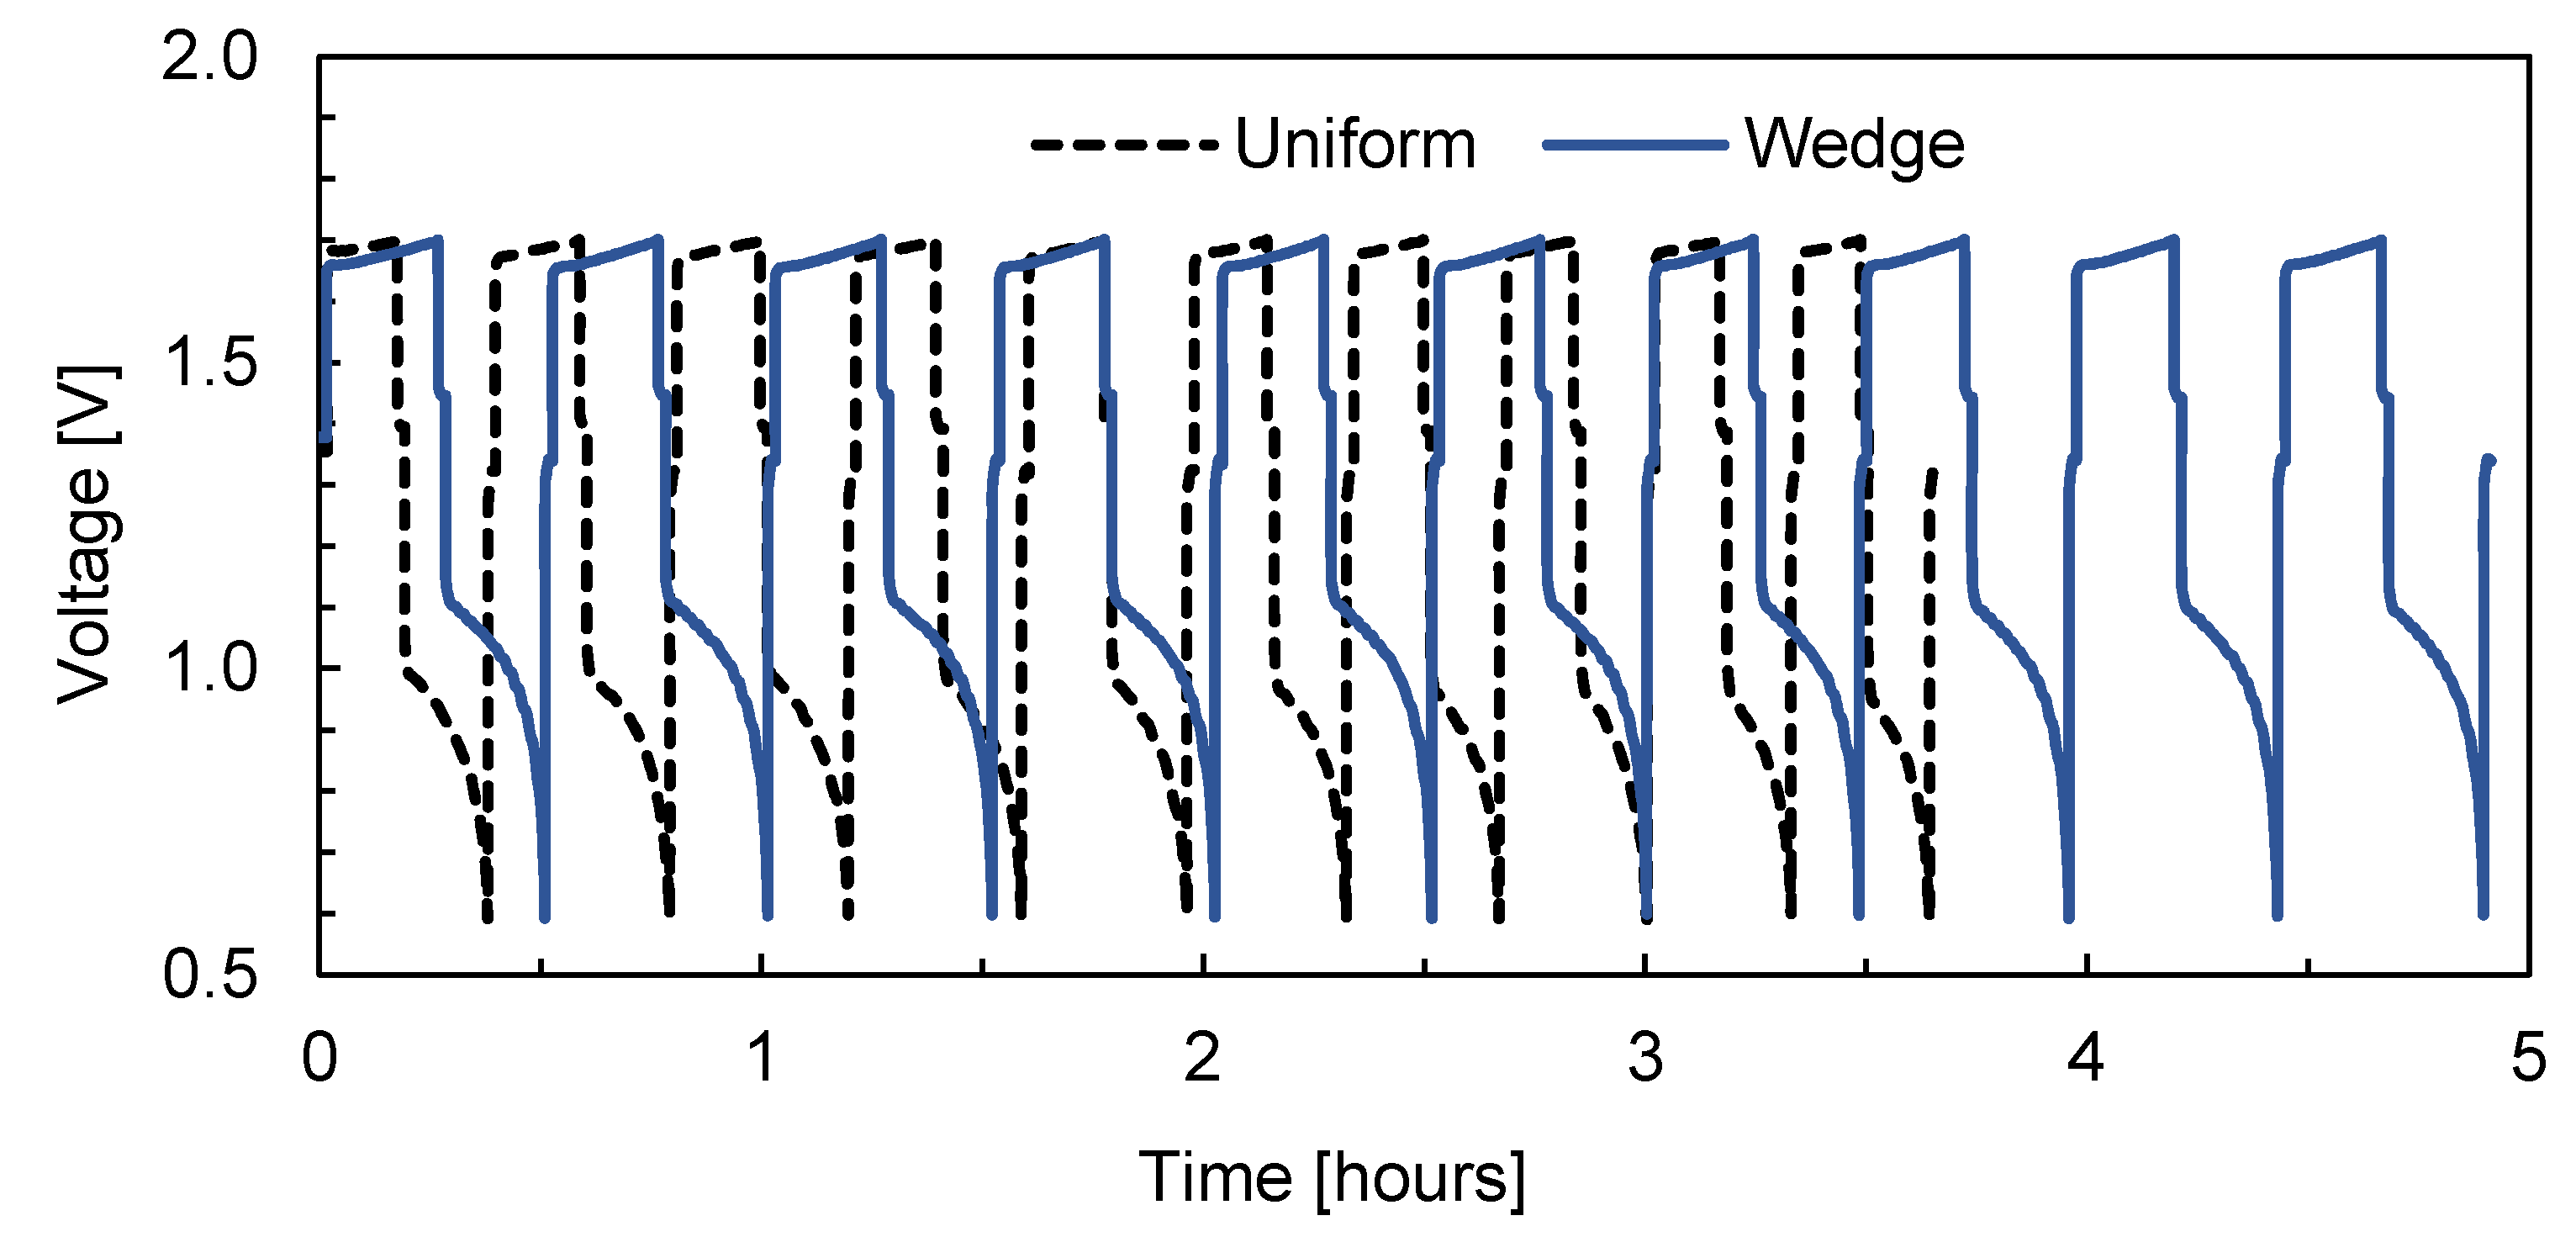
3. Results and Discussion
4. Conclusions
Author Contributions
Funding
Conflicts of Interest
Appendix A
References
- BloombergNEF. Energy Storage Investments Boom As Battery Costs Halve in the Next Decade, Bloomberg. 2019. Available online: https://about.bnef.com/blog/energy-storage-investments-boom-battery-costs-halve-next-decade/ (accessed on 17 April 2019).
- Ziegler, M.S.; Mueller, J.M.; Pereira, G.D.; Song, J.; Ferrara, M.; Chiang, Y.M.; Trancik, J.E. Storage Requirements and Costs of Shaping Renewable Energy Toward Grid Decarbonization. Joule 2019, 3, 2134–2153. [Google Scholar] [CrossRef]
- Skyllas-Kazacos, M.; Menictas, C.; Lim, T. Redox flow batteries for medium to large scale energy storage. In Electricity Transmission, Distribution and Storage Systems; Melhem, Z., Ed.; Woodhead Publishing: Sawston, Cambridge, UK, 2013; pp. 398–441. [Google Scholar]
- Tang, A.; Bao, J.; Skyllas-Kazacos, M. Studies on pressure losses and flow rate optimization in vanadium redox flow battery. J. Power Sources 2014, 248, 154–162. [Google Scholar] [CrossRef]
- Kim, K.J.; Park, M.-S.S.; Kim, Y.-J.J.; Kim, J.H.; Dou, S.X.; Skyllas-Kazacos, M. A technology review of electrodes and reaction mechanisms in vanadium redox flow batteries. J. Mater. Chem. A 2015, 3, 16913–16933. [Google Scholar] [CrossRef]
- Arenas, L.F.; de León, C.P.; Walsh, F.C. Redox flow batteries for energy storage: Their promise, achievements and challenges. Curr. Opin. Electrochem. 2019, 16, 117–126. [Google Scholar] [CrossRef]
- Aaron, D.S.; Liu, Q.; Tang, Z.; Grim, G.M.; Papandrew, A.B.; Turhan, A.; Zawodzinski, T.A.; Mench, M.M. Dramatic performance gains in vanadium redox flow batteries through modified cell architecture. J. Power Sources 2012, 206, 450–453. [Google Scholar] [CrossRef]
- Ke, X.; Prahl, J.M.; Alexander, J.I.D.; Wainright, J.S.; Zawodzinski, T.A.; Savinell, R.F. Rechargeable redox flow batteries: Flow fields, stacks and design considerations. Chem. Soc. Rev. 2018. [Google Scholar] [CrossRef]
- Shah, A.A.; Watt-Smith, M.J.; Walsh, F.C. A dynamic performance model for redox-flow batteries involving soluble species. Electrochim. Acta 2008, 53, 8087–8100. [Google Scholar] [CrossRef] [Green Version]
- Shah, A.A.; Al-Fetlawi, H.; Walsh, F.C. Dynamic modelling of hydrogen evolution effects in the all-vanadium redox flow battery. Electrochim. Acta 2010, 55, 1125–1139. [Google Scholar] [CrossRef]
- Shah, A.A.; Tangirala, R.; Singh, R.; Wills, R.G.A.; Walsh, F.C. A Dynamic Unit Cell Model for the All-Vanadium Flow Battery. J. Electrochem. Soc. 2011, 158, A671. [Google Scholar] [CrossRef] [Green Version]
- You, D.; Zhang, H.; Chen, J. A simple model for the vanadium redox battery. Electrochim. Acta 2009, 54, 6827–6836. [Google Scholar] [CrossRef]
- Ma, X.; Zhang, H.; Xing, F. A three-dimensional model for negative half cell of the vanadium redox flow battery. Electrochim. Acta 2011, 58, 238–246. [Google Scholar] [CrossRef]
- Knehr, K.W.; Agar, E.; Dennison, C.R.; Kalidindi, A.R.; Kumbur, E.C. A Transient Vanadium Flow Battery Model Incorporating Vanadium Crossover and Water Transport through the Membrane. J. Electrochem. Soc. 2012, 159, A1446–A1459. [Google Scholar] [CrossRef]
- Yue, M.; Zheng, Q.; Zhang, H.; Li, X.; Ma, X. Flow field design and optimization of high power density vanadium flow batteries: A novel trapezoid flow battery. AICHE J. 2017, 13–18. [Google Scholar] [CrossRef]
- Gurieff, N.; Cheung, C.Y.Y.; Timchenko, V.; Menictas, C. Performance enhancing stack geometry concepts for redox flow battery systems with flow through electrodes. J. Energy Storage 2019, 22, 219–227. [Google Scholar] [CrossRef]
- Gurieff, N.; Timchenko, V.; Menictas, C. Variable Porous Electrode Compression for Redox Flow Battery Systems. Batteries 2018, 4, 53. [Google Scholar] [CrossRef] [Green Version]
- Gurieff, N.; Menictas, C.; Timchenko, V.; Skyllas-Kazacos, M.; Noack, J. Performance enhancing stack geometry concepts. In Proceedings of the International Flow Battery Forum, Lyon, France, 9–11 July 2019. [Google Scholar] [CrossRef]
- Brown, L.D.; Neville, T.P.; Jervis, R.; Mason, T.J.; Shearing, P.R.; Brett, D.J.L. The effect of felt compression on the performance and pressure drop of all-vanadium redox flow batteries. J. Energy Storage 2016, 8, 91–98. [Google Scholar] [CrossRef] [Green Version]
- Hsieh, C.L.; Tsai, P.H.; Hsu, N.Y.; Chen, Y.S. Effect of compression ratio of graphite felts on the performance of an all-vanadium redox flow battery. Energies 2019, 12, 313. [Google Scholar] [CrossRef] [Green Version]
- Yoon, S.J.; Kim, S.; Kim, D.K. Optimization of local porosity in the electrode as an advanced channel for all-vanadium redox flow battery. Energy 2019, 172, 26–35. [Google Scholar] [CrossRef]
- Kim, Y.; Choi, Y.Y.; Yun, N.; Yang, M.; Jeon, Y.; Kim, K.J.; Choi, J.I. Activity gradient carbon felt electrodes for vanadium redox flow batteries. J. Power Sources 2018, 408, 128–135. [Google Scholar] [CrossRef]
- Chen, W.; Kang, J.; Shu, Q.; Zhang, Y. Analysis of storage capacity and energy conversion on the performance of gradient and double-layered porous electrode in all-vanadium redox flow batteries. Energy 2019, 180, 341–355. [Google Scholar] [CrossRef]
- Lu, M.-Y.; Yang, W.-W.; Bai, X.-S.; Deng, Y.-M.; He, Y.-L. Performance improvement of a vanadium redox flow battery with asymmetric electrode designs. Electrochim. Acta 2019, 319, 210–226. [Google Scholar] [CrossRef]
- Zheng, Q.; Xing, F.; Li, X.; Liu, T.; Lai, Q.; Ning, G.; Zhang, H. Dramatic performance gains of a novel circular vanadium flow battery. J. Power Sources 2015, 277, 104–109. [Google Scholar] [CrossRef]
- Gurieff, N.; Keogh, D.F.; Timchenko, V.; Menictas, C. Enhanced Reactant Distribution in Redox Flow Cells. Molecules 2019, 24, 3877. [Google Scholar] [CrossRef] [PubMed] [Green Version]
- Percin, K.; Rommerskirchen, A.; Sengpiel, R.; Gendel, Y.; Wessling, M. 3D-printed conductive static mixers enable all-vanadium redox flow battery using slurry electrodes. J. Power Sources 2018, 379, 228–233. [Google Scholar] [CrossRef] [Green Version]
- Bayatsarmadi, B.; Horne, M.; Rodopoulos, T.; Gunasegaram, D. Intensifying Diffusion-Limited Reactions by Using Static Mixer Electrodes in a Novel Electrochemical Flow Cell. J. Electrochem. Soc. 2020, 167, 063502. [Google Scholar] [CrossRef]
- Knehr, K.W.; Kumbur, E.C. Open circuit voltage of vanadium redox flow batteries: Discrepancy between models and experiments. Electrochem. Commun. 2011, 13, 342–345. [Google Scholar] [CrossRef]
- Zheng, Q.; Zhang, H.; Xing, F.; Ma, X.; Li, X.; Ning, G. A three-dimensional model for thermal analysis in a vanadium flow battery. Appl. Energy 2014, 113, 1675–1685. [Google Scholar] [CrossRef]
- Park, S.K.; Shim, J.; Yang, J.H.; Jin, C.S.; Lee, B.S.; Lee, Y.S.; Shin, K.H.; Jeon, J.D. The influence of compressed carbon felt electrodes on the performance of a vanadium redox flow battery. Electrochim. Acta 2014, 116, 447–452. [Google Scholar] [CrossRef]
- Gurieff, N.; Keogh, D.F.; Menictas, C.; Timchenko, V. Static Mixers for Enhanced Reactant Distribution in Redox Flow Cells. In Proceedings of the The International Coalition for Energy Storage and Innovation, Sydney, Australia, 1–4 May 2020. [Google Scholar] [CrossRef]
- Minke, C.; Kunz, U.; Turek, T. Techno-economic assessment of novel vanadium redox flow batteries with large-area cells. J. Power Sources 2017, 361, 105–114. [Google Scholar] [CrossRef]
- 3D Systems, VisiJet CE-NT (MJP)—Technical Specifications. 2019. Available online: https://au.3dsystems.com/materials/visijet-ce-nt-elastomeric-natural/tech-specs (accessed on 17 October 2019).
- Gurieff, N.; Baldry, M.; Keogh, D.F. Rapid prototyping the next generation of energy devices. In Proceedings of the UNSW Engineering Postgraduate Research Symposium, Sydney, Australia, 9 December 2019. [Google Scholar] [CrossRef]
- Boudet, H.S. Public perceptions of and responses to new energy technologies. Nat. Energy 2019, 4, 446–455. [Google Scholar] [CrossRef]
- Rand, J.; Hoen, B. Thirty years of North American wind energy acceptance research: What have we learned? Energy Res. Soc. Sci. 2017, 29, 135–148. [Google Scholar] [CrossRef] [Green Version]
- Lazard. Lazard’s Levelized Cost of Storage Analysis—Version 4.0; Lazard: New York City, NY, USA, 2018. [Google Scholar]
- Schelly, C. Residential solar electricity adoption: What motivates, and what matters? A case study of early adopters. Energy Res. Soc. Sci. 2014, 2, 183–191. [Google Scholar] [CrossRef]
- Raveendran, V.; Divya, R.; Chandran, P.C.S.; Nair, M.G. Smart level 2 DC electric vehicle charging station with improved grid stability and battery backup. In Proceedings of the 2017 International Conference on Technological Advancements in Power and Energy (TAP Energy), Kollam, India, 21–23 December 2017; IEEE: Piscataway, NJ, USA, 2018; pp. 1–6. [Google Scholar] [CrossRef]
- Roe, S.; Menictas, C.; Skyllas-Kazacos, M. A High Energy Density Vanadium Redox Flow Battery with 3 M Vanadium Electrolyte. J. Electrochem. Soc. 2016, 163, A5023–A5028. [Google Scholar] [CrossRef]


| Parameter | Symbol | Value | Unit |
|---|---|---|---|
| Outlet pressure | 0 | Pa | |
| Temperature | 293.15 | K | |
| Current density | 160 | mA cm−2 | |
| ate of Charge | 90 | - | |
| Domain width | w | 4 × 10⁻³ | m |
| Current collector thickness | h | 1.0 × 10⁻³ | m |
| Membrane thickness | 0.1 × 10⁻³ | m |
| Parameter | Symbol | Value | Unit |
|---|---|---|---|
| Dynamic viscosity (negative electrolyte) | 0.0025 | Pa s | |
| Dynamic viscosity (positive electrolyte) | 0.005 | Pa s | |
| Density (negative electrolyte) | 1300 | kg m−3 | |
| Density (positive electrolyte) | 1350 | kg m−3 | |
| Mean pore radius | 50.3 × 10⁻⁶ | m | |
| Kozeny-Carman constant | 180 | – | |
| Conductivity of current collector | 1000 | S m−1 |
| Thickness | Compression | Conductivity | Porosity | |
|---|---|---|---|---|
| mm | mm | % | S/m | |
| 4.0 | 0.0 | 0% | 5.9 | 0.95 |
| 3.6 | 0.4 | 10% | 14.3 | 0.90 |
| 3.2 | 0.8 | 20% | 20.0 | 0.89 |
| 2.8 | 1.2 | 30% | 50.0 | 0.87 |
| Parameter | Symbol | Value | Unit |
|---|---|---|---|
| V2+ diffusion coefficient | 2.4 × 10⁻¹⁰ | m2 s−1 | |
| V3+ diffusion coefficient | 2.4 × 10⁻¹⁰ | m2 s−1 | |
| VO2+ diffusion coefficient | 3.9 × 10⁻¹⁰ | m2 s−1 | |
| VO2+ diffusion coefficient | 3.9 × 10⁻¹⁰ | m2 s−1 | |
| Proton diffusion coefficient | 9.312 × 10⁻⁹ | m2 s−1 | |
| Initial vanadium concentration | 1500 | mol m−3 | |
| Initial proton concentration (negative) | 4500 | mol m−3 | |
| Initial proton concentration (positive) | 6000 | mol m−3 | |
| Standard reaction rate constant (negative) | 1.7 × 10⁻⁷ | m s−1 | |
| Standard reaction rate constant (positive) | 6.8 × 10⁻⁷ | m s−1 | |
| Anodic transfer coefficient | 0.5 | – | |
| Cathodic transfer coefficient | 0.5 | – | |
| Equilibrium potential: V2+/V3+ | −0.255 | V | |
| Equilibrium potential: VO2+/VO2+ | 1.004 | V |
| Geometry | Electrode Compression | Min. V3+ Concentration | Differential Pressure | Cell Voltage |
|---|---|---|---|---|
| mol m−3 | kPa | V | ||
| 1—Uniform | 15% | 1 | 7.7 | 1.74 |
| 2—Wedge | 0% to 30% | 5 | 7.0 | 1.71 |
| 3—Mixed Wedge | 0% to 30% | 13 | 6.7 | 1.70 |
| Geometry | Pressure Drop Improvement | Cell Voltage Improvement |
|---|---|---|
| Wedge without mixer | 9% | 1.6% |
| Wedge with mixer | 12% | 2.2% |
© 2020 by the authors. Licensee MDPI, Basel, Switzerland. This article is an open access article distributed under the terms and conditions of the Creative Commons Attribution (CC BY) license (http://creativecommons.org/licenses/by/4.0/).
Share and Cite
Gurieff, N.; Keogh, D.F.; Baldry, M.; Timchenko, V.; Green, D.; Koskinen, I.; Menictas, C. Mass Transport Optimization for Redox Flow Battery Design. Appl. Sci. 2020, 10, 2801. https://doi.org/10.3390/app10082801
Gurieff N, Keogh DF, Baldry M, Timchenko V, Green D, Koskinen I, Menictas C. Mass Transport Optimization for Redox Flow Battery Design. Applied Sciences. 2020; 10(8):2801. https://doi.org/10.3390/app10082801
Chicago/Turabian StyleGurieff, Nicholas, Declan Finn Keogh, Mark Baldry, Victoria Timchenko, Donna Green, Ilpo Koskinen, and Chris Menictas. 2020. "Mass Transport Optimization for Redox Flow Battery Design" Applied Sciences 10, no. 8: 2801. https://doi.org/10.3390/app10082801
APA StyleGurieff, N., Keogh, D. F., Baldry, M., Timchenko, V., Green, D., Koskinen, I., & Menictas, C. (2020). Mass Transport Optimization for Redox Flow Battery Design. Applied Sciences, 10(8), 2801. https://doi.org/10.3390/app10082801