Article

Enhancing the Quality of Sampled Phase-Only Hologram (SPOH) Based on Time-Division Comb Filtering

1
Department of Electronic Engineering, City University of Hong Kong, Hong Kong 999077, China
2
Department of Photonics, Feng Chia University, Taichung 407, Taiwan
3
Bradley Department of Electrical and Computer Engineering, Virginia Tech, Blacksburg, VA 24061, USA
*
Author to whom correspondence should be addressed.
Appl. Sci. 2020, 10(8), 2732; https://doi.org/10.3390/app10082732
Submission received: 27 February 2020 / Revised: 12 April 2020 / Accepted: 12 April 2020 / Published: 15 April 2020
(This article belongs to the Special Issue Practical Computer-Generated Hologram for 3D Display)

Abstract

:
Generation of digital phase-only Fresnel holograms is an important research area in digital holography, as it leads to a substantial simplification of a holographic display system. However, the quality of the reconstructed image of a hologram without the magnitude component is heavily degraded. The problem can be reduced by down-sampling the intensity of an image prior to generating the hologram. The method, referred to as “sampled phase-only hologram” (SPOH) generation, results in reconstructed images that are masked with the pattern of the down-sampling lattice. This paper reports a novel, low complexity method to alleviate this problem through the concept of comb filtering. Results reveal prominent enhancement on the reconstructed image of a SPOH.

1. Introduction

A three-dimensional (3-D) digital object image, or a computer graphic model, can be represented by a two-dimensional (2-D) digital complex-valued hologram that is comprised of a pair of components (e.g., a magnitude component and a phase component). To date, there are many modern methods for generating digital holograms, a process that is commonly referred to as computer generated holography (CGH). A good review on the state-of-the-art can be found in [1,2]. To reconstruct the 3-D image of a digital hologram to an observer, each component is displayed with a spatial light modulator (SLM) through a meticulous optical setup [3,4]. It has been demonstrated that a single SLM can be used to display the pair of hologram components [5,6]. Despite the success, the optical setup is rather complicated. A more practical approach is to convert a complex-valued hologram into a phase-only hologram, so that it can be displayed with a single phase-only SLM.
Digital Fresnel phase-only hologram has two major advantages over a complex-valued hologram. First, it can be displayed directly with a single phase-only spatial light modulator, leading to significant simplification in the optical setup. Second, the optical efficiency is higher, resulting in brighter reconstructed images. However, when a phase-only hologram is obtained simply by removing the magnitude component of a complex-valued hologram, the quality of the reconstructed image will be heavily degraded. In the past 2 decades there are numerous solutions to address this problem. The Gerchberg Saxton algorithm (GSA) [7] is one of the earliest and popular frameworks for generating a phase-only hologram. Based on the GSA, the iterative Fourier transform and the iterative Fresnel transform algorithms [8,9] (both methods also referred to as IFTA) have been developed to generate Fourier and Fresnel phase-only holograms. Starting from a hologram with random phase values, repetitive rounds of iterations are conducted to adjust the phase of the hologram pixels so that the reconstructed image will be rendered towards a target image. Reconstructed image of a hologram generated with IFTA is generally similar in appearance to the target, but contaminated with considerable amount of noise. The computation loading is also intensive as multiple rounds of iterations are needed to obtain the hologram. Although the noise problem can be reduced through averaging the reconstructed images of multiple holograms, or the mixed region methods [10], the computation time will be further increased. Another iterative approach, known as direct binary search (DBS) [11,12], works on similar principles as the GSA. In comparison with the latter, DBS results in reconstructed images of higher quality, but the computational efficiency is substantially lowered.
Non-iterative methods have also been developed to reduce the time for generating phase-only holograms. The complex amplitude modulation (CAM) [13,14] and the double phase methods [15,16,17] are effective for generating phase-only holograms. However, both methods required some kind of optical filtering to remove unwanted signals from the reconstructed images. A less complicated way, known as noise addition method, adds random phase noise to the intensity image of a three-dimensional (3-D) object. The random noise acts like a diffuser, so that the diffracted waves of the object are close to homogeneous on the hologram plane. The magnitude component, therefore, can be approximated as a constant throughout the entire hologram. Similar to IFTA, reconstructed images of phase-only holograms generated with this method are heavily masked with random noise. Although the degradation of the lines and edges can be improved by restricting the noise addition to the smooth regions of the intensity image [18], the noise level of the shaded areas are still significant. A method to suppress the noise in the reconstructed image, known as one step phase retrieval (OSPR), is proposed in [19,20]. Multiple phase-only sub-holograms are generated, each based on the addition of a different set of random phase noise to the intensity image of the source object are generated. The sub-holograms are displayed at high speed on a SLM, so that their reconstructed images are averaged out with the persistence of vision of human perception, resulting in attenuation of the random noise. As multiple sub-holograms have to be generated in OSPR, the computation time is increased. In view of this, periodic noise blocks are added to the intensity image instead of random noise in generating the phase-only hologram. A hologram generated with this method is referred to as a patterned phase-only hologram (PPOH) [21]. Reconstructed image of a PPOH is not contaminated with random noise as in the case of the noise addition method, but is imposed with a blocky appearance. Similar approaches with enhancement on the quality of the reconstructed images have been attempted in [22]. Another method to simulate the effect of a diffuser is through down-sampling the intensity component of the object prior to generating the hologram. Similar to the noise addition method, the down-sampling the intensity image also results in a hologram with roughly homogeneous magnitude distribution. A hologram generated with this method is known as a sampled phase-only hologram (SPOH) [23]. Later the method has been extended to the generation of binary phase-only hologram [24]. It has also been demonstrated in [25] that a SPOH is also capable of representing multiple images with the incorporation of the Arnold transform. The visual quality of reconstructed images of SPOHs are generally favorable, and not as noisy as the ones associated with IFTA or noise addition. On the downside, the reconstructed images are masked with the down-sampling pattern with lots of empty voids (corresponding to the non-sampled pixels), resulting in a dim and pixelated outlook. In addition, continuous lines and curves are fragmented heavily. A solution to address this shortcoming has been proposed in [26]. Two or more SPOHs, each associated with a down-sampling lattice that is complementary to the others, are generated. The appearance of the reconstructed image can be improved by displaying the set of SPOHs at sufficiently high frame rate, so that the voids in one image can be filled by the rest of the images. However, the computation time is increased as more holograms have to be generated for a single hologram frame.
In this paper, a low complexity method referred to as time-division comb filtering (TDCF) is propose to overcome the problem of SPOH. We shall demonstrate that TDCF is effective in enhancing the quality of the reconstructed images of a SPOH. Organization of the paper is given as follows. After the introduction, in Section 2, the principles of SPOH are outlined. The proposed enhanced SPOH method is described in Section 3. Experimental results and conclusion are provided in Section 4 and Section 5, respectively.

2. Sampled Phase-Only Hologram (SPOH)

2.1. Generating a Phase-Only Hologram with Direct Magnitude Removal

Generating a digital hologram from a three-dimensional (3-D) object is commonly referred to as computer generated holography (CGH). The process of generating a digital Fresnel hologram is briefly outlined as follows. There are polygon-based [27] and point-based [28] methods. In this paper, we deal with the point-based method. In point-based CGH, the object space is a set of object points. Each point emits a spherical wave with an intensity proportional to its irradiance. The phase of all the object points are assumed to be zero. The hologram is a planar surface located at certain distance along the z (axial) direction from the object space. The value of each pixel in the hologram is the accumulative sum of the waves from all the object points. For an object space comprising a single image layer I ( m , n ) (m and n being the horizontal and vertical coordinate axes) that is parallel to, and at an axial distance z 0 from the hologram plane, its hologram can be obtained with Fresnel diffraction as given by
H ( m , n ) = I ( m , n ) f ( m , n ; z 0 ) , f ( m , n ; z 0 ) = e x p ( i 2 π λ m 2 δ 2 + n 2 δ 2 + z 0 2 )
where ‘ ’ denotes convolution, is the free space impulse response [1], with λ and δ being the wavelength of the optical beam, and the sampling interval. Equation (1) can also be expressed in the frequency space. Let H ˜ ( ω m , ω n ) , I ˜ ( ω m , ω n ) , and f ˜ ( ω m , ω n ; z 0 ) denote the Fourier transform of H ( m , n ) , I ( m , n ) , and f ( m , n ; z 0 ) , respectively, we have
H ˜ ( ω m , ω n ) = I ˜ ( ω m , ω n ) × f ˜ ( ω m , ω n ; z 0 ) .
If the object space contains multiple image layers, the hologram is simply the superposition of the hologram of each image. For simplicity of explanation, we hereafter assume that the object space to be a single image layer, but it can be easily extended to multiple image layers based on the superposition principle. The 3-D image represented by a hologram can be reconstructed with a pair of spatial light modulators (SLM), each displaying one of the two components (magnitude and phase, or the real and imaginary parts). This setup requires precise integration of the SLMs and associated optical components, which is complicated, bulky, and difficult to implement in practice. In a simplified optical reconstruction method, either the phase or amplitude of the hologram is displayed with a single SLM. Displaying the phase component is preferred to the amplitude as higher optical efficiency can be achieved. Although, a phase-only hologram can be obtained by simply discarding the magnitude component, as we shall show later, the reconstructed image suffers degradation.

2.2. Generating a Sampled Phase-Only Hologram

The above mentioned problem can be overcome by down-sampling the intensity of the object with a grid-cross lattice prior to generation of the hologram. A grid cross lattice is comprising of regular spaced sampling lines along the horizontal, vertical, and diagonal directions. Down-sampling the intensity image effectuates an optical diffuser, resulting in a hologram with roughly homogeneous magnitude distribution that can be discarded without causing too much degradation to the reconstructed image. The grid-cross lattice is a two-dimensional binary image D ( m , n ) with ‘0′ and ‘1′ representing non-sampling and sampling points. Let τ and m o d ( A , B ) denote the sampling interval, and the remainder of A / B . The following parameters are defined as
The down-sampling grid-cross lattice is given by
C 1 ( m ) = m o d ( m , τ ) ,
C 2 ( n ) = m o d ( n , τ )
C 3 ( m , n ) = C 1 ( m ) C 2 ( n )
C 4 ( m , n ) = C 1 ( m ) [ τ C 2 ( n ) ]
D ( m , n ) = { 1 i f   C 1 ( m ) × C 2 ( n ) × C 3 ( m , n ) × C 4 ( m , n ) = 0   0 o t h e r w i s e
An example of the grid-cross lattice for τ = 8 , and m , n = [ 0 , 8 ] is shown in Figure 1.
The down-sampled image I D ( m , n ) is
I D ( m , n ) = I ( m , n ) × D ( m , n )
I D ( m , n ) comprises pixels of the original image that are sampled at uniformly spaced interval along the horizontal, vertical, and diagonal directions.
Next a Fresnel hologram H D ( m , n ) of the down-sampled image I D ( m , n ) is generated, and the phase component of H D ( m , n ) is extracted to be the sampled phase-only hologram (SPOH) H P ( m , n ) , as given by
H P ( m , n ) = a r g { 1 [ I ˜ D ( ω m , ω n ) × f ˜ ( ω m , ω n ; z 0 ) ] }
where 1 [ . ] is the inverse Fourier transform operation, a r g { ψ } represents the phase component of the complex variable ψ , and I ˜ D ( ω m , ω n ) is the frequency spectrum of I D ( m , n ) . From the phase-only hologram H P ( m , n ) an image I D ( m , n ) , can be reconstructed from the SPOH. Denoting the conjugate of f ˜ ( ω m , ω n ; z 0 ) as f ( ω m , ω n ; z 0 ) , the intensity of the reconstructed image is given by
I D ( m , n ) = | 1 { H ˜ P ( ω m , ω n ) × f ( ω m , ω n ; z 0 ) } | ,
where H ˜ P ( ω m , ω n ) is the Foruier transform of H P ( m , n ) , and | A | is the magnitude of the complex-valued function A . In general the reconstructed image I D ( m , n ) is similar to the down-sampled image I D ( m , n ) . , which is also masked with the pattern of the down-sampling lattice. As an example, the plane image in Figure 2a is converted to a phase-only hologram with the optical settings in Table 1. Equation (1) is first applied to generate a Fresnel hologram directly from the original image, and the phase component is retained as the phase-only hologram. The reconstructed image, as shown in Figure 2b, is mostly invisible with most of the contents removed but with slight edge information. Figure 2c–e are the reconstructed images of the SPOH with down-sampling factor τ   = 8, 12, and 16. The dynamic range of the intensity is normalized to [ 0 , 1 ] , with 0 and 1 representing the smallest and the largest intensity in the image. A greyscale bar is associated with each image to reflect the relative intensity. It can be seen that the shaded region is preserved in all the 3 cases. For a small down-sampling factor of τ = 8, the intensity distribution is non-uniform with obvious patches that are brighter in appearance. The intensity becomes more uniform with larger down-sampling factor, however the number of sampled points is decreased, leading to larger amount of empty voids and dimmer appearance. In general, a good compromise between the uniformity of intensity distribution, and the number of sampled points is attained with down-sampling factor τ = 16. In the next section, we shall illustrate the changes in the frequency spectrum caused by down-sampling, and how its effect can be reduced.

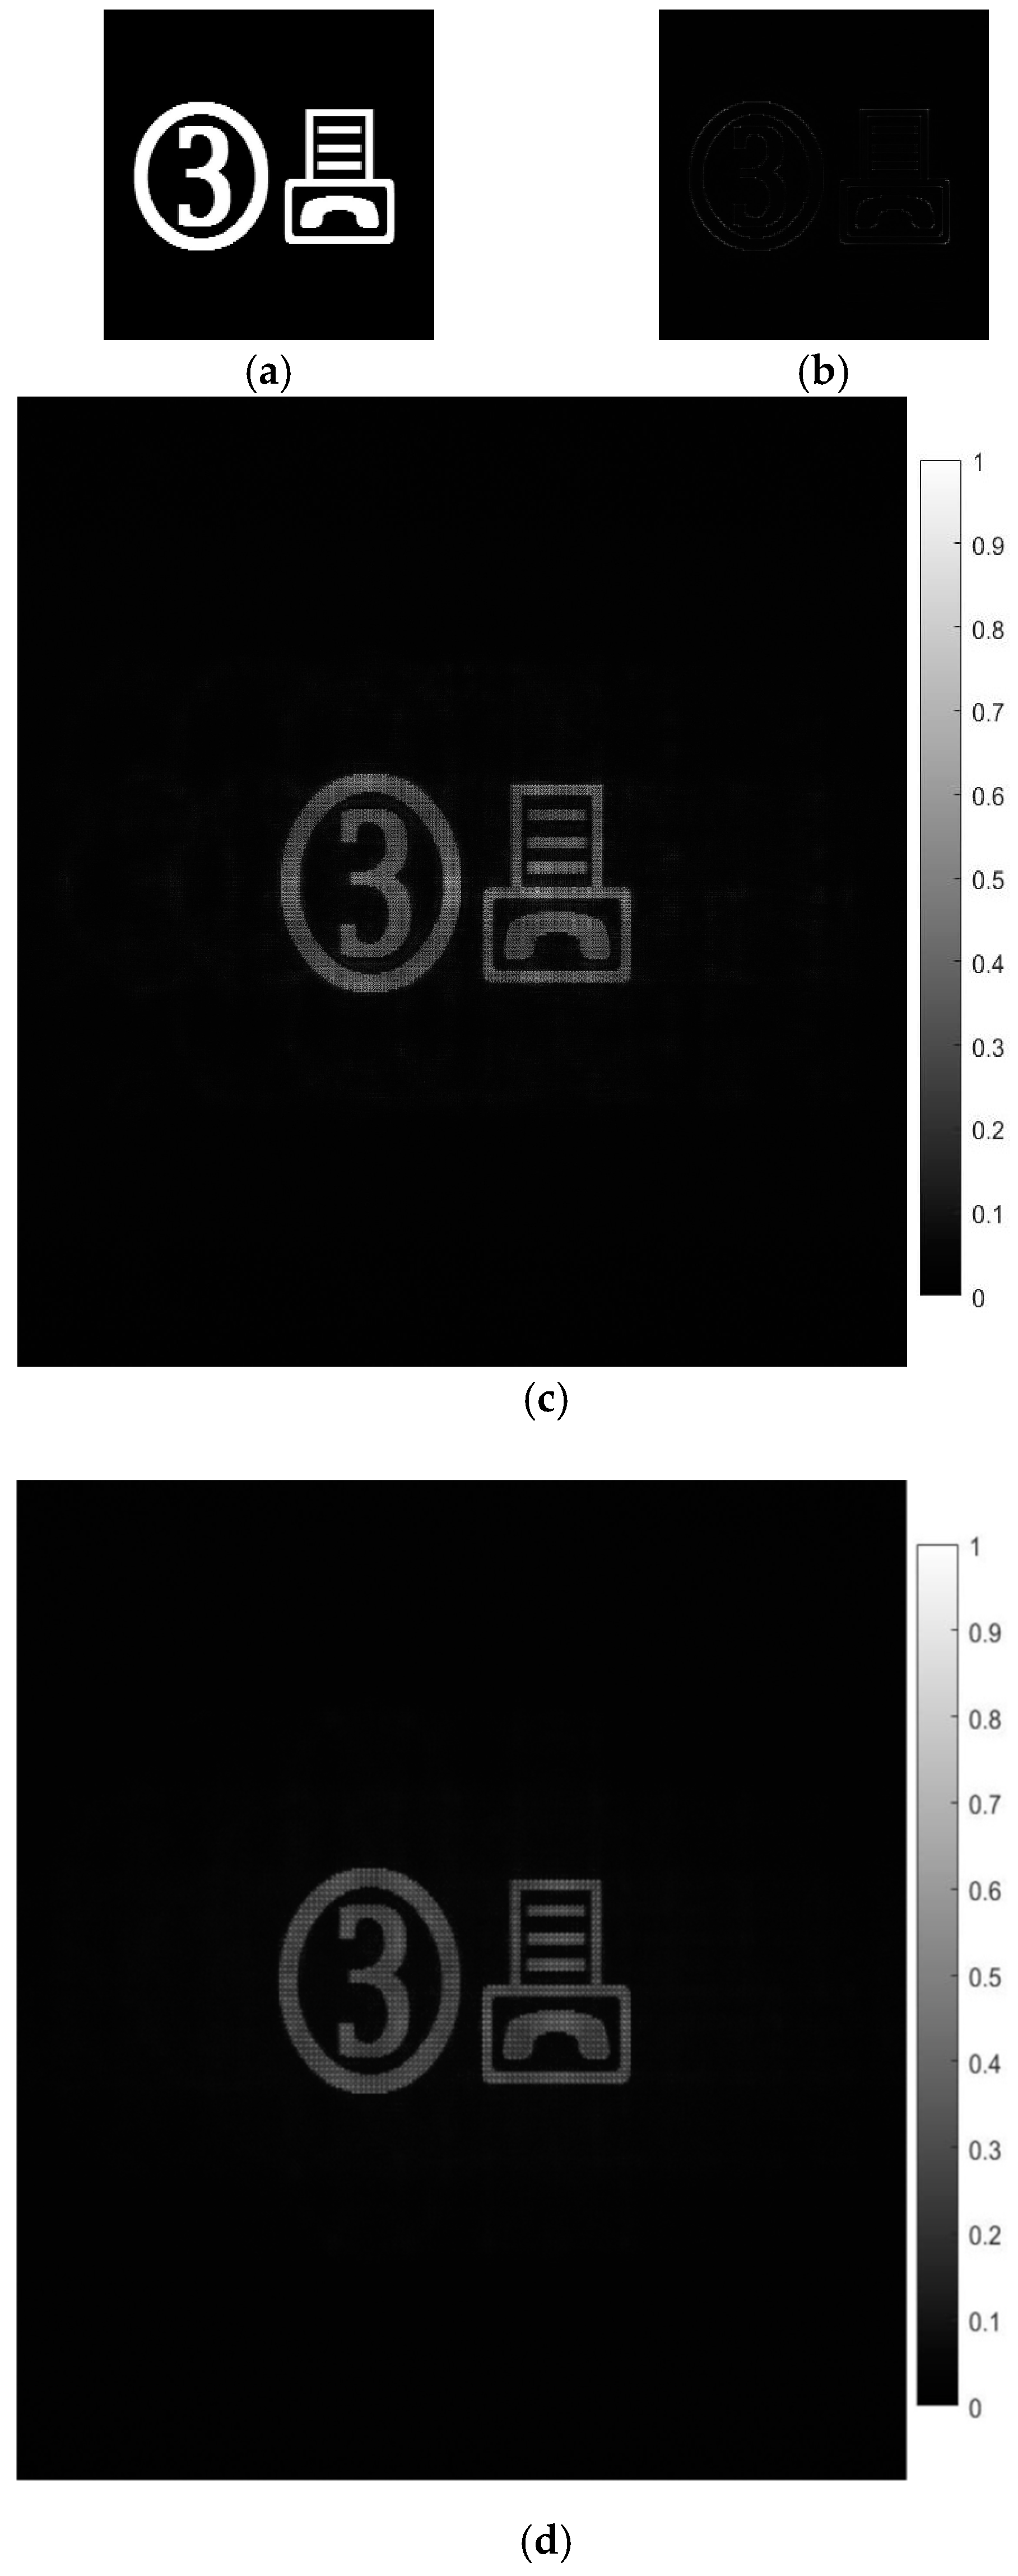
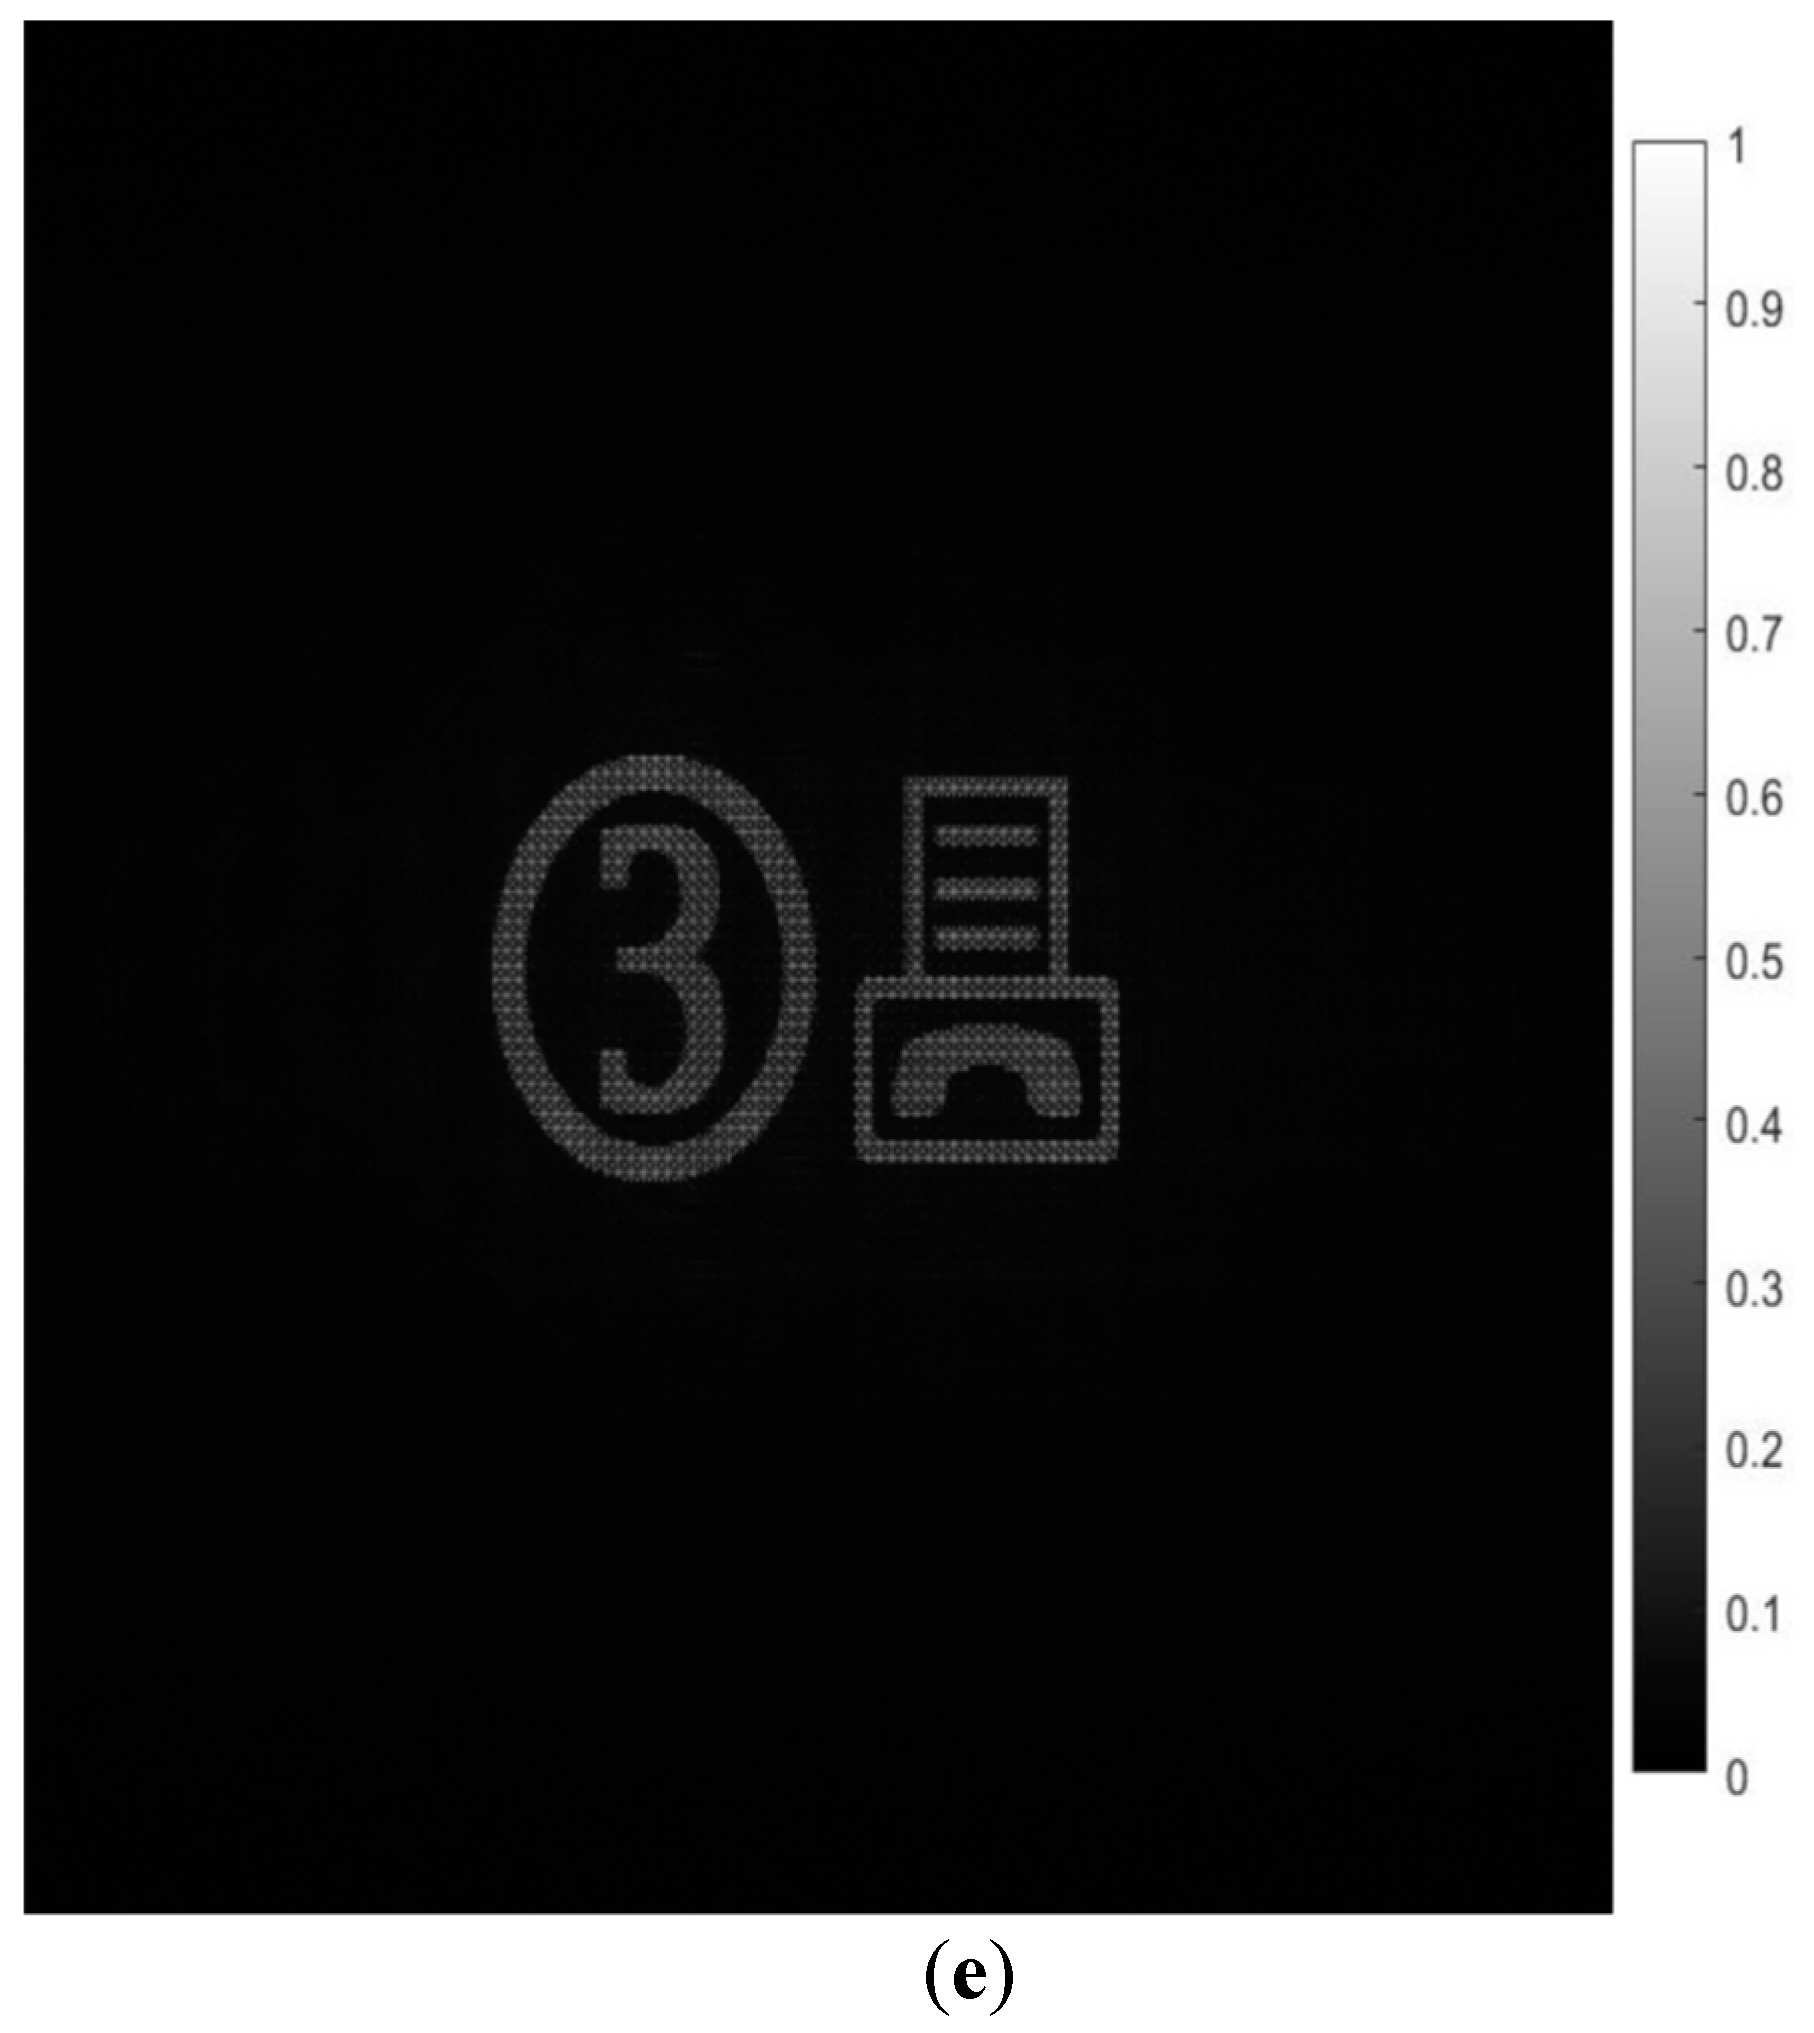
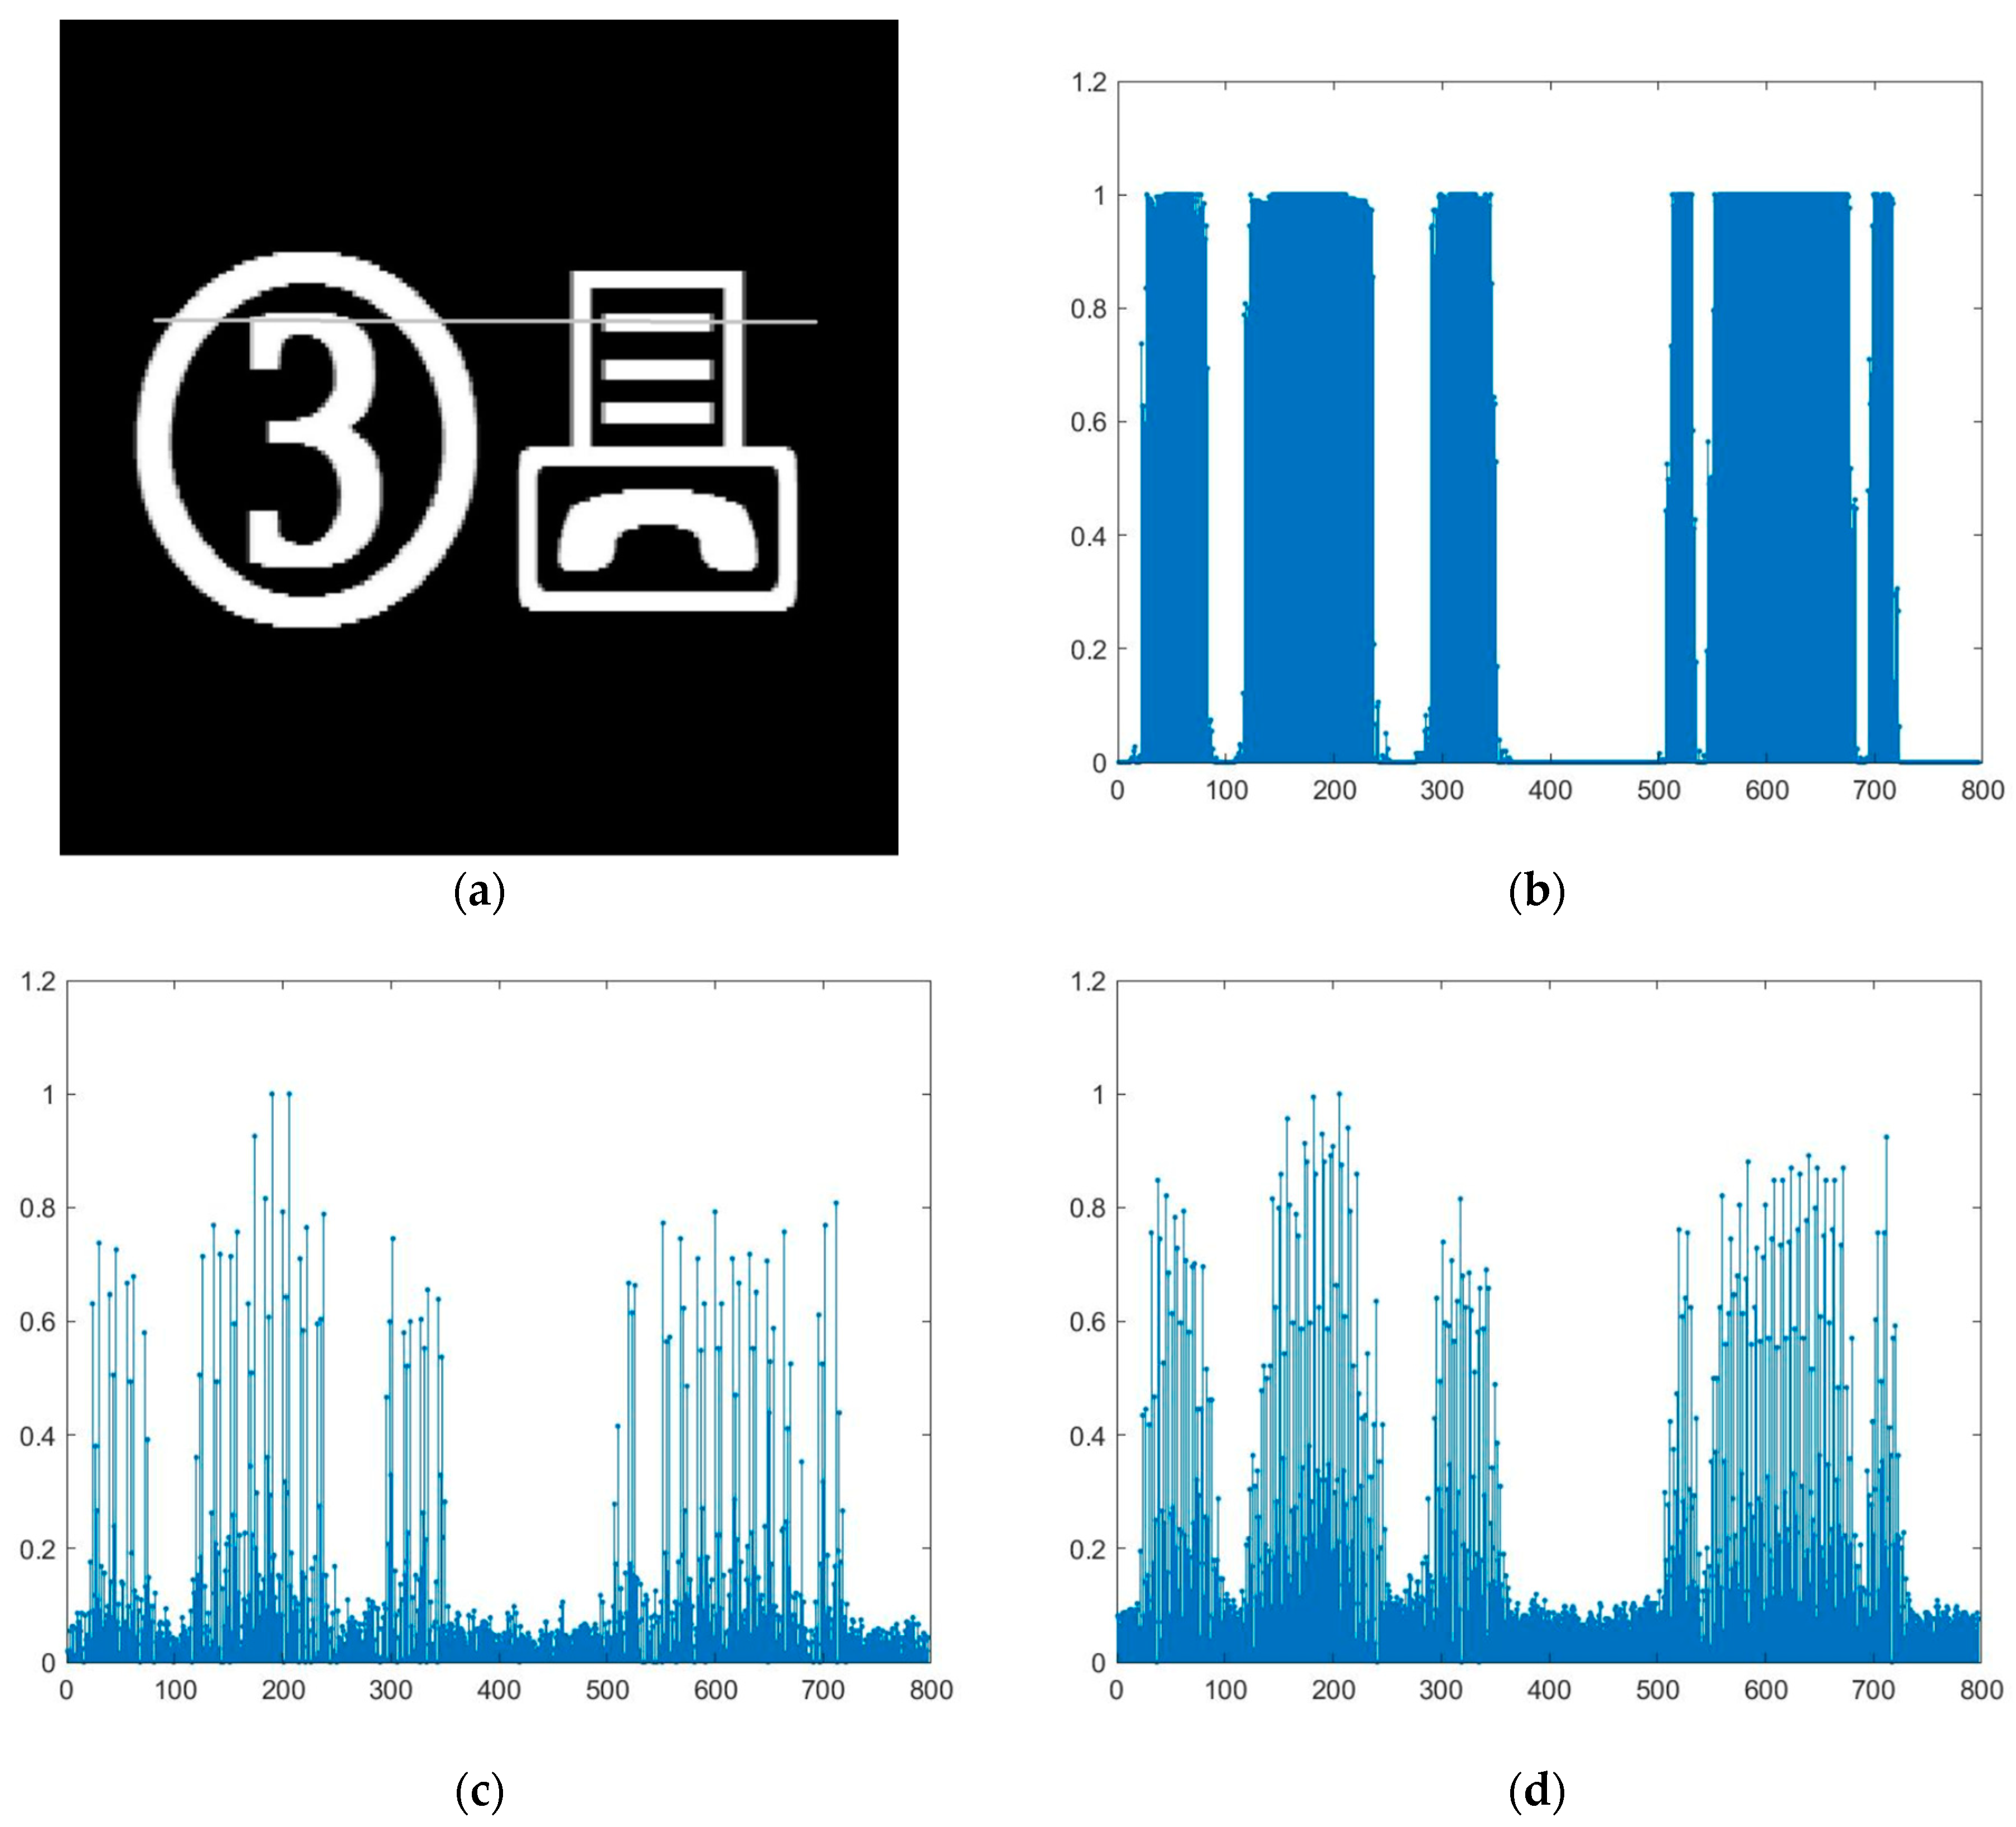
2.3. Effect of Down-Sampling in the Frequency Space

Consider an arbitrary row of image I ( m ) comprising of M pixels, and its down-sampled version I D ( m ) . The Fourier spectrum of I D ( m ) is represented by I ˜ D ( ω ) . The frequency axis is bounded within the range [ 0 , 2 π ) radians, and discretized into M samples uniformly spaced at 2 π M radians. In other words, ω = 2 π k M | 0 k < M , where k is an integer. After down-sampled by a factor τ , its frequency spectrum is given by
I ˜ D ( ω ) = t = 0 τ 1 I ˜ ( ω ) e x p [ i ( ω 2 π q τ ) ]
where q is an integer. The above equation shows that after down-sampling, the frequency spectrum contains τ replicas of the baseband signal I ˜ ( ω ) , which are uniformly distributed along the frequency axis at locations ω q = 2 π q τ | 0 q < τ . The separation between adjacent replicas is 2 π τ radians. We assume that the bandwidth of the signal is limited to within 2 π τ radians, so that the replicas are non-overlapping with each other. If this is not the case, a low-pass filter can be used to band-limit the signal before down-sampling. The result of down-sampling is illustrated with the spectrum of the one-dimensional, band-limited signal in Figure 3a. After down-sampled by two times (i.e., q = [ 0 , 1 ] ), the new signal spectrum is shown in Figure 3b. We observe that the spectrum of the down-sampled signal with τ = 2 is comprising of two copies of the base-band spectrum at ω = 0, and π radians. For down-sampling factor of four, there are four replicas at ω = 0, π 2 , π , and 3 π 2 radians, as shown in Figure 3c.
The above analysis can be directly applied to down-sampling of a 2-D image I ( m , n ) along the horizontal, and vertical directions. From Figure 3, it can be seen that the sparsity of a down-sampled signal can be decreased by reducing the number of replicas spectrum, which is equivalent to lowering the down-sampling factor.

3. Proposed Method to Generate an Enhanced SPOH with Time-Division Comb Filtering

Based on the analysis in Section 2, a method to enhance the reconstructed image of a SPOH is presented. Our proposed method is shown in Figure 4.
A SPOH of a source image I ( m , n ) is generated according to the steps discussed in Section 2.1 and Section 2.2. The reconstructed image of the SPOH is then processed by two-dimensional (2-D) time-division comb filtering (TDCF) to suppress half of the replica spectrums, resulting in decreasing the down-sampling factor by 2 times. TDCF is similar to classical comb filtering, with the exception that filtering is realized in the time domain instead of through numerical computation. In the following subsections, the principles of comb filtering, and our proposed method for enhancing the reconstructed image of SPOH with TDCF, are described.

3.1. Comb Filtering

The transfer function of a comb filter takes the form of periodic band-pass and band-stop sections. Due to the simplicity of comb filter (which is easy to implement with hardware circuits or software) and effectiveness of attenuating signals at regular intervals on the frequency spectrum, it has been adopted in a lot of signal processing applications. Referring to Figure 3, it can be inferred that comb filter can be applied to reduce the replica frequency bands resulted from down-sampling. The principles of comb filtering, and its application in reducing the replica frequency bands, are explained as follows. For a one-dimensional signal J ( m ) , comb filtering is realized by summing the signal and its delayed version as
J C ( m ) = 0.5 × [ J ( m ) + J ( m T ) ]
where T is the delay. In the frequency space, we have
J ˜ C ( ω ) = 0.5 × J ˜ ( ω ) × [ 1 + e x p ( i ω T ) ]
The transfer function is given by
C ˜ ( ω ) = J ˜ C ( ω ) J ˜ ( ω ) = 0.5 × [ 1 + e x p ( i ω T ) ]
The magnitude of the transfer function in Equation (11) takes the form of a periodic band-stop filter, with notches (i.e., frequencies at which C ˜ ( ω ) = 0 ) at frequencies ω = ( 2 j + 1 ) π T | 0 j < T . By setting the delay T to be half of the down-sampling factor (i.e., T = τ 2 ), the comb filter can be used to suppress the odd replicas in the spectrum of a down-sampled signal. To illustrate this, the spectrum of a four times down-sampled sequence (i.e., τ = 4), and the transfer function of a comb filter with T = τ 2 = 2 , is shown with the continuous line and the dotted line in Figure 5a, respectively. It can be seen that the notches of the filter transfer function are aligned with the first and the third replica spectrum. The result of filtering the down-sampling signal with the comb filter is shown in Figure 5b. After filtering, the number of replica spectrum is reduced to 2, and the spectrum is similar to a signal that has been down-sampled by two times, i.e., half of the original down-sampling factor.
The above principle can be extended to a 2-D signal. For a 2-D down-sampled signal J ( m , n ) , comb filtering is first applied to each row of pixels to reduce the down-sampling factor along the horizontal direction, i.e.,
J C x ( m , n ) = 0.5 × [ J ( m , n ) + J ( m T , n ) ]
Subsequently, comb filtering is applied on J C x ( m , n ) along the vertical direction as
J C x y ( m , n ) = 0.5 × [ J C x ( m , n ) + J C x ( m , n T ) ]
Equation (13) can be rewritten as
J C x y ( m , n ) = 0.25 × [ J ( m , n ) + J ( m T , n ) + J ( m , n T ) + J ( m T , n T ) ]
Equation (14) shows that the output of the comb filter is the sum of four components. The first component is the original signal J ( m , n ) . The remaining three components are translation of the original signal along the horizontal, vertical, and diagonal directions.

3.2. Enhancing the Reconstructed Image of a SPOH with Time-Division Comb Filtering

Mathematically, the comb filtering expressed in Equation (14) can be applied directly to reduce the down-sampling factor of the reconstructed image I D ( m , n ) . However, this cannot be realized in optical reconstruction. The reason is that when the phase-only hologram H P ( m , n ) is shown on a SLM, the reconstructed image I D ( m , n ) is displayed as an optical image. It is not possible to apply numerical computation on the optical image directly. To apply comb filtering, we propose the TDCF method shown in Figure 6, and described as follows. First, a phase-only sampled phase-only hologram, H P ( m , n ) , is generated. Next, three spatially translated versions of the phase-only hologram, H P ( m T , n ) , H P ( m , n T ) , and H P ( m T , n T ) , with T = τ 2 are obtained. Finally, these four versions of phase-only holograms are sequentially displayed at sufficiently high frame rate on the SLM. Each hologram shows a reconstructed image that is being translated by the same displacement as that of the hologram. This results in the SLM displaying four reconstructed images: I D ( m , n ) , I D ( m T , n ) , I D ( m , n T ) , and I D ( m T , n T ) in rapid succession. These images will be summed into a single image I V ( m , n ) due to persistence of vision of the human perception system. The observed image, as given by
I V ( m , n ) = 0.25 × [ I D ( m , n ) + I D ( m T , n ) + I D ( m , n T ) + I D ( m T , n T ) ]
results in a reconstructed image with the down-sampling factor reduces by two times.

4. Experimental Results

To demonstrate our proposed method, a SPOH of the source image in Figure 2a is generated with the optical setting in Table 1. Downsampling factor τ   = 16 is adopted as it leads to a reconstructed image with better uniformity in intensity distribution. The correlation score between the source image, and the reconstructed image of the SPOH (shown in Figure 2e) is 0.6387, reflecting that the 2 images are similar. TDCF is applied to the numerical reconstructed image in Figure 2e. The average of four shifted versions of the image, based on Equation (14), is computed and the result is shown in Figure 7a. Similar to Figure 2e, the image intensity is normalized to [ 0 , 1 ] and the dynamic range is shown with a greyscale bar. It can be seen that the sparsity of the reconstructed image has been reduced considerably after applying TDCF. The correlation score between the source image, and the reconstructed image of the phase-only hologram obtained with the incorporation of TDCF is 0.7231, which is higher than the reconstructed image of the SPOH.
Next, we employ a phase-only SLM to display the holograms. The SLM is made by Jasper Display Corp. and the model number is JD955B. The resolution is 1920 × 1080, the pixel pitch is 6.4 micron, and the maximum frame rate is 60Hz. The SLM is reflective, and has 2 π phase modulation (256 levels) at 532 nm. No calibration is made before the experiment. A diode-pumped solid state (DPSS) laser with wavelength λ = 532   nm is expanded and used to illuminate the SLM, and the reconstructed image is recorded with a Canon (m6 mark II) with 6960×4640 resolution and pixel pitch 3.19 micron. The four shifted version of the SPOH representing the source image is sequentially displayed in a repetitive manner. As the reconstructed image is contributed by sequentially displaying the 4 holograms on the SLM, the maximum frame rate is reduced to one quarter of that of the SLM, i.e., 60/4 = 15 frames per second. The four reconstructed images, each corresponding to a shifted version of the SPOH, is captured by the camera. The mean of the four reconstructed images is obtained to simulate the persistence of vision property of human eyes. Optical reconstruction of the SPOH before and after TDCF are shown in Figure 7b,c, respectively. The dynamic range of the image intensity is normalized to [ 0 , 1 ] , with 0 and 1 representing the smallest and the largest intensity in the image. A green-scale bar is associated with each image to reflect the relative intensity. Due to imperfection of the optical system, the optical reconstruction is not as good as the numerical reconstruction. However, we observe that with the incorporation of TDCF, the quality of the optical reconstructed image is superior to that of the original SPOH, which is in line with the results obtained in numerical reconstruction. Notably, in Figure 7c, the empty voids that are caused by the down-sampling are reduced, resulting in a more solid and smooth appearance.
To further illustrate the effect of TDCF, refer to a row of the source image, highlighted in grey, in Figure 8a. The intensity variation of this row of pixel for the source image, the reconstructed images of the SPOH before and after applying our proposed method, are shown in Figure 8b–d, respectively. It can be seen that both reconstructed images in Figure 8c,d are down-sampled versions of the source image. However, the sampling interval of the reconstructed image corresponding to our proposed method in Figure 8d is smaller than that of the SPOH in Figure 8c.
Analysis on the same row of pixels is conducted on the optical reconstructed images. Due to the speckle noise of the laser beam, and the imperfection of the optical system, the reconstructed images are contaminated with noise and not as good as the numerical reconstructed images. To lower the noise, the average intensity variations of multiple rows of pixels above and below the row of pixel of interest are computed and shown. This is equivalent to apply low-pass-filtering along the vertical direction to attenuate the high frequency noise signal. The average intensity variations or the row of pixels corresponding to the SPOH before and after applying TDCF are shown in Figure 9a,b. Similar to the results in Figure 8c,d, the sampling interval of the reconstructed image corresponding to our proposed method is smaller than that of the SPOH.

5. Conclusions

Past research has demonstrated that a sampled phase-only hologram (SPOH) can be used to represent an image with acceptable visual quality. However, the reconstructed image is masked with the down-sampling pattern, resulting in a sparse appearance with numerous empty voids. In this paper, we have proposed a method to enhance the quality of the reconstructed image of SPOH. Time-division comb filtering (TDCF) is applied to merge, through the persistence of vision of human perception, four shifted versions of a single SPOH that are sequentially displayed at sufficiently high frame rate with an SLM. The reconstructed image is more solid and smooth as compared with the one obtained with the SPOH alone. As the shifted versions of the SPOH can be obtained with only negligible amount of computation, the complexity of our proposed method is practically identical to the generation of the SPOH itself. This is an obvious advantage over existing methods, such as the generation of complementary sampled phase-only hologram, that require computation of multiple holograms for reducing the sparsity in the reconstructed image.

Author Contributions

P.W.M.T. developed and implemented the method, conducted the experiments and simulation, drafted the manuscript, and served as the corresponding author; J.-P.L. conducted the experiments and simulation, screened the manuscript, provided advice and discussion on the development; H.L. screened the manuscript, provided advice and discussion on the development; T.-C.P. screened the manuscript, provided advice and discussion on the development. All authors have read and agreed to the published version of the manuscript.

Funding

This work is supported by the General Research Fund (GRF) of Hong Kong SAR, China (Grant No: 9042822). This research is also supported by the National Natural Science Foundation of China (NSFC) (61865007), the Key Program of Science and Technology of Yunnan Province [2019FA025], and Ministry of Science and Technology of Taiwan (106-2628-E-035 -002 -MY3).

Conflicts of Interest

The authors declare no conflict of interest.

References

  1. Poon, T.-C.; Liu, J.-P. Introduction to Modern Digital Holography with MATLAB; Cambridge University Press: Cambridge, UK, 2014. [Google Scholar]
  2. Shimobaba, T.; Ito, T. Computer Holography: Acceleration Algorithms and Hardware Implementations, 1st ed.; CRC Press: Boca Raton, FL, USA, 2019. [Google Scholar]
  3. Stolz, C.; Bigue, L.; Ambs, P. Implementation of high-resolution diffractive optical elements on coupled phase and amplitude spatial light modulators. Appl. Opt. 2001, 40, 6415–6424. [Google Scholar] [CrossRef] [PubMed] [Green Version]
  4. Tudela, R.; Labastida, I.; Mart’ın-Badosa, E.; Vallmitjana, S.; Juvells, I.; Carnicer, A. A simple method for displaying Fresnel holograms on liquid crystal panels. Opt. Commun. 2002, 214, 107–114. [Google Scholar] [CrossRef] [Green Version]
  5. Liu, J.-P.; Hsieh, W.-Y.; Poon, T.-C.; Tsang, P.W.M. Complex Fresnel hologram display using a single SLM. Appl. Opt. 2011, 50, H128–H135. [Google Scholar] [CrossRef] [PubMed] [Green Version]
  6. Song, H.; Sung, G.; Choi, S.; Won, K.; Lee, H.; Kim, H. Optimal synthesis of double-phase computer generated holograms using a phase-only spatial light modulator with grating filter. Opt. Exp. 2012, 20, 29844–29853. [Google Scholar] [CrossRef]
  7. Gerchberg, R.W.; Saxton, W.O. A practical algorithm for the determination of the phase from image and diffraction plane pictures. Optik (Stuttg.) 1972, 35, 237–246. [Google Scholar]
  8. Yeom, J.; Hong, J.; Jung, J.; Hong, K.; Park, J.; Lee, B. Phase-only hologram generation based on integral imaging and its enhancement in depth resolution. Chin. Opt. Lett. 2011, 9, 120009. [Google Scholar] [CrossRef]
  9. Makowski, M.; Sypek, M.; Kolodziejczyk, A.; Mikula, G.; Prokopowicz, C. Three-plane phase-only computer hologram generated with iterative Fresnel algorithm. Opt. Eng. 2005, 44, 125805. [Google Scholar] [CrossRef]
  10. Pasienski, M.; DeMarco, B. A high-accuracy algorithm for designing arbitrary holographic atom traps. Opt. Express 2008, 16, 2176–2190. [Google Scholar] [CrossRef] [Green Version]
  11. Leportier, T.; Park, M.C. Generation of binary holograms for deep scenes captured with a camera and a depth sensor. Opt. Eng. 2017, 56, 013107. [Google Scholar] [CrossRef] [Green Version]
  12. Liu, J.-P.; Yu, C.; Tsang, P.W.M. Enhanced direct binary search algorithm for binary computer-generated Fresnel holograms. Appl. Opt. 2019, 58, 3735–3741. [Google Scholar] [CrossRef]
  13. Liu, J.; Li, X. Complex Amplitude Modulation in Real Time Holographic Computation. Signal Recovery and Synthesis, OSA Technical Digest (online); Optical Society of America: Washington, DC, USA, 2014. [Google Scholar]
  14. Li, X.; Liu, J.; Jia, J.; Pan, Y.; Wang, Y. 3D dynamic holographic display by modulating complex amplitude experimentally. Opt. Express 2013, 21, 20577–20587. [Google Scholar] [CrossRef] [PubMed]
  15. Kim, Y.; Lee, J.; Won, Y. Low-noise high-efficiency double-phase hologram by multiplying a weight factor. Opt. Lett. 2019, 44, 3649–3652. [Google Scholar] [CrossRef] [PubMed]
  16. Arrizón, V.; Sánchez-de-la-Llave, D. Double-phase holograms implemented with phase-only spatial light modulators: Performance evaluation and improvement. Appl. Opt. 2002, 41, 3436–3447. [Google Scholar] [CrossRef] [PubMed]
  17. Hsueh, C.; Sawchuk, A. Computer-generated double-phase holograms. Appl. Opt. 1978, 17, 3874–3883. [Google Scholar] [CrossRef] [PubMed]
  18. Tsang, P.W.M.; Chow, Y.T.; Poon, T.-C. Generation of edge-preserved noise-added phase-only hologram. Chin. Opt. Lett. 2016, 14, 100901. [Google Scholar] [CrossRef] [Green Version]
  19. Buckley, E. Real-time error diffusion for signal-to-noise ratio improvement in a holographic projection system. J. Disp. Tech. 2011, 7, 70–76. [Google Scholar] [CrossRef]
  20. Buckley, E. Holographic laser projection technology. Proc. SID Symp. 2008, 39, 1074–1078. [Google Scholar] [CrossRef]
  21. Tsang, P.W.M.; Chow, Y.T.; Poon, T.-C. Generation of patterned-phase-only holograms (PPOHs). Opt. Express 2017, 25, 9088–9093. [Google Scholar] [CrossRef]
  22. Cruz, M. Full image reconstruction with reduced speckle noise, from a partially illuminated Fresnel hologram, using a structured random phase. Appl. Opt. 2019, 58, 1917–1923. [Google Scholar] [CrossRef]
  23. Tsang, P.W.M.; Chow, Y.T.; Poon, T.-C. Generation of phase-only Fresnel hologram based on down-sampling. Opt. Express 2014, 22, 25208–25214. [Google Scholar] [CrossRef]
  24. Tsang, P.W.M.; Chow, Y.T.; Poon, T.-C.; Liu, J.P. Generation and optical display of a binary-sampled phase-only hologram. Chin. Opt. Lett. 2016, 14, 010004. [Google Scholar] [CrossRef]
  25. Tsang, P.W.M.; Poon, T.-C.; Wang, W.; Zhu, X.; Chan, K. Integrating multiple images in a sampled phase-only hologram. Chin. Opt. Lett. 2019, 17, 050901. [Google Scholar] [CrossRef]
  26. Tsang, P.W.M.; Chow, Y.T.; Poon, T.-C. Generation of complementary sampled phase-only holograms. Opt. Express 2016, 24, 23390–23395. [Google Scholar] [CrossRef] [PubMed]
  27. Zhang, Y.-P.; Wang, F.; Poon, T.-C.; Fan, S.; Xu, W. Fast generation of full analytical polygon-based computer-generated holograms. Opt. Express 2018, 26, 19206–19224. [Google Scholar] [CrossRef]
  28. Tsang, P.W.M.; Poon, T.-C.; Wu, Y.M. Review of fast methods for point-based computer-generated holography. Photonics Res. 2018, 6, 837–846. [Google Scholar] [CrossRef]
Figure 1. An example of the grid-cross down-sampling lattice for τ = 8 , and m , n = [ 0 , 8 ] . The cells in white and black, represent sampling and non-sampling points, respectively.
Applsci 10 02732 g001
Figure 2. (a) Source image, (b) reconstructed image with the phase component of the hologram of the source image, mostly invisible with most of the contents removed but with slight edge information, (ce) reconstructed images of the sampled phase-only hologram (SPOH) of the source image with down-sampling factor τ = 8, 12, and 16, respectively.
Applsci 10 02732 g002aApplsci 10 02732 g002b
Figure 3. Frequency spectrum of signal I ( m ) : (a) without down-sampling, (b) after down-sampled by 2 times, (c) after down-sampled by 4 times.
Applsci 10 02732 g003
Figure 4. Proposed method for enhancing the reconstructed image of a SPOH with time-division comb filtering.
Applsci 10 02732 g004
Figure 5. (a) Frequency spectrum of a signal in Figure 2a being down-sampled by τ = 4 times (solid line), and the transfer function of a comb filter with delay T = τ 2 = 2 (dotted line), (b) frequency spectrum of the down-sampled signal after filtering with the comb filter.
Applsci 10 02732 g005
Figure 6. Two-dimensional time-division comb filtering (TDCF) for enhancing the reconstructed image of a SPOH.
Applsci 10 02732 g006
Figure 7. (a) Numerical reconstructed of the SPOH of the source image, based on down-sampling factor τ   = 16, in Figure 1a after applying TDCF, (b) optical reconstructed image of the SPOH, (c) optical reconstructed image of the SPOH after applying TDCF.
Applsci 10 02732 g007
Figure 8. (a) A row in the source image, highlighted in grey, (b) intensity variation of the row of pixels in highlighted in (a), (c) intensity variations of the row of pixels of the reconstructed image of the SPOH with down-sampling factor τ = 16, (d) intensity variations of the row of pixels of the reconstructed image of the SPOH after applying our proposed TDCF.
Applsci 10 02732 g008
Figure 9. (a) Average intensity variations of multiple rows of pixels above and below the row of interest of the optical reconstructed image of the SPOH, generated based on down-sampling factor τ = 16, (b) average intensity variations of multiple rows of pixels of the reconstructed images of the SPOH after applying our proposed TDCF method.
Applsci 10 02732 g009
Table 1. Optical settings for generating the Fresnel hologram.
Wavelength of light ( λ ) 532 nm
Pixel size of hologram and image ( δ ) 6.4 um
Axial distance between hologram and image0.16 m
Down-sampling factor τ 8, 12, and 16

