Article

Decision of Water Quality Measurement Locations for the Identification of Water Quality Problems under Emergency Link Pipe Operation

Department of Civil Engineering, The University of Suwon, Hwaseong-si 445-743, Gyeonggi-do, Korea
*
Author to whom correspondence should be addressed.
Appl. Sci. 2020, 10(8), 2707; https://doi.org/10.3390/app10082707
Submission received: 24 February 2020 / Revised: 8 April 2020 / Accepted: 12 April 2020 / Published: 14 April 2020
(This article belongs to the Special Issue Emerging Issues of Urban Water Systems Modeling and Analysis)

Abstract

:
This study suggests a methodology for the decision of water quality measurement locations in order to identify water quality problems within a pipe network system under abnormal conditions. A water supply system conversion due to the occurrence of tank or pump problems between water supply zones was set as a possible abnormal scenario and the water flow direction sensitivity of the pipeline was quantified to estimate the water quality monitoring priority. The proposed methodology was applied to a new city, A, in South Korea, and the results are analyzed in detail and presented. The proposed methodology can be used as a method to select water quality monitoring points when establishing an operation plan for emergency link pipes. It is also expected that it can be applied in the evaluation of the adequacy of the previously established emergency link pipe operation plan.

1. Introduction

A water supply system is a type of social infrastructure that must supply water in sufficient quantity and with adequate water pressure and water quality. In South Korea, as of 2017, the rate of supplied water reached 96.8% [1], showing that most consumers were using water supply facilities. As the living standards of consumers have standardized upward, demand for a higher quality and quantity of water has emerged relative to the past. However, Korea’s old pipelines (i.e., over 21 years old) total 63,190 km in length [1], accounting for 31% of all pipelines, and the risk of water pollution is expected to continue to increase.
In 2019, a turbid water incident in Incheon and Seoul of South Korea caused great damage to the lives of citizens. As a result, the importance of water quality management in pipes is gradually increasing. The Incheon metropolitan turbid water incident occurred during the water system conversion when the water supply facility (intake system) was inspected without an outage. Sediment that was attached to the pipes was dislodged as the direction of the water flow changed due to the water system conversion [2]. In addition, according to Seoul’s 2004–2009 pipeline accident cases [3], 85 pipeline accidents, from a total of 133 water supply and drainage cases (75%), caused water pollution; most of these accidents were turbidity incidents caused by valve operation. Such water pollution damage not only hurts the corresponding region but can also decrease the reliability of tap water nationwide. Therefore, it is essential to predict and prevent the occurrence of water pollution in advance.
As a by-product of the Fourth Industrial Revolution, the technology to expand the number of measuring instruments in pipelines was secured by the improvement of data storage capacity. However, the installation of measuring instruments in all pipelines has a number of limitations, such as maintenance costs and, in particular, water quality instruments are relatively difficult to understand, install, and operate due to the multiple detection items and inspection cycles compared to a flowmeter. To overcome this limitation, Kessler et al. [4] and Ostfeld et al. [5] proposed methodologies to detect water quality problems by constructing a matrix of pipeline contamination. Recently, as computer performance and data literacy have improved, Alzamora and Ayala [6] proposed a methodology to detect water problems by applying topological algorithms, and Krause et al. [7], de Winter et al. [8] decided optimal water quality measurement points using a greedy algorithm. In addition, Ostfeld and Salomons [9], Ami and Ostfeld [10] applied the multi-objective Non-dominated Sorted Genetic Algorithm-II (NSGA-II) proposed by [11]. Most of the previous literature used fully advection models for water quality analysis. In recent studies, inadequate problems of numerical models [12] and uncertainty issues [13,14,15], such as sensor measurements and model calibration errors, were raised and tackled. As described above, during the last decade research on the location of water quality instruments has been conducted in various detailed fields such as decision procedure proposals, improvement of hydraulic and water quality analysis techniques, and consideration of uncertainties [12,13,14,15,16,17,18,19,20,21,22,23,24,25,26]. However, it is difficult to determine the superiority of the results among these previous studies since the results vary depending on the purpose. Also, research on deciding the water quality measurement points has been focused on man-made accidents with high damage but low probability of occurrence, such as terrorism.
In contrast, Yoo et al. [27] suggested water quality measurement point location by utilizing graph theory and a multi-objective genetic algorithm (MOGA) in consideration of scenarios that can occur commonly, such as single pipeline damage and demand fluctuations. However, the study did not consider situations that could cause large-scale water quality accidents such as water system conversion, and just applied to the simple example network included in EPANET2 software [28]. Considering the cases of pipeline water quality accidents that have occurred on site so far, water quality degradation in pipelines is highly likely to be caused by a change of flow direction. If a single direction of flow in a pipeline is reversed due to a sudden abnormal situation, the sediments that have accumulated inside the pipeline can be swept away and increase turbidity. In order to solve this problem, Ronald et al. [29] proposed a flushing method, that is, a pipe-cleaning technique that uses the flow rate generated when the water inside the pipeline is discharged to the outside by the operation of a valve. However, there is a limit to applying the flushing method to all locations, so most countries do not use this as a tool for regular cleaning. Therefore, there is a need to preemptively determine and manage the pipelines where water pollution can occur and, for this purpose, it is necessary to determine water quality measurement locations in consideration of the possible situations that can arise. In this study, we proposed a methodology for selecting water quality measurement points, considering the sensitivity of the water flow direction by setting a water system conversion due to an emergency situation between water supply areas as the representative abnormal scenario. The proposed methodology was applied to a new city, A, in Korea, and the results are analyzed in detail and presented.

2. Methodologies

2.1. Objectives and Assumptions

One of the biggest causes of contamination of clean water after purification is the sedimentation remaining inside the pipes. The sediment attached to the pipeline is swept in the opposite direction and creates turbid water when the flow direction changes due to various causes. In this study, we attempted to determine the locations where water contamination due to the causes mentioned above can be detected quickly. Firstly, we assumed that for properly designed pipe network systems, pipe water flow change is not frequent within the normal range, but preparations are needed for abnormal situations. In addition, sensor measurement uncertainty was not considered in this study since the detectable turbidity range in the event of a water quality incident depends on the measurement capability of the sensor. Also, it is assumed that the velocity range in the pipeline suggested by the Water Supply Facility Standards [30] satisfies the criteria within the applicable network.
If the change in the flow direction of the pipeline, which is the main consideration of this study, is quantified (e.g., sensitivity), it can be expressed in a 2D graph as shown in Figure 1. The X-axis represents the flow directional sensitivity in abnormal situations and the Y-axis represents the flow directional sensitivity in normal situations. The black circles indicate the pipeline number and the arrows indicate the degree of sensitivity in normal and abnormal situations. Ordinarily, in a normal system, there will be pipelines that frequently change flow direction due to demand fluctuations, and pipelines that do not. This will also be the case for abnormal situations. For example, pipeline 2, which is highly sensitive in normal and abnormal situations, is unlikely to accumulate sediment, so the probability of water contamination will be relatively low. On the other hand, pipeline 4, which has low sensitivity in normal situations but high sensitivity in emergencies, has a high probability of water contamination. Therefore, pipeline 4 should be determined as an important point for water quality measurement, where monitoring and management should be focused.

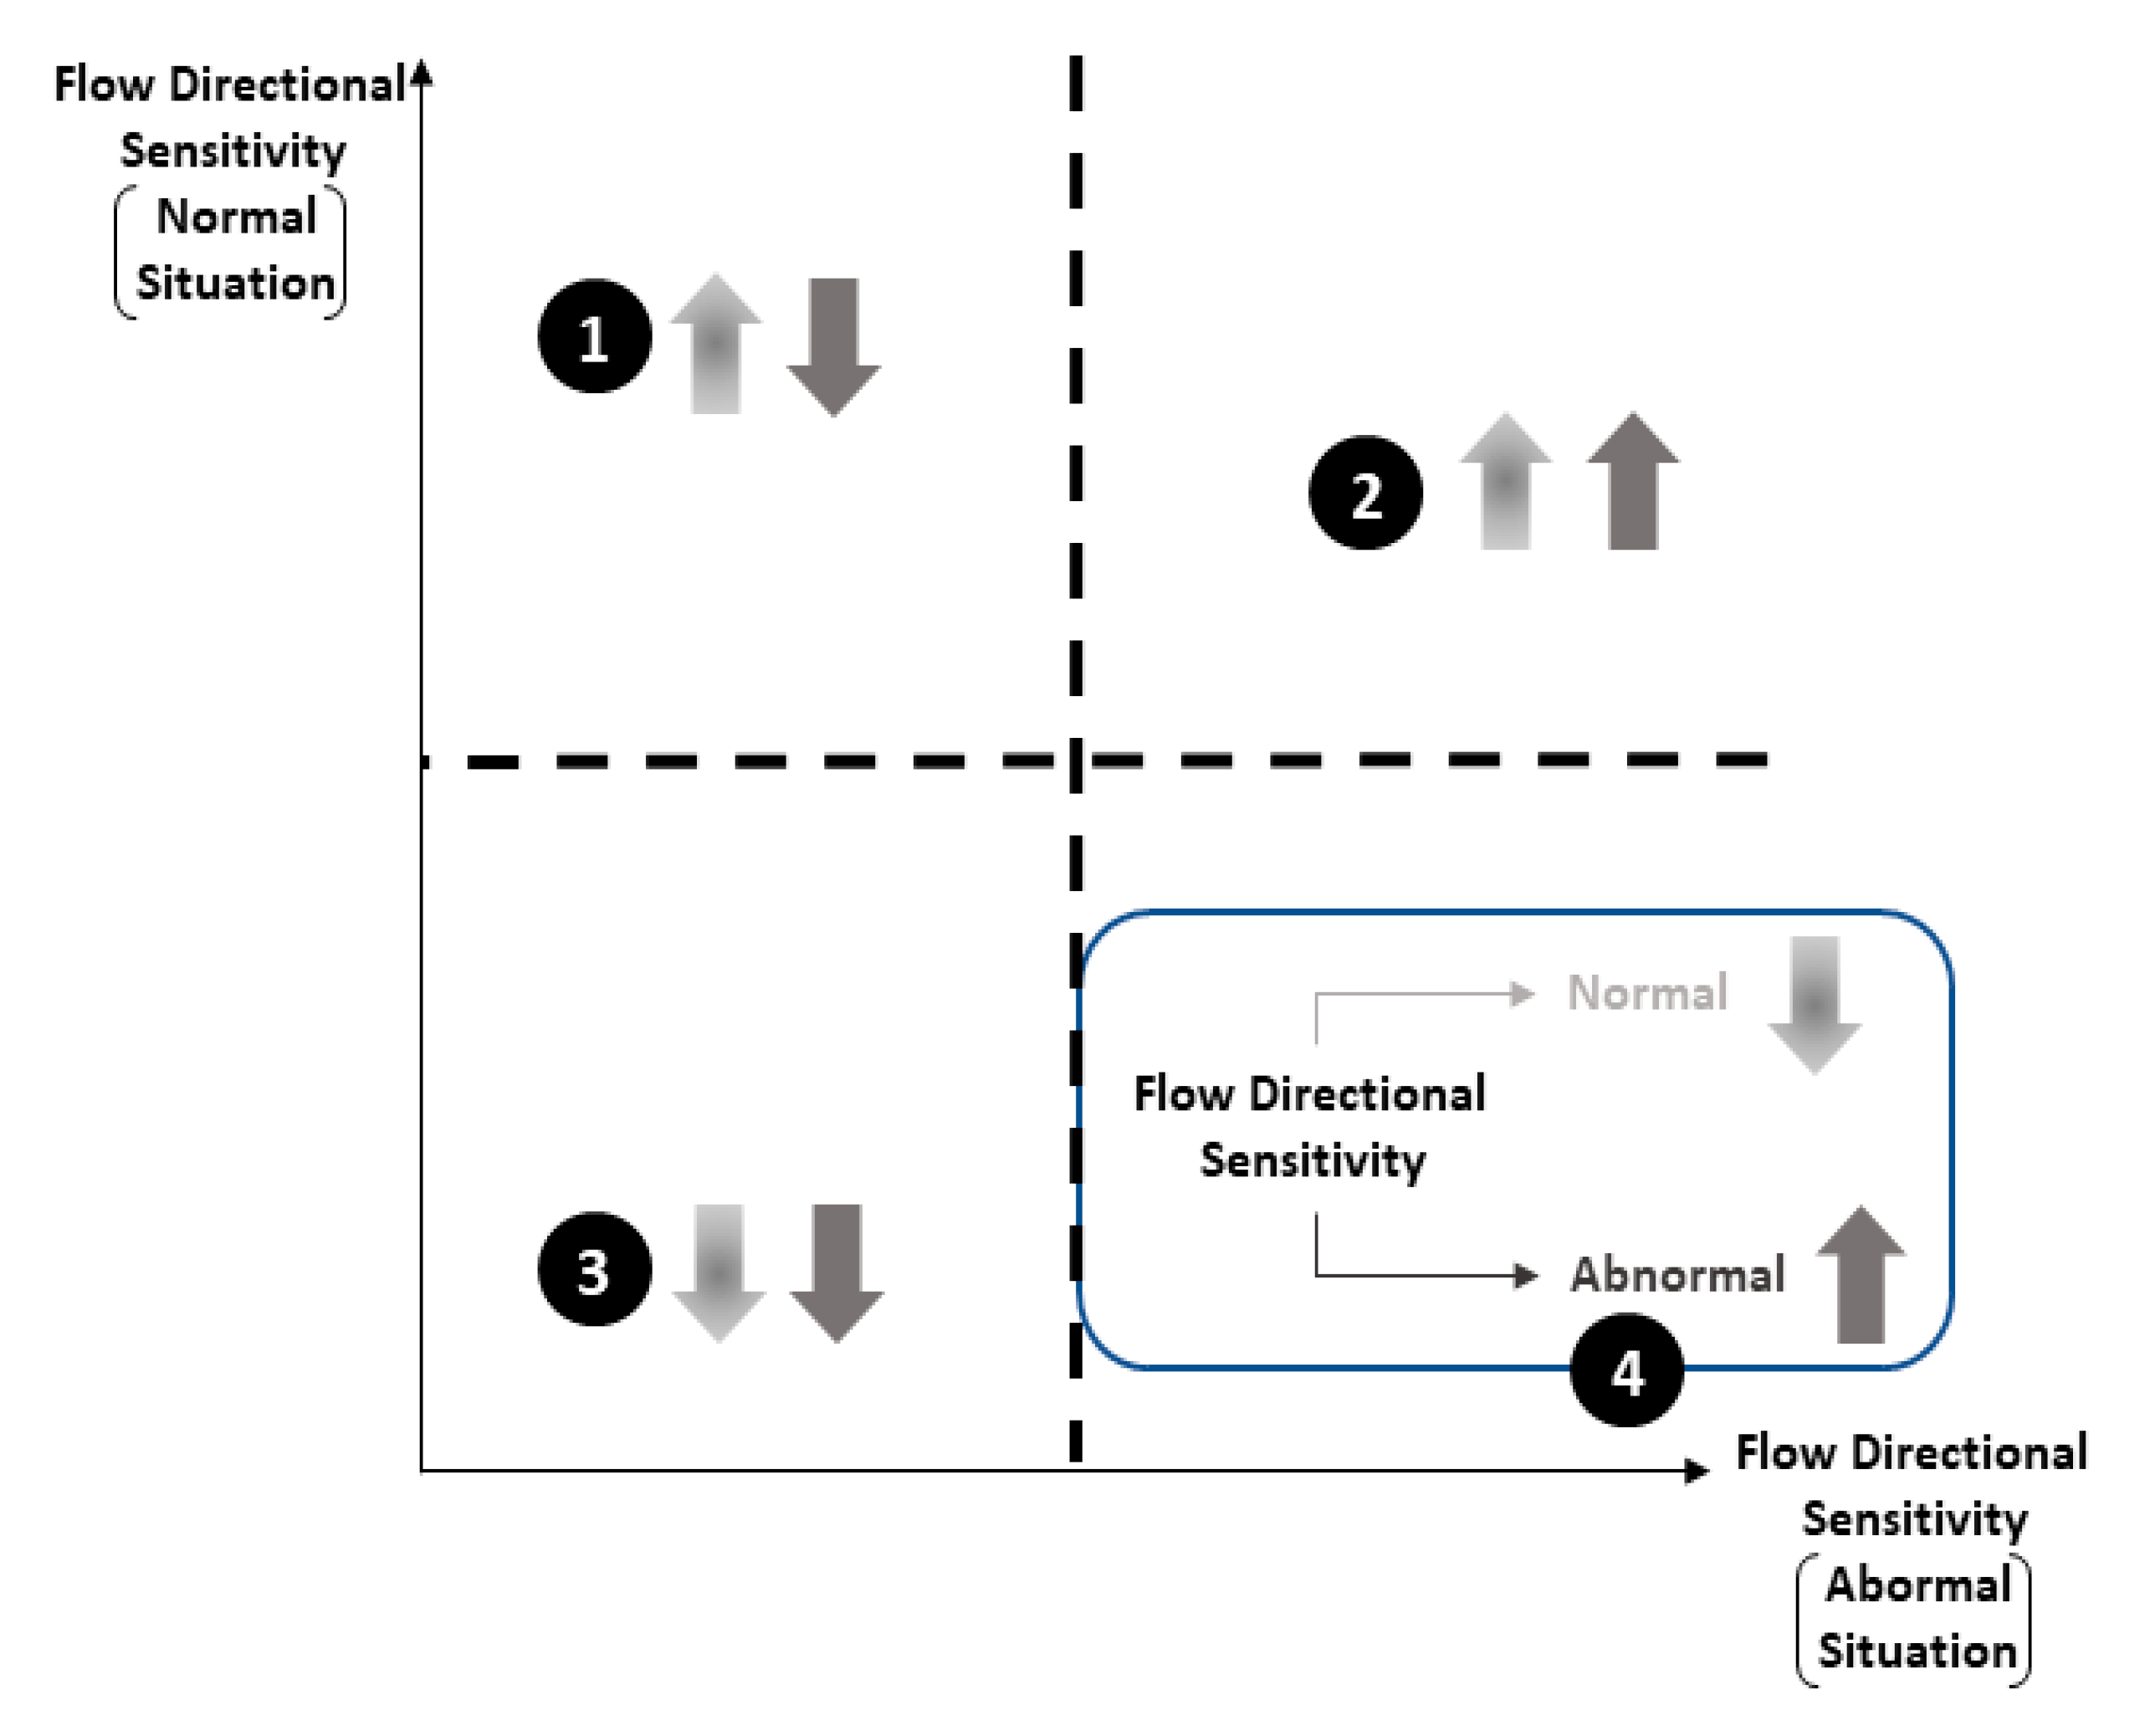
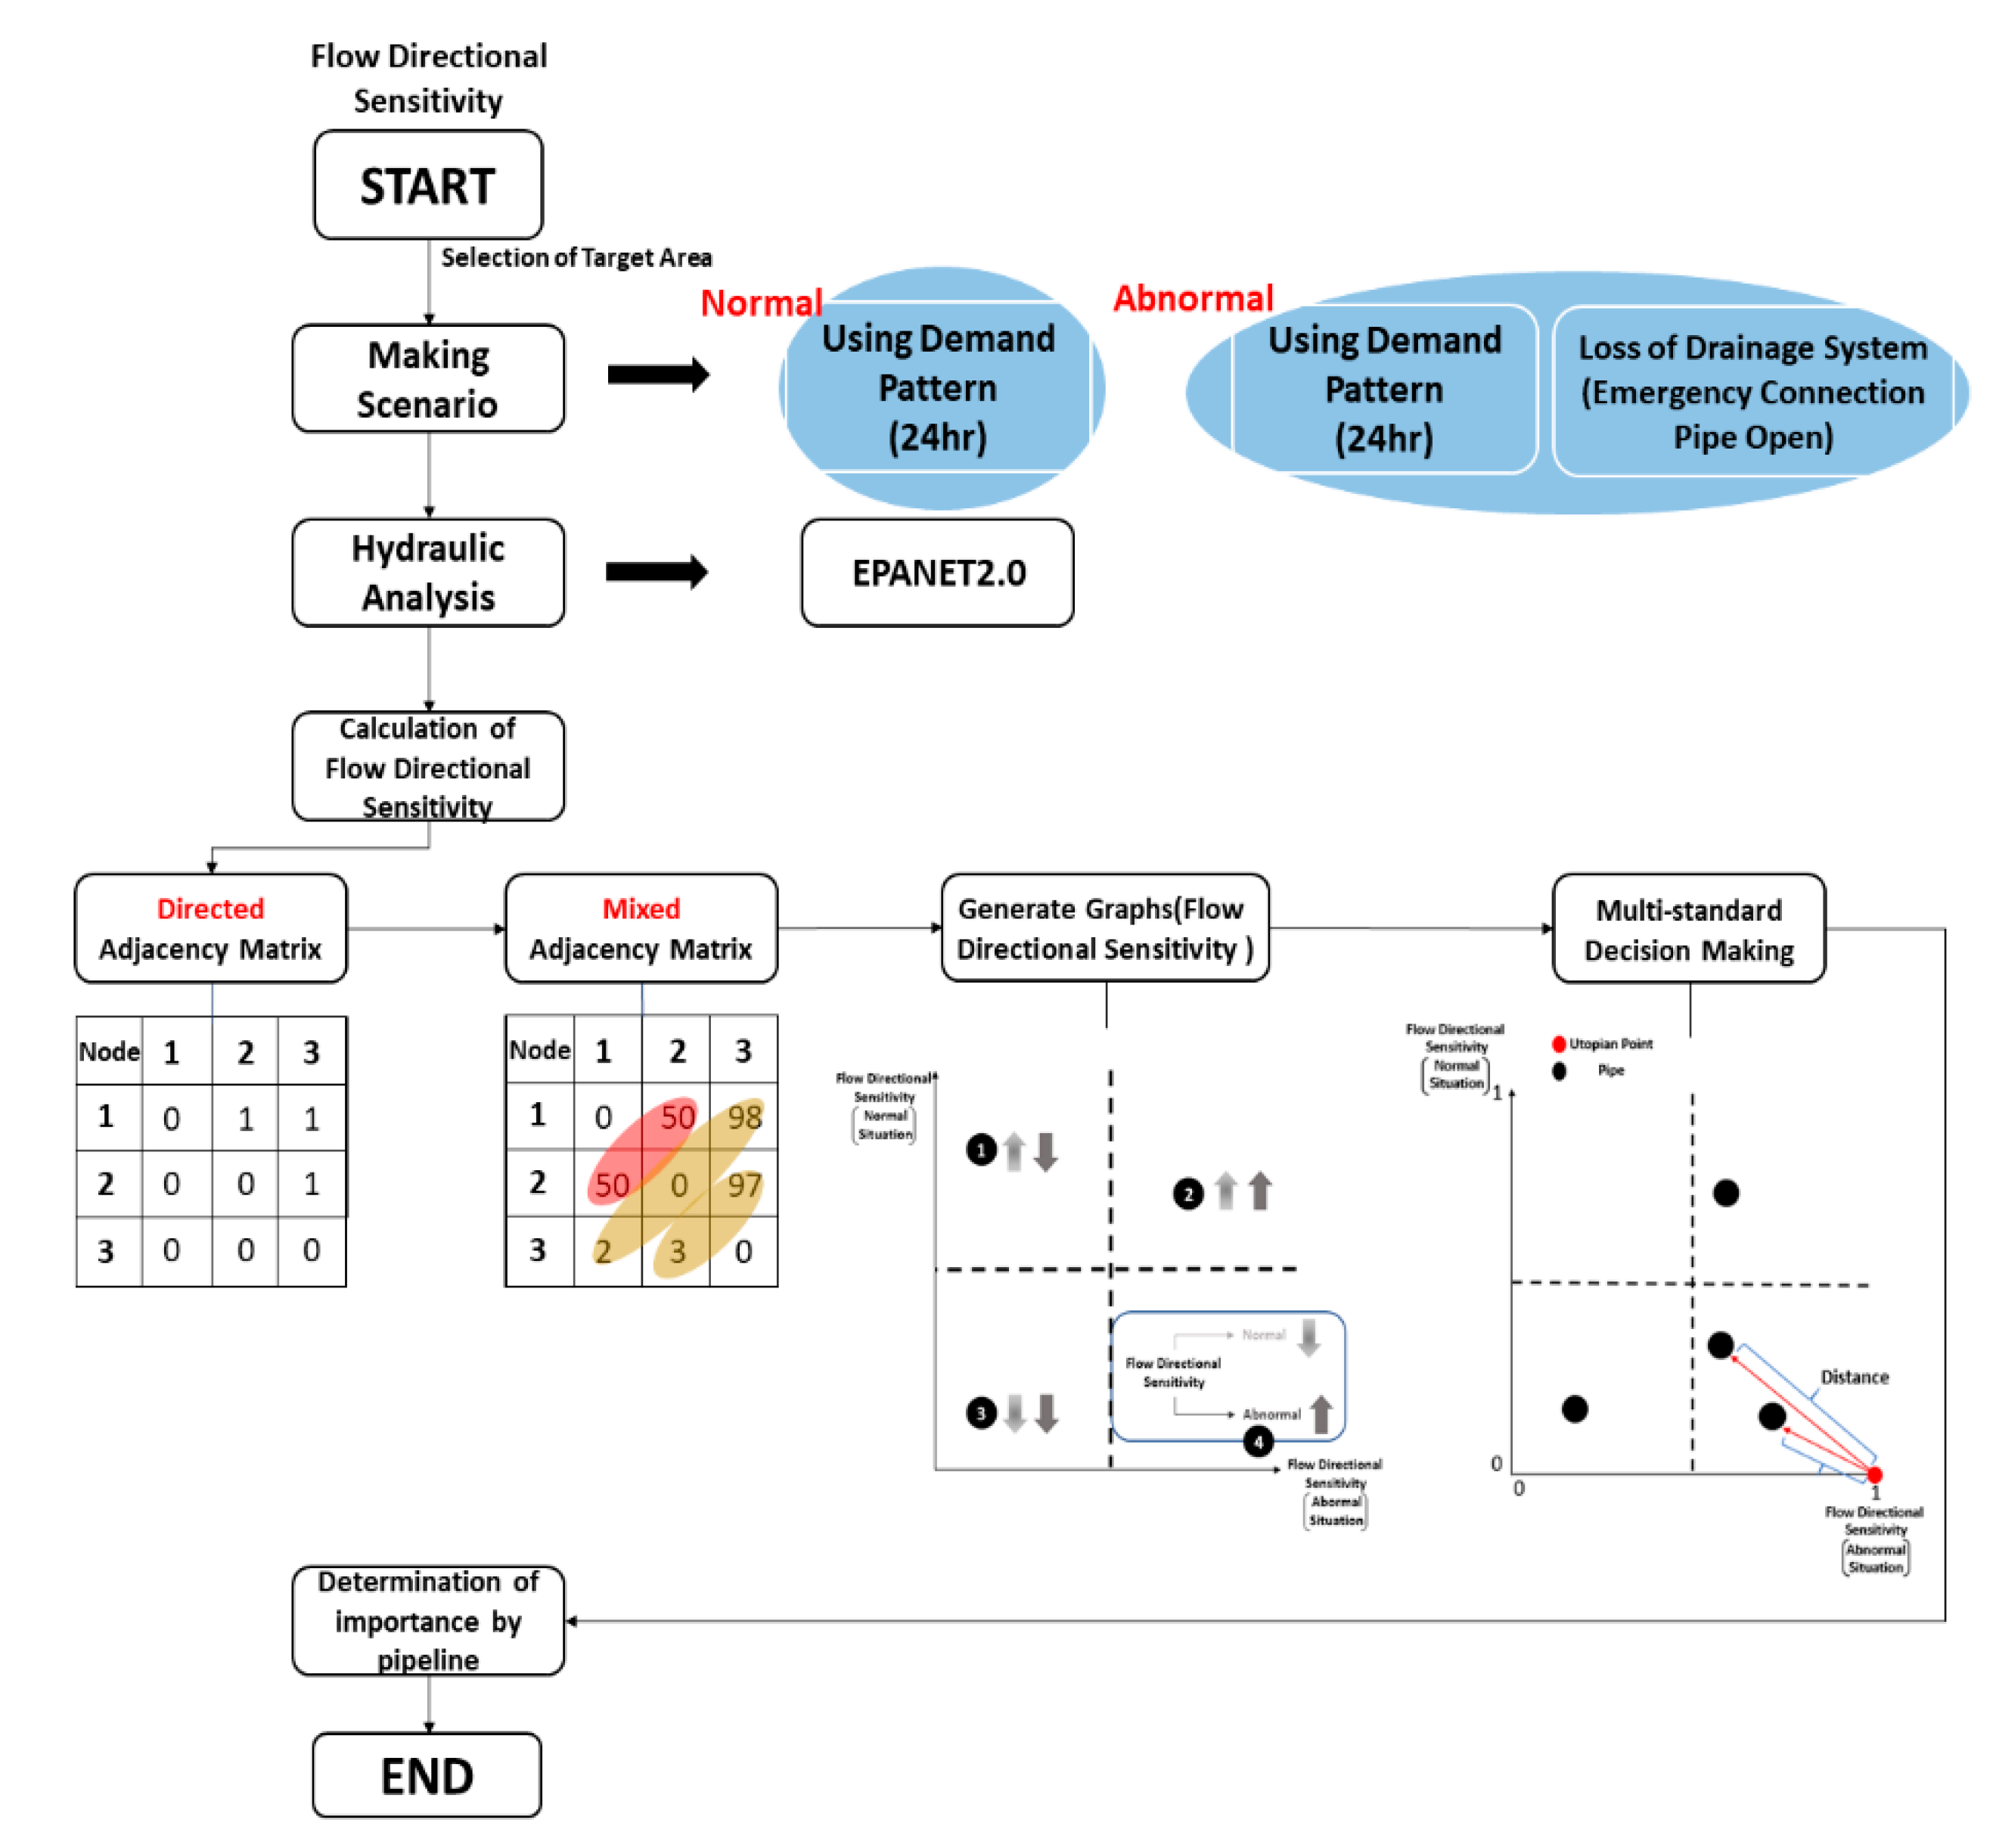
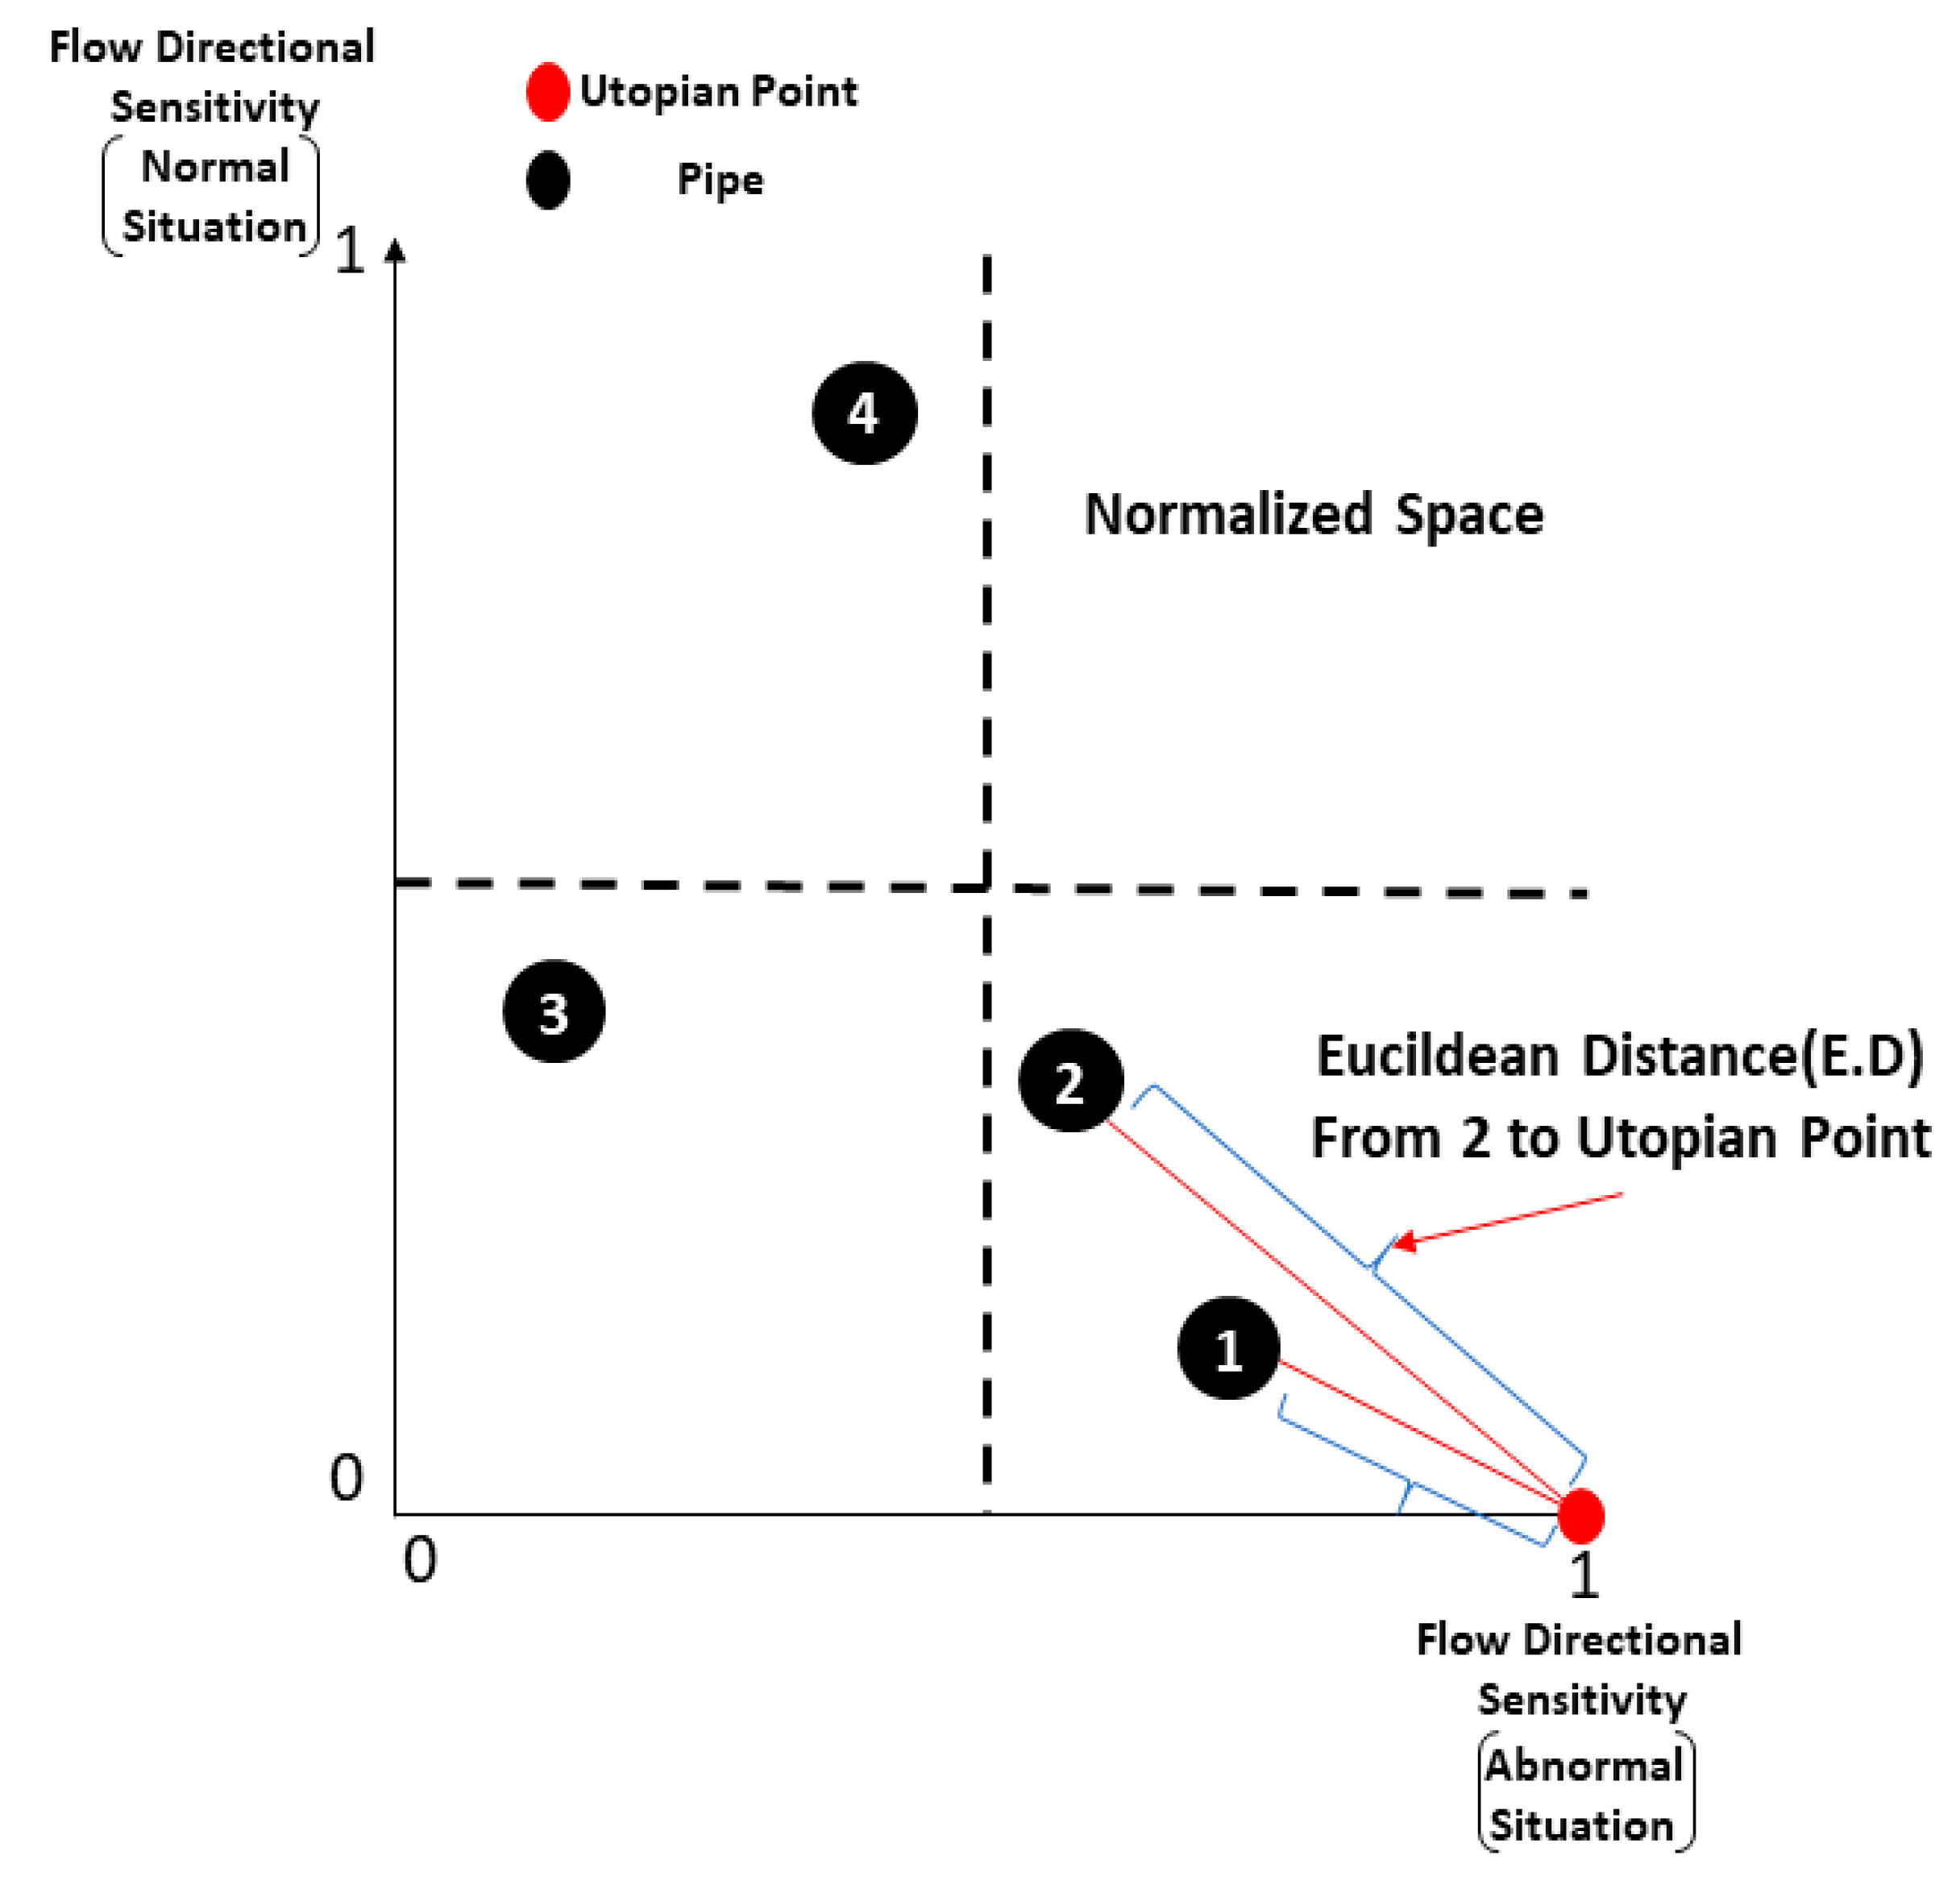
2.2. Water Quality Sensor Location Decision

The constitution of the decision-making method of the emergency water sensor location proposed in this study is shown in Figure 2. First, the network information of the target region is obtained and normal and abnormal scenarios are established. The normal situation scenario utilizes the normal demand pattern of the target region over a 24-h period. For the abnormal situation, it assumes that there is a problem with the supply tank and that the water has to be supplied by operating an emergency connection pipe connected to a nearby regional reservoir. Next, the network information and established scenarios are applied to EPANET2 and hydraulic analysis is carried out. The direction of the flow calculated through the hydraulic analysis is calculated for each scenario, and each direction is visualized through a directed adjacency matrix. The mixed adjacency matrix is formed by adding all of the directed adjacency matrices of each derived scenarios. If there are directed adjacency matrices for 10 scenarios, the minimum value for the mixed adjacency matrix is 0 and the maximum value is 10. The mixed adjacency matrix signifies the directionality between nodes and needs to be converted into pipeline sensitivity, as in Equation (1):
F P S ( i , j ) = M ( i , j ) M ( i , j ) + M ( j , i )
where FPS(i, j) indicates the flow rate (sensitivity) in the direction from node i to node j, and M(i, j) indicates the mixed adjacency matrix from node i (row) to the node j (column). The sensitivity calculated in this way has two values per pipeline so the final sensitivity by pipeline for the normal and abnormal situations needs to be calculated using Equation (2):
P S ( X ) = 1 A B S ( F P S ( i , j ) F P S ( j , i ) )
where PS(X) represents the sensitivity of pipeline X. The calculated sensitivity is plotted on the X-axis (abnormal pipeline sensitivity) and Y-axis (normal pipeline sensitivity). In this case, the number of pipelines corresponding to the area where pipeline 4 is located (Figure 1), which was defined above as an important point, may have a greater number of water quality measuring devices than can be installed by the operator. Therefore, this study applies the Utopian Approach [31], a distance scaling method, to determine the priorities for installation. The Utopian Approach is a multi-criteria decision-making method based on a distance scale. It shows the standard values for each alternative in a normalized space, as shown in Figure 3, and determines the priority according to the distance from the Utopian Point (UP). In this study, the sensitivities to the flow direction change in the pipelines under normal and abnormal conditions, which were calculated above, are shown on the coordinate plane. They are arranged in the order of closeness to the UP and this order is used as the improvement priority. In order to meet the objective introduced above, the UP was set as (1,0) which is the point for high sensitivity in abnormal situations and low sensitivity in normal situations. The Utopian Approach distance equation applied for prioritization is shown in Equation (3):
E u c l i d e a n   D i s t a n c e ( E . D ) = ( 1 A b n o r m a l   P S ( X ) ) 2 + ( N o r m a l   P S ( X ) ) 2

3. Abnormal Scenarios

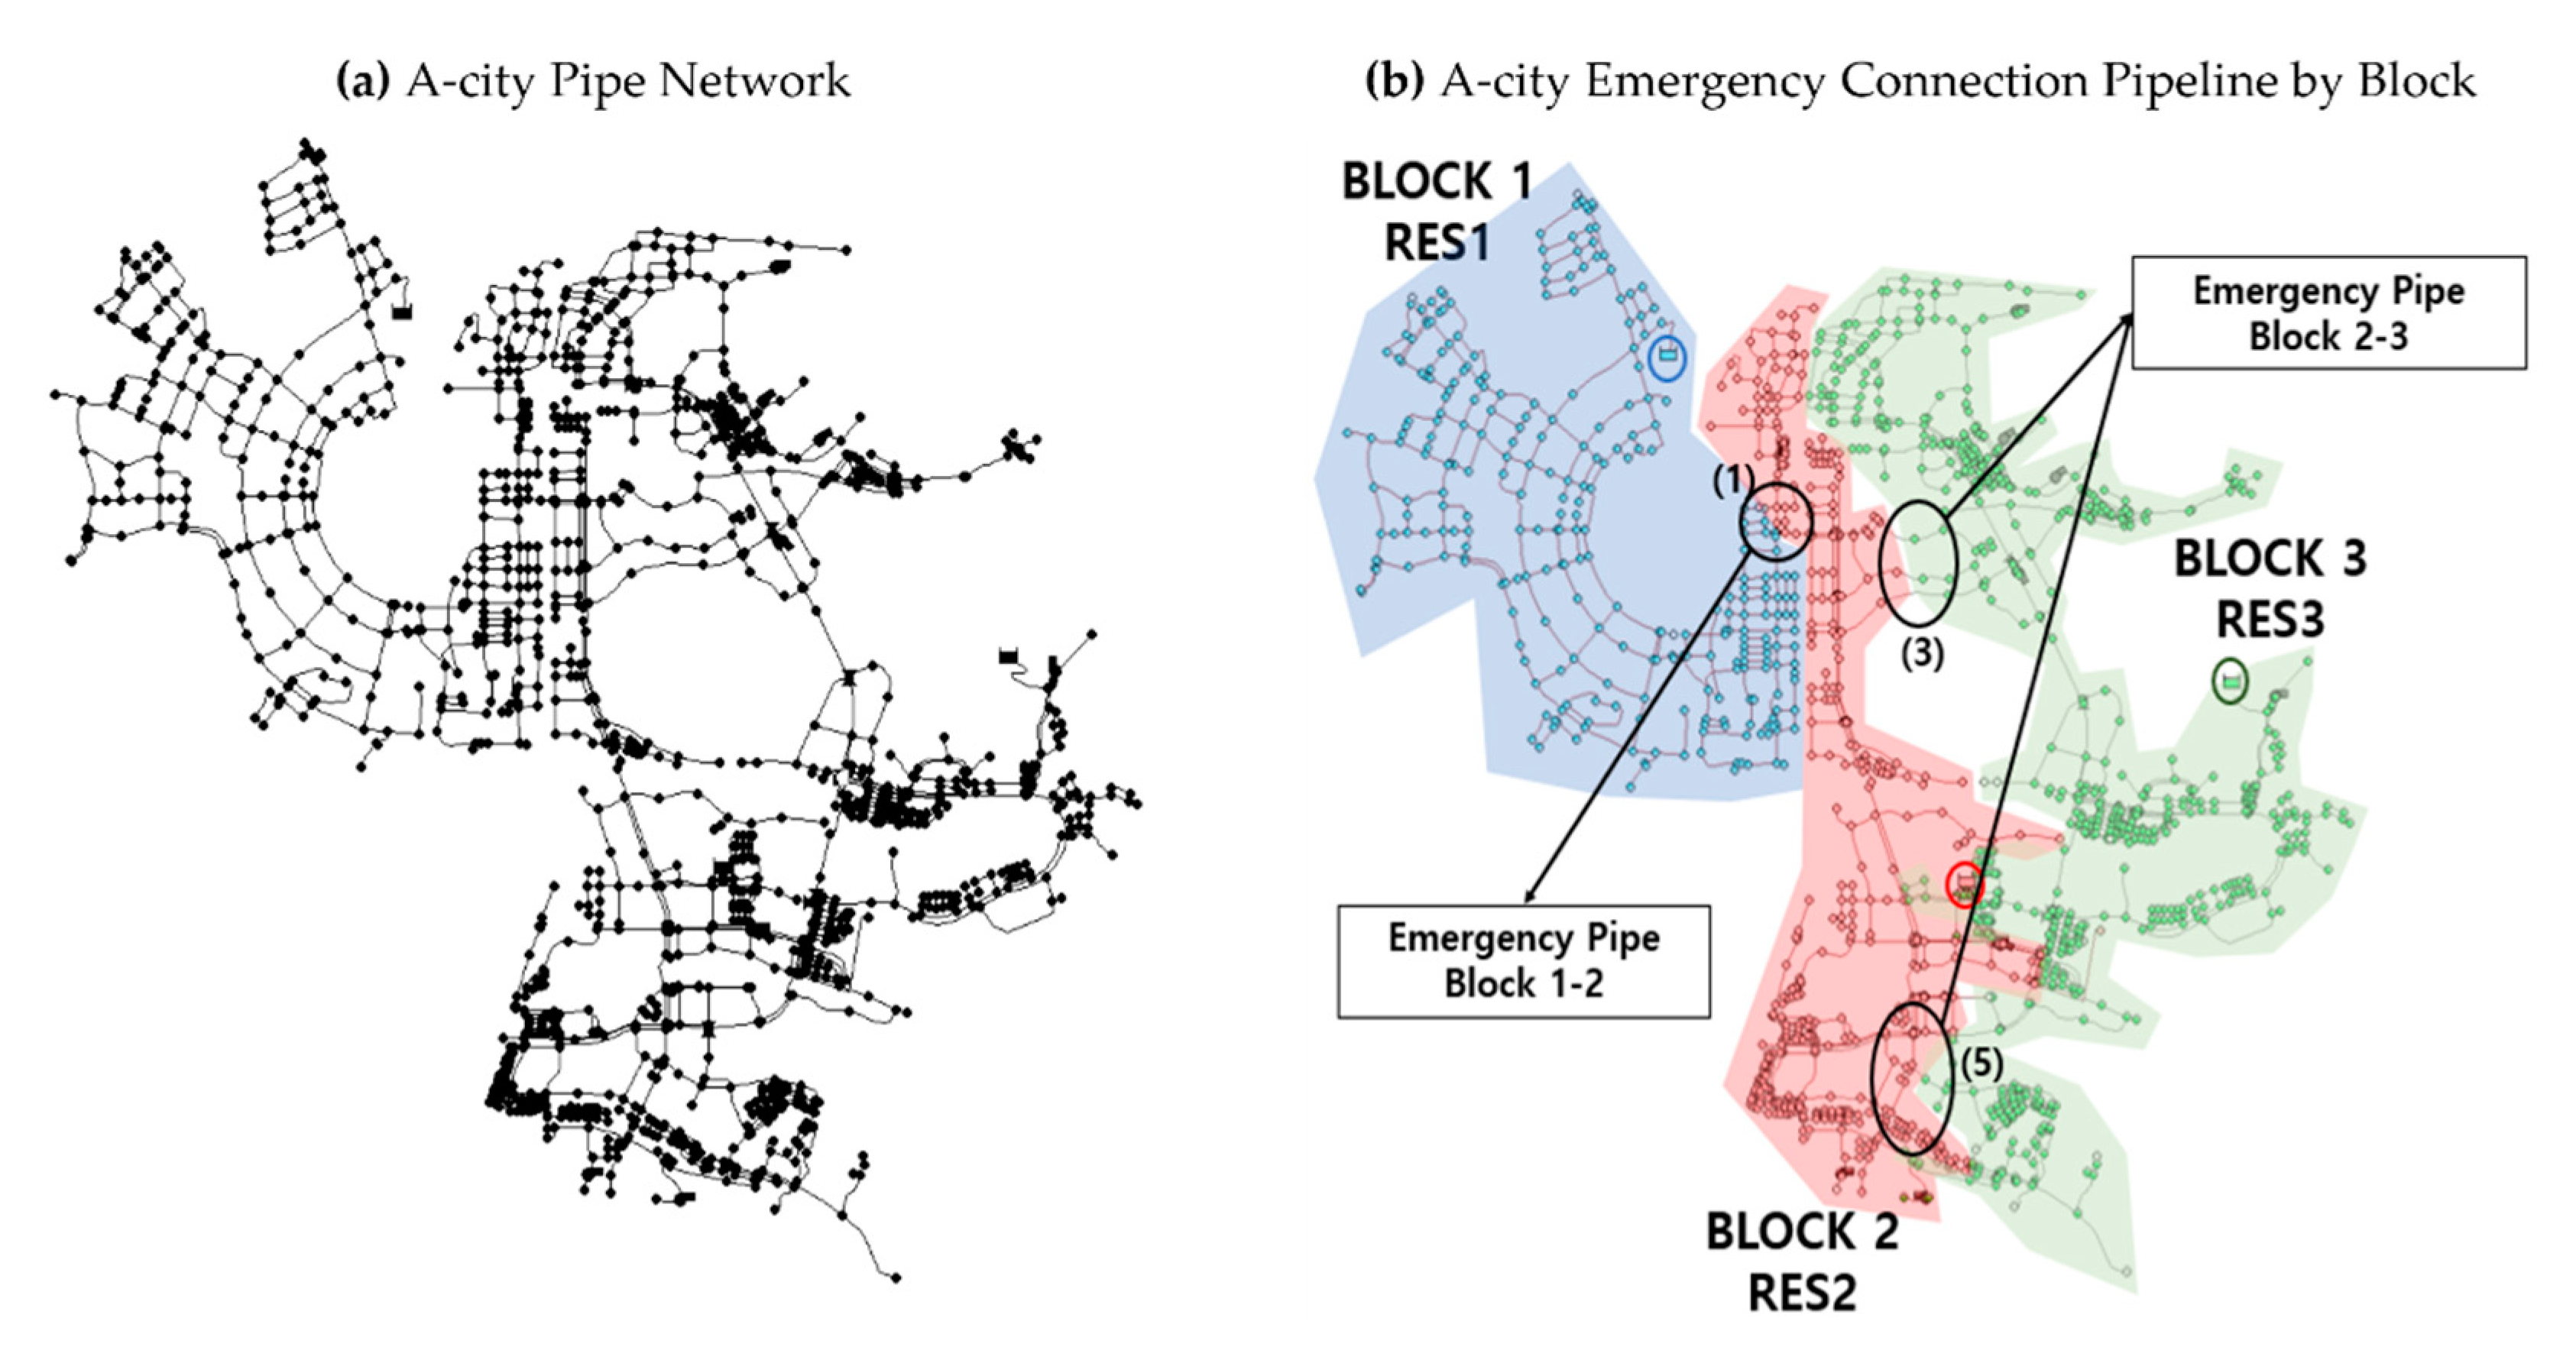
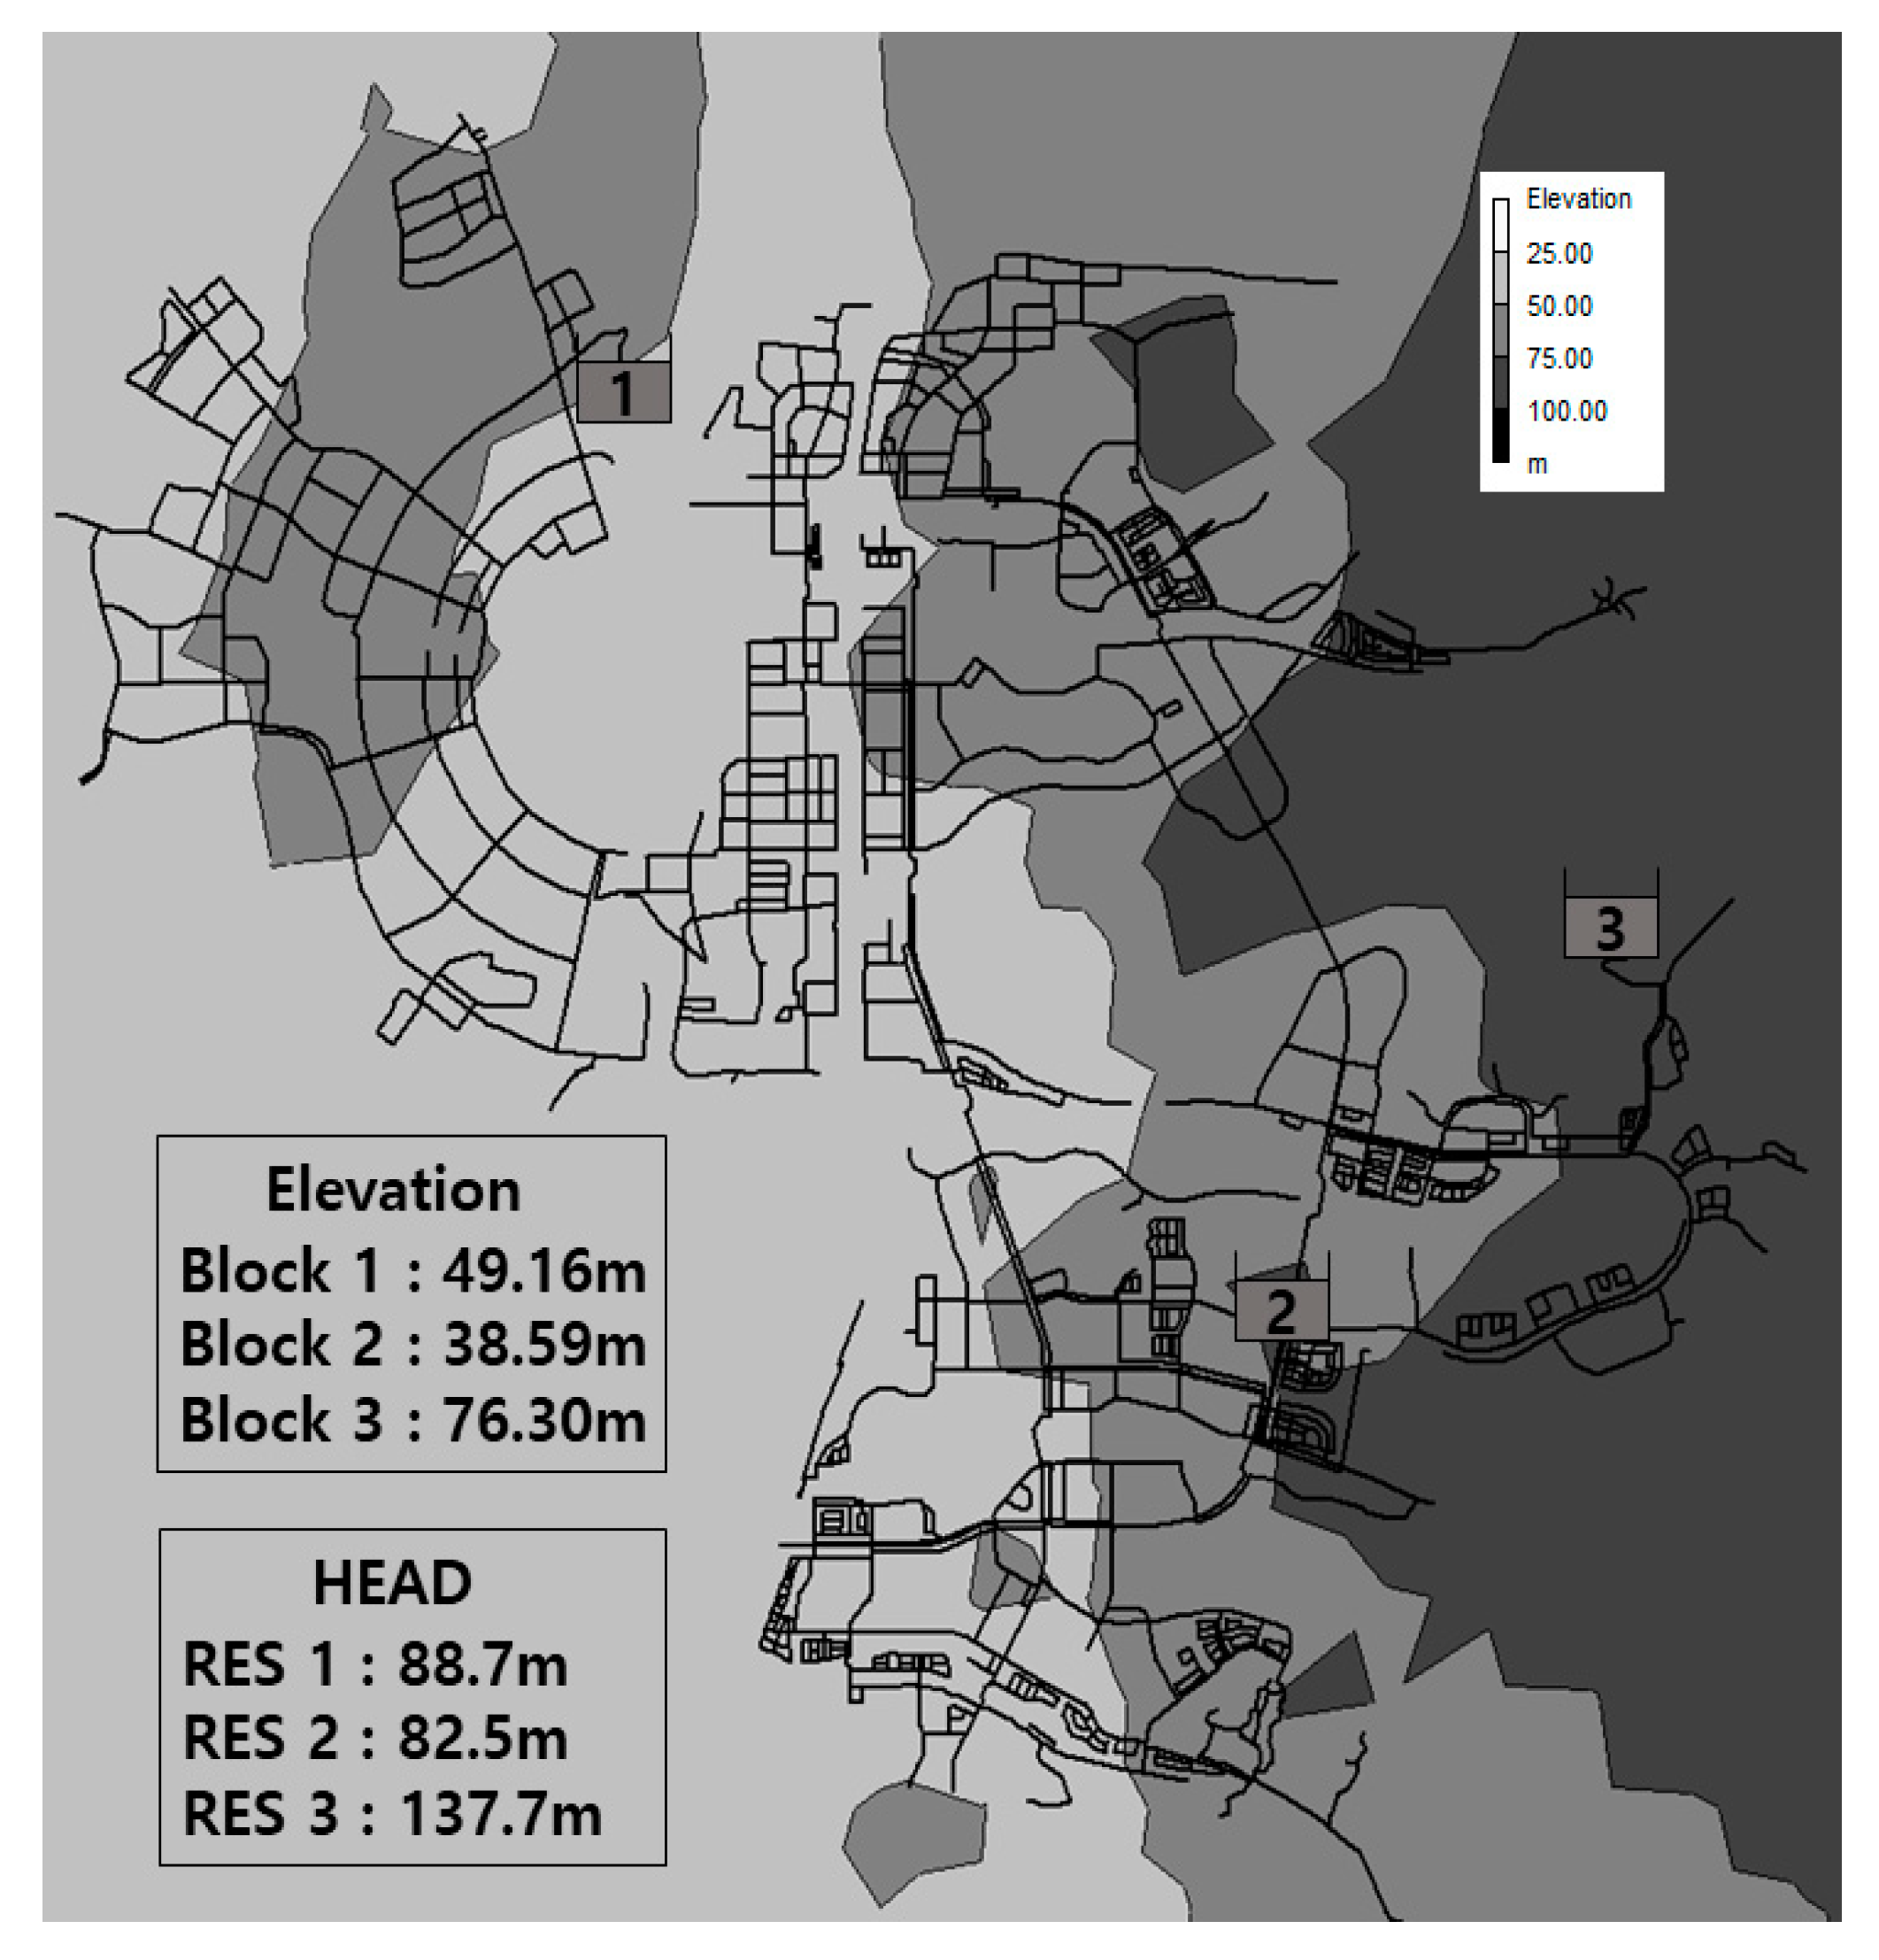
3.1. Target Pipe Network

The method applied in this study was applied to a new city, A, in Korea. The hydraulic calibration issue is an essential step for accurate prediction of the model. This study used the official hydraulic simulation input data from the regional operation institute, which is currently operating the target area. The schematic diagram of city A’s water supply system is shown in Figure 4a. It has three reservoirs that supply 4.5 million tons of water per day to 1492 nodes through 1937 pipelines. Each of the three reservoirs has a block it is in charge of, and the range can be divided as shown in Figure 4b. If an outage occurs due to an accident or inspection in a normal system, the emergency connection pipelines are operated to supply water to the water outage region from a nearby reservoir. The emergency connection pipelines of the target network consist of one pipeline connecting blocks 1 and 2, and nine pipelines connecting blocks 2 and 3 as shown in Figure 4b. In other words, blocks 1–3 are operated with 10 pipelines in the event of emergencies. This study set out to convert the change in the flow direction that may occur from an emergency connection pipeline supply when outages occur by blocks into sensitivity and to determine the water sensor location.

3.2. Water Quality Measurement Location Decision Scenario

In this study, we established a scenario of an abnormal situation in which an outage occurs in an area due to a reservoir’s loss of ability to supply water. For the normal situation, the demand pattern information over a 24-h period was utilized. There are five abnormal cases which are shown in Table 1. It is assumed that situations occur where the three reservoirs individually cannot supply water and, when this situation does occur, the water must be received through the emergency connection pipelines from the surrounding reservoirs in order to minimize the water outage damage. Therefore, scenarios of opening all the emergency connection pipelines that are connected to each block for each situation were established. Block 1 receives water supply from block 2 through the connected emergency pipeline and vice versa. If there is a problem in reservoir 2 and it cannot supply water to block 2, it can receive water through the 10 emergency pipelines connected to blocks 1 or 2. If a problem arises in block 3, it will receive water through the nine emergency pipelines connected to block 2.

4. Application and Results

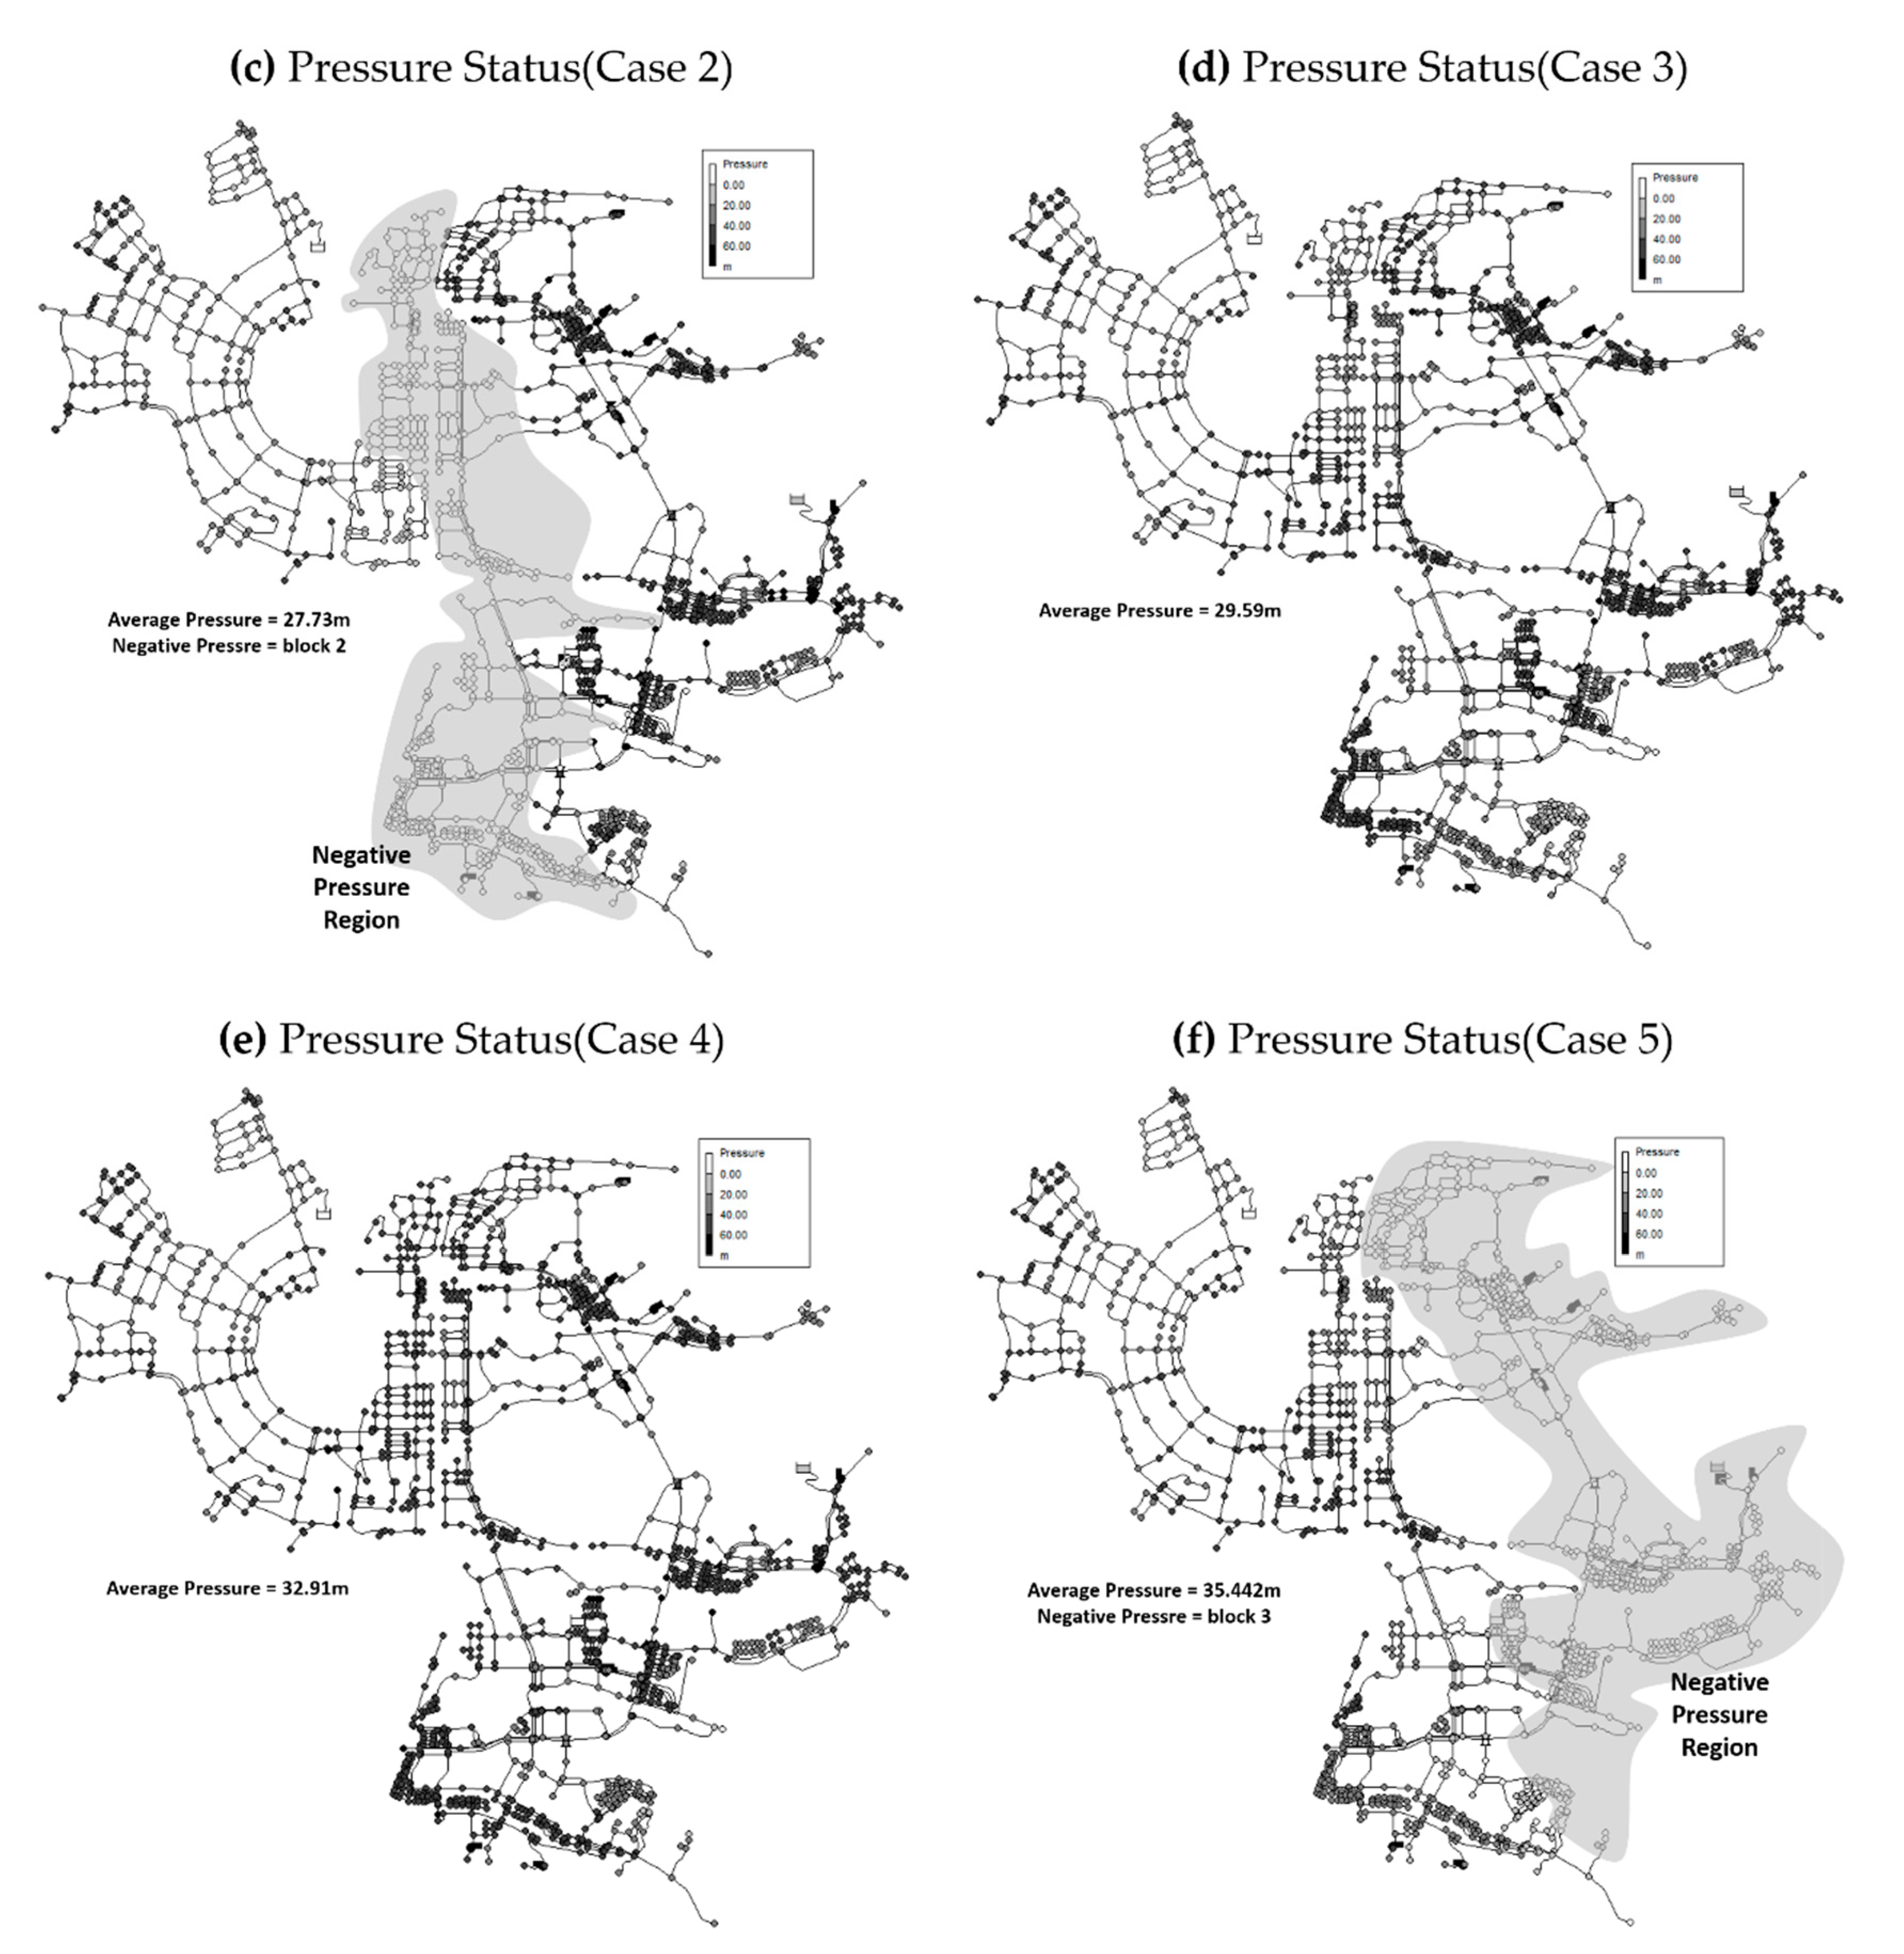
4.1. Emergency Scenario Application Result

The hydraulic analysis results for each scenario are shown in Table 2 and Figure 5. The average A-city pressure is 39.62 m, which satisfies the Korean water supply standard of 1.53 kg/cm2. In the scenarios of the water reservoir capacity loss, the water pressure decreased. However, for cases 1, 2, and 5 (Figure 5b,c,f), negative pressure was generated. Based on EPANET2’s demand driven analysis (DDA), it calculates the pressure at each node under the assumption that the supply quantity satisfies all the demand quantity when it knows the demand quantity of each node. Therefore, there is a limit in that it satisfies the supply characteristic even when water cannot be supplied to the node. In order to replace these unrealistic results, Wagner et al. [32] and Cullinane et al. [33] applied pressure driven analysis (PDA), one of the hydraulic analysis techniques using the head-outflow relationship (HOR). In addition, the method of processing negative pressure based on DDA includes the semi-Pressure Driven Analysis (semi-PDA) method [34] using the Emitter coefficient and the method of calculating the demand quantity based on the proportionality value of the existing water pressure and negative pressure. However, since the purpose of this study is not to assess the water supply capacity of the network, but to assess the sensitivity of the flow direction that may cause water quality problems in the pipeline, it utilized the hydraulic analysis using the DDA-based EPANET2 program. Therefore, when negative pressure occurs, it assumes that water is not supplied to the corresponding node and, although the sensitivity of the flow direction is expressed, it was not considered for the final installation pipeline for a water sensor.

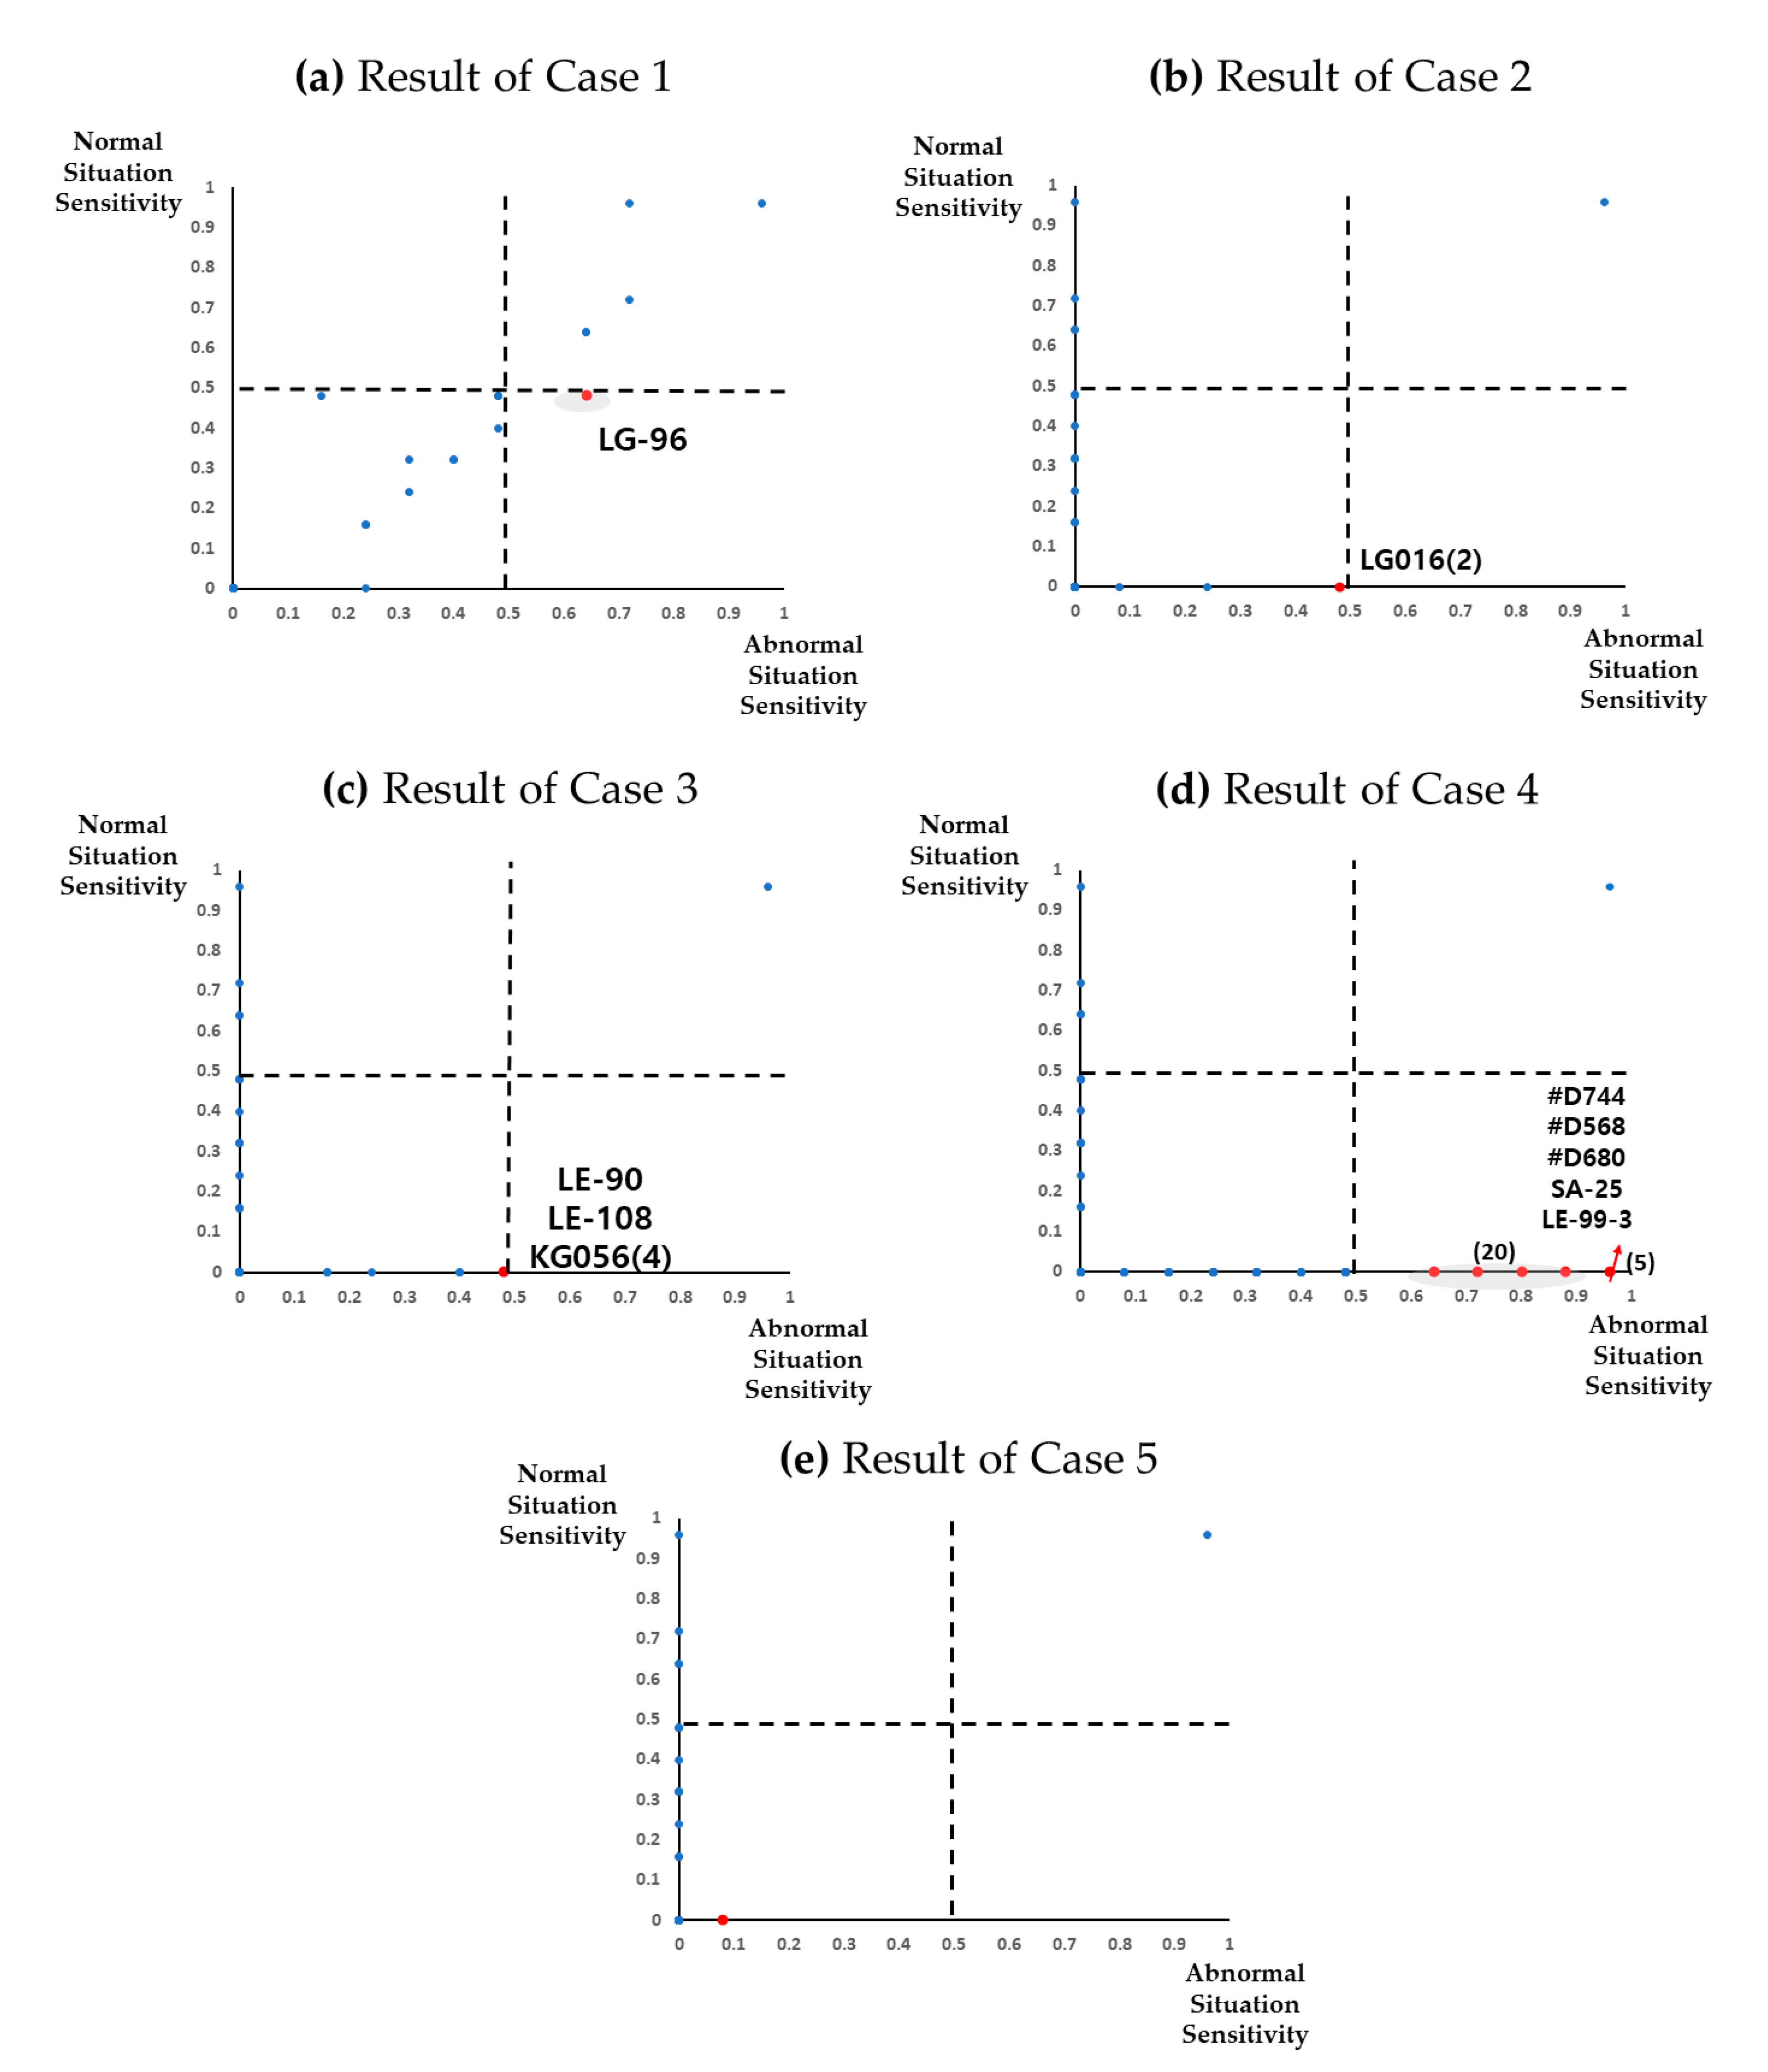
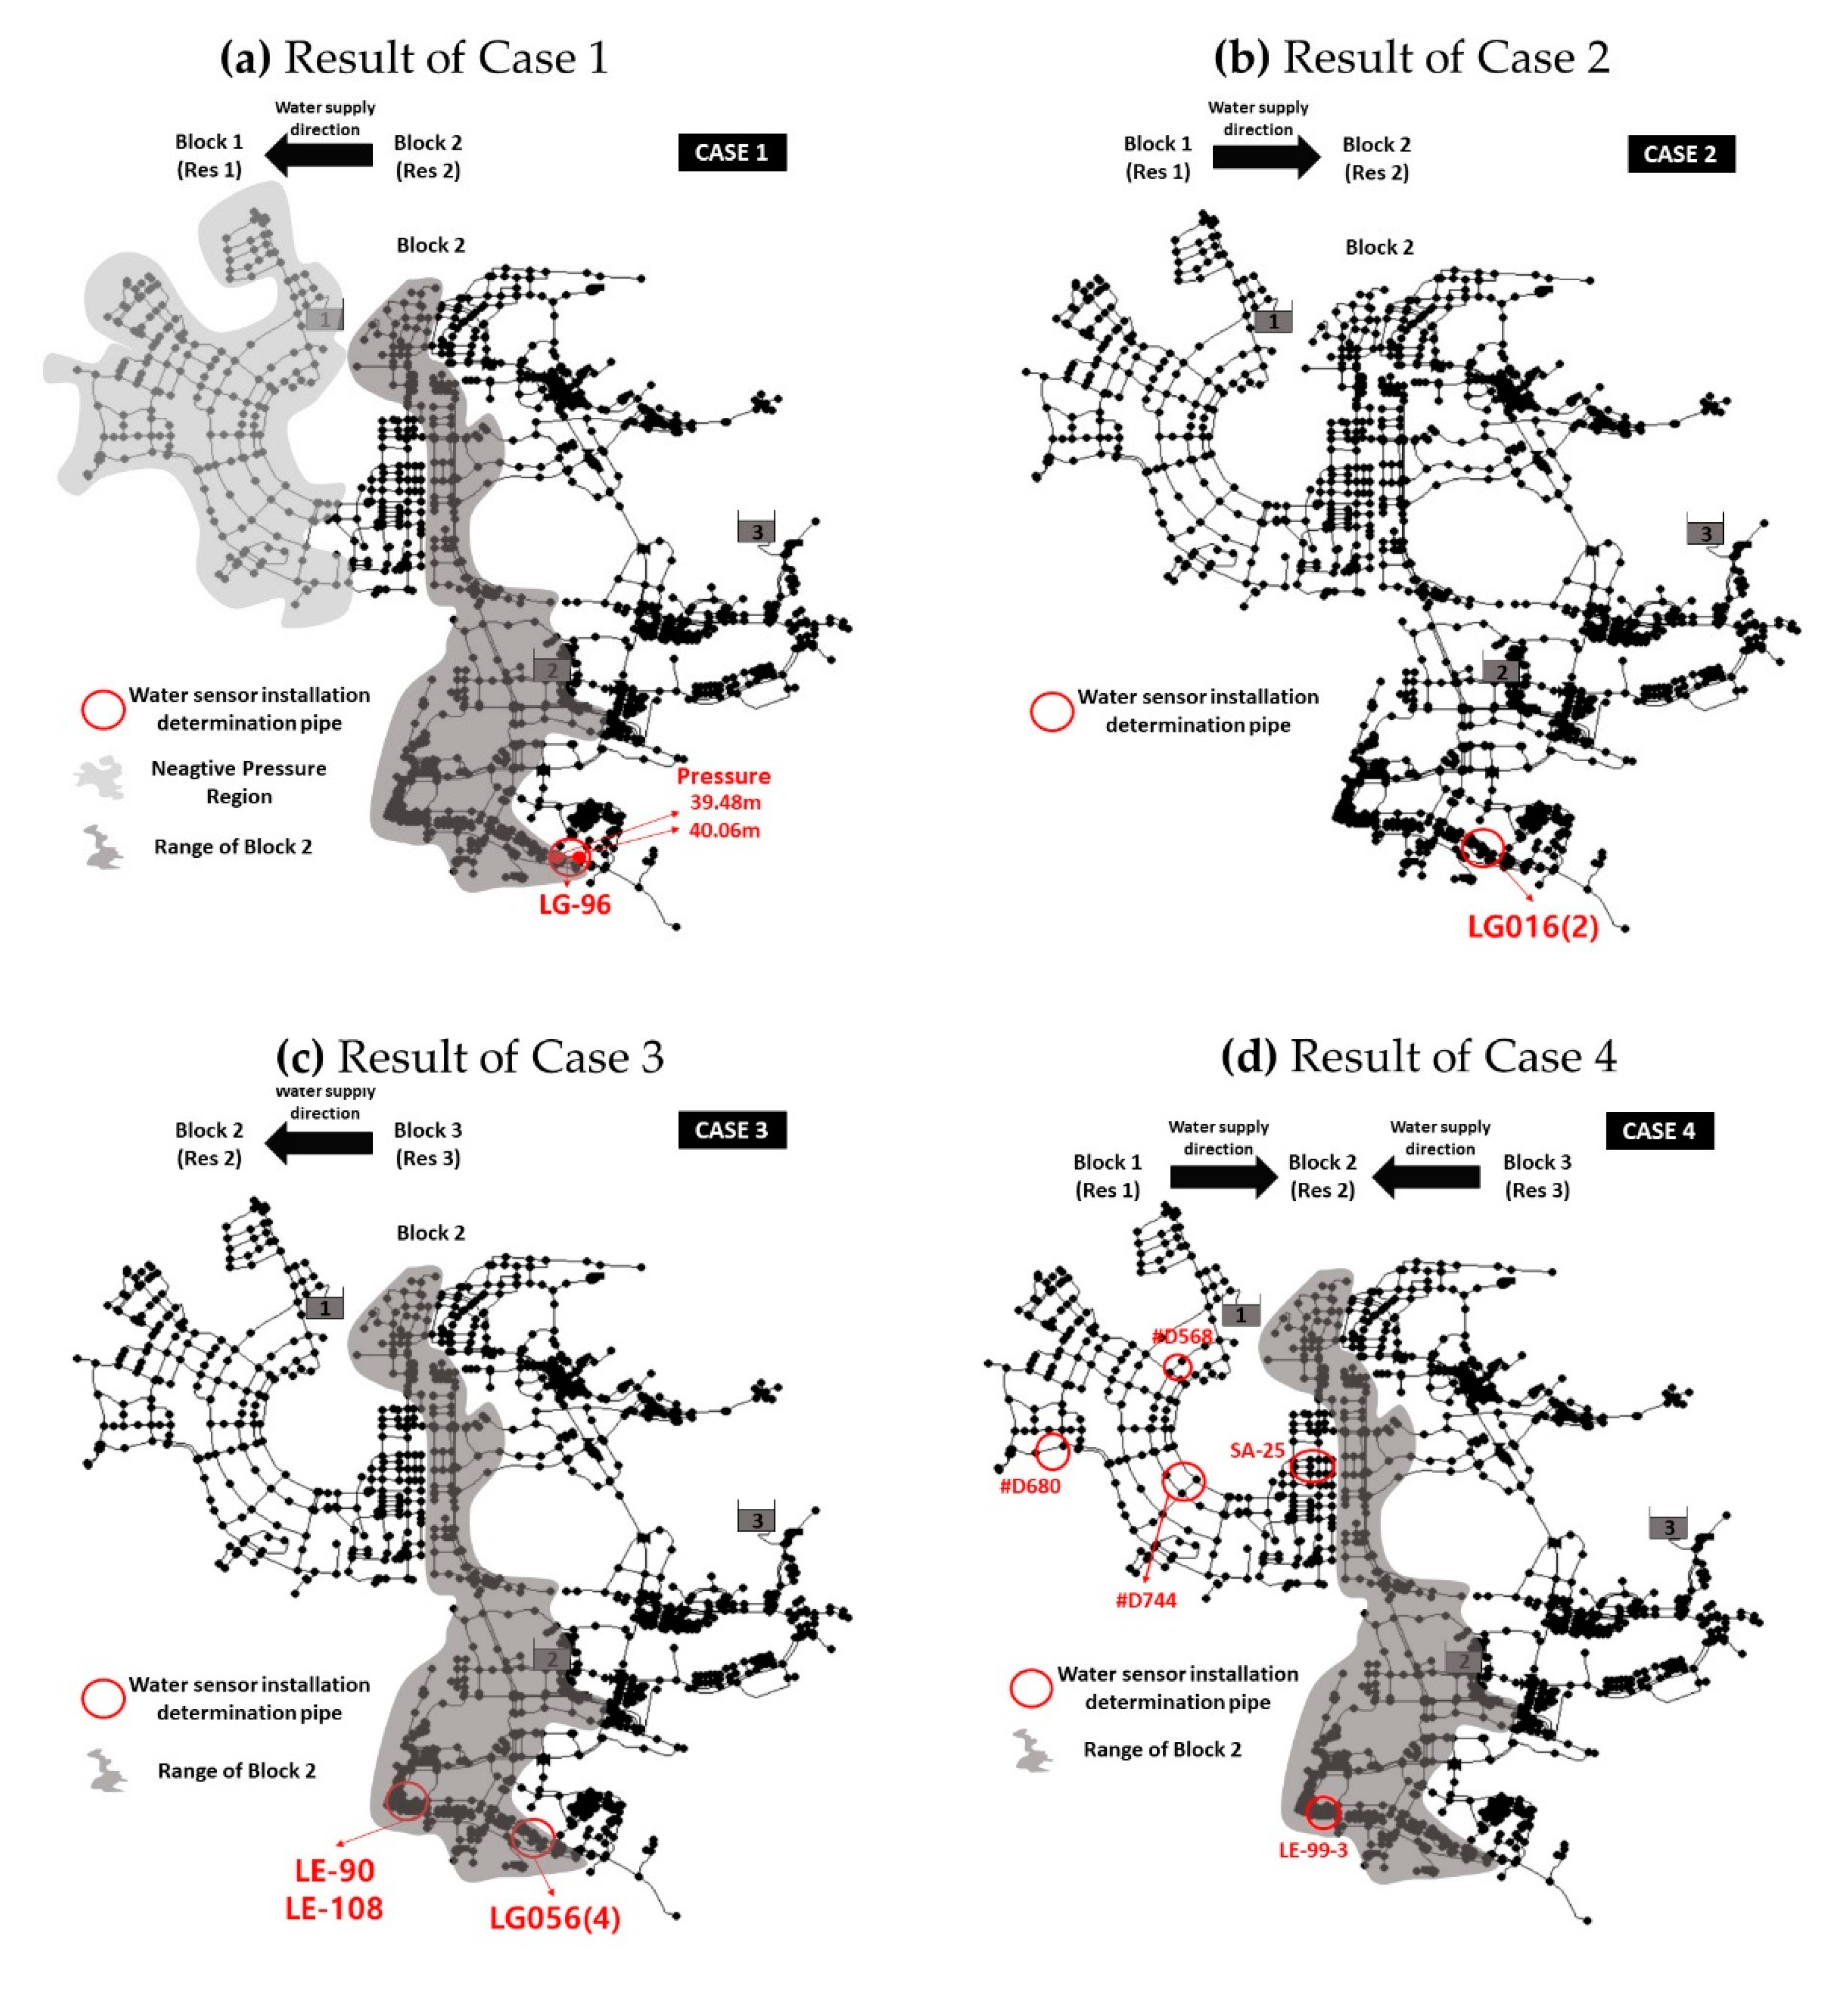
4.2. Decision Result of Water Sensor Installation Pipeline

Based on the methodology proposed in this study, the sensitivity of the flow direction in the pipeline under normal and abnormal conditions is calculated and the priorities for water sensor installation are determined. Results are shown in Figure 6. A graph was generated by estimating the sensitivity in each of the established normal and abnormal situations, and a virtual quadrant was created based on the point (0.5, 0.5) due to the large number of target pipelines. The distance was calculated around the pipeline located in the lower right corner near the ideal point. The size of the generated quadrant may be changed according to the weight. However, there may be cases in which they are not included in the assumed range. For this situation, the pipeline with the highest possibility of water quality contamination was selected for presentation.
Figure 6a is a scenario in which the water supply comes from an emergency connection supply pipeline (one) that is connected to RES 2 due to an outage in drainage block 1. It shows that the LG-96 pipeline was the most sensitive to the change in flow direction in an abnormal situation. In this scenario, negative pressure was generated in block 1 during the supply process. However, as shown in Figure 7a, the LG-96 pipeline was included in block 2, not the block where the negative pressure was generated, and this node formed proper water pressures of 39.48 m and 40.06 m at each end of the pipeline. Therefore, for Case 1, the pipeline requiring water quality measurement was determined to be LG-96.
Figure 6b is a scenario in which the water supply comes from an emergency connection supply pipeline (one) that is connected to RES 1 due to an outage in drainage block 2. It shows that LG016(2) pipeline is the most sensitive to the change in flow direction in an abnormal situation. In this scenario, there are very few connected pipelines for emergency supply compared to the large number of users. Therefore, a large negative pressure was generated in the block 2 region and the value reached−89.22 m. In addition, the relevant pipe was excluded from consideration for a water sensor because Case 1 pipeline belonged to the location where negative pressure was formed as seen in Figure 7b.
Figure 6c is a scenario in which the water supply comes from the emergency connection supply pipelines (nine) that are connected to RES 3 due to an outage in drainage block 2, the same as for Case 2. In this case, LE-90, LE-108, and KG056(4) pipelines changed the flow direction most frequently in an abnormal situation. The above three pipelines are all located in block 2 as seen in Figure 7c. In Case 3, the pressure of the whole system tended to drop by about 10 m but because of the large number of pipelines available from other reservoirs compared to Case 2, no negative pressure was generated. Therefore, the installation of a water sensor should be considered.
Figure 6d is a combined scenario of Cases 2 and 3 in which the water supply comes from the emergency connection supply pipelines (ten) connected to RES 1 and 3 due to a rupture in RES 2. In this case, five pipelines (#D744, #568, #680, SA-25, and LE-99-3) were determined to have the highest sensitivity to the flow direction. Case 4, like Case 3, also received water through a relatively large number of ten emergency connection supply pipelines and although the water pressure tended to drop by about 6 m compared to a normal system, no negative pressure was generated. Therefore, it is determined that the installation of water sensors should be considered in the five pipelines. When the pipelines chosen for the water sensor installation were depicted spatially in a network as seen in Figure 7d, four pipelines were distributed in block 1 and only one pipeline (LE-99-3) was distributed in block 2 where the outage occurred. As can be seen, when the spatial distribution status of all the cases is put together, it shows that the pipelines that have frequent flow direction changes in the pipeline during abnormal situations occur not only in outage regions but also in the blocks supplying water to the outage region. Therefore, there is great uncertainty about the location of potential water contamination during unpredictable emergency situations, and water sensors thus need to be installed in appropriate locations. It is expected that an emergency pipeline operation plan can be established through the application of the results of the scenarios proposed in this study.
Figure 6e is a scenario in which the water supply comes from nine emergency connection supply pipelines from RES 2 due to an outage in block 3. In this case, the closest point was chosen as the red origin but due to the very low sensitivity of 0.1 in abnormal situations, it was decided that it should be excluded from consideration for a water sensor.
Table 3 shows the pipelines for which water sensors should be considered as priority number 1 determined by Figure 6 for each case. One pipeline location for Case 1, three for Case 3, and five for Case 4 were determined for a total of 9 pipeline locations. As a result, as seen in Case 4, there were the most pipelines with frequent change in the flow direction when water was supplied from both reservoirs. As shown in Table 3, when looking at the number of blocks belonging to the determined water sensor points, there are four in Block 1 and five in Block 2. The reason for this can be confirmed by the difference in the ground level of the node in the block receiving the supply and the position head of the reservoir in the supplying block, as shown in Figure 8. The position head of the supply reservoir in Block 3 is 137.7 m and the average ground level of the node is 76.3 m, which is the highest value compared to other blocks, because the flow direction is most often decided to be a single direction. Of course, depending on the operation status and importance of the target network, the priority of the water sensor installation location can be set so that at least one is installed per block.
In Case 4, 25 pipelines, including the determined water sensor installation pipeline, were found to have a very high change in flow direction in cases of emergency, as shown in Table 4, and it was found that they are high compared to other scenarios. Therefore, it is necessary to closely monitor the changes in water quality for scenarios similar to Case 4 when establishing an emergency pipeline operation plan.

5. Conclusions

In this study, we proposed a methodology for determining water quality measurement points considering the sensitivity of the pipe flow direction. The proposed method was applied to the emergency connection pipeline system of an actual region (A-city) and an outage occurrence scenario in a block was considered as an abnormal situation. Five block outage cases were set in which their water supply capacity was lost, requiring connection via adjacent pipelines for the supply of water. Then, a hydraulic analysis program was used to quantify the flow direction sensitivity. The calculated result confirmed that different important pipelines appeared according to each emergency connection pipeline operation scenario. Even if enough water could be supplied, water quality problems may occur in many regions if there is a change in the flow direction in a number of pipelines due to the operation of the emergency connection pipelines. Therefore, it is deemed necessary to investigate these emergency access operational scenarios. The proposed methodology can effectively select the water quality monitoring point when establishing the emergency connection pipeline operation plan, and can be utilized not only to supply sufficient quantity but also to reduce the probability of water quality problems through the operation of the emergency connection pipeline operation. In other words, it is expected to be applicable to the hydraulic and water quality assessment of the previously established emergency connection pipeline operation measures. In the future, research could not only consider flow direction change sensitivity, as considered in this study, but key additional indicators, such as hydraulic gradient, flow velocity in the pipeline, and travel time, could also be comprehensive considered. In addition, future study could also enlarge the range of applicable abnormal scenarios, including valve operation and pipe shut down. It is also necessary to link a more accurate water quality numerical analysis model to judge the applicability to a direct water pollution scenario, such as the intended injection. The improved model can be developed through quantification of uncertainties in sensor data and hydraulic water quality analysis models.

Author Contributions

C.W.L. surveyed the previous studies. C.W.L. wrote the original manuscript. C.W.L. conducted simulations. C.W.L. and D.G.Y. conceived the original idea of the proposed method. All authors have read and agreed to the published version of the manuscript.

Funding

The paper was supported by the research grant of the University of Suwon in 2017.

Conflicts of Interest

The authors declare no conflict of interest.

References

  1. South Korea’s Ministry of Environment (MOE). Water-Supply Statistics; MOE: Sejong, Korea, 2019.
  2. MOE. The Causes and Future Plans of Turbid Water Incident in Incheon; Official brief report; MOE: Sejong, Korea, 2019.
  3. Waterworks Seoul Metropolitan Government, Korea. A Case Study of Accidents in Water Distribution Networks; Seoul Metropolitan Government: Seoul, Korea, 2010.
  4. Kessler, A.; Avi, O.; Gideon, S. Detecting accidental contaminations in municipal water networks. J. Water Resour. Plan. Manag. 1998, 124, 192–198. [Google Scholar] [CrossRef]
  5. Ostfeld, A.; Elad, S. Optimal layout of early warning detection stations for water distribution systems security. J. Water Resour. Plan. Manag. 2004, 130, 377–385. [Google Scholar] [CrossRef]
  6. Alzamora, F.M.; Ayala, H.B. Optimal sensor location for detecting contamination events in water distribution systems using topological algorithms. In Proceedings of the 8th Annual Water Distribution System Analysis Symposium, Cincinnati, OH, USA, 27–30 August 2006. [Google Scholar]
  7. Krause, A.; Leskovec, J.; Isovitsch, S.; Xu, J.; Guestrin, C.; VanBriesen, J.; Small, M.; Fischbeck, P. Optimizing sensor placements in water distribution systems using submodular function maximization. In Proceedings of the 8th Annual Water Distribution System Analysis Symposium, Cincinnati, OH, USA, 27–30 August 2006. [Google Scholar]
  8. De Winter, C.; Palleti, V.R.; Worm, D.; Kooij, R. Optimal placement of imperfect water quality sensors in water distribution networks. Comput. Chem. Eng. 2019, 121, 200–211. [Google Scholar] [CrossRef]
  9. Ostfeld, A.; Salomons, E. Sensor network design proposal for the battle of the water sensor networks (BWSN). In Proceedings of the 8th Annual Water Distribution System Analysis Symposium, Cincinnati, OH, USA, 27–30 August 2006. [Google Scholar]
  10. Preis, A.; Avi, O. Contamination source identification in water systems: A hybrid model trees–linear programming scheme. J. Water Resour. Plan. Manag. 2006, 132, 263–273. [Google Scholar] [CrossRef]
  11. Deb, K.; Agrawal, S.; Pratap, A.; Meyarivan, T. A fast elitist non-dominated sorting genetic algorithm for multi-objective optimization: NSGA-II. In Proceedings of the International Conference on Parallel Problem Solving from Nature, Paris, France, 18–20 September 2000; Springer: Berlin/Heidelberg, Germany, 2000; pp. 849–858. [Google Scholar]
  12. Piazza, S.; Blokker, E.M.; Freni, G.; Puleo, V.; Sambito, M. Impact of diffusion and dispersion of contaminants in water distribution networks modelling and monitoring. Water Supply 2020, 20, 46–58. [Google Scholar] [CrossRef]
  13. Sambito, M.; Di Cristo, C.; Freni, G.; Leopardi, A. Optimal water quality sensor positioning in urban drainage systems for illicit intrusion identification. J. Hydroinformatics 2020, 22, 46–60. [Google Scholar] [CrossRef]
  14. Tsakiris, G.; Spiliotis, M. Uncertainty in the analysis of urban water supply and distribution systems. J. Hydroinformatics 2017, 19, 823–837. [Google Scholar] [CrossRef] [Green Version]
  15. Mukherjee, R.; Diwekar, U.M.; Vaseashta, A. Optimal sensor placement with mitigation strategy for water network systems under uncertainty. Comput. Chem. Eng. 2017, 103, 91–102. [Google Scholar] [CrossRef]
  16. Xu, J.; Fischbeck, P.S.; Small, M.J.; VanBriesen, J.M.; Casman, E. Identifying Sets of Key Nodes for Placing Sensors in Dynamic Water Distribution Networks. J. Water Resour. Plann. Manag. 2008, 134, 378–385. [Google Scholar] [CrossRef]
  17. Xu, J.; Johnson, M.P.; Fischbeck, P.S.; Small, M.J.; van Briesen, J.M. Robust placement of sensors in dynamic water distribution systems. Eur. J. Oper. Res. 2010, 202, 707–716. [Google Scholar] [CrossRef]
  18. Krause, A.; Leskovec, J.; Guestrin, C.; VanBriesen, J.; Faloutsos, C. Efficient Sensor Placement Optimization for Securing Large Water Distribution Networks. J. Water Resour. Plann. Manag. 2008, 134, 516–526. [Google Scholar] [CrossRef] [Green Version]
  19. Watson, J.P.; Murray, R.; Hart, W.E. Formulation and Optimization of Robust Sensor Placement Problems for Drinking Water Contamination Warning Systems. J. Infrastruct. Syst. 2009, 15, 330–339. [Google Scholar] [CrossRef] [Green Version]
  20. Tryby Michael, E.; Marco, P.; Ranjithan, S.R. Monitoring design for source identification in water distribution systems. J. Water Resour. Plann. Manag. 2010, 136, 637–646. [Google Scholar] [CrossRef]
  21. Aral, M.M.; Guan, J.; Maslia, M.L. Optimal Design of Sensor Placement in Water Distribution Networks. J. Water Resour. Plann. Manag. 2010, 136, 5–18. [Google Scholar] [CrossRef]
  22. Cozzolinoa, L.; Mortea, R.D.; Palumbob, A.; Pianeseb, D. Stochastic approaches for sensors placement against intentional contaminations in water distribution systems. Civil Eng. Environ. Syst. 2011, 28, 75–98. [Google Scholar] [CrossRef]
  23. Koch, M.W.; McKenna, S.A. Distributed Sensor Fusion in Water Quality Event Detection. J. Water Resour. Plann. Manag. 2011, 137, 10–19. [Google Scholar] [CrossRef]
  24. Giudicianni, C.; Herrera, M.; Di Nardo, A.; Greco, R.; Creaco, E.; Scala, A. Topological Placement of Quality Sensors in Water-Distribution Networks without the Recourse to Hydraulic Modeling. J. Water Resour. Plan. Manag. 2020, 146, 04020030. [Google Scholar] [CrossRef]
  25. De Winter, C.; Palleti, V.R.; Worm, D.; Kooij, R. Measuring imperfections of water quality sensors in water distribution networks. Meas. Sci. Technol. 2019, 30, 095101. [Google Scholar] [CrossRef]
  26. Di Nardo, A.; Giudicianni, C.; Greco, R.; Herrera, M.; Santonastaso, G.F.; Scala, A. Sensor placement in water distribution networks based on spectral algorithms. EPiC Ser. Eng. 2018, 3, 593–600. [Google Scholar]
  27. Yoo, D.G.; Chung, G.; Sadollah, A.; Kim, J.H. Applications of network analysis and multi-objective genetic algorithm for selecting optimal water quality sensor locations in water distribution networks. KSCE J. Civ. Eng. 2015, 19, 2333–2344. [Google Scholar] [CrossRef]
  28. Rossman, L. EPANet2 User’s Manual; US Environmental Protection Agency: Washington, DC, USA, 2000.
  29. Ronald, A.; Chadderton, G.; Christensen, L.; Henry-Unrath, P. Implementation and Optimization of Distribution Flushing Programs; AWWA Research Foundation; AWWA: Washington, DC, USA, 1992. [Google Scholar]
  30. South Korea’s Ministry of Environment (MOE). Water Supply System Standards; MOE: Sejong, Korea, 2010.
  31. Xanthopulos, Z.; Melachrinoudis, E.; Solomon, M.M. Interactive Multiobjective Group Decision Making with Interval Parameters. Manag. Sci. 2000, 46, 1721–1732. [Google Scholar] [CrossRef]
  32. Wagner, J.M.; Shamir, U.; Marks, D.H. Water distribution reliability: Simulation methods. J. Water Resour Plann Manag. 1988, 114, 276–294. [Google Scholar] [CrossRef] [Green Version]
  33. Cullinane, M.J.; Lansey, K.E.; Mays, L.W. Optimisationavailability-based design of water distribution networks. J. Hydraul. Eng. 1992, 118, 420–441. [Google Scholar] [CrossRef]
  34. Yoo, D.G.; Yoon, J.S.; Lee, H.M.; Kang, D.; Kim, J.H. Development and Application of Leakage Detection Model for Water Distribution Networks Considering Uncertainty Analysis. J. Korean Soc. Hazard Mitig. 2014, 14, 177–185. [Google Scholar] [CrossRef] [Green Version]
Figure 1. Pipeline distinction by flow directional sensitivity.
Applsci 10 02707 g001
Figure 2. Measuring instrument location and prioritization flowchart.
Applsci 10 02707 g002
Figure 3. Utopian Approach method graph.
Applsci 10 02707 g003
Figure 4. Target region information (A-city).
Applsci 10 02707 g004
Figure 5. Hydraulic analysis results for pressure status by case.
Applsci 10 02707 g005aApplsci 10 02707 g005b
Figure 6. Normal and abnormal situation flow direction sensitivity calculation result.
Applsci 10 02707 g006
Figure 7. Decision result of water sensor installation location by case.
Applsci 10 02707 g007
Figure 8. Ground level by block.
Applsci 10 02707 g008
Table 1. Emergency connection supply pipeline operation scenarios in normal and abnormal situations.
Case NumberAbnormal ScenarioNormal Scenario
Problematic ReservoirConnected Reservoir
1RES 1 (Block 1)RES 2 (Block 2)Demand Pattern (24 h)
2RES 2 (Block 2)RES 1 (Block 1)Demand Pattern (24 h)
3RES 2 (Block 2)RES 3 (Block 3)Demand Pattern (24 h)
4RES 2 (Block 2)RES 1 (Block 1)
RES 3 (Block 3)
Demand Pattern (24 h)
5RES 3 (Block 3)RES 2 (Block 2)Demand Pattern (24 h)
Table 2. Pressure dispersion by case.
Block NumberPressure(m)
Normal SituationCase 1Case 2Case 3Case 4Case 5
Block 139.62−18.8129.8238.1239.2338.67
Block 243.1320.17−89.2217.9223.8232.21
Block 336.1135.2735.2232.7435.67−94.28
Average39.6212.21−8.0629.5932.91−7.80
Table 3. A-city measuring instrument location decision priority result (all cases).
Case
Number
Pipe NameLocated BlockAbnormal Situation
Sensitivity
(X-Axis)
Normal Situation
Sensitivity
(Y-Axis)
Distance
(1,0)
1LG-96Block 20.640.480.6
3LE-90Block 20.4800.52
LG056(4)Block 20.4800.52
LE-108Block 20.4800.52
4#D744Block 10.9600.04
#D568Block 10.9600.04
#D680Block 10.9600.04
SA-25Block 10.9600.04
LE-99-3Block 20.9600.04
Table 4. Measuring instrument location decision priority result (Case 4).
PriorityPipe NameAbnormal Situation
Sensitivity
(X-Axis)
Normal Situation
Sensitivity
(Y-Axis)
Distance
(1,0)
1#D7440.9600.04
#D5680.9600.04
#D6800.9600.04
SA-250.9600.04
LE-99-30.9600.04
2LB-670.8800.12
LG072(5)0.8800.12
#D6850.8800.12
3#D6860.800.2
4#D6660.7200.28
SA-240.7200.28
LA-030.7200.28
LE-750.7200.28
MP-240.7200.28
MP-230.7200.28
MP-220.7200.28
LE-74-20.7200.28
LE-940.7200.28
5LG-1060.6400.36
LB-660.6400.36
LB-620.6400.36
LB-600.6400.36
SA-430.6400.36
#D7400.6400.36
#D6230.6400.36

