Article

Seismic Reliability Assessment of Water Supply Systems Considering Critical Paths

1
Department of Civil Engineering, University of Suwon, Hwaseong-si, Gyeonggi-do 445-743, Korea
2
Department of Civil and Environmental Engineering, Cheongju University, Cheongju 360-764, Korea
*
Author to whom correspondence should be addressed.
Appl. Sci. 2020, 10(22), 8056; https://doi.org/10.3390/app10228056
Submission received: 25 September 2020 / Revised: 27 October 2020 / Accepted: 11 November 2020 / Published: 13 November 2020
(This article belongs to the Special Issue Emerging Issues of Urban Water Systems Modeling and Analysis)

Abstract

:
In general, studies of the seismic reliability of water supply systems through hydraulic analysis models fall into three categories: (1) model development through hydraulic analysis, (2) establishment of post-earthquake recovery strategies, and (3) robust design in preparation for earthquakes and the development of improvement techniques. In this study, with regard to the design of earthquake resistance techniques, which is the third category, a seismic reliability assessment was conducted that considers the water supply system, and a plan to maximize the seismic reliability was determined as a result of the analysis. The degree of improvement in seismic reliability was quantified for water supply systems with various sources and water supply routes via modeling of seismic protection for each water supply route. Korea’s A industrial water system, which has a history of large-scale earthquakes, was divided into nine paths, and the reliability of the water supply system and the cost of earthquake resistance were calculated and compared between the different paths. A water supply path consists of a combination of pipes of various sizes and lengths, and the amount of water to be supplied differs between paths. Quantifying the effect of the water supply system and the seismic reliability of a route is intended to provide a basic methodology for identifying the critical path that should be the target of seismic protection when money and resources available for construction are limited. This methodology was used to confirm that the reliability of the water supply, the demand for water, and the cost of earthquake resistance should be considered together to establish an earthquake resistance strategy for the critical path in a water supply system. We expect that the results of this study will be used to establish detailed strategies for preliminary reinforcement against earthquake damage based on critical paths rather than all or individual pipelines in a water supply network.

1. Introduction

Water supply systems (WSSs) consist not only of above-ground infrastructure, such as water reservoirs (tanks), pumps, valves, etc., but also of a vast array of pipelines, most of which are buried underground. The basic function of a water supply system is to satisfy the demand for water quantity, quality and pressure by continuously supplying water from the water source to each customer’s faucet. Unfortunately, water supply systems are quite susceptible to seismic disasters as the relevant infrastructure is large in scale and widely distributed.
Major earthquakes of magnitudes greater than 7.0, such as the Northridge quake in the United States in 1994 and the quake in Kobe, Japan in 1995, often cause severe damage to water supply systems [1,2]. The water supply systems in areas affected by an earthquake fail due to primary damage, such as water leakage and pipeline rupture, resulting in a decrease in water supply and a reduction in firefighting capability. In addition, such disruptions hinder the residential, commercial, and industrial sectors, and have a profound impact on the economic and social structures of local communities [3,4,5,6].
In order to accurately understand the pattern of damage to a water pipe system caused by earthquakes, the hydraulic characteristics of the water supply system must be considered. A basic seismic reliability assessment study reflecting the hydraulic characteristics of the water pipe system was conducted by [7,8]. In early studies, complex water supply systems were either simplified, or the evaluation was performed only on the main lines. In addition, a water supply system was depicted as a network of points and lines, and not as a detailed hydraulic system. Furthermore, supply and demand were assessed by simple arithmetic addition of the supply and demand of the areas cut off by the earthquake.
Since the late 2000s, research has been conducted to evaluate seismic reliability using EPANET2 [9], a general-purpose mathematical analysis software program for water pipe network systems. Studies that model the seismic reliability of water supply systems can be classified into three categories: (1) model development through hydraulic analysis, (2) establishment of post-earthquake recovery strategies, and (3) robust design in preparation for earthquakes and the development of improvement techniques.
Regarding the first category, the GIRAFFE model [10] (Graphical Iterative Response Analysis for Flow Following Earthquakes) is a seismic reliability assessment model for water pipe networks which was developed based on the research in [11,12,13,14,15,16]. It is significant in that it visually implements the results of reliability evaluation and provides various analytical functions by linking mathematical analysis techniques and GIS functions. Later, Yoo et al. [17] published a Quasi-PDA (Pressure Driven Analysis)-based reliability evaluation model, REVAS.NET (Reliability Evaluation model of Seismic hazard for water supply NETwork), which partially supplemented the GIRAFFE model’s demand-driven analysis technique. Recently, Klise et al. [18] developed the Water Network Tool for Resilience (WNTR), an open-source Python package that helps water utilities investigate water availability and recovery times given earthquake scale, location and repair strategy. WNTR was used to propose the latest hydraulic analysis technique, the PDA (Pressure Driven Analysis) method, but it has not yet been verified in the field.
With regard to the second category, studies related to the establishment of a recovery strategy after an earthquake were conducted by [19,20,21,22,23]. System damage was investigated by first modeling the series of steps which various types of recovery personnel make as part of the repair process, and the hydraulic performance of the system was evaluated using the GIRAFFE model. The developed model was verified by simulating the Northridge earthquake, a large earthquake that occurred in LA in 1994. This study showed that the sequence and pattern of the earthquake damage recovery process can be modeled with a good degree of accuracy, but it made no attempt to suggest or evaluate various recovery plans. Refs. [20,21,22] proposed a method of evaluating the supply of a water pipe network system by increasing not only quantitative supply, but also water quality performance. Water delivery, quality, quantity, fire protection, and functionality were each subdivided into four categories, and the recovery pattern of each category was quantified and presented. The resulting patterns were analyzed and compared based on water pipe network system data from the Northridge earthquake. After, Choi et al. [23] established various recovery strategies that can be used after an earthquake (recovery priority, allocation of recovery personnel, etc.) and presented a numerical index that can be used to aid decision makers in determining how to recover the system quickly. The index enables estimation of time required for recovery, calculation of resources required for recovery, understanding of temporal and spatial recovery progress, statistical results of recovery personnel, etc., and was applied to an actual water supply network.
The third category, construction methods/materials that mitigate earthquake damage, is very significant as it is arguably the most active earthquake damage prevention countermeasure, but research into this category is lacking. Wang et al. [24,25] suggested the concept of a “critical link” by connecting the reliability of the water supply system to the main supply points and conducting performance evaluations on pipes that service individual customers. Pudasaini et al. [26,27] used metaheuristic techniques to determine which individual pipelines most need improvement and optimization when money is limited. However, due to the nature of the water supply system, it may not be possible to determine whether individual pipes are seismically resistant or to consider the connectivity between reinforced pipes. For the evaluation of individual pipes, Yoo et al. [17] considered the destruction of multiple pipelines due to earthquakes as one of the assessment categories in a proposed method of prioritizing improvements in water supply pipelines. Later, Yoo et al. [28] evaluated the seismic reliability of a water supply system according to the cost of pipe construction, and identified that a uniform increase in pipe construction costs did not lead to a remarkable increase in seismic reliability. Based on this finding, Yoo et al. [29,30] proposed and assessed a single-objective optimization method of maximizing the seismic reliability of a water supply system under limited construction cost conditions, as well as a multi-objective optimization method that simultaneously satisfies construction cost and reliability. However, such an optimization study cannot be used to assess strategies for supplementing the seismic reliability of an existing system by upgrading the entire water supply pipeline to optimal design specifications.
This study assesses a seismic design strategy that aims to protect against earthquake-related damage. The study quantifies the improvement in seismic reliability that occurred when seismic protection was performed on each water supply route in industrial water supply systems with various sources and water supply routes. A single water supply path consists of a combination of pipes of various sizes and lengths, and the amount of water to be supplied also differs between paths. By quantifying the effects of intervention on the water supply system and the characteristics of each route with regard to seismic reliability, a basic methodology is presented to determine the critical path for seismic protection when limited construction costs are to be invested.

2. Methodology

2.1. REVAS.NET

REVAS.NET was developed by [17] as a tool for probabilistically calculating the seismic reliability and supply of water supply networks. This tool performs hydraulic analysis based on the probability of structural failure of each component of a water pipe network system using Monte Carlo Simulation (MCS). In terms of timescale, the reliability of a water supply network system, immediately after an earthquake is evaluated. The infrastructure to be considered consists of water reservoirs, water conveyance pipelines, pumping facilities, and drainage pipes.
In order to evaluate the reliability of a water pipe network system that is subject to earthquakes, basic data and information on the vulnerability of the components is required. In addition, an index that indicates the location of the earthquake, its magnitude, the presence of defects by component, repair status, and reliability should be constructed. REVAS.NET uses (System Serviceability), which was suggested by [17,29,30], as a reliability index. S s is used to assess the supply capability in case an abnormal situation occurs in the system due to an earthquake. The basic calculation equation for S s is shown in (1).
S s   =   Q A v a i l a b l e   d e m a n d Q R e q u r i e d   d e m a n d × 100 %
Here, Q A v a i l a b l e   d e m a n d refers to the supply of water available for the entire system, and Q R e q u r i e d   d e m a n d refers to the quantity of water required by the entire system. S s calculated in this way can be used to evaluate the supply capability of the system following an earthquake. Its value ranges from a minimum of 0% to maximum of 100%. The closer it is to 0, the less water can be supplied after the earthquake in relation to the quantity that was normally supplied before the earthquake. On the other hand, the closer it is to 100%, the closer the system is to supplying the required quantity of water after the earthquake. In this study, the main water supply path of the target water supply network is set as the critical path, and the set path is considered to be seismically resistant and able to withstand an earthquake of a certain magnitude. To perform a seismic reliability assessment, the model calculates S s and compares the results.

2.2. Methodology Application Procedure

Figure 1 schematically illustrates the procedure used in this research. This study evaluates earthquake design strategies to protect against earthquake-related damage. In this regard, unlike the previous study [24,25,26,27,28,29], we would like to develop a design that takes into account the cost of mains and replacement. First, the pipe network is divided into critical paths. The critical paths setting method is detailed in the following section. Seismic reliability is calculated for each of the following critical paths (using REVAS.NET). The procedure for REVAS.NET is shown in Figure 1. The first step is to obtain the pipe network information of the object to be applied (pipe diameter, liquid phase conditions, etc). The second step is to construct a component specific vulnerability function. The third step performs—probabilistically—the most important seismic simulation. In this study, the location of possible earthquakes was simulated based on the location of previous earthquakes. The fourth step determines the status of system components after an earthquake. Then, hydraulic analysis based on EPANET is performed. As a result, the mathematical reliability of each final component is calculated. From Step 3 to the last stage, is repeated through the Monte Carlo simulation, resulting in the reliability S s of the system. Based on the last Ss calculated, the reliability of each major line is assessed, and the cost required for seismic reinforcement is calculated and the results are analyzed. Methods for setting up the cost of seismic reinforcement of pipes and setting up the critical paths are presented in the following sections.

2.3. Critical Paths for Earthquake Resistance and Assumptions of the Model

The definition of critical paths, on which it is most important to increase the seismic reliability of the water supply system, may vary depending on the presence or absence of certain types of pipe network (branched and looped), the topological level of the network, and the presence or absence of important social infrastructure (hospitals, fire stations, public facilities, etc.). Since this study investigates water supply in an industrial water supply system, which suffers enormous economic loss if the water supply is stopped for even a few hours, the paths that independently supply water from the reservoir to the customer were defined as critical paths. Since the purpose of this study is to link the characteristics of the supply line with the evaluation of the water supply reliability, in accordance with the earthquake resistance of the major supply lines, all possible pipelines were included as critical paths. In addition, without reclassifying and assessing the 1st and 2nd hierarchy levels within each critical path in detail, it was assumed that each critical path is completely seismic-resistant and the joints and other facilities in the corresponding path were also changed to earthquake-resistant structures.

2.4. Economic Evaluation of Earthquake-Resilient Critical Paths

The cost of replacing seismic performance pipe is shown in Table 1. It is important not only to evaluate reliability in accordance with the critical paths of the water supply system, but also to calculate the economic cost of pipe replacement. The table was presented by Shahandashti and Pudasaini (2019) and refers to the cost of seismic performance pipes that are 18 ft in length. In this study, it was necessary to calculate the cost of seismic pipes of various diameters, so a regression equation was created based on the data in Table 1; the results of the calculation are shown in Equation (2) and Figure 2. Using the proposed regression equation, the economic costs of making each critical path earthquake resistant were calculated, and the results were used to analyze and compare the seismic reliability evaluation results.
C R   =   0.8392 D 0.0536
Here, C R is the pipe construction cost (USD/18 ft), and D is the pipe diameter (mm).

3. Application and Results

3.1. Target Water Supply Network

The area selected for application of the methodology proposed in this study is the industrial water supply system of A-City, a representative industrial city in South Korea. The water supply network diagram of the area, corresponding to the water supply system, is shown in Figure 3a. There was a magnitude 5.0 earthquake in the vicinity in 2016, and no damage to the water supply system was reported. The target area is a city located near the southern sea, as shown in Figure 3b, which is more likely to be seismic than the rest of Korea. In addition, the area is located near the Trans-Pacific Earthquake Zone, where earthquakes are likely to occur in the future. The total demand for water in the A-City industrial water supply system is about 2,039,765 m3/day, and the total length of the pipeline is 279 km. The network system is composed of 1220 nodes and 1300 pipelines. The system supplies water to the main supply from a total of nine independent water catchment areas. Fourteen emergency-linked supply lines and double track lines have been established in preparation for any abnormal situations. The seismic reliability assessment in accordance with the operation scenario of the emergency pipeline is not considered in this study. Under normal supply conditions, this system supplies water at an average pressure of 27.34 m, which is an appropriate water pressure that is higher than the design standard of 15.3 m (Figure 3c).

3.2. Determination of Critical Paths

In this study, critical paths were determined such that all pipelines were included in a path connecting each water source to the final customer. The target industrial water supply systems operates based on nine water supply reservoirs. Each reservoir is responsible for an independent area if the emergency connection routes are excluded. As a result, a total of nine critical paths (RES(Reservoir)1–9 Pipelines) were identified. The nine critical paths are visually represented in Figure 4, as shown in red area. An analysis of the customer demand that is fulfilled by each of the nine water sources showed that A-City’s water supply network supplies the greatest amount of water through the RES2 Pipeline.
Table 2 shows pipe length and diameter data for each critical path. Of all nine pipelines, the RES2 Pipeline is the longest and provides the greatest amount of water. With regard to the pipe diameter distribution, the average pipe diameter is 1099 mm; it ranges from a minimum of 50 mm to a maximum of 2400 mm in each critical path.
The distribution of the number of pipes according to pipe diameter in each critical path is shown in Figure 5. The RES7 Pipeline consists largely of small-diameter pipes (D < 300 mm), which account for 53.61% of the total number of pipes in the pipeline. This represents an environment in which seismic damage to pipelines can be expected to occur relatively frequently. In the RES9 Pipeline, most pipes are between 300 mm and 1000 mm, which are medium-diameter pipes. Additionally, the RES3 Pipeline was found to have the highest distribution (37.23%) of large-diameter pipes (1700 mm or larger). The distribution of pipe diameter and the length of the pipes are the main factors that affect the reliability of water supply after an earthquake. In general, the smaller the pipe diameter, the higher the probability of pipe breakage, and in the case of a single route, the longer the pipeline, the greater the probability of disconnection of the water supply due to damage.

3.3. Method of Earthquake Simulation and Pipeline Damage Probability Calculation

Generally, wide-area waterworks systems are built to sustain earthquakes of magnitude ~6.5. Therefore, we chose to simulate magnitude 7 earthquakes in order to assess water supply capability before and after an earthquake. Earthquake location was determined by dividing the target area into six regions (2 × 2 squares) and setting earthquakes to occur at the nine intersections of these regions. When setting the earthquake locations, a uniform distribution was assumed to account for uncertainties such as the depth of the earthquake. Using Monte Carlo Simulations, a total of 100,000 earthquakes were simulated to achieve statistically appropriate convergence. A Ground Motion Prediction Equation (GMPE) was applied to calculate the probability of failures of individual pipes due to seismic wave attenuation after an earthquake, as in a previous study [31]. Equation (3) of [31] which was shown to be suitable based on earthquake data from Korea, was applied.
log ( y ) = a + b M + c l o g R e p i 2 + h 2 + d R e p i + e s
Here, a, b, c, d, and e are coefficients calculated from the regression analysis, and values of −1, 0, and 1 are used for the modification coefficients given for each observation. The coefficient h was added to prevent unrealistic results that may occur within a 10 km radius of the station. y corresponds to PGV (Peak Ground Velocity, m/s), M is the magnitude of the earthquake, and Repi is the distance to the epicenter of the earthquake.
Finally, the pipeline repair rate (RR) was calculated using the PGV computed by GMPE and the characteristics of the pipeline. In this study, as suggested in Equation (4), the repair rate was obtained by applying the corresponding coefficient in accordance with the pipe type (C1), pipe diameter (C2), buried topography (C3), and liquefaction condition (C4). The modification factors C1–C3 of the target area—the A-City water pipe network system—were applied based on the basic data presented in [32]. For C4, information on liquefaction was not available, so it was assumed to be “none” and a value of 1.0 was uniformly applied to all pipelines. The minimum water pressure necessary to say that a given path is receiving water after the earthquake was set to 15 m.
R R = C 1 × C 2 × C 3 × C 4 × 0.00187 × P G V
Here, RR (repair rate) represents the number of pipe breakage points/1000 ft, and C1–C4 define the modifier for pipe type (C1), pipe diameter (C2), buried topography (C3), and liquefaction condition (C4).

3.4. Application Results
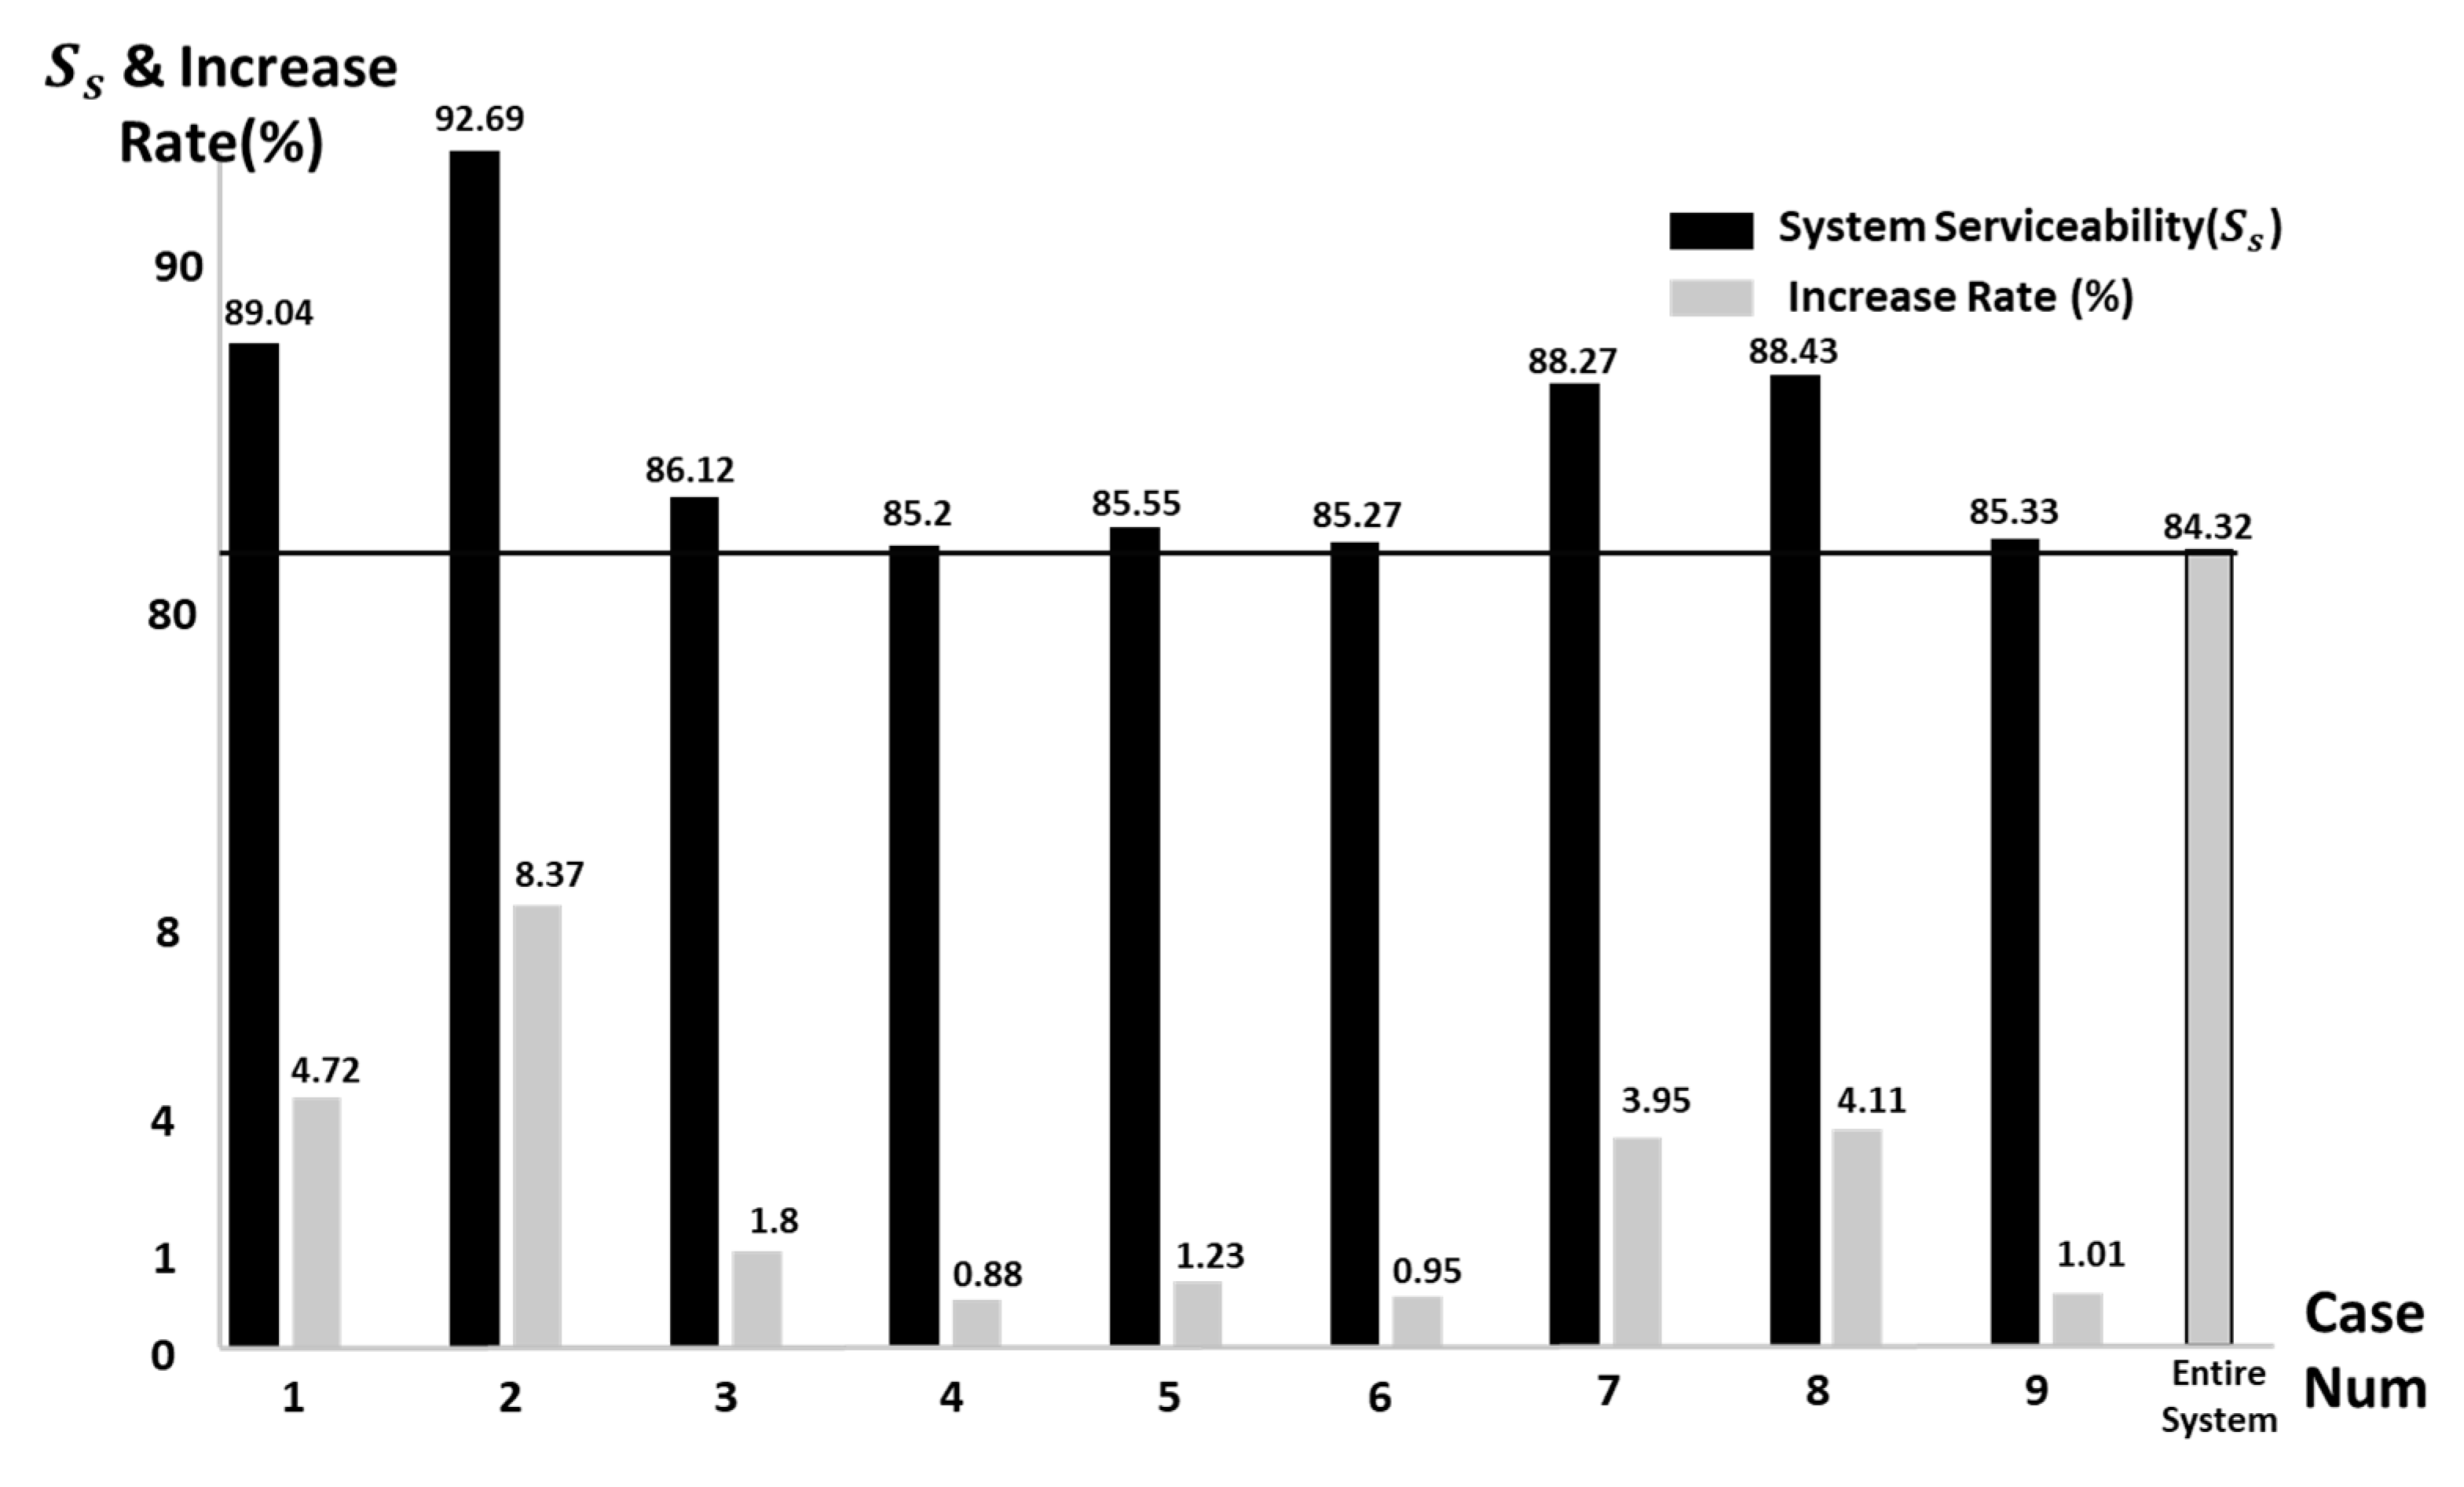
3.4.1. System Serviceability ( S s )

First, it was found that the supply capacity after the occurrence of an earthquake of magnitude 7 for the current system, which has not been made earthquake-resistant, was 84.32%. This means that about 15.68% of the total supply would be unavailable after a magnitude 7 earthquake. The fact that high supply capability was observed following the occurrence of a relatively high-intensity earthquake suggests that the existing pipelines meet current design standards. The earthquake resistance of each of the nine critical paths and calculations of post-earthquake supply reliability are shown in Table 3 and Figure 6
The reliability of the water supply system for all critical paths was, on average, about 3% higher than that of the current state. The reliability of supply capacity in the RES2 Pipeline was 92.69%, representing the largest increase in reliability (8.37%). The RES2 Pipeline, as shown in Table 2 and Figure 4b, has a relatively small number of pipes, but the individual pipes are longer and more widely dispersed than in other pipelines. In addition, since it is fulfilling a demand equivalent to 35.9% of the total supply, it is inevitably vulnerable to earthquakes. It was thus found that high reliability can be ensured if such a path is made earthquake resistant. Like the RES2 Pipeline, the RES1 Pipeline also significantly increases the reliability of the system when earthquake resistance is ensured. The seismic reliability results suggest that the RES1 and RES2 Pipelines should take precedence when conducting seismic reinforcement, since the amount of water supplied through the two is large and the pipes are long, even though these paths are composed of large-diameter pipes with a relatively high probability of failure.
Next, the RES7 and RES8 Pipelines, which are composed of a number of different pipelines, also displayed good increases in reliability. In contrast to the RES2 pipeline, the amount of water supplied by the RES7 and RES8 Pipelines and the average pipe diameter are relatively small. Of course, during the hydraulic analysis of the water supply network, nodes may be generated in areas where there is no demand or bent in accordance with the judgment of the model constructor, but most nodes are generated according to a divergence of demand or a change in pipe diameter. In this case, when the corresponding path is a single path, the supply rapidly deteriorates if one of the relatively small-diameter pipes is damaged or leaks due to an earthquake. Therefore, except when the supply ratio is very small, and its effect on the system is insignificant, a path composed of a large number of small-diameter pipelines, such as the RES7 and RES8 Pipelines, must be carefully managed and made earthquake-resistant.
The RES4 and RES6 Pipelines were the least affected by increasing their earthquake reliability. This is because these pipelines are composed of a relatively small number of short pipes, and the quantity of water demanded relative to the average pipe diameter is less than that of the other routes. Since most of the critical paths are made up of large-diameter pipes, it is clear that there is a limit to improving pipeline reliability with seismic reinforcement.

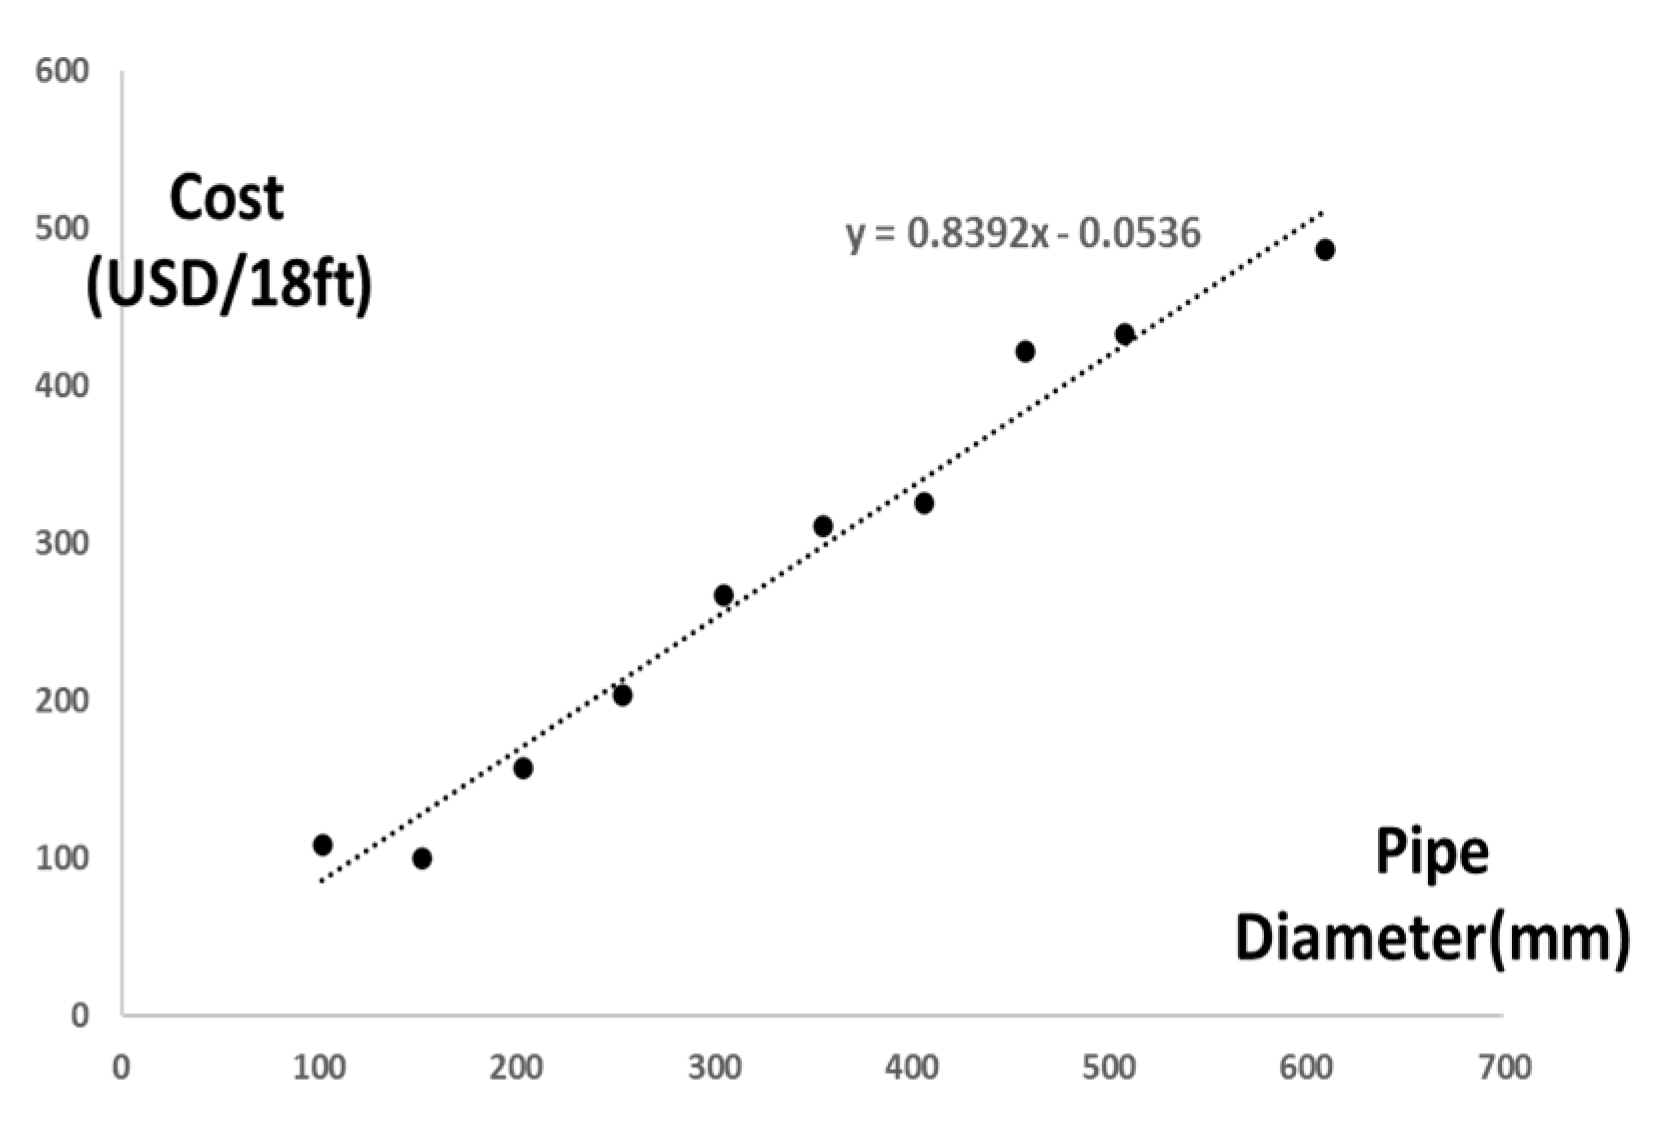
3.4.2. Pipe Replacement Cost

Although seismic reliability can be greatly increased, the impact of increasing overall reliability decreases when the economic costs of doing so are high. Therefore, in this study, the cost of seismically reinforcing pipelines in accordance with the specifications of each critical path was calculated, and the results were evaluated in combination with the effect of increasing reliability. Table 4 shows the cost of making each critical path earthquake resistant. The cost of seismic reinforcement pipes was calculated using the regression equation in Figure 3. The cost calculation showed that the RES2 Pipeline, which consists of large-diameter, long pipes, costs the most, at an estimated USD 210,000. This is about 37.9% of the cost of making the entire pipeline system earthquake resistant, which means that a higher cost versus the supply rate (35.9%) must be invested to render the RES2 Pipeline earthquake resistant.

3.4.3. Relation between S s and Pipe Replacement Cost

A summary of S s , the cost of earthquake-resistant pipes, and the net water inflow of each critical path are shown in Figure 7 and Figure 8 and Table 5. In the RES2 Pipeline, the highest level of system supply can be achieved, but the cost of earthquake resistance is very high, which is a limiting factor when attempting to identify the highest priority pipeline for improvement in consideration of economic efficiency. However, in areas where the risk of large-scale earthquakes is very high, the earthquake resistance of the RES2 Pipeline, which fulfills the largest water supply demand, is essential to maximize the reliability of the water supply regardless of economic factors. The reliability analysis of the water supply for each section does not take into account the relative quantity of water demanded by each route. Therefore, when prioritizing in consideration of the demand for water supply, the RES1 and RES2 Pipelines must be made earthquake resistant. However, since the RES1 and RES2 Pipelines have very long pipes, the two can be divided into sections and a priority can be set for each subsection through an analysis of second- and third-phase relationships and detailed demand sources and a re-evaluation of the seismic reliability of each subsection.
If only the rank sum results, which summarize the rank of each indicator, in consideration of both economics and reliability, were used, the RES5 Pipeline could have been chosen as the highest priority for pipeline replacement. However, the RES5 Pipeline occupies a very small proportion of the total system, pipeline length, and demand for water, so the actual effect of seismic reliability improvement in terms of the whole system is small. Therefore, similar to the RES7 and RES8 Pipelines, it is reasonable to deprioritize the RES5 Pipeline because it is composed of small-diameter pipes—even though making it earthquake resistant would be associated with relatively little economic cost—and instead focus on making other pipelines earthquake resistant when doing so would significantly increase the reliability of the system as a whole. Of course, since this study only calculated the cost of earthquake resistance of the pipeline itself, additional analyses that include a replacement timescale, the construction environment, and human resources are needed in order to more accurately determine priorities for pipeline replacement.
If the rank sum results, which summarize the rank of each indicator, in consideration of economics, reliability, and water quantity demand were used, the RES1, 2, and 8 Pipelines may have been chosen as seismically vulnerable routes. We determined that the RES7 Pipeline, which has a low water quantity demand in comparison to the other pipelines, should be excluded. As such, it seems that it is necessary to consider whether the whole system is in need of seismic reliability improvement.
All in all, as shown in Table 5, an earthquake resistance strategy for each pipeline should be determined by comprehensively considering the reliability of the water supply in the system, the amount of supply in each section, and the cost of implementing earthquake resistance. The reliability of the water supply is largely affected by the physical characteristics (pipe diameter distribution, pipe length, and connectivity) of the target section as well as the water quantity demand of the route, which has a direct influence. However, since the supply performance index S s for each route defines the ratio of the available supply to the total demand, in order to compare the reliability of water supply between routes, the total demand for each route must be considered separately. In addition, the construction costs associated with installing earthquake-resistant pipe increase as the pipe diameter increases, but the reliability of the seismic reinforcement also increases with pipe diameter at a very good rate. Therefore, it is necessary to establish a seismic reinforcement strategy in consideration of economic feasibility and in accordance with the distribution of pipe diameters in a given pipeline.

4. Conclusions

This study performed a water supply reliability analysis based on critical path pipelines in an effort to improve the reliability of the water supply system during earthquake disasters. To this end, the REVAS.NET model, which calculates seismic reliability using hydraulic water supply characteristics, was used, and the impact of seismic reinforcement of pipeline sections in terms of an increase in the reliability of the water supply was examined. Nine critical paths for seismic reinforcement in an industrial water supply line in Korea were analyzed, and the relationship between increased reliability and the physical and hydraulic characteristics of each path was assessed. In order to not only increase the hydraulic supply, but also to evaluate the economic feasibility of earthquake resistance, the cost of replacing the target areas with earthquake-resistant pipe was calculated and compared with the reliability results.
In conclusion, a strategy for ensuring the earthquake resistance of water supply pipelines in preparation for an earthquake should be determined by comprehensively considering the reliability of the water supply, the amount of supply by section, and the cost of earthquake resistance. The reliability of water supply is especially affected by the physical characteristics (pipe diameter distribution, pipe length, and connectivity) of the target section, as well as the water quantity demand of the pipeline, which has a direct influence on reliability. In addition, the construction cost associated with installation of earthquake-resistant pipes increases as the size of the pipe diameter increases, but so does the reliability due to seismic reinforcement. Therefore, it is necessary to establish a seismic reinforcement strategy by taking into consideration both economic feasibility and pipe diameter distribution. The results of this study are expected to be used to establish detailed strategies for preliminary reinforcement against earthquakes based on critical paths rather than all or individual pipelines in water supply network systems.
In this study, critical paths were identified and analyzed such that all individual pipelines in the entire target system were included in a path. In the future, relatively long critical paths should be subdivided into second- and third-order hierarchical networks by taking phase relations into account, and the system should be re-analyzed. In particular, in critical paths that combine the main pipeline and sub-pipelines, research on the preparation of detailed establishment and reinforcement strategies should be conducted. In addition, in this study, an analysis was conducted on an industrial system in which each customer was equally affected by interruptions in the water supply. However, additional research on selection and analysis of critical paths for residential water supply areas that include higher priority consumers, including hospitals, government offices, etc., should be conducted.

Author Contributions

C.W.L. and H.J.K. surveyed the previous studies. C.W.L. wrote the original manuscript. C.W.L. conducted simulations. C.W.L. and D.G.Y. conceived the original idea of the proposed method. All authors have read and agreed to the published version of the manuscript.

Funding

This work was supported by the Korea Environment Industry and Technology Institute (KEITI) through the Intelligent Management Program for Urban Water Resources Project, funded by the Korea Ministry of Environment (MOE) (2019002950002).

Conflicts of Interest

The authors declare no conflict of interest.

References

  1. Eidinger, J. Water and sewer systems. In Hyogoken-Nanbu (Kobe) Earthquakeof January 17, 1995: Lifeline Performance; Monograph No. 14; Technical Council on Lifeline Earthquake Engineering, ASCE: New York, NY, USA, 1998; pp. 121–182. [Google Scholar]
  2. Lund, L.; Cooper, T. Water system. In Northridge Earthquake: Lifeline Performance and Post-Earthquake Response; Monograph No. 8; Technical Council on Lifelineearthquake Engineering, ASCE: New York, NY, USA, 1995; pp. 96–131. [Google Scholar]
  3. Taylor, C.E. Seismic Loss Estimation for a Hypothetical Water System; Monograph No. 2; Technical Council on Lifeline Earthquake Engineering, ASCE: New York, NY, USA, 1991. [Google Scholar]
  4. Shinozuka, M.; Hwang, H.; Murata, M. Impact on water supply of a seismically damaged water delivery system. In Lifeline Earthquake Engineering in Thecentral and Eastern US; Monograph No. 5; Technical council on lifeline earthquake engineering, ASCE: New York, NY, USA, 1992; pp. 43–57. [Google Scholar]
  5. Markov, I.; Grigoriu, M.; O’Rourke, T.D. An Evaluation of Seismic Serviceabilitywater Supply Networks with Application to the San Francisco Auxiliary Water Supply System; Technical Report NCEER-94-0001l National Center for Earthquake Engineering Research University of Buffalo, State University of New York: Buffalo, NY, USA, 1994. [Google Scholar]
  6. Tanaka, S. Lifeline Seismic Performance Analysis for Water and Electric Powersystems. Ph.D. Thesis, Waseda University, Tokyo, Japan, 1996. [Google Scholar]
  7. Whitman, R.V.; Hein, K.H. Damage Probability for a Water Distribution System. In Proceedings of the ASCE TCLEE Specialty Conference on Lifeline Earthquake Engineering, Los Angeles, CA, USA, 31 August 1977; pp. 410–423. [Google Scholar]
  8. Hall, W.; Newmark, N. Seismic Design Criteria for Pipelines and Facilities. In Current State of Knowledge of Lifeline Earthquake Engineering; ASCE: New York, NY, USA, 1977; pp. 18–34. [Google Scholar]
  9. Lewis, A.R. EPANET 2: Users Manual; Water Supply and Water Resources Division National Risk Management Research Laboratory: Cincinnati, OH, USA, 2000; pp. 1–200. [Google Scholar]
  10. GIRAFFE. GIRAFFE User’s Manual; School of Civil and Environmental Engineering, Cornell University: Ithaca, NY, USA, 2008; Available online: https://www.cee.cornell.edu/cee (accessed on 14 February 2019).
  11. Wang, Y. Seismic Performance Evaluation of Water Supply Systems. Ph.D. Thesis, Cornell University, Ithaca, NY, USA, January 2006. [Google Scholar]
  12. Shi, P. Seismic Response Modeling of Water Supply Systems. Ph.D. Thesis, Cornell University, Ithaca, NY, USA, January 2006. [Google Scholar]
  13. Shi, P.; O’Rourke, T.D.; Wang, Y. Simulation of earthquake water supply performance. In Proceedings of the 8th National Conference on Earthquake Engineering, Oakland, CA, USA, 18–22 April 1977; Paper No. 8NCEE-001295. EERI: Oakland, CA, USA. [Google Scholar]
  14. Wang, Y.; O’Rourke, T.D. Characterizations of seismic risk in Los Angeles water supply system. In Proceedings of the 5th China-Japan-US Symposium on Lifeline Earthquake Engineering, Haikou, China, 26–28 November 2007. [Google Scholar]
  15. Bonneau, A.L. Water Supply Performance during Earthquakes and Extreme Events. Ph.D. Thesis, Cornell University, Ithaca, NY, USA, 2008. [Google Scholar]
  16. Bonneau, A.L.; O’Rourke, T.D. Water Supply Performance during Earthquakes and Extreme Events; Technical Report MCEER-09-0003; University of Buffalo, State University of New York: Buffalo, NY, USA, 2009. [Google Scholar]
  17. Yoo, D.G.; Jung, D.; Kang, D.; Kim, J.H.; Lansey, K. Seismic Hazard Assessment Model for Urban Water Supply Networks. J. Water Resour. Plan. Manag. 2016, 142, 04015055. [Google Scholar] [CrossRef]
  18. Klise, K.A.; Bynum, M.; Moriarty, D.; Murray, R. A software framework for assessing the resilience of drinking water systems to disasters with an example earthquake case study. Environ. Model. Softw. 2017, 95, 420–431. [Google Scholar] [CrossRef] [PubMed]
  19. Tabucchi, T.; Davidson, R.A.; Brink, S. Simulation of post-earthquake water supply system restoration. Civ. Eng. Environ. Syst. 2010, 27, 263–279. [Google Scholar] [CrossRef]
  20. Davis, C.A.; O’Rourke, T.D.; Adams, M.L.; Rho, M.A. Case study: Los Angeles water services restoration following the 1994 Northridge earthquake. In Proceedings of the 15th World Conference on Earthquake Engineering, Lisbon, Portugal, 24–28 September 2012. [Google Scholar]
  21. Davis, C.A. Water System Service Categories, Post-Earthquake Interaction, and Restoration Strategies. Earthq. Spectra 2014, 30, 1487–1509. [Google Scholar] [CrossRef]
  22. Davis, C.A.; Giovinazzi, S. Toward Seismic Resilient Horizontal Infrastructure Networks. In Proceedings of the 6th International Conference on Earthquake Geotechnical Engineering, Christchurch, New Zealand, 2–4 November 2015. [Google Scholar]
  23. Choi, J.; Yoo, D.G.; Kang, D. Post-Earthquake Restoration Simulation Model for Water Supply Networks. Sustainability 2018, 10, 3618. [Google Scholar] [CrossRef] [Green Version]
  24. Wang, Y.; Au, S. Critical Links of Water Supply to Crucial Water Consumers under an Earthquake. In Proceedings of the 14th World Conference on Earthquake Engineering, Beijing, China, 12–17 October 2008. [Google Scholar]
  25. Wang, Y.; Au, S.-K. Spatial distribution of water supply reliability and critical links of water supply to crucial water consumers under an earthquake. Reliab. Eng. Syst. Saf. 2009, 94, 534–541. [Google Scholar] [CrossRef]
  26. Pudasaini, B.; Shahandashti, S.M. Identification of Critical Pipes for Proactive Resource-Constrained Seismic Rehabilitation of Water Pipe Networks. J. Infrastruct. Syst. 2018, 24, 04018024. [Google Scholar] [CrossRef]
  27. Shahandashti, S.M.; Pudasaini, B. Proactive Seismic Rehabilitation Decision-Making for Water Pipe Networks Using Simulated Annealing. Nat. Hazards Rev. 2019, 20, 04019003. [Google Scholar] [CrossRef]
  28. Yoo, D.G.; Kang, D.; Kim, J.H. Optimal design of water supply networks for enhancing seismic reliability. Reliab. Eng. Syst. Saf. 2016, 146, 79–88. [Google Scholar] [CrossRef]
  29. Yoo, D.G.; Jung, D.; Kang, D.; Kim, J.H. Seismic-Reliability-Based Optimal Layout of a Water Distribution Network. Water 2016, 8, 50. [Google Scholar] [CrossRef] [Green Version]
  30. Yoo, D.G.; Jung, D.; Kang, D.; Kim, J.H. Seismic Reliability–Based Multiobjective Design of Water Distribution System: Sensitivity Analysis. J. Water Resour. Plan. Manag. 2017, 143, 06016005. [Google Scholar] [CrossRef]
  31. Emolo, A.; Sharma, N.; Festa, G.; Zollo, A.; Convertito, V.; Park, J.; Chi, H.; Lim, I. Ground-Motion Prediction Equations for South Korea Peninsula. Bull. Seism. Soc. Am. 2015, 105, 2625–2640. [Google Scholar] [CrossRef]
  32. SD ENG. Seismic Performance Evaluation and Improvement Measures for Ulsan Industrial Waterworks Facilities; K-Water Institute: Daejeon, Korea, 2014. [Google Scholar]
Figure 1. Schematic illustration of the research methodology. REVAS.NET: Reliability Evaluation model of Seismic hazard for water supply NETwork.
Applsci 10 08056 g001
Figure 2. Cost of Seismic Performance Pipe by Diameter.
Applsci 10 08056 g002
Figure 3. Pipe Network in the Target Area.
Applsci 10 08056 g003
Figure 4. The Nine Critical Paths in the A-City Industrial Water Supply Network.
Applsci 10 08056 g004aApplsci 10 08056 g004b
Figure 5. Distribution of Pipe Diameter in Each Critical Path.
Applsci 10 08056 g005
Figure 6. System Serviceability Results by Path.
Applsci 10 08056 g006
Figure 7. System Serviceability ( S s ) of Each Critical Path vs. Cost of Earthquake Resistance.
Applsci 10 08056 g007
Figure 8. Relationship of System Serviceability ( S s ), Cost of Earthquake Resistance, and Supply in Each Critical Path.
Applsci 10 08056 g008
Table 1. Cost of Replacement of Seismic Performance Pipes (Shahandashti and Pudasaini, 2019).
Pipe Diameter (mm)US Manufactured Ductile Iron Pipe (USD/18 ft)Earthquake Resistant Ductile Iron Pipe (Suggested by Japan) (USD/18 ft)
Material CostBare Cost without Backfill CostBackfill CostTotal Cost with Backfill CostBare Cost without Backfill CostTotal Cost with Backfill Cost
101.630.542.584.4947.07103.58108.07
152.426.541.575.1546.7294.5799.72
203.244.562.625.8368.45151.62157.45
25458.579.616.586.11196.61203.11
304.879101.947.2109.14259.94267.14
355.693117.167.91125.07303.16311.07
406.494.5127.58.63136.13316.50325.13
457.2126160.89.37170.17412.80422.17
508127169.110.12179.22423.10433.22
609.6141192.2511.66203.91474.25485.91
Table 2. Water Supply and Pipe Characteristics of Each Critical Path.
Critical Path (Pipeline) Net   Inflow   ( m 3 / d ) (Rank)Number of Pipes (Rank)Total Pipe Length (m) (Rank)Average Diameter (mm)Mim/Max Diameter (mm)
Total Length/No. of PipeLength WeightedMinMax
RES1 Pipeline316,645 (2)108 (6)38,782 (2)1487 (1)17625002400
RES2 Pipeline732,455 (1)140 (4)69,369 (1)1424 (4)19891003300
RES3 Pipeline316,645 (2)137 (5)37,198 (4)1436 (2)14381002200
RES4 Pipeline194,551 (5)36 (8)13,954 (7)1432 (3)15662502200
RES5 Pipeline34,582 (8)34 (9)10,633 (9)1285 (6)11688002000
RES6 Pipeline34,582 (8)41 (7)10,736 (8)1340 (5)16711002400
RES7 Pipeline96,905 (7)291 (2)33,925 (5)417 (9)546401200
RES8 Pipeline211,363 (4)311 (1)38,105 (3)452 (8)553401350
RES9 Pipeline102,036 (6)202 (3)26,562 (6)619 (7)534501200
Total (Entire System)2,039,7651300279,26310991315403300
Table 3. System Serviceability Results by Path.
Entire SystemCritical Path (Pipeline)
RES1RES2RES3RES4RES5RES6RES7RES8RES9
S s (%)84.3289.0492.6986.1285.2085.5585.2788.2788.4385.33
Increase Rate (%)-4.728.371.800.881.230.953.954.111.01
Rank-215968437
Table 4. Pipeline Replacement Cost by Critical Path.
Critical Path (Pipeline)Pipeline Replacement Cost (Thousand USD)
(Earthquake Resistant Ductile Iron Pipe, Suggested by Japan)
Rank
RES1 Pipeline10,3728
RES2 Pipeline21,0399
RES3 Pipeline81767
RES4 Pipeline33276
RES5 Pipeline18931
RES6 Pipeline26953
RES7 Pipeline27484
RES8 Pipeline31425
RES9 Pipeline21662
Total (Entire System)55,558-
Table 5. Comprehensive Assessment of System Serviceability ( S s ), Cost of Earthquake Resistance, and Supply.
Critical Path (Pipeline)Net Inflow ( m 3 / d ) (Rank)Rank (a)System Serviceability ( S s ,   % ) Rank (b)Pipeline Replacement Cost (Thousand USD)Rank (c)Total Rank Sum
(b) + (c)(a) + (b) + (c)
RES1 Pipeline316,645289.04210,37281012
RES2 Pipeline732,455192.69121,03991011
RES3 Pipeline316,645286.125817671214
RES4 Pipeline194,551585.29332761520
RES5 Pipeline34,582885.55618931715
RES6 Pipeline34,582885.278269531119
RES7 Pipeline96,905788.27427484815
RES8 Pipeline211,363488.43331425812
RES9 Pipeline102,036685.33721662915
Publisher’s Note: MDPI stays neutral with regard to jurisdictional claims in published maps and institutional affiliations.

