Abstract
Water hammering is a significant problem in pumping systems. It damages the pipelines of the pump drastically and needs to identify with an intelligent method. Various conventional methods such as the method of characteristics and wave attenuation methods are available to identify water hammering problems, and the predictive control method is one of the finest and time-saving methods that can identify the anomalies in the system at an early stage such that the device can be saved from total damage and reduce energy loss. In this research, a machine learning (ML) algorithm has used for a predictive control method for the identification of water hammering problems in a pumping system with the help of simulations and experimental-based works. A linear regression algorithm has been used in this work to predict water hammering problems. The efficiency of the algorithm is almost 90% compared to other ML algorithms. Through a Vib Sensor app-based device at different pressures and flow rates, the velocity of the pumping system, a fluctuation between healthy and faulty conditions, and acceleration value at different times have been collected for experimental analysis. A fault created to analyze a water hammering problem in a pumping system by the sudden closing and opening of the valve. When the valve suddenly closed, the kinetic energy in the system changed to elastic resilience, which created a series of positive and negative wave vibrations in the pipe. The present work concentrates on the water hammering problem of centrifugal pumping AC drive systems. The problem is mainly a pressure surge that occurs in the fluid, due to sudden or forced stops of valves or changes in the direction and momentum of the fluid. Various experimental results based on ML tool and fast Fourier transformation (FFT) analysis are obtained with a Vib Sensor testbed set-up to prove that linear regression analysis is the less time-consuming algorithm for fault detection, irrespective of data size.
1. Introduction
Centrifugal pumps are commonly used for a variety of industries and used for fluid delivery. They are driven by an electrical motor, usually an induction motor. Regular maintenance of the pump helps to avoid sudden failure in the system because of sudden pressure changes that cause efficiency reduction that result in hydraulic failure. Water hammering is a problem in pumping systems caused by the change in flow, velocity resulting from a change in valve-closing and valve-opening times. It happens as pressure surge, and transient flow and vibration created in the system. Water hammering can analyze by the percentage of valves closing at different time-periods [1]. Mechanical failure can happen when any component of the pump fails to function or because of continuous use. Problems may arise within these machines are a reduction of the fluid flow within the pipelines, and interruption of the transportation of fluid to its destination in the process. Bearing failure, impeller breakage, seal breakage, and lubrication problems are the causes of mechanical failure. The failure creates a blockage in the system, interrupts the fluid flow, and causes substantial economic loss [2]. Continuous monitoring of devices and proper maintenance of the system can reduce maintenance costs and at the same time, increase the lifetime of the machine. Various predictive and condition-based monitoring techniques are available for diagnosis and identification of incipient faults in centrifugal pumping systems. Unnatural variation of any parameter causes significant faults, which should be prevented in due time [3]. In some cases, it is challenging to monitor every parameter manually, but machine learning (ML)-based algorithm techniques are used as an effective method for fault detection, due to their advantages over conventional methods such as signal-based fault detection, model-based fault detection, vibration analysis-based anomaly detection, and current spectrum analysis, etc. These traditional methods are time-consuming, costly, and less efficient. It is possible to predict the best-suited output using ML-based predictive control methods instead of the traditional method [4].
Transient flow analysis is considered to be one of the reasons for water hammering. Flow analysis of the feeder network of the Baneta Water Distribution system shows that transient flow depends on pump inertia and valve closure time. Due to the more significant velocity of water, the effect of the wave front of velocity can be varied [5,6]. In long-distance pipeline-based simulations, a multi-valve protection system is used. To analyze the velocity and flow rate of the fluid in a pipeline, decreasing flow rate and sudden pressure-head changes are used. For keep the pressure inside the pipe within an allowable range, excess pressure-escape valves are installed at dry openings. For satisfy all the additional attachments, a multifunctional pump control valve may be installed [7]. Analysis of wave velocity is typical for piping systems and has been made. Flow-rate values are compared with velocity values in the transient condition. The change of wave in the fluid causes water hammering when the least volume of materials is used in the wall, bottom, and roof of the surge tank. The pressure variation at different points with different fast shutting timings is analyzed for pipes by genetic and fuzzy algorithms. Fulfilment of the minimum pressure constraint and critical submergence shows the effectiveness of the fuzzy–genetic method [8].
Conventional methods are time-consuming, complex, and less accurate. The unsupervised self-learning method is helpful for fault analysis, and prediction of the fault is also possible. The deep learning (DL) method requires new feature extraction, and a non-stationary SoftMax regression model is suitable for automatic identification of failure nodes. Predictive control pattern recognition technology helps improve efficiency. In a study, the stack demonizing encoder is used for DL for the improvement of features by computational data. The efficiency of the system is improved by prediction and condition monitoring of pattern recognition model-based technology [9].
In different operating conditions, parameter variation is required, and in all conditions, it is not possible. Therefore, to make it more effective, parameter analysis is needed. Transient pressure variations occur in the pipeline due to variations of fluid velocity. When velocity varies suddenly, the pump elastic property varies, and water hammering occurs [10,11]. Water hammering analysis to control water in an underground mine is very critical. For this reason, the proper flow of water needs to be measured, and the pressure difference inside the pipeline needs to be appropriately maintained. The combination of internal and external forces, estimation of friction terms, and the unbalanced flow of water also can be measured to maintain a pressure difference and proper flow of water [12]. Column separation is one of the oldest technologies for the analysis of water hammering. It relates to vaporous cavitation and the water hammering process, which are interlinked. However, this method has some disadvantages to the pressure transducer. The method depends on the cavity model, so it is more complex and time-consuming. Getting accurate results becomes difficult in this situation [13]. The receding-horizon optimal control helps control the stability of the system. The mathematical model-based system helps handle various constraints and minimize the cost function. In the case of the feasibility of the optimization of the system, the model is the challenging factor [14]. A comprehensive look at water hammering with an emphasis on home plumbing systems has discussed. The mathematical model of water hammering is explained, and a four-point implicit finite-difference scheme has been solved numerically. It is shown that unsteady momentum and continuity equations can be used to solve water distribution problems instead of steady-state energy and continuity equations. This shows that an unsteady approach is more suitable than the standard Hardy–Cross method [15]. Water hammering analysis of pumping systems for the control of water underground has been discussed. The underlying mechanisms causing water hammering events in pumping systems is introduced. Based on the law of pressure, propellant filling systems can be applied for water hammering problem identification. The main aim of this paper is to find the effect of water hammering on a filling system during the filling process [16]. Finite time-optimal control of the problem is the mathematical model-based theory by which transient pressure surge can be measured. When suddenly fluid flow is stopped by valve closure, water hammering occurs in the system. Valve actuation strategies have been identified by optimal control theory. Water hammering analysis is a vital work of a pipeline system’s design process for water distribution networks. [17]. The most important results of a theoretical, experimental, and in situ investigation have been developed in connection with a water supply pumping pipeline failure. This incident occurred after the power failure of the pumping system caused the burst of a prestressed concrete cylinder pipe [18]. For transient operation, higher-order modeling of a hydropower plant is needed. Stability analysis is done for different loads, and significant analysis is done to stabilize the network. However, some optimization problems still exist in the model, which needs to be improved [19]. Rocket propellant filling piping is a mathematical model-based approach for the analysis of water hammering. This model is suitable during the filling of the spaceflight pipeline filling. It is helpful to identify the error in the filling process, but the control method needs to be improved further [20]. Various conventional methods have been discussed above, but each method has some drawbacks. For overcome these drawbacks, ML-based predictive control technology can be used as a solution.
This work is an attempt to apply the predictive control method with the help of an ML algorithm for the detection of water hammering problems in different pressure bars, by creating a fault in the system manually and by the sudden closing and opening of valves. This article is formulated as follows: Section 1, i.e., the introduction, describes the previous work done on water hammering fault detection in pumping systems by conventional and intelligent control systems. Section 2 describes the methodology, which includes the mathematical representation of water hammering in Section 2.1, the ML approach, i.e., application of the linear regression method, one of the ML algorithms, in Section 2.2, a description of the proposed method of this work in Section 2.3, a description of a pump set-up in Section 2.4, and a description of the feature-extraction process in Section 2.5. Section 3 is a description of real-time simulation results, which includes a linear regression model in Section 3.1, and Section 4 describes the experimental hardware set-up. Section 5 describes the comparison of previously proposed work with the ML-based work. Lastly, the overall procedure is discussed in Section 6, and an overall conclusion is made in Section 7.
2. Methodology
2.1. Mathematical Representation of Water Hammering
Water hammering is a pressure surge. The pressure profile is calculated by the Joukowsky equation, Equation (1).
where is the flow velocity change in m/s, is the density of the fluid in kg/m3, a is the wave propagation velocity m/s through the fluid in the pipeline and is the pressure change in N/m2. If the liquid is water, then is 1000 kg/m3. Another equation can be represented for pressure-head change, Equation (2).
where a is wave propagation velocity change in m/s, g is the acceleration due to gravity (9.81 m/s2), and is the pressure-head change in meter.
The wave propagation velocity can be defined by modified Hook’s law, which depends on the stiffness of the fluid and pipe wall, Equation (3).
where K is the bulk modulus of the fluids (for water K is 2.19 × 10⁹ pa) D is the pipe diameter, E is Young’s module of the pipe material, and e is the wall thickness of the pipe. In the proposed work, the value is 150 m/s based on the pipe wall and pipe diameter of PVC pipe.
The figure describes pressure and velocity waves for a frictionless pipe when the valve is suddenly closed. In each step, how the pressure profile is changing has been highlighted. In the first case, when t = 0, the pressure profile is steady, which is shown by the pressure-head curve running horizontally because of the assumed lack of friction. Under steady-state conditions, the flow velocity is v0. In the second case, high-pressure has been created due to the sudden closure of the gate valve. The pressure wave is created in the opposite direction to the steady-state direction of the flow. The process takes place in a period where the amount of time needed by the pressure wave, and to travel up and down the entire length of the pipeline. The value of Tr is . In the third case at the reservoir pressure is constant, and the unbalance condition has been created. In the fourth case the head of travels downstream of the gate valve. In the fifth case, after arrival at the closed gate valve, the velocity changes from −v0 to v = 0. Here, an adverse change in the pressure head is seen. In the sixth case, when v = 0 the low-pressure wave, travels to upstream of the tank in time . In the seventh case, the pressure resumes at the reservoir’s pressure head. In the eighth case, the wave of increased pressure originating from the reservoir runs back to the gate valve and wave velocity is denoted as v. In the ninth case, at t = 2Tr conditions are the same as at the instant of closure t = 0, and the whole process starts again [21]. Figure 1 is the mathematical representation of the stages of the water hammering situation.
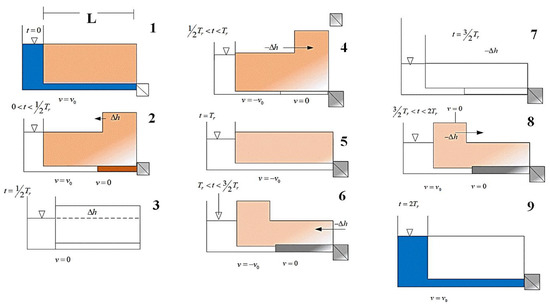
Figure 1.
Pressure and velocity waves in a single-conduit, frictionless pipeline following its sudden closure.
2.2. Application of Linear Regression
Linear regression is a statistical model-based ML approach that may be applied when there is a linear relationship among variables, and it is necessary to study the impact of the independent variable on the dependent variable. The causes of water hammering problems in pumping systems are variations in flow rate, speed, pressure, and velocity, and they have strong relationships between one other. Thus, the linear regression method, which shows a more or less constant or proportional relationship among variables, may be applied for water hammering problem identification in pumping systems. Moreover, linear regression is an ML-based approach, and under the supervised learning category, so it is possible to make a predictive control model with the help of linear regression to predict the outcome of the system. Here, vibration-based technology has been used to collect vibration data using the sudden opening and closing of valves of a VFD-based pumping system, using the Vib Sensor app. This mobile-based app is used through a mobile phone, and the mobile phone is connected to the pumping system to collect continuous data through this app. All the acceleration data was collected, and the relationship between velocity and acceleration simultaneously formed, by the flow sensor flow rate of the pump. From the panel speed change, pressure and current value also have been noted.
Acceleration head loss is sometimes ignored when calculating the Net Positive Suction Head Available (NPSHA). The liquid mass in the suction line to the pump must be started and stopped with every pump stroke. The pump must expend energy to accelerate the liquid into the pump during the suction stroke, and then stop the inlet flow on the discharge stroke. This is the acceleration head component of NPSHA for reciprocating pumps and can be calculated using the formula below.
where ha is acceleration head loss in meter, L is pipe length, V is the velocity of the pump, N is the rotational speed of the pump at a particular velocity, C is constant which depends on pump type, K is a factor representing the reciprocal of the fraction of the theoretical acceleration head, which must be provided to avoid a noticeable disturbance in the suction line, and g is the gravitational acceleration.
ha = L VN C/Kg
After collecting all the data, linear regression is used in the system for vibration signature analysis to detect the water hammering fault.
2.3. Proposed Method
Water hammering is a critical problem in pumping systems and recognized as a hydraulic shock when a pressure surge and wave are created in the fluid, and there is sudden momentum change.
In this work, the pressure head for each valve is measured at different pressures. As the flow rate of the pumping system changes and the velocity of water also changes, the pressure head of the pumping system also changes. When the pumping system pressure head becomes less than the vapor pressure head of the pump, water hammering occurs. Every pump has its own net positive suction head (NPSH). Vapor pressure head is a temperature-dependent gas pressure head. The vapor pressure is that pressure when vapor and liquid are in the equilibrium phase. If it exceeds the value of suction pressure, the flow rate will change, velocity will change, and the overall momentum of the system will change. For this sudden change, the pressure head will decrease and becomes less than the vapor pressure head; a cavitation problem occurs, and with this cavitation problem, due to velocity changes, water hammering also occurs. The pressure value of the pumping system aims to convert the pressure-head value, which has a strong relationship with the flow rate of the pumping system. In this work, a fault is created in the pumping system by the sudden external closing and opening of the valve. After feature extraction, the velocity of water and pressure head of the pumping system values are used as training and testing datasets, and a training model verifies whether the suction pressure head is less than the vapor pressure head or not. If the suction pressure head is less than the vapor pressure head, then the cavitation problem occurs such that, in the proposed method, a water hammering problem is also seen. Otherwise, no-fault will be there (Figure 2). Along with the cavitation problem, if the velocity of the pumping system suddenly changes and flow rate also changes, then a water hammering problem occurs. In the proposed method, both problems are seen, but as the paper concentrates on water hammering problems only; the other problem is not discussed. Here, P is the pressure and VP denote the vapor pressure of the pump. Pressure, speed, acceleration, velocity, and flow rate of the pumping system have been collected to detect water hammering faults, which are taken as input variables for this experimental research investigation.
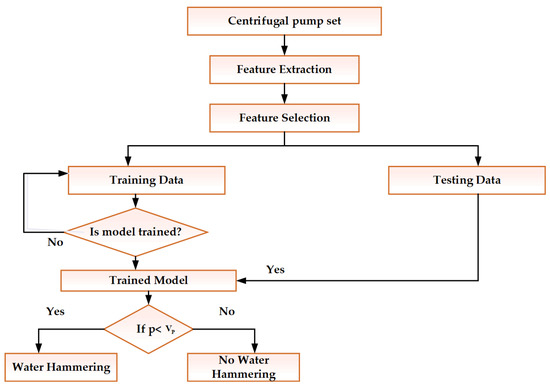
Figure 2.
Generalized algorithm of water hammering.
2.4. Pump Set-up
The variable frequency drive (VFD) is an adjustable speed drive that is used for electromechanical usage to control AC motor speed torque for changing motor voltage and frequency. VFD is beneficial for industrial applications, and recently the use of VFD has increased at a rapid rate. It is an energy-efficient device, and it has been observed that 25% of the world’s overall energy is used for electrical motors, so VFD is required. VFD reduces the size of semiconductor devices and improves the performance of the system. This is made of AC–AC or DC-DC topologies. A multistage cascade pumping system is used for the set-up experiment.
Master–follower cascade control mode offers the best performance, most precise control, and maximum energy savings. It controls multiple equal-sized pumps in parallel, running all pumps at the same speed and stages, with the pumps turning on and off according to system requirements. Compared to traditional cascade control, the number of running pumps is controlled by speed instead of feedback. For obtain the highest energy saving, the on and off variation speed must be set correctly according to the system. The system used here has 3 same-size pumps in a water distribution system. Out of these, one is the main pump or master pump, and the remaining two are follower pumps. A 4–20 mA analogue output format of a pressure transmitter is used for the master–follower pumping system. A warning and alarm are an integral part of prediction and condition-based application. The pumping system has three parallel-connected 3-phase, 415-volt, 0.75 hp, 2-pole, 50-Hz induction motors. The suction side pipe length is 5.23 m, and the discharge side pipe length is 4.23 m. The block diagram and real-time experimental set-up are shown in Figure 3 and Figure 4. In general, how the total power has been consumed, concerning time for both wrongly adjusted speed by VFD drive and correctly adjusted speed in VFD drive, is shown in Figure 5.
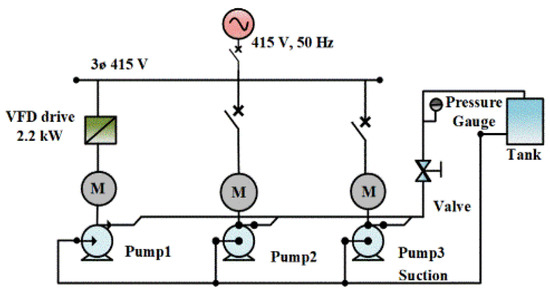
Figure 3.
VFD-based multistage pumping system block diagram.
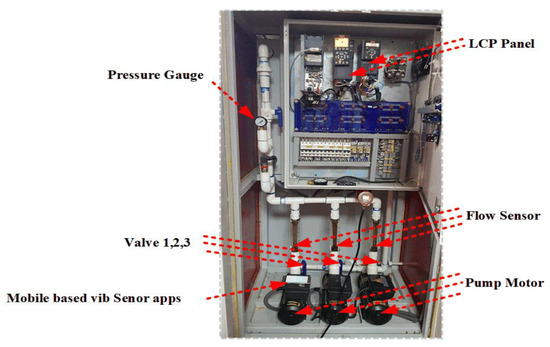
Figure 4.
Experimental pumping set-up.
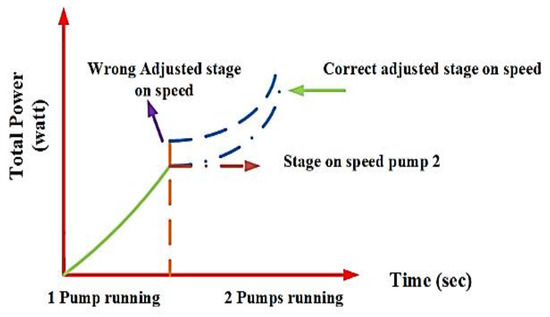
Figure 5.
Total power consumption.
2.5. Feature Extraction
The pressure head Vs velocity of the fluid of a centrifugal pump is measured for three pumps, where one is a master pump, and the other two are follower pumps. The external force is created by the sudden closing and opening of the valve, and this is the key feature of the research to create a fault within the system and to change the momentum of the fluid. For the change of momentum, the flow rate of the pumping system, the velocity of the fluid change, and pressure head decrease. Water hammering occurs as the velocity changes suddenly in the system. The velocity Vs pressure-head curve for 3 pumps has been analyzed in this work. The process is done by sudden closing and opening of one valve first, then two valves, and finally three valves of the pumping system. At different pressures, the flow rate of the pump and velocity of the fluid is collected, and the pressure head is measured separately at the time of the opening and closing of one valve, two valves, and three valves. The resultant obtained values of the pressure head were plotted concerning velocity variation. Again, different pressure-head values of the three valves concerning time is described, where sudden closing and opening characteristics of one valve, two valves, and three valves are measured. In the figures, pressure changes and sudden velocity changes are indicated (Figure 6 and Figure 7). The velocity of the pumping system and cross-sectional area of the pump is described in Equations (5) and (6):
where V stands for velocity, Q is the flow rate of the pumping system, A is the cross-sectional area of the suction pipeline, and D is the diameter of the pipeline of the pumping system.
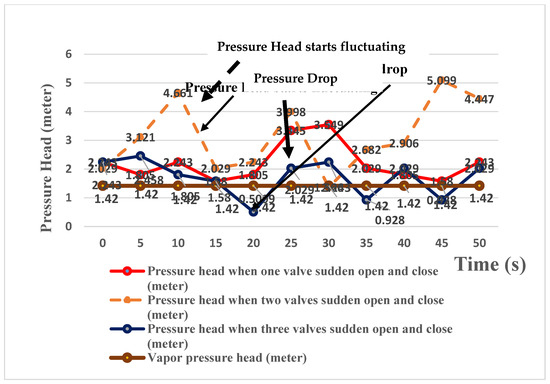
Figure 6.
Pressure head processes behind the pump of complete-time series in different positions of the valve.
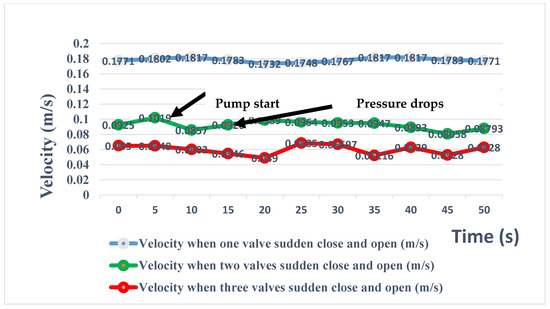
Figure 7.
The velocity of pump processes behind the pump of a complete-time series in different positions of the valve.
3. Real-Time Simulation Results
The pressure head for different valve opening and closing times at different flow rates were evaluated. From the flow-rate values, the velocity is calculated using Equation (5). The diameter of the pump is 0.102 m based on PVC material collected from the datasheet given by the manufacturer, and the pressure head is calculated to meter from the bar for comparisons. The vapor pressure head at 680 F is 1.42 m, calculated for this pump using the vapor pressure chart. The pipe martial is ASTM D2467 SCH 40 PVC. The diameter of the pump and the length of the pipeline have significant effects on water hammering problem detection [22]. For simplicity of the calculation, the flow-rate value of the pumping system is converted to m3/s. The pumping system valve opening and closing data were collected from the experimental set-up (Table 1). At different set pressures and times, the flow rate and velocity values of the pumps have been calculated where the pressure head of the pump changes for sudden closing and opening of the valves. This experiment was done with a time difference of 0.5-s gaps. Nevertheless, valve-closing time TC is less than 1 s, i.e., 0.07 s, whereas returning wave time Tr is 0.123 s, based on pipe length and wave propagation velocity change. Generally, TC is less than Tr for rapid water hammering. As the pipe length and diameter is small in the experimental set-up, the water hammering that occurs in the proposed research is rapid water hammering [23,24]. As the Vib Sensor app has some limitations to take data such, as it is unable to take data for more than 1 min, and variations of pressure are up to 2 bars only, so as to check the variations of the healthy and faulty condition at every 5-s gap, a fault has been created. Nevertheless, the pipe length is small, so the valve-closing time is less than 1 s, i.e., 0.07 s. The master–follower pump takes some time to reach an optimum point, which is also one reason that every 5-s time gap fault has been created for experimental analysis.

Table 1.
Real-time data from the pump.
The pumping system was made to run at a constant speed, and the different pressure values were assigned by the user to collect the flow rate, velocity, and pressure-head value of different valve-closing and -opening times. At different pressure bars, other parameters, i.e., velocity and flow rate, are measured for faulty and not-faulty conditions. Table 1 shows sudden variations in the flow rate when the valves of the pumps are closed and opened suddenly. For that reason, the pressure-head value also drops suddenly. Initially, one valve is closed, and the pressure-head variation is noted, then for the two-valves and further for three-valves condition, the same procedure is repeated. The corresponding variation in the flow rate also is recorded. The pressure and flow-rate values are collected at different times. In different cases, i.e. at different times, pressure-head and velocity values are calculated where the flow of water starts fluctuating, and water hammering status is observed (Figure 6 and Figure 7). Usually, during the changes of velocity, sudden pressure-head drops for sudden closing and opening of valves, water hammering occurs. When one valve is suddenly closed, and opened pressure head values, do not drop below vapor pressure head value which is 1.42 m for any time and therefore no water hammering occurs. But when two valves are suddenly closed and opened pressure head drops rapidly from 3.998 m to 1.336 m, which is below vapour pressure head value that is 1.42 m, and therefore water hammering occurs. When three valves are suddenly closed and opened pressure head values drop from 1.580 m to 0.5099 m, from 2.243 m to 0.928 m, from 2.029 m to 0.928 m. In all these cases, pressure head values are below vapor pressure head value, i.e. 1.42 m, and water hammering occurs. Due to pressure changes, the pressure-head drops rapidly, i.e., from 3.998 m to 1.336 m when two valves are suddenly closed and opened, and from 1.580 m to 0.5099 m, 2.243 m to 0.928 m, and 2.029 m to 0.928 m when three valves are suddenly closed and opened; in this case, flow rate also changes rapidly. Thus, sudden change of pressure head, velocity, and flow rate leads to both cavitation and water hammering in the system (Table 1). In this work, at different times, i.e., starting from 0 to 50 s time, data are collected. For the sudden closing and opening of valve pressure drops, flow rate changes and velocity changes. When the pressure goes below the vapor pressure head, water hammering occurs as the sudden hydraulic shock is created in the fluid. At every 5-s gap, a fault has been created, i.e., 25 to 30-s change, 15 to 20-s change, 30 to 35-s change, and 45 to 50-s change.
3.1. Linear Regression Model
Water hammering is a transient flow in pipes, created by rapid changes of velocity in pipelines. This phenomenon can occur because of an increase and decrease of pressures in water pipelines. Thus, water hammering is created by sudden closing, shutting off, or sudden restarting of valves. ML, more specifically, the field of predictive modeling, is primarily concerned with minimizing the error of a model or making the most accurate predictions possible. In applied ML, it is possible to borrow, reuse, and steal algorithms from many different fields, including statistics, and use them towards these ends. As such, linear regression was developed in the field of statistics and studied as a model for understanding the relationship between input and output variables, and it is borrowed by ML. It is both a statistical algorithm and an ML algorithm. It is possible to calculate the R-square error; the root mean square error in the regression model is based on the number of observations. The pressure head and velocity have an inverse relationship in the linear regression model. As velocity increases, the pressure head of the system decreases. In this research, the number of observations is 11, error degrees of freedom are 9, root mean squared error is 0.67, and root squared error is 0.0204, whereas adjusted R-square error is 0.0884, a system error is 0.08 (Table 2). It is applicable when three valves are suddenly closed and opened. Several ML algorithms are used, but, among those, the linear regression method is more accurate regarding training time and prediction speed. Head loss due to pipe friction can be calculated by using the Darcy–Weisbach formula. The boundary condition can be implemented for the head value of the pump and velocity of the fluid. The head value (H) is constant if the water surface elevation is constant in time. It is represented in expression form as Equations (7)–(8). At the initial condition, the head is denoted by H0 and Hp1 is the head value for Case 1 [23]. H is the head of the pump in different pressure, V is velocity, g is gravitational acceleration, a is the wave propagation velocity change, f is friction factor, D is the diameter of the pipe of the pump, T is total time, and t is a particular time, and N is the speed of the pump.
Table 2.
Accuracy of various algorithms.
The velocity expression is
Let us assume the valve is closed so that the velocity decreases from V0. The velocity behaviour measured in terms of constant time TC. TC is the valve closure time. VP is vapor pressure, is vapor pressure at next speed; see Equation (9):
The equation for HP is Equation (10):
where HN is the head value of N speed and is next pressure-head value of the next speed (Equation (10)).
If, during water hammering detection, the ML algorithms are implemented, then a more suitable algorithm can be detected using the values of RMSE and R2 error. The R2 and RMSE of different algorithms help detect the accuracy level of the system and can find out the best-suited application of the algorithm. Therefore, accurate prediction of the output is also possible. RMSE is the function of the difference between the real and predicted target outputs [25]. During the training stage of the classifier, we need to train the system with the minimum RMSE (error threshold). If the system error converges to the minimum error threshold, the accuracy of the system during the testing stage will be high. Sometimes, if the error is not converged to the error threshold, the programmer may stop the training phase based on the iteration level, but this strategy may lead to less accuracy. In Table 2 and Figure 8, it can be seen that for linear regression the value of RMSE is nearer to a system error and R2 error is also lesser in comparison with the same values of other algorithms (Figure 8). Therefore, linear regression has been chosen for the experiment because it can give more accurate results in this case.
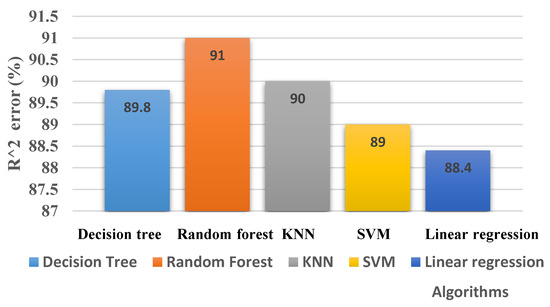
Figure 8.
R2 value of various algorithms.
Real-time data of water hammering status are described in Table 3.
Table 3.
Real-time data for comparing water hammering status.
4. Experimental Hardware Set-up with Vib Sensor App Mounted on VFD-Based Pumping System
The experiment was done with the Vib Sensor mobile phone-based app, which is mounted in the impeller of the pumping system and different pressure bars 1, 1.3, 1.5, 2 bars. In this research VFD based pumping system has been used for the experiment [26]. Vibration details are recorded for analysis of the motor and pumping state to predict water hammering. Figure 9 shows the regression analysis and Figure 10 shows the vib sensor mobile-based app. The experiment was done by the sudden closing and opening of one, two, and three valves, respectively (Table 3). The Vib Sensor app was mounted to the pump impeller and the sensitivity of acceleration, velocity, and displacement for the app was 0.2 g, 1.1 m/s, and 20 microns, respectively. The data were recorded at a sample rate of 50 kHz. Fast Fourier transformation (FFT) analysis [26,27,28] was done in a time-frequency pattern, and it was identified that the signal is noisier, and there is the presence of harmonics when there is a fault rather than a threshold condition (Figure 12). With the help of the power spectrum analyzer and with the recorded data, ML algorithms were implemented to predict faulty conditions. It was seen that at various pressure bars when a fault is there, the signal is noisier than the normal condition (Figure 12). In both Figure 11 and Figure 12, it was noticed that with an increase in pressure, noise also increases. Therefore, when the pressure bar increases, the flow rate decreases, and ultimately, the vapor pressure bar goes below the pressure bar, and water hammering occurs (Figure 11 and Figure 12). In Table 5, various parameters such as velocity, acceleration, and displacement in healthy and faulty conditions were compared, and mainly regression analysis was used as its accuracy rate is higher than other ML algorithms. The accuracy of various ML algorithms was tested with the same test data and was compared in Figure 13 with respect to data size and overall accuracy, as compared in Figure 20. The figure describes the classification of faulty and not-faulty points when regression is applied (Figure 9). After the collection of all the data through the Vib Sensor app, the data has been analyzed through MATLAB in different velocities and pressure heads, and it is seen that red-figure points within a square are the faulty points when the pressure value goes below vapor pressure head, velocity changes suddenly, and hydraulic shock is created, and blue points marked with a circle are not-faulty points when there is no change of sudden velocity. This result was obtained after regression analysis and was done through MATLAB software using real-time data. Faulty and not-faulty points can be separated through regression analysis.
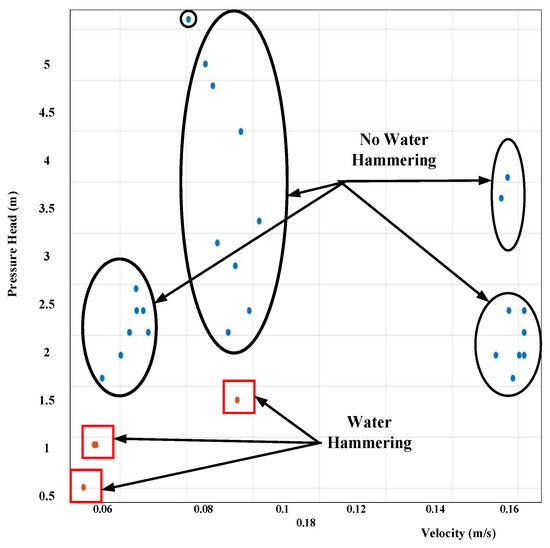
Figure 9.
Regression analysis for fault detection.
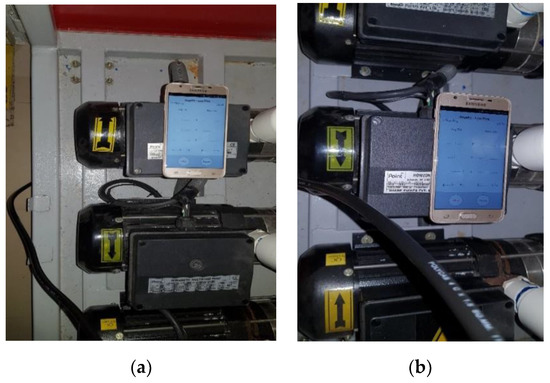
Figure 10.
(a) Mobile-based app-connected to the pump motor, (b) Vib Sensor mobile-based app.
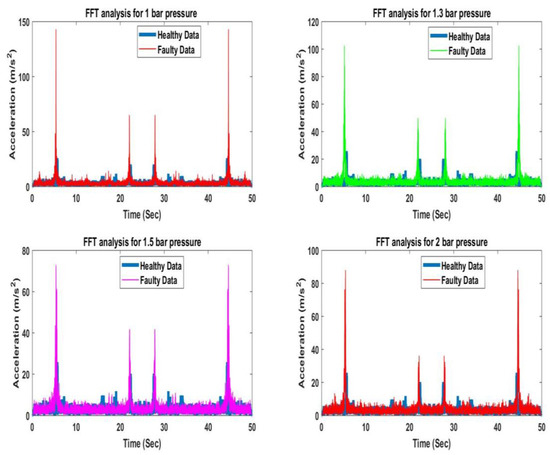
Figure 11.
FFT analysis of healthy and faulty data of different acceleration concerning time.
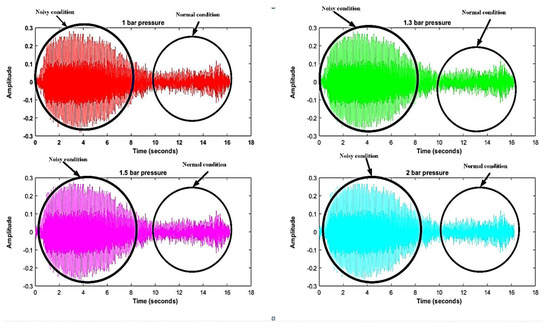
Figure 12.
Analysis of noisy and typical frequency spectrum in the time domain in various pressure bar (regression analysis).
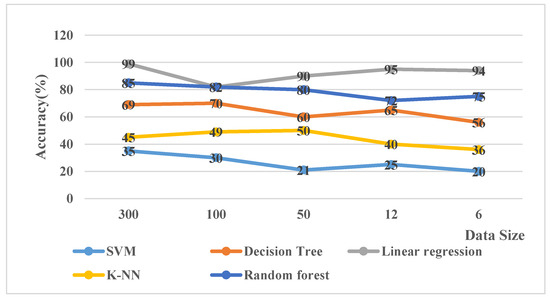
Figure 13.
Comparisons among ML-based classification algorithms with data size.
The Vib Sensor mobile-based app is shown to project the experimental process in Figure 10a,b. With the help of this app, at different times, vibration data was collected concerning acceleration. Acceleration has a strong relationship with velocity, which is related to the flow rate of the pump. Changes to acceleration lead to changes in velocity and flow rate of the pump. Figure 11 shows different acceleration values concerning time in the healthy and faulty conditions, whereas at different time amplitudes, the signals are collected for noisy and healthy conditions, and regression analysis has been applied, which is projected in Figure 12. At different pressure bars, the operation of the valves of the three pumps at the time of sudden closure and opening of one valve, two valves, and three valves is described in Table 4. The vibration results of healthy and water hammering conditions are shown in Table 5.
Table 4.
Switching states of VFD-based parallel pumping system.
Table 5.
Vibration analysis result.
5. Comparison of Previously Proposed Work with the ML-Based Work
For establish the novelty of the work, some previously proposed conventional methods and some predictive control methods, as well as their works and results, are compared with the ML-based intelligent system. Lots of conventional methods are available, which is very helpful for identifying the anomalies in the system when the ML method was not implemented. These are the velocity adjustment method, wave characteristics method, column separation method, and variations of water hammering using valve opening and closing, etc. The main disadvantages of most of the conventional methods are they are unable to predict faults at the initial level, they take more time for analysis, and some of the methods are only theoretically tested. The methods are complex and mathematically based, and not applicable for all kinds of data. In the application of ML algorithms, Support Vector Machine (SVM), Principal Component Analysis (PCA), and Decision tree are also useful for the feature extraction of large data, and if the data size is small, then regression or K-Nearest Neighbor (KNN) can be applied. Before the ML application model, predictive control method was also used, which could predict anomalies, but this also had some limitations. Variations in valve closing and opening are some of the methods which can detect anomalies in the system by the change of pressure in different valve opening and closing times. The whole method is based on the characteristic’s method.
Figure 14 shows how indifferent percentages of valve opening negatively varies the water hammering pressure (WHP). The valves are opened and closed in different percentages, i.e., 25%, 50%, 75%, and 100% and at different closure times. Therefore, it is difficult to measure the accuracy of the process if different times and different percentages of aperture are operated [1].
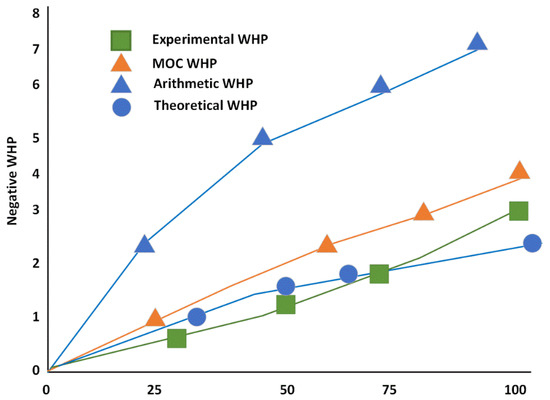
Figure 14.
Variation of water hammering pressure along with the percentage of valve opening.
Moreover, the methods of characteristics (MOC) method is a mathematical model-based method and cannot predict anomalies in the system before the system is shut down. It cannot predict the accuracy of the system. However, in the proposed method, the accuracy of linear regression concerning accuracy rate, prediction time, and training speed is 90%.
The column separation method is one of the oldest conventional methods to detect water hammering in a system. It can be used when a pipeline is full of liquid. However, the proposed predictive control-based system can predict the anomalies even if the pipeline is not fully filled by fluid. The column separation method is a mathematical model-based method; one of the models in this category is the discrete cavity model. Figure 15 shows how, for different head-value changes, velocity changes, but it can be done by complex numerical solutions, as this method was invented before the computational method started. However, the proposed method is a computational method. For this method, the calculations can be done by computer-based programming so that time can be saved, and energy loss can be prevented [3].
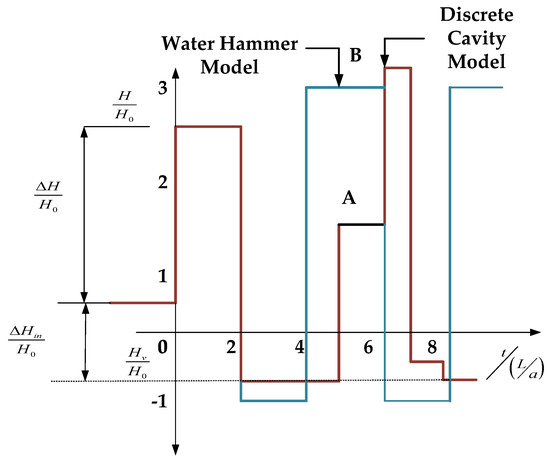
Figure 15.
Discrete cavity model for column separation.
MOC is also a traditional method for water hammering detection by using ordinary differential equations. All the calculations have been done based on boundary equations. Figure 16 shows the computational mesh grid with the index for MOC. For compute the pressures and flow velocities, it is necessary to know the initial conditions of the previous step. Therefore, it is a very time-consuming method. If the previous step value cannot be computed, the complete analysis will be stopped. However, in the case of the proposed method, the value will be automatically transferred to the next value as a training set, so the process will never be hampered, and anomalies can be detected easily [25].
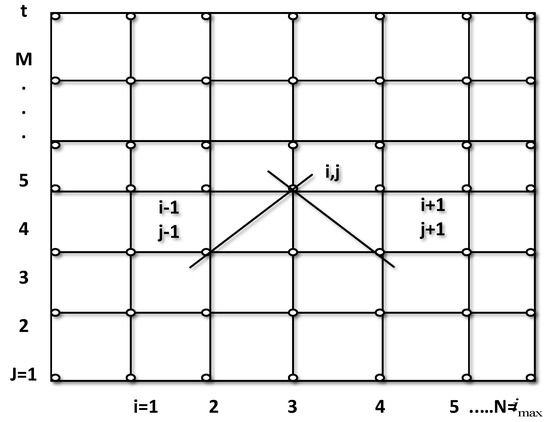
Figure 16.
Computational mesh grid with an index for MOC.
The wave characteristics method is a straightforward method to identify water hammering. Rapid changes in the velocity of fluid during valve closing generate high pressure, which is transmitted through the system at the speed of sound. The method is based on the mathematical model, and the whole process is time-consuming. The processes can be done one by one, i.e., after the detection of one pipeline’s anomalies, the next pipeline’s anomalies can be detected. Figure 17 shows the change of velocity when valves are closed. However, in the proposed ML-based method, at a time n, no pipelines’ anomalies can be detected [18].
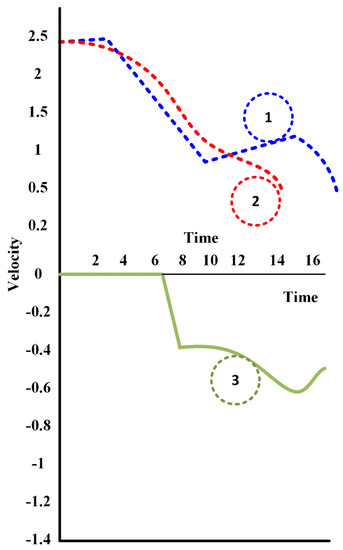
Figure 17.
Characteristics of velocity when valves are closed.
Instead of conventional methods, the predictive control based intelligent method also can be implemented for the identification of the fault. SVM is one of the intelligent methods that can be implemented mainly for identification of faults and binary classification. Sludge, electrical fault and cavitation problem in the pumping system can be identified and classified by SVM easily [29,30].
The velocity adjustment method can be done by controlling the velocity and keeping the velocity at a constant value. The method can be implemented for a multiple-valve system, but then velocity will be variable and valve closure time will be more like 44 s, so the method is more time-consuming. It can be implemented in the mine drainage system. Limited space and the change of costly equipment are the main characteristics of mine drainage systems. For the problem of valve-closing water hammering, protection of a mine drainage system requires a protection method based on velocity adjustment of the hydraulic valve system [17]. Figure 18 shows the flow chart of the water hammering detection method. The Lax–Wendroff difference method with nonlinear filter can solve water hammering in a pumping system. It is better than the MOC method, as it does not depend on time changes. However, in instantaneous valve closure and pressure discontinuities, the method fails to predict the fault [31].
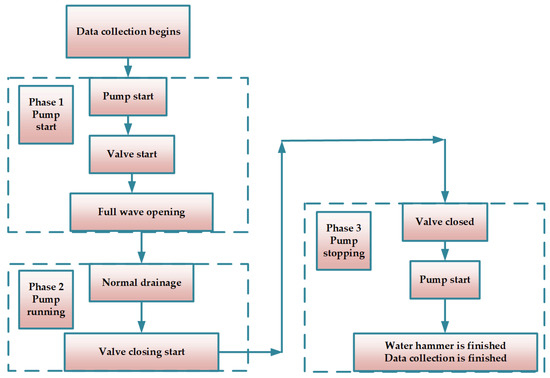
Figure 18.
Flow chart of water hammering detection using velocity adjustment method.
Previously, the model predictive control method was used to identify faults in a system. For fault detection of a six-phase induction machine and fault detection of a boiler, predictive control methods are applied. The model predictive control is also mathematical model-based technology. In induction motor applications, it can adapt the flux value to reduce copper loss. However, tests can be done when there is an open-loop system. In a closed-loop system, robust system model predictive control technology is challenging to implement [32,33]. The Kalman filter-based soft sensor can predict faults for an electro-pump system. The method is applicable to nonlinear systems. The main disadvantage is it is applicable only for sensory soft-fault detection and can only be theoretically applied. Practically, the method has not yet been tested [34]. PCA is one of the ML methods by which the spring fault and off-shoe fault of a pumping system can be detected. However, this method can also only be theoretically applied, and so far, has not been applied practically [35]. Cavitation problems in the pump can be easily identified by the load torque signature analysis method. This is an experimental procedure and can be successfully implemented in a frequency inverter drive-based pumping system [36]. For an axial piston pump, a spare SVM algorithm can be applied, which is one of the simple ML algorithms for fault detection. The SVM model can accurately detect bearing faults in the axial lubricating pump, which is 96.67%. However, one problem of this experimental procedure is if the dataset is large then SVM will work better, but if the dataset is small, then the feature extraction will not be accurate using this algorithm [37]. For small data sizes, SVM accuracy is 70%, and for PCA it is 55%. However, regression analysis has 90% accuracy, and K-NN has 80% accuracy for small data sizes.
Various methods are described for water hammering detection. Among them, most of the processes are conventional and non-computational. Based on their performances and prediction times for anomaly detection, the accuracies of the described methods are compared in Figure 19. From the figure, a conclusion can be drawn that among all the methods, ML-based intelligent method, notably the regression algorithm, can give more accurate results than other methods, as it can train both large and small amounts of data within short periods of time and predict anomalies at the initial stage. This method can be applied in any industrial application. For larger sizes of data, SVM can be used. For small sizes of data, K-NN is also an alternative way.
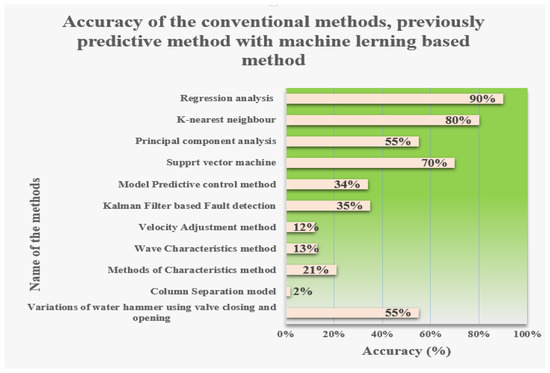
Figure 19.
Comparison of various conventional and predictive control methods with ML-based predictive control method.
6. Discussion
In this work, the prediction of the fault and the no-fault situation has been identified by the linear regression method. From the waveform, it is verified that at the low-pressure point, water hammering can occur. To elaborate, it happens that when the device pressure head becomes less than the vapor pressure head, i.e., 1.42 m, a high-velocity point occurs where the possibility of pressure drop is high. It is mainly due to sudden changes in hydraulic velocity shock in the pipeline, and water hammering occurs. It is shown that the accuracy of linear regression is highest, the prediction speed is 5 obs/s, and the training time is 16.677 s (Figure 20). Before artificial intelligence (AI) technology was invented, conventional methods such as MOC, wave characteristics method, column separation method, and velocity adjustment method, investigation through pipeline methods were used to identify water hammering. However, these are complex, time-consuming, and numerical analysis-based methods, and a few fails to predict the problem at the initial stage itself so enormous energy is lost. In an AI-based neural network, ML, optimization algorithms-based genetic algorithm and heuristic algorithm-based techniques have introduced a significant change in industrial applications.
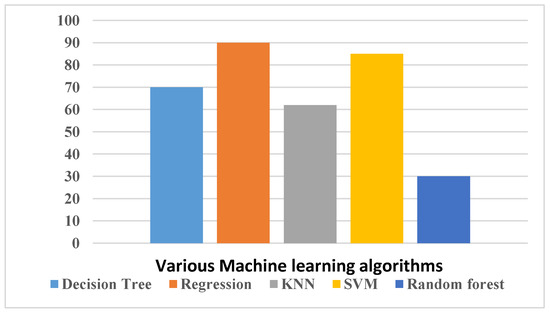
Figure 20.
Comparisons of the overall accuracy of different ML algorithms.
Also, ML plays a significant role in fault detection. It is highly predictive control-based technology that predicts the anomalies at the initial stage so that the device can be saved from total failure. Huge energy loss can also be prevented. It can handle massive data, and within a few seconds, it can predict a fault. So continuous monitoring is possible by ML-based predictive control method. In Section 5, the conventional methods such as MOC, wave characteristics, column separation, valve closing and opening, model predictive control, etc. are compared with the ML-based predictive control method. From Figure 19, after comparing the accuracy of all the methods with the proposed ML-based method, it is seen that an ML-based method, mainly regression analysis, can provide more accurate results, as it takes less time for prediction, and can handle both large amounts of data and small sizes of data. In the proposed research, the data size is small, so regression analysis has been chosen for the identification of faults. The performance of the intelligent method is also high, whereas the model predictive control method can predict anomalies when the system is open-loop and small. In the case of a robust system, it cannot show an accurate result. Variation of valve-closing and -opening method is a simple method. When using different percentages of value, valves are closed, and this method can be applied.
The novelty of the proposed work is to reduce prediction time by implementing ML technology, reducing energy loss, and getting more accurate results of the output of the system. It handles a robust system, and both open- and closed-loop conditions can be implemented. Table 6 is a comparison of various conventional methods and predictive control methods based on ML algorithms.
Table 6.
Comparison among conventional methods, previously proposed predictive control methods and machine-learning-based methods for water hammering detection.
Table 6 shows that predictive control technology-based ML algorithms, mainly regression analysis, can give more accurate results than any other method.
The pressure–velocity curve was analyzed in the proposed study and pressure variation under different valve-closing and -opening conditions have been collected. The system has 3 pumps. The variation of the flow rate for valve closing and the opening has been performed and recorded in a sequential manner (Table 3).
Figure 6 and Figure 7 show that when one valve of the pump is suddenly closed and opened again, variation is not so steep and a pressure drop has been noted. It is not critical, as other pumps are in running conditions and their valves are open. When, in the second case, two valves are suddenly closed and opened, there is a steep variation in pressure and velocity concerning time. However, in the third case, the exact steep variations are observed due to sudden closing and opening of three valves (Figure 6 and Figure 7). At different times, pressure-head value changes for three valves. The pressure head in this situation goes below the vapor pressure head [27,28]. Therefore, in the third condition, interruption of the operation is more than the other two and fault, and the no-fault condition has been identified (Figure 9). Figure 11 shows the FFT analysis of vibration in a time-frequency pattern at different pressure bars under normal and faulty conditions. Figure 12 shows the regression analysis in the time domain at four different pressure bars to predict weak points. Various algorithms can be used for the prediction of faults in the system, among which SVM and regression analysis are suited for fault prediction in a pumping system. Figure 19 shows the overall accuracy of some conventional methods and ML-based predictive control method. The accuracy of the linear regression algorithm is higher than other ML algorithms. Concerning prediction speed, training time, and accuracy, it is identified that regression analysis is the best-suited method (Figure 20).
7. Conclusions
This experiment has been done to identify water hammering in VFD-based master–follower parallel pumping systems using the Vib Sensor app. It is an experiment-based work, and an industry-academic joint collaborative work to discover the solutions for an industrial pumping system. The main contribution of this research is the application of ML algorithms, mainly regression algorithm, to identify water hammering in a pumping system that is less complicated, handles a large amount of data, takes less time to classify faults, and predicts anomalies at the initial stage to save the device from total failure. At four different pressures, i.e., 1, 1.3, 1.5, and 2 bar pressure head, the flow rate of the pump has been measured under both normal and water hammering conditions. Here, vibration data has been collected through the Vib Sensor app fixed to the pump motor and by FFT analysis for both normal and water hammering conditions. The current signature has been analyzed using time-domain analysis, and it is demonstrated that when the fault occurs, more noise is created compared to the signal. At different pressures and velocities, there is fluctuation to the flow of the water, as shown by Figure 7 and Figure 9. When the pressure head drops suddenly, and sudden hydraulic shock is created in the pipeline, only water hammering is seen. Figure 9 shows a water hammering point and no water hammering point to classify the faulty and not-faulty points. In Figure 9, red points marked with a square area are the faulty points, and blue points marked with a circle are not-faulty points. After collecting data to predict the problem, various ML algorithms have been applied. Among them, linear regression has more accuracy with respect to prediction speed, training time, and accuracy rate. It is seen that the application of an ML algorithm reduces the time for the prediction of a fault, which is helpful for solving problems very fast and thus preventing damage to the whole pumping system. When ML-based techniques are compared with conventional methods, it is seen that regression analysis is a more accurate and less time-consuming predictive method rather than any other technique. In future, other features of water hammering such as materials of the pipe, valve types, water level reservoir, etc. will be considered to obtain more accurate results regarding anomaly detection. In other industrial applications, ML can also be applied in future.
Author Contributions
N.D., K.P. have done the fault analysis in VFD based multistage pumping system, U.S. jointly for analysis of different valve position, the nature of the faults using regression analysis. S.P., J.B.H.-N., F.B., D.J.A. shared their expertise in the field of power electronics, control and fault analysis in pumping system using variable speed ac drives. All authors involved equally to articulate the research work for its final depiction as a full research paper. All authors have read and agreed to the published version of the manuscript.
Funding
This work was supported by the Renewable Energy Lab, Department of Communications and Networks, College of Engineering, Prince Sultan University, Riyadh, 11586, Saudi Arabia.
Acknowledgments
This research work activity carried out on an industry-academic collaborative project. Thanks to all partners, VIT University, Vellore, India, and Danfoss Pvt. Ltd. industry Chennai and Denmark. For carrying out the work the authors got support from Danfoss Advance Drives laboratory, VIT University, India, Renewable Energy lab, Prince Sultan University Saudi Arabia, Center for Bioenergy and Green Engineering (Esbjerg)/Center for Reliable Power Electronics (CORPE-Aalborg), Aalborg University, Denmark. For this research, the authors owe their gratitude to all these institutions.
Conflicts of Interest
The authors declare no conflict of interest.
Abbreviations
| AI | Artificial Intelligence |
| DL | Deep learning |
| FFT | Fast Fourier Transformation |
| HCV | Hydraulic control valve |
| KNN | K-nearest Neighbor method |
| ML | Machine learning |
| MOC | Methods of characteristics |
| NPSH | Net positive suction head |
| PCA | Principal component analysis |
| RMSE | Root means square error |
| SVM | Support vector machine |
| VFD | Variable Frequency Drive |
| VSD | Variable Speed Drive |
| WHP | Water hammering pressure |
| a | Wave propagation velocity (m/s) |
| A | Area of the pump (m2) |
| D | Pump impeller Diameter [mm] |
| f | Friction factor |
| F | motor frequency [Hz] |
| g | Gravitational acceleration |
| H | Pump Head [m] |
| L | Length of the pump(m) |
| N | Speed of pump [rpm] |
| P | Pressure |
| Q | Flow rate [m3/s] |
| T, t | Time [sec] |
| TC | Valve closure time |
| Tr | Wave returning time |
| V | Velocity of the fluid(m/s2) |
| Vp | Vapor pressure |
References
- Patel, A.K. Experimental Study of Water Hammer Pressure in a Commercial Pipe. IOSR-JMCE 2016. e-ISSN: 2278-1684, p-ISSN: 2320–334X. [Google Scholar] [CrossRef]
- Tripathy, A.K.; Nambiar, P.; Pereira, A.; D’souza, S.; Rodrigues, L.; D’sSouza, A.; D’sSouza, B.; D’mello, B. Pressure surge analysis in pump systems. In Proceedings of the 2015 International Conference on Technologies for Sustainable Development (ICTSD), Mumbai, India, 4–6 February 2015; pp. 1–5. [Google Scholar]
- Bergant, A.; Simpson, A.R.; Tijsseling, A.S. Water hammer with column separation: A historical review. J. Fluids Struct. 2006, 22, 135–171. [Google Scholar] [CrossRef]
- Jiang, J.; Huang, G.; Nie, L.; Dong, S.; Chen, X. A multi-valve protection from water hammer in long-distance pipelines. In Proceedings of the 2011 International Conference on Materials for Renewable Energy & Environment, Shanghai, China, 20–22 May 2011; Volume 2, pp. 1835–1838. [Google Scholar]
- Liu, Y.; Huang, Z.; Jiang, C. Characteristics of water hammer induced by valve-valve systems. In Proceedings of the 2015 International Conference on Fluid Power and Mechatronics (FPM), Harbin, China, 5–7 August 2015; pp. 1–5. [Google Scholar]
- Bergant, A.; Simpson, A.R.; SIJAMHODZIC, E. Water hammer analysis of pumping systems for control of water in underground mines. In Proceedings of the Mine Water Congress, Ljubljana, Slovenia, 25–30 September 1991; pp. 9–20. [Google Scholar]
- Zhao, W.; Wang, Z.; Lu, C.; Ma, J.; Li, L. Fault diagnosis for centrifugal pumps using deep learning and softmax regression. In Proceedings of the 2016 12th world congress on intelligent control and automation (WCICA), Guilin, China, 12–15 June 2016; pp. 165–169. [Google Scholar]
- Chamani, M.R.; Pourshahabi, S.; Sheikholeslam, F. Fuzzy genetic algorithm approach for optimization of surge tanks. Sci. Iran. 2013, 20, 278–285. [Google Scholar]
- Negnevitsky, M.; Mandal, P.; Srivastava, A.K. Machine learning applications for load, price and wind power prediction in power systems. In Proceedings of the 2009 15th International Conference on Intelligent System Applications to Power Systems, Curitiba, Brazil, 8–12 November 2009; pp. 1–6. [Google Scholar]
- Wang, H.; Chen, P. Sequential condition diagnosis for centrifugal pump system using a fuzzy neural network. Neural Inf. Process. Lett. Rev. 2007, 11, 41–50. [Google Scholar] [CrossRef]
- Jung, B.S.; Karney, B.W. Optimum selection of hydraulic devices for water hammer control in the pipeline systems using a genetic algorithm. In Proceedings of the ASME/JSME 2003 4th Joint Fluids Summer Engineering Conference, Honolulu, HI, USA, 6–10 July 2003; American Society of Mechanical Engineers Digital Collection, 2003; pp. 2877–2883. [Google Scholar]
- Roy, J.K.; Roy, P.K.; Basak, P. Water hammer protection in water supply system: A new approach with practical implementation. In Proceedings of the International Conference on Communication and Industrial Application, Kolkata, India, 26–28 December 2011; pp. 1–6. [Google Scholar]
- Kumar, S.; Khare, R. Effect of Pump Inertia & Valve Closure time on the Transient Flow Condition of a Water Supply Network: A Case Study. IJETT 2017, 49, 115–121. [Google Scholar]
- Van Pham, T.; Georges, D.; Besançon, G. Predictive control with guaranteed stability for water hammer equations. IEEE Trans. Autom. Control 2014, 59, 465–470. [Google Scholar] [CrossRef]
- Batterton, S.H. Water Hammer: An Analysis of Plumbing Systems, Intrusion, and Pump Operation. Ph.D. Thesis, Virginia Tech, Blacksburg, VA, USA, 2006. [Google Scholar]
- Youhuan, X.; Ping, Z.; Hui, Z.; Fengtian, B. Numerical Analysis on Water Hammer Characteristics of Rocket Propellant Filling Pipeline. In Proceedings of the 5th International Conference on Simulation and Modeling Methodologies, Technologies and Applications (SCITEPRESS-Science and Technology Publications, Lda, Rome, Italy, 18–20 October 2015; Springer, 2015; pp. 329–335. [Google Scholar]
- Kou, Y.; Yang, J.; Kou, Z. A Water Hammer Protection Method for Mine Drainage System Based on Velocity Adjustment of Hydraulic Control Valve. Shock Vib. 2016, 2016, 2346025. [Google Scholar] [CrossRef][Green Version]
- Pozos-Estrada, O.; Sánchez-Huerta, A.; Breña-Naranjo, J.A.; Pedrozo-Acuña, A. Failure Analysis of a Water Supply Pumping Pipeline System. Water 2016, 8, 395. [Google Scholar] [CrossRef]
- Nicolet, C.; Greiveldinger, B.; Herou, J.J.; Kawkabani, B.; Allenbach, P.; Simond, J.J.; Avellan, F. High-order modelling of hydraulic power plant in islanded power network. IEEE Trans. Power Syst. 2007, 22, 1870–1880. [Google Scholar] [CrossRef]
- Stephenson, D. Simple guide for design of air vessels for water hammer protection of pumping lines. J. Hydraul. Eng. 2002, 128, 792–797. [Google Scholar] [CrossRef]
- Pumps. In KSB Know-How: Planning Information for Amarex KRT Submersible Motor; Pumps Additional Literature, ATV-DVWK-A 134; KSB: Frankenthal, Germany.
- Thorley, A.R.D. Fluid Transients in Pipeline Systems; ASME Press: New York, NY, USA, 2004; ISBN 0-7918-0210-8. [Google Scholar]
- Rasheed, N.J. MATHEMATICAL MODELlING FOR WATER HAMMER IN PIPE FLOW. J. Eng. Sustain. Dev. 2018, 22, 95–108. [Google Scholar]
- Kodura, A. An analysis of the impact of valve closure time on the course of water hammer. Arch. Hydro Eng. Environ. Mech. 2016, 63, 35–45. [Google Scholar] [CrossRef]
- Wan, W.; Zhang, B.; Chen, X. Investigation on Water Hammer Control of Centrifugal Pumps in Water Supply Pipeline Systems. Energies 2019, 12, 108. [Google Scholar] [CrossRef]
- Dutta, N.; Subramaniam, U.; Padmanaban, S. Mathematical models of classification algorithm of Machine learning. In International Meeting on Advanced Technologies in Energy and Electrical Engineering (Vol. 2019, No. 1, p. 3); Hamad bin Khalifa University Press (HBKU Press): Doha, Qatar, January 2020. [Google Scholar]
- Shankar, V.A.; Subramaniam, U.; Padmanaban, S.; Holm-Nielsen, J.B.; Blaabjerg, F.; Paramasivam, S. Experimental Investigation of Power Signatures for Cavitation and Water Hammer in an Industrial Parallel Pumping System. Energies 2019, 12, 1351. [Google Scholar] [CrossRef]
- Shankar, V.K.A.; Umashankar, S.; Paramasivam, S.; Hanigovszki, N. A comprehensive review on energy efficiency enhancement initiatives in centrifugal pumping system. Appl. Energy 2016, 181, 495–513. [Google Scholar] [CrossRef]
- Subramaniam, U.; Dutta, N.; Padmanaban, S.; Almakhles, D.; Kyslan, K.; Fedák, V. Identification of Sludge in Water Pumping System Using Support Vector Machine. In Proceedings of the International Conference on Electrical Drives & Power Electronics (EDPE), The High Tatras, Slovakia, 24–26 September 2019; pp. 403–408. [Google Scholar]
- HS, R.C.; Bharadwaj, S.C.; Padmanaban, S.; Dutta, N.; Holm-Nielsen, J.B. Electrical Fault Detection Using Machine Learning Algorithm for Centrifugal Water Pumps. In Proceedings of the 2019 IEEE International Conference on Environment and Electrical Engineering and 2019 IEEE Industrial and Commercial Power Systems Europe (EEEIC/I&CPS Europe), Genova, Italy, 11–14 June 2019; pp. 1–6. [Google Scholar]
- Wood, D.J. Water hammer analysis—essential and easy (and efficient). J. Environ. Eng. 2015, 131, 1123–1131. [Google Scholar] [CrossRef]
- Zhang, B.; Wan, W.; Shi, M. Experimental and numerical simulation of water hammer in gravitational pipe flow with continuous air entrainment. Water 2018, 10, 928. [Google Scholar] [CrossRef]
- Gonzalez-Prieto, A.; Gonzalez-Prieto, I.; Duran, M.J.; Barrero, F. Efficient Model Predictive Control with Natural Fault-Tolerance in Asymmetrical Six-Phase Induction Machines. Energies 2019, 12, 3989. [Google Scholar] [CrossRef]
- Rezaee, M.; Sadeghzadeh-Nokhodberiz, N.; Poshtan, J. Kalman filter based sensor fault detection and identification in an electro-pump system. In Proceedings of the 2017 5th International Conference on Control, Instrumentation, and Automation (ICCIA), Shiraz, Iran, 21–23 November 2017; pp. 12–17. [Google Scholar]
- Siyuan, L.; Linlin, D.; Wanlu, J. Study on application of Principal Component Analysis to fault detection in hydraulic pump. In Proceedings of the 2011 International Conference on Fluid Power and Mechatronics, Beijing, China, 17–20 August 2011; pp. 173–178. [Google Scholar]
- Lima, C.A.; Stopa, M.M.; Cardoso Filho, B.J.; Miranda, L.S.; Luiz, A.S.A.; Martinez, C.B. Cavitation detection in centrifugal pumps driven by frequency inverter fed motors. In Proceedings of the 2017 IEEE Industry Applications Society Annual Meeting, Cincinnati, OH, USA, 1–5 October 2017; pp. 1–9. [Google Scholar]
- Xia, S.; Zhang, J.; Ye, S.; Xu, B.; Huang, W.; Xiang, J. A Spare Support Vector Machine Based Fault Detection Strategy on Key Lubricating Interfaces of Axial Piston Pumps. IEEE Access 2019, 7, 178177–178186. [Google Scholar] [CrossRef]
© 2020 by the authors. Licensee MDPI, Basel, Switzerland. This article is an open access article distributed under the terms and conditions of the Creative Commons Attribution (CC BY) license (http://creativecommons.org/licenses/by/4.0/).