Article

Mapping Maize Cultivated Area Combining MODIS EVI Time Series and the Spatial Variations of Phenology over Huanghuaihai Plain

1
School of Geosciences, Yangtze University, Wuhan 430100, China
2
Key Laboratory of Digital Earth Science, Aerospace Information Research Institute, Chinese Academy of Sciences, Beijing 100094, China
3
Remote Sensing Information and Digital Earth Center, College of Computer Science and Technology, Qingdao University, Qingdao 266071, China
4
College of Mining and Surveying Engineering, Hebei University of Engineering, Handan 056000, Hebei, China
5
University of Chinese Academy of Sciences, Beijing 100049, China
*
Authors to whom correspondence should be addressed.
Appl. Sci. 2020, 10(8), 2667; https://doi.org/10.3390/app10082667
Submission received: 24 February 2020 / Revised: 7 April 2020 / Accepted: 10 April 2020 / Published: 13 April 2020
(This article belongs to the Special Issue Frontier Trends of Remote Sensing in Agriculture)

Abstract

:
Crop phenology is a significant factor that affects the precision of crop area extraction by using the multi-temporal vegetation indices (VIs) approach. Considering the phenological differences of maize among the different regions, the summer maize cultivated area was estimated by using enhanced vegetation index (EVI) time series images from the Moderate Resolution Imaging Spectroradiometer (MODIS) over the Huanghuaihai Plain in China. By analyzing the temporal shift in summer maize calendars, linear regression equations for simulating the summer maize phenology were obtained. The simulated maize phenology was used to correct the MODIS EVI time series curve of summer maize. Combining the mean absolute distance (MAD) and p-tile algorithm, the cultivated areas of summer maize were distinguished over the Hunaghuaihai Plain. The accuracy of the extraction results in each province was above 85%. Comparing the maize area of two groups from MODIS-estimated and statistical data, the validation results showed that the R2 reached 0.81 at the city level and 0.69 at the county level. It demonstrated that the approach in this study has the ability to effectively map the summer maize area over a large scale and provides a novel idea for estimating the planting area of other crops.

1. Introduction

Maize, as the primary staple, plays a vital role in agricultural production in China. It is very significant to estimate the cultivated area of maize for national food security and sustainable economic development [1,2]. Huanghuaihai Plain covers approximately 4.5% of the whole country, whereas the maize planting area accounts for about 30% of the total maize acreage, which is the main production areas of summer maize in China. The distribution of maize in this region affects grain policy making, adjustment of the cropping system structure, and academic studies related to maize in China [3,4]. Therefore, there is an increasing need for objective, timely, and accurate estimation of the maize area over the Huanghuaihai Plain.
As a kind of earth observation technology, remote sensing can effectively acquire the spatial distribution and spectral information of ground objects, with wide geographic coverage and the merit of large information capacity, high accuracy, and speed, which provides opportunities for crop identification [5,6,7,8,9]. Different crops have various spectral characteristics in remotely sensed images [10,11]. The multi-temporal vegetation indices (VIs) reflect the changes in the spectral features of vegetation over time, which can discriminate different crop types [12,13,14,15,16]. Many previous research studies employed the multi-temporal VIs approaches to map the maize cultivated area. Wardlow and Egbert used temporal normalized difference vegetation index (NDVI) data from 250 m moderate resolution imaging spectroradiometer (MODIS) images to classify the maize over the U.S. Central Great Plains [17]. Gu et al. reconstructed a mid-scale time series NDVI dataset derived from the fusion of MODIS and thematic mapper (TM) images based on the wavelet transform to estimate the maize area in Yuanyang County of Henan Province [18]. Maguranyanga and Murwira combined the temporal NDVI series and ancillary field data to map the maize area in the large-scale commercial farms of Zimbabwe though the maximum entropy method [19]. Tang et al. adopted the identification method for spring maize based on spectral and phenological features derived from the MODIS land surface reflectance time series data in Northeast China [20]. In contrast, although these studies were valuable for the recognition of maize, there are still some challenges to be faced in mapping the spatial distribution of maize on a large scale due to the spatial variations of maize phenology.
The spectral features of summer maize on remote sensing images are different at the same time, as the maize phenology varies in different regions. In order to weaken the influence of phenology differences on the accuracy of crop area extraction, some researchers have considered the influence of latitude on summer maize phenology, when using the multi-temporal VIs approach to map the maize area on a large scale. For example, Zhang et al. used the lag values of phenology change with latitude to modify the MODIS-enhanced vegetation index (EVI) time series curve of maize and mapped the spring maize in Northeast China [21]. Wang et al. also considered the differences in maize phenology with latitude to discriminate the summer maize based on the multi-temporal MODIS EVI images over the Huanghuaihai Plain [22]. In both studies, the influence of latitude on crop phenology was taken into account when using multi-temporal MODIS images mapping the summer maize area on a large scale, which had improved the accuracy of maize area extraction.
In fact, the phenology of summer maize is not only affected by latitude but also sensitive to the change in environmental conditions, as well as changes with the environmental variation. The maize phenology is sensitive to changes in environmental conditions, resulting in the maize phenology that would be altered by environmental variability [23,24,25,26,27,28]. In the past several years, the apparent warming climate caused early flowing and maturity and consequently shortened the reproductive growth stage of maize [29]. The mean temperature as one of the thermal conditions is closely related to the sowing and seedling emergence time [30,31,32]. The accumulated temperature is routinely used to determine crop planting schedules, so the accumulated temperature shift will lead to the change in maize growth stages [33]. Moisture is an essential requirement for maize growth, so precipitation has effects on the growth of maize. It was reported that the correlations between precipitation and the length of various maize growing phases were positive [26,34]. Furthermore, geographical position is a vital factor for maize growth [35,36]. Liu et al. found that for every 1° increase in latitude, northward, the growth durations of sowing to emergence and emergence to silking were significantly increased by 0.7 and 1.25 d, respectively [37]. This means the maize phenology has been changed in different regions. It can be clearly seen that the phenology of maize varied with the changes in annual average temperature, accumulated temperature, precipitation, and geographical location. On a large scale, with a great difference in the environment of different regions, the phenologies of maize are different, which lead to the difference in the spectral characteristics of summer maize in the remote sensing image. There is, therefore, the phenological differences of maize caused by various environmental factors being combined with the multi-temporal MODIS EVI images to map the cultivated area of summer maize for better extraction accuracy on a large scale.
In the present study, multiple linear regression equations were constructed to simulate the summer maize phenology through analyzing the relationship between environmental factors and summer maize phenology over the Huanghuaihai Plain. The simulated phenology of summer maize was obtained through environmental factors data (longitude, latitude, annual average temperature, annual precipitation, and ≥10 °C accumulated temperature), which acted as an independent variable to modify the summer maize MODIS EVI time series curve and generate the standard maize EVI time series curve over Huanghuaihai Plain. Combined with the mean absolute distance (MAD) and the P-tile algorithm, the summer maize planting area was discriminated successfully in the study area. It provides a novel idea for improving the accuracy of maize area extraction using multi-temporal remote sensed data on a large scale.

2. Study Area and Data

2.1. Study Area and Reference Area

Huanghuaihai Plain (Figure 1) (32°–40° N, 114°–121° E), which includes Beijing, Tianjin, Hebei, Henan, and Shandong, is the main planting area of summer maize in China. The region belongs to the monsoon climate of medium latitudes with four clearly distinct seasons [38]. The annual precipitation is 500–900 mm. The precipitation is mostly concentrated in summer, accounting for about 70% of the annual precipitation. The mean annual temperature is 8–15 °C [39]. Summer maize phenology is significantly different due to the difference in climate among regions over Huanghuaihai Plain.
Ruzhou City (Figure 1), with a relatively single planting structure, was selected as the reference area, which is located in the middle of Henan Provence (33°56′–34°20′ N, 112°31′–113°07′ E). Summer maize is the main summer crop in the region, accounting for about 70% of the summer crop planting area. Therefore, choosing Ruzhou City as the reference area can reduce the event of mixed classification.

2.2. Data Description and Processing

2.2.1. Landsat7 ETM+ Image and Pre-Processing

The spatial resolution of Landsat7 ETM+ (https://glovis.usgs.gov) is 30 m, enabling high-precision extraction of crop area on a small scale [40,41]. According to the weather conditions, image quality, and phonological characteristics of summer maize, the ETM+ images on June 9th (sowing), September 13th (milk-ripe), and October 31st (harvested stage), 2012, were selected to obtain the summer maize cultivated area in the reference area. Striping, radiation calibration, atmospheric correction based on the FLAASH model, and clipping were performed for 3 images before classification.

2.2.2. MODIS EVI Data and Pre-Processing

MOD13Q1 data were derived from the National Aeronautics and Space Administration (NASA) (https://search.earthdata.nasa.gov). MOD13Q1 data provide an EVI vegetation layer every 16 days at 250 m spatial resolution. The summer maize growth period (2012-06-01–2012-10-31) contained MOD13Q1 data for 9 phases, covering h26v04, h26v05, h27v04, and h27v05. First, the images in the same phase were spliced, and the spliced images were then subjected to projection conversion processing. The projected coordinate system was UTM_Zone_51N, and the geographic coordinate system was CGS_WGS_1984. Finally, the boundary data of Huanghuaihai and Ruzhou were used to mask the processed images.

2.2.3. Land Use Data

The land use data (Globeland30, http://www.globallandcover.com/GLC30Download/index.aspx) of spatial 30 m resolution in 2010 were employed to modify the extracted area of summer maize in the reference area. The cultivated land (code 10) dataset in the land use data was overlaid with the spatial distribution of summer maize from ETM+ images to exclude the influence of other land use types on the extraction results in the reference area.

2.2.4. Phenological and Meteorological Data

Summer maize phenological and meteorological data of Huanghuaihai Plain in 2012 were derived from the National Meteorological Information Center (http://data.cma.cn). In this study, the observation phenology data from 32 agricultural meteorological stations are gathered, including latitude, longitude, maize fertility name, and fertility date that was converted into the day of the year (DOY) at each site. The location of agro-meteorological stations is shown in Figure 2, and the phenological information is listed in Table 1.
The grid dataset of the daily value of surface temperature and precipitation in China with the spatial resolution of 0.5° was employed to obtain the meteorological elements in the study area. The grid dataset was generated by the thin plate spline (TPS) method based on the data of precipitation and air temperature of the high-density site on the ground in China in the special national information materials, as well as the GTOPO30 data. The grid dataset was defined as the CGS_WGS_1984 geographic coordinate system and was projected into the UTM_Zone_51N coordinate system. We resampled the grid data with 250 m spatial resolution by the bilinear algorithm. Based on the processed grid dataset, the annual average temperature, annual precipitation, and ≥10 °C accumulated temperature in Huanghuaihai Plain were calculated from the grid data with 250 m spatial resolution. In addition, the annual average temperature, annual precipitation, and ≥10 °C accumulated temperature at 32 agro-meteorological stations were obtained (Table 1).

2.2.5. Statistical Data

The statistics of the summer maize cultivated area are from the statistical yearbooks [42,43,44,45,46,47,48,49,50,51]. The statistics of the total surface area of summer maize on 43 city-levels were collected, including Beijing, Tianjin, 7 cities in Hebei, 16 cities in Henan, and 18 cities in Shandong. Meanwhile, the statistics of the total surface area of summer maize on 245 county-levels were gathered, including 9 counties in Beijing, 6 counties in Tianjin, 51 counties in Hebei, 99 counties in Henan, and 80 counties in Shandong.

3. Methodology

The overall process for the recognition of the summer maize cultivated area in Huanghuaihai Plain is displayed in Figure 3. The main process includes: (1) The support vector machine (SVM) algorithm was adopted to distinguish the spatial distribution of summer maize in the reference area. The summer maize MODIS EVI time series curve was acquired through masking multiple periods of MODIS EVI images and the distribution of summer maize in the reference area, which was smoothed with the Savizky–Golay method [52,53,54,55]. (2) Through the stepwise regression method to analyze the relationship between summer maize phenological observation data and environmental factors from 32 agrometeorological stations, multiple linear regression equations were constructed to simulate the summer maize phenology. The simulated phenology acted as the corrected parameter for the MODIS EVI time series curve to obtain the equations of the standard summer maize EVI time series curve in the study area. (3) By calculating the mean absolute distances (MAD) map between standard summer maize EVI time series and actual MODIS EVI time series images, and setting the appropriate thresholds with the p-tile method, the summer maize planting area was estimated in Huanghuaihai Plain.

3.1. Method of Maize Area Identification in the Reference Area

By surveying the phenological characteristics of the main crops in the reference area (Figure 4), it can be seen that summer maize was sowed in early and middle June, which presented as bare soil on remote sensing images. The sowing dates of peanut and cotton were between late April and early May. The planting area of peanut and cotton showed vegetation information on remote sensing images in mid-June. It is the best time to distinguish summer maize from other summer crops in mid-June. From July to September, the summer maize was in the period from seven-leaf to maturation, which showed vegetation information on the remote sensing images. In late October, summer maize had been harvested and winter wheat was sowing or had seedling emergence in the reference area, so the summer maize planting area displayed the bare soil spectrum feature on the remote sensing images. Hence, the images with good quality on 9 June, 13 September, and 31 October, 2012, represented different spectrum features at different growth stages of maize, which were used to extract the summer maize acreage in the reference area. The specific steps were as follows:
(1).
Combined with Google Earth, the training samples of road, vegetation, habitation, water body, and bare soil were selected from three periods of ETM+ data by visual interpretation. The SVM algorithm was used to classify the three images.
(2).
The vegetation coverage of the ETM+ image on 13 September 2012, and the bare soil coverage of the ETM+ images on 9 June 2012 and 13 October 2012, were recognized. Spatial intersection operations (Zhang et al., 2010) were performed for recognizing vegetation and bare soil coverage from the remote sensing images in the reference area.
(3).
The result of images intersection processing was superimposed with the cultivated land dataset (code 10) from the land use data of 30 m spatial resolution in 2010 (GlobeLand 30), to correct the extracted summer maize acreage in the reference area.

3.2. Multiple Linear Stepwise Regression

In processes of stepwise regression analysis, contributions of environmental factors to variances in the regression equation are taken as criteria [8,56]. Significant factors that affect summer maize phenology are introduced into the regression equation one by one, and factors with no significant influence on summer maize phenology are removed one by one. Stepwise regression analysis can not only establish “optimal” regression observations, but also overcome the multicollinearity to a certain extent [57,58,59]. Given the widely reported sensitivity of maize growth to surroundings, it seems important to consider the effects of various factors on the maize phenology in different regions. Therefore, in this research, we employed multiple linear stepwise regression to fit the relationship between summer maize phenology and environmental factors (i.e., longitude, latitude, annual average temperature, annual precipitation, and ≥10 °C accumulated temperature).

3.3. The Mean Absolute Distance

The similar measurement method is one of the main approaches to classify crop planting information based on the multi-temporal vegetation indices (VIs) [60,61,62]. The basic idea of the similar measurement method is to establish VI curves of different features, and then compare the similarity of the time series VI curves between the pixel to be divided and the referenced pixel, which can determine its type. In the current research, MAD [18] was selected as the indicator of similar measurement. By comparing the similarity between the actual MODIS EVI pixel and the standard summer maize EVI pixel, the MAD map was calculated in the study area. The specific formula of MAD is as follows:
d ij ¯ = 1 m k k = 1 n | x i k x j k |
where d i j ¯ is the value of the MAD; mk is the number of the pixels of the template image in the k sequence, taking the pixel of each raster of the standard summer maize EVI as the template, and mk is 1; xik is the actual value of MODIS EVI in the k sequence; xjk is the standard EVI value of summer maize in the sequence; n is the total number of the time series (n = 9).

3.4. The p-Tile Algorithm

The p-tile algorithm [21,63], a classical way to select the threshold, was proposed by Doyle in 1962. The research objects were divided into the target mode Po and the background mode Pb, and the quantile p-value was obtained by the ratio of Po and Pb, which is equal to the prior probability. The suitable threshold value can be found according to the prior probability, such that the target mode was greater than the threshold value and the background mode was less than the threshold value. The specific formulae are as follows:
P = Po/Pb
f(x,y) ≤ T
f(x,y) > T
where Po is the target mode, Pb is the background mode, f(x,y) is the research objects (MAD map), and T is the threshold. The ratio of the statistical summer maize acreage and the total area of every province was calculated as a prior probability in Huanghuaihai Plain. The histogram of the MAD map of each province was accumulated until the proportion of accumulated value was greater or equal to the prior probability, and this is when the mad value was the optimal threshold T.

4. Results and Discussion

4.1. Extraction and Reconstruction of Summer Maize MODIS EVI Time Series Curve in the Reference Area

Based on ETM+ data, the spatial distribution of summer maize (38.5 × 10³ ha) in Ruzhou is shown in Figure 5. The result of summer maize extraction in Ruzhou City was verified by the statistics of the total surface area of summer maize (43.4 × 10³ ha), and the accuracy was higher than 88%. It was revealed that the way of intersection operation based on different spectral characteristics in maize critical periods can acquire the maize cultivated area with high precision in the relatively single area.
The summer maize MODIS EVI time series images of the reference area were obtained by masking the spatial distribution area of summer maize and multi-temporal MODIS EVI images from the reference area. The average value of summer maize MODIS EVI images in each period was calculated, which was regarded as the summer maize EVI value to obtain the original MODIS EVI time series curve of summer maize in the reference area. Smoothing the original MODIS EVI time series curve of summer maize with Savitzky–Golay filtering, the smoothed MODIS EVI time series curve of summer maize was gained in the reference area (Figure 6). The Gaussian function was used to fit the smoothed MODIS EVI time series curve of summer maize in the reference area. The formula is as follows:
E V I i = a 1 × e ( i b 1 c 1 ) 2 + a 2 × e ( i b 2 c 2 ) 2 + a 3 × e ( i b 3 c 3 ) 2 ( i = 145 , 177 289 )
where i is the day of the year (DOY), EVIi is the simulated EVI value of summer maize in the reference area on DOY i, and the parameters of the simulated EVI function are shown in Table 2.
It is thus clear from Figure 6 that the value of summer maize MODIS EVI increased first and then decreased with time in the reference area, consisting of the growth trajectory of summer maize. From DOY 157 to 225, summer maize was in the periods of sowing to tasseling, which was the rapid growth stage, and the EVI value gradually increased. It entered the period of tasseling around DOY 225, which was the most vigorous growth stage, and the value of EVI also reached the peak value. From DOY 225 to 258, summer maize was in the periods of tasseling to maturation, and gradually matured with the decrease in EVI value.

4.2. Construction of Standard Summer Maize EVI Time Series Curve in the Study Area

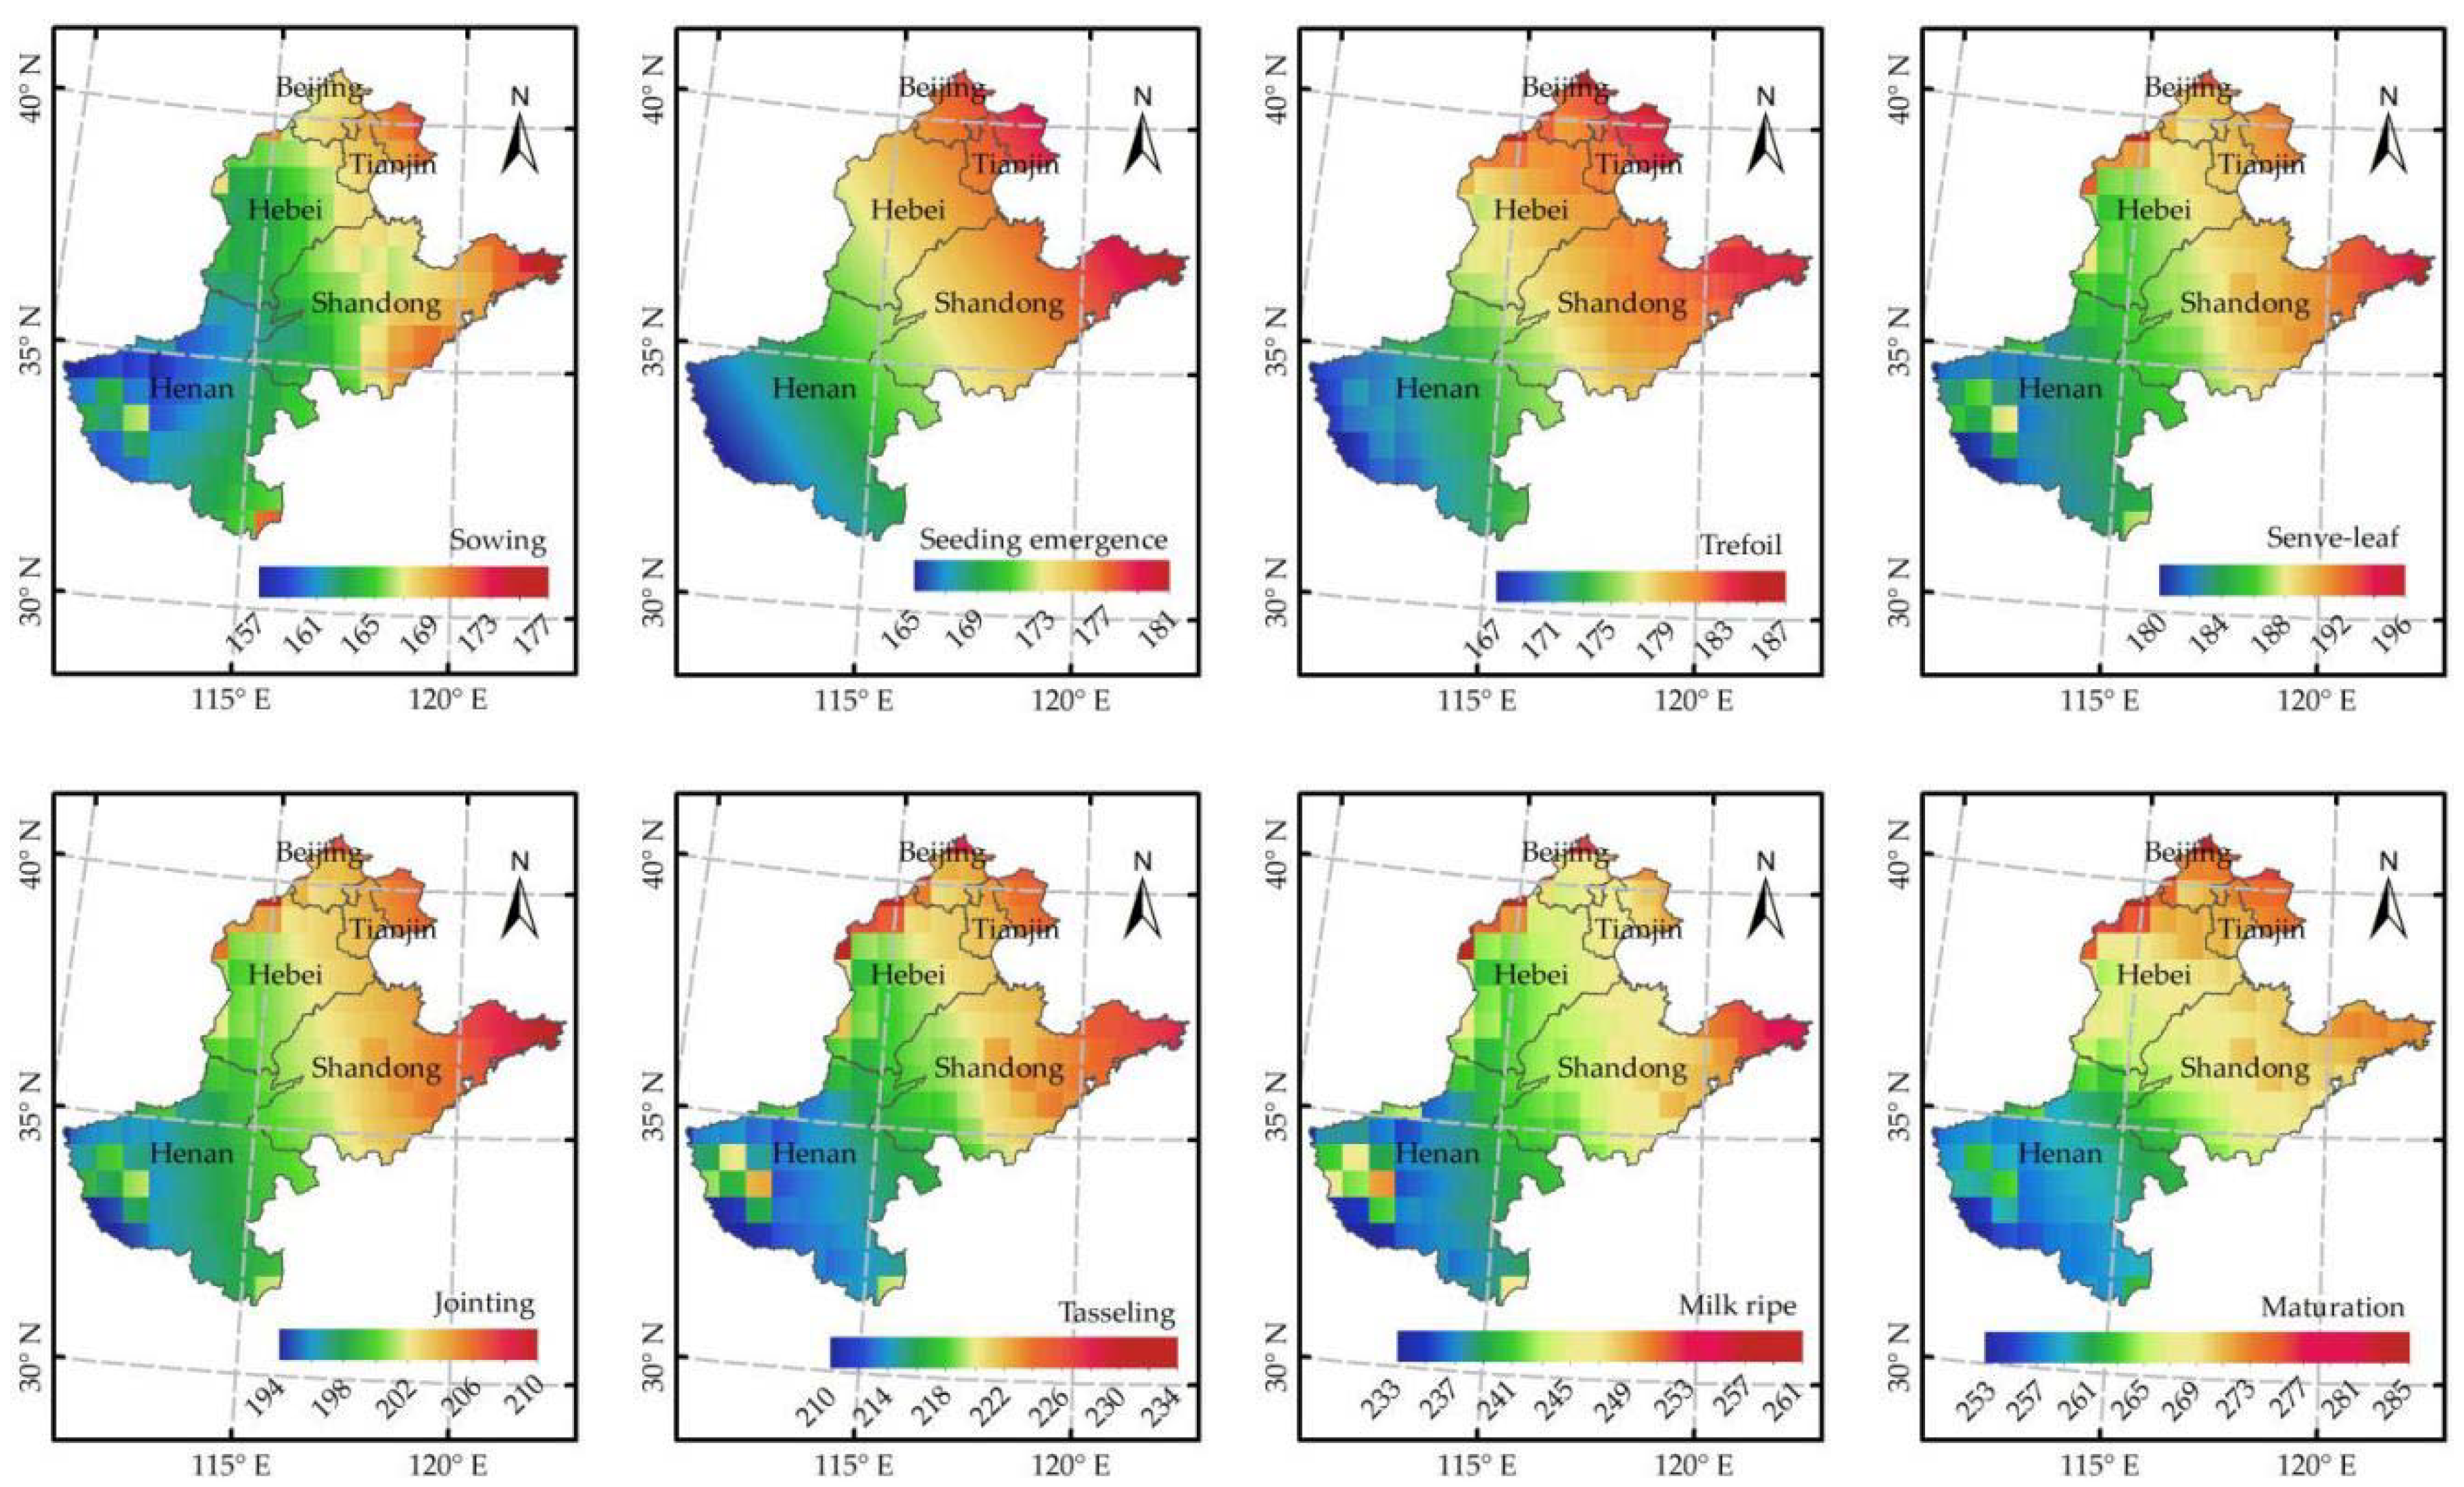
4.2.1. Estimation of Summer Maize Phenology

The summer maize phenology is divided into eight key stages, which are sowing, seedling emergence, trefoil, seven-leaf, jointing, tasseling, milk-ripe, and maturation. The phenology of summer maize in different regions varies due to the different natural environments. In this study, employing the multiple linear stepwise regression method, the phenological observation data and the corresponding meteorological data of 32 agrometeorological stations were analyzed, and the multiple linear regression equations between summer maize phenology and natural environmental factors were constructed. The specific formulas are as follows:
Y1 = 1.24X1 − 0.0026X4 + 0.0087X5 + 29.27
Y2 = 1.07X1 + 0.68X2 + 23.60
Y3 = 1.12X1 + 0.58X2 − 0.0030X4 + 40.51
Y4 = 1.17X1 − 0.0054X4 + 77.97
Y5 = 1.20X1 − 0.0049X4 + 85.79
Y6 = 1.06X1 − 0.0059X4 + 123.9
Y7 = 1.34X1 − 0.54X3 − 0.0124 X4 + 155.36
Y8 = 0.64X1 + 1.04X2 − 0.0112X4 + 207.9
where Y1, Y2, Y3, Y4, Y5, Y6, Y7, and Y8 are the analog DOY of the sowing, seedling emergence, trefoil, seven-leaf, jointing, tasseling, milk-ripe, and maturation stages, respectively; X1 is the longitude, X2 is the latitude, X3 is the annual average temperature, X4 is the annual precipitation, and X5 is the ≥10 °C accumulated temperature.
The phenology observation data in 2007, 2009, 2011, and 2012 were used to verify the analog values of summer maize phenology that were calculated by the multiple linear regression equations (Equations (6) to (13)) at 32 agro-meteorological stations, respectively. The correlation coefficient (R) values were between 0.559 and 0.790 (Figure 7), which showed that the correlation between the simulated phenology and the actual phenology of summer maize was significant. It was illustrated that the summer maize phenology simulated by multiple linear regression equations were reliable in the current study.
According to the multiple linear regression equations, the simulated results of summer maize phenology in the study area were calculated and are shown in Figure 8. Generally, the eight growth stages of summer maize in Hunaghuaihai Plain showed a trend of delaying from the southwest to northeast. The differences in seedling emergence, seven-leaf, and joint stages were the smallest, and the DOY discrepancy among the regions was about 16 days in the study area, whereas the difference in the maturation phase of summer maize was largest, up to about 32 days. The occurrence of this event may be related to the climate with high temperature in summer and a larger temperature difference between North and South in winter in Huanghaihai Plain [64,65].
Based on the summer maize phenology of Ruzhou City (Table 1) and the simulated phenology of summer maize in the study area, the lag at each pixel from the sowing stage to maturation stage of maize was roughly calculated using the following equations. The corresponding values of i and s are shown in Table 3.
Lagi = YsYrs
where i is the day of the year (DOY); s represents the time series of summer maize phenology; Lagi are the day’s delay from DOY 161 to 289, and Ys and Yrs represent the simulated summer maize phenology of the study area and the phenology of summer maize in the reference area on DOY i, respectively. The growth stages of summer maize used in Equation (14) are the periods of seedling emergence, seven-leaf, jointing, tasseling, milk-ripe, and maturation.

4.2.2. Construction of Standard Summer Maize EVI Time Series Curve in the Study Area

The phenology of summer maize is different in various regions on a large scale. The features of the summer maize MODIS EVI time series curve in the reference area cannot represent the MODIS EVI time series curve of the entire study area. It was necessary to modify the summer maize MODIS EVI time series according to the various analog phenologies of summer maize in Huanghuaihai Plain. Hence, in the current research, employing the lag value of summer maize phenology to correct Equation (2), the standard EVI time series equation of summer maize in the study area was obtained. The formula is as follows:
S E V I i = a 1 × e ( ( i L a g i ) b 1 c 1 ) 2 + a 2 × e ( ( i L a g i ) b 2 c 2 ) 2 + a 3 × e ( ( i L a g i ) b 3 c 3 ) 2 ( i = 145 , 177 289 )
where SEVIi is the standard summer maize EVI value of the study area on DOY i, and the parameters of the standard EVI function are shown in Table 2.

4.2.3. Validation of Standard Summer Maize EVI Time Series Curve in the Study Area

Ten counties were randomly selected in the study area to validate the standard summer maize EVI time series curve. According to the method in Section 3.1, the planting area of summer maize in 10 validated regions was mapped by Landsat-7 ETM+ images. The maize distribution region extracted by Landsat was used to mask the MODIS EVI time images, and the actual MODIS EVI time series values of summer maize in 10 validated areas were obtained by calculation. The actual MODIS EVI time series values of summer maize were compared with the standard EVI time series values of summer maize by Equation (15). The results showed that the correction coefficient between the actual summer maize MODIS EVI time series curve and the standard summer maize EVI time series curve was all greater than 0.9 with p < 0.01 (Table 4). It indicated that the standard curve simulated by Equation (15) was consistent with the actual curve.

4.3. Summer Maize Recognition in Huanghuaihai Plain

4.3.1. The MAD between Standard Summer Maize EVI and Actual MODIS EVI

The MAD map of the study area is shown in Figure 9, where the minimum value is 0 and the maximum is 6. The lower the MAD value, the greater the similarity between the actual EVI value and the simulated EVI value, which indicated that the summer maize planting area is more likely. On the contrary, the summer maize planting area is less likely. According to the p-tile algorithm, the optimal thresholds of five provinces were determined: 0.85 for Beijing, 0.89 for Tianjin, 0.71 for Hebei, 0.59 for Henan, and 0.74 for Shandong. The value of MAD that was smaller than the optimal threshold was considered to be the summer maize area by comparing every raster value of the MAD map with the optimal threshold value, which was used to extract the spatial distribution of summer maize in Huanghuaihai Plain.

4.3.2. Extraction Results of Summer Maize in Huanghuaihai Plain

The spatial distribution of the summer maize planting area of the study area is shown in Figure 10. It can be seen from Figure 10 that the distribution of summer maize is sparse in Beijing, Tianjin, and the western and southern parts of Henan Province, and uniform in other regions of Huanghuaihai Plain. The event is owed to the agricultural planting structure, social development, and ecological environment in China. There is less area for agricultural planting in Beijing and Tian as the developed cities. Rice and wheat are the main crops in the south of Henan Province, and woodland covers most of the western Henan Province. Hebei, Shandong, and the central and northern parts of Henan Province are flat with good photoperiod and temperature conditions, which are suitable for maize growth [66,67]. The spatial distribution of summer maize in the current study was consistent with the previous extracted results [68] in northern and southern Hebei Province, northwest of Shandong Province, and northern Henan Province, which can manifest the extracted results with a certain reliability.

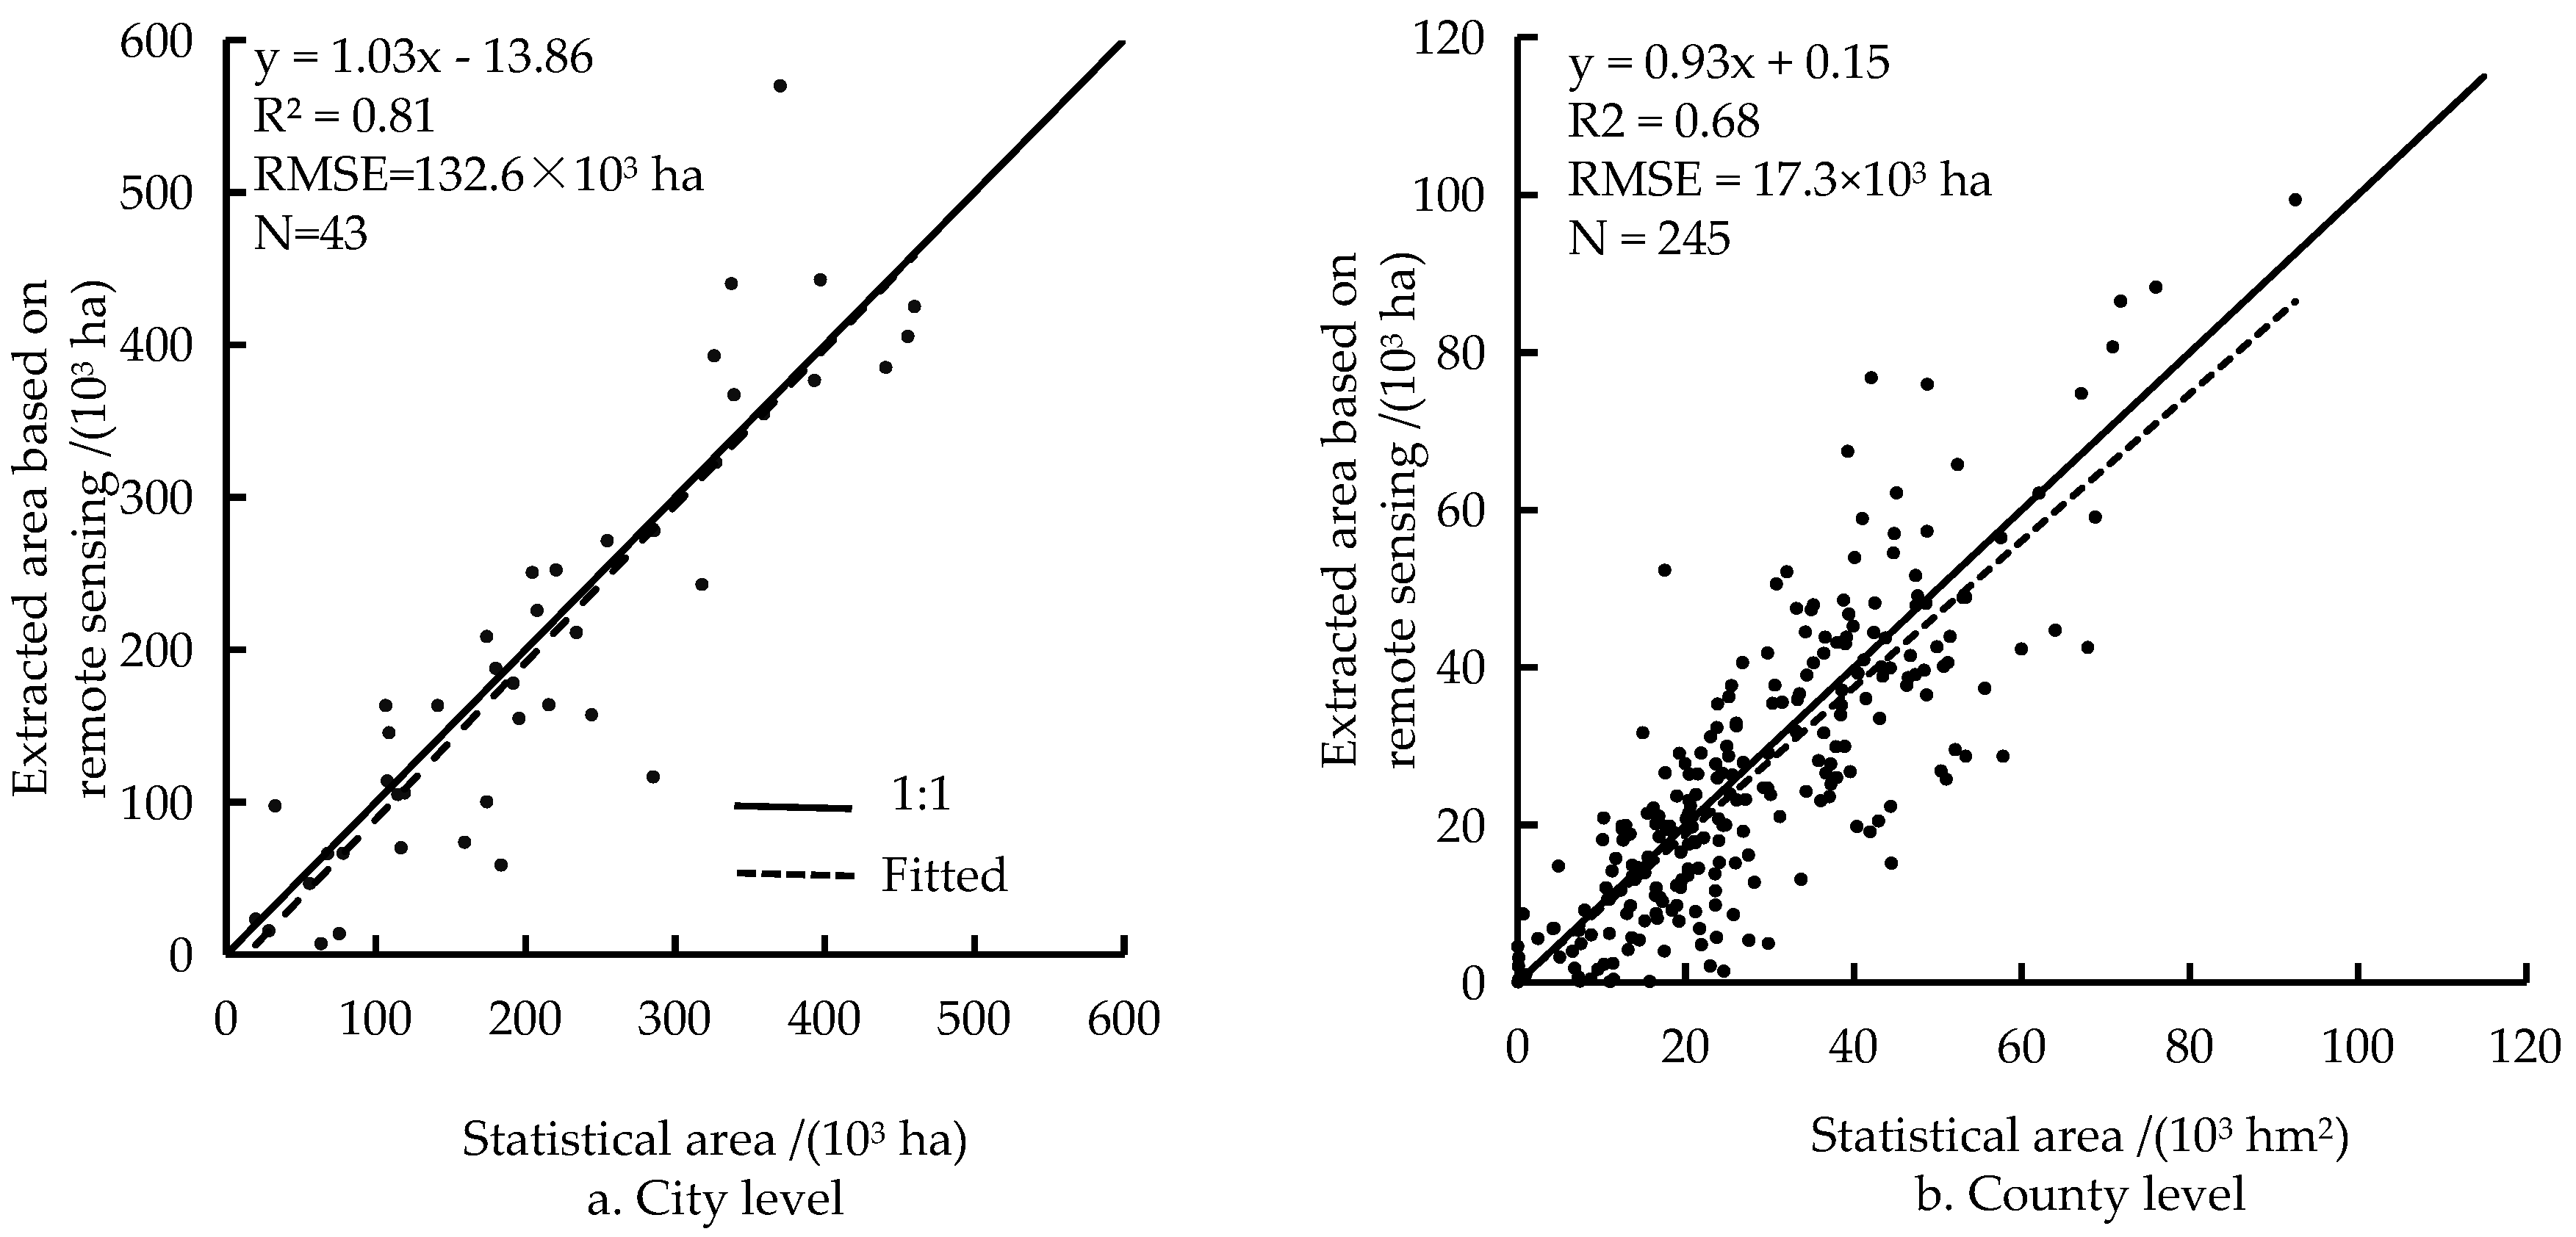
4.3.3. Validation of the Extracted Summer Maize Area in Huanghuaihai Plain

The cultivated areas of summer maize in Beijing, Tianjin, Hebei, Henan, and Shandong extracted by MODIS EVI time series images were 129.7 × 10³, 175.4 × 10³, 2995.4 × 103, 3322.7 × 103, and 3428.2 × 103 ha, respectively. The planting area of summer maize was largest in Henan Province and the smallest in Beijing. The statistics and the extraction of summer maize were used to analyze the overestimation and underestimation of area extraction. If the comparison results were positive, it indicated that the extraction area was larger than the statistical area, which was overestimation. Otherwise, if the comparison was negative, it was underestimated. As can be seen from Table 5, the extraction of summer maize was overestimated in Hebei, Henan, and Shandong, and underestimated in Beijing and Tianjin. The extraction accuracy of Tianjin Province was the highest, reaching 98.04%, and Shandong Province was the lowest, 86.41%. The accuracy of the extraction results of five Provinces was over 85% in the study.
The statistical data of the maize area from 43 cities and 245 counties in Huanghuaihai Plain were employed to verify the extraction results. Comparing the maize acreage of two groups from MODIS-estimated and statistical data, the validation results showed that the R2 reached 0.81 with an Root Mean Square Error (RMSE) of 143.8 ha at the city level and the R2 reached 0.69 with an RMSE of 18.7 ha at the county level (Figure 11). Those demonstrated that there was a good correlation between the maize area estimated by MODIS satellite data and statistical data. Compared to the previous research that used the multi-temporal remote sensing images to map the summer maize area, the extraction accuracy was significantly improved in the current research [20,21,69].
Six county-level regions (Changyuan, Gaotang, Linzhang, Lushan, Yongnian, Xinji) were selected from the study area as the sampling validation areas. Based on Landsat ETM+ images with a spatial resolution of 30 m, the distribution regions of summer maize in the six regions in 2012 were obtained by the method used to estimate summer maize area in the reference area in Section 3.1. As shown in Figure 12, the summer maize distribution areas mapped by ETM+ images were roughly consistent with those drawn by MODIS images. The extraction results were compared to the summer maize distribution areas drawn based on the MODIS data. The two kinds of maize distribution areas were superposed and calculated to obtain the area of the public part. The public area is 29.4 ha in Changyuan, 37.7 ha in Gaotang, 36.6 ha in Linzhang, 24.7 ha in Lushan, 33.9 ha in Yongnian, and 43.2 ha in Xinji (Table 6). The proportions of the public part to the extraction results by Landsat images, the extraction results by MODIS images, and the statistical data were used to quantitatively analyze the relative accuracy of summer maize extracted with MODIS data. The proportion of the public part area to the extraction results based on MODIS and Landsat images was compared. The results showed that the gap was largest in Lushan county, with 90.7% and 62.5%, respectively; the gap was smallest in Changyuan, 67.7% and 68.6%, respectively (Table 6). The mean proportion of the public part area to the statistical data was 82.3%, which meets the request for precision. These suggest that the method proposed in this paper is reliable.

4.3.4. Extraction Results in Different Years

The area extraction algorithm in the present research was employed to map the summer maize cultivated area in 2013 over Huanghuaihai Plain. The spatial distribution characteristics of summer maize in 2013 were basically consistent with those in 2012. It can be seen from Table 7 that the summer maize acreage from MODIS images in Beijing, Tianjin, Hebei, Henan, and Shandong were 105.1 × 10³, 178.2 × 10³, 2630.4 × 103, 3104.3 × 103, and 2707.0 × 103 ha, respectively. Compared to the statistical area, the precision of summer maize extraction results in five provinces was all above 85%. Meanwhile, the extraction results of the summer maize area from 43 cities and 245 countries of the study area in 2013 were compared to the statistical data, which showed that R2 was 0.81 with an RMSE of 132.6 × 10³ ha at the city level and R2 was 0.68 with RMSE of 17.3 × 10³ ha at the county level (Figure 13). It can be found that the precision of extraction results in different years had a high accuracy by using the standard summer maize EVI time series to map the summer maize, indicating that the method has a certain universality over a large scale.

5. Conclusions

The present study demonstrates a promising approach for mapping a summer maize cultivated area over a large scale, which considered the phenological differences of maize among the different regions. In practicality, the relationship between summer maize calendars and environmental factors was constructed and environmental factor data were employed to simulate the summer maize phenology in the whole study area. Simulated phenology of summer maize acted as a parameter to obtain a standard EVI time series curve of summer maize. A MAD map was calculated through comparison between time series images of standard summer maize EVI and the actual MODIS-EVI. Appropriate thresholds were set in five different provinces to map spatial distributions of summer maize in the study area. This research has demonstrated that, in terms of precision analysis, the accuracy of the extraction result in each province was above 85%. Statistical data from the Statistical Yearbook were gathered for accuracy evaluation, and the results showed that the R2 reached 0.81 with an RMSE of 143.8 ha at the city level and the R2 reached 0.69 with an RMSE of 18.7 ha at the county level. Those indicated a robust potential for identifying areas where the summer maize was cultivated over a large scale. Of course, there are still many challenges in the estimation of the crop planting area while considering the complex agricultural structure, including crop types, management practices, and crop interplanting operation. Further studies can also attempt to use more high-spatial-resolution images to map the crop cultivated area and improve the accuracy of extraction results on a large scale.

Author Contributions

Conceptualization, J.Z. and F.D.; methodology, J.Z., X.W. and F.D.; validation, S.Z. and L.F.; writing—original draft preparation, X.W.; writing—review and editing, J.Z.; project administration, J.Z. All authors have read and agreed to the published version of the manuscript.

Funding

This work was jointly supported by the National Key Research and Development Program of China (No. 2016YFD0300101, 2016YFD0300110), the Shandong Key Research and Development Project (No. 2018GNC110025), “Taishan” Scholarship Project of Shandong Province (No. TSXD201712); and the Natural Science Foundation of China (No. 31671585, 41871253).

Acknowledgments

We are very grateful to the editor and four anonymous reviewers for their valuable comments and suggestions.

Conflicts of Interest

The authors declare no conflict of interest.

References

  1. Zhao, J.R.; Wang, R.H. Development Process, Problem and Countermeasure of Maize Production in China. J. Agric. Sci. Technol. 2013, 15, 1–6. [Google Scholar]
  2. Chen, S.; Kung, J.K.-S. Of maize and men: The effect of a New World crop on population and economic growth in China. J. Econ. Growth 2016, 21, 71–99. [Google Scholar] [CrossRef]
  3. Ping, H.M.; Min, H.J.; Liu, P.H.; Lin, L.X. Research of Opportunities, Challenges and Countermeasures about WTO on Huanghuaihai Plain Agricultural Development. Res. Agric. Mod. 2003, 4, 28–32. [Google Scholar]
  4. Kai, W.; Bu, L. Systematic analysis and optimized prospect for agriculture structure in Huanghuaihai Plain. Chin. J. Agric. Resour. Reg. Plan. 2007, 28, 22–25. [Google Scholar]
  5. Dong, J.; Xiao, X. Evolution of regional to global paddy rice mapping methods: A review. ISPRS J. Photogramm. Remote Sens. 2016, 119, 214–227. [Google Scholar] [CrossRef] [Green Version]
  6. Forkuor, G.; Conrad, C.; Thiel, M.; Zoungrana, B.J.B.; Tondoh, J.E. Multiscale Remote Sensing to Map the Spatial Distribution and Extent of Cropland in the Sudanian Savanna of West Africa. Remote Sens. 2017, 9, 839. [Google Scholar] [CrossRef] [Green Version]
  7. Kyere, I.; Astor, T.; Grass, R.; Wachendorf, M. Multi-Temporal Agricultural Land-Cover Mapping Using Single-Year and Multi-Year Models Based on Landsat Imagery and IACS Data. Agronomy 2019, 9, 309. [Google Scholar] [CrossRef] [Green Version]
  8. Zhang, S.; Zhang, J.H.; Bai, Y.; Yao, F.M. Extracting winter wheat area in Huanghuaihai Plain using MODIS-EVIdata and phenology difference avoiding threshold. Trans. Chin. Soc. Agric. Eng. 2018, 34, 150–158. [Google Scholar] [CrossRef]
  9. Zhang, M.W.; Zhou, Q.B.; Chen, Z.X.; Liu, J.; Zhou, Y.; Cai, C.F. Crop discrimination in Northern China with double cropping systems using Fourier analysis of time-series MODIS data. Int. J. Appl. Earth Obs. Geoinf. 2008, 10, 476–485. [Google Scholar] [CrossRef]
  10. Tamilarasan, V.; Sharma, S.K.; Nagabhushana, S.R. Optimum spectral bands for land cover discrimination. Adv. Space Res. 1983, 3, 287–290. [Google Scholar] [CrossRef]
  11. Salmon, B.P.; Kleynhans, W.; Olivier, J.C.; van den Bergh, F.; Wessels, K.J. A modified temporal criterion to meta-optimize the extended Kalman filter for land cover classification of remotely sensed time series. Int. J. Appl. Earth Obs. Geoinf. 2018, 67, 20–29. [Google Scholar] [CrossRef]
  12. Carrão, H.; Gonçalves, P.; Caetano, M. Contribution of multispectral and multitemporal information from MODIS images to land cover classification. Remote Sens. Environ. 2008, 112, 986–997. [Google Scholar] [CrossRef]
  13. Chang, J.; Hansen, M.C.; Pittman, K.; Carroll, M.; Dimiceli, C. Corn and Soybean Mapping in the United States Using MODIS Time-Series Data Sets. Agron. J. 2007, 99, 1654–1664. [Google Scholar] [CrossRef]
  14. Huete, A.; Didan, K.; Miura, T.; Rodriguez, E.P.; Gao, X.; Ferreira, L.G. Overview of the radiometric and biophysical performance of the MODIS vegetation indices. Remote Sens. Environ. 2002, 83, 195–213. [Google Scholar] [CrossRef]
  15. Wardlow, B.; Egbert, S.; Kastens, J. Analysis of time-series MODIS 250 m vegetation index data for crop classification in the U.S. Central Great Plains. Remote Sens. Environ. 2007, 108, 290–310. [Google Scholar] [CrossRef] [Green Version]
  16. Bendini, H.D.N.; Fonseca, L.M.G.; Schwieder, M.; Korting, T.S.; Rufin, P.; Sanches, I.D.A.; Leitao, P.J.; Hostert, P. Detailed agricultural land classification in the Brazilian cerrado based on phenological information from dense satellite image time series. Int. J. Appl. Earth Obs. Geoinf. 2019, 82, 101872. [Google Scholar] [CrossRef]
  17. Wardlow, B.D.; Egbert, S.L. Large-area crop mapping using time-series MODIS 250 m NDVI data: An assessment for the U.S. Central Great Plains. Remote Sens. Environ. 2008, 112, 1096–1116. [Google Scholar] [CrossRef]
  18. Gu, X.H.; Pan, Y.C.; He, X.; Wang, J.H. Estimation of Maize Planting Area through the Fusion of Multi-source Images. In Proceedings of the Computer and Computing Technologies in Agriculture V; Springer: Berlin/Heidelberg, Germany, 2012; pp. 470–477. [Google Scholar]
  19. Maguranyanga, C.; Murwira, A. Mapping Maize, Tobacco, and Soybean Fields in Large-Scale Commercial Farms of Zimbabwe Based on Multitemporal NDVI Images in MAXENT. Can. J. Remote Sens. 2014, 40, 396–405. [Google Scholar] [CrossRef]
  20. Tang, K.; Zhu, W.; Zhan, P.; Ding, S. An Identification Method for Spring Maize in Northeast China Based on Spectral and Phenological Features. Remote Sens. 2018, 10, 193. [Google Scholar] [CrossRef] [Green Version]
  21. Zhang, J.H.; Feng, L.L.; Yao, F.M. Improved maize cultivated area estimation over a large scale combining MODIS–EVI time series data and crop phenological information. ISPRS J. Photogramm. Remote Sens. 2014, 94, 102–113. [Google Scholar] [CrossRef]
  22. Wang, X.T.; Zhang, S.; Deng, F.; Zhang, J.H. Mapping the Cultivated Areas of Summer Maize Using Spatial Variations of Crop Phenology over Huanghuaihai Plain. Chin. J. Agrometeorol. 2019, 40, 647–659. [Google Scholar]
  23. Wang, C.; Wu, J.; Wang, X.; He, X.; Li, N. Non-linear trends and fluctuations in temperature during different growth stages of summer maize in the North China Plain from 1960 to 2014. Theor. Appl. Climatol. 2019. [Google Scholar] [CrossRef]
  24. Shen, M.; Zhang, G.; Cong, N.; Wang, S.; Kong, W.; Piao, S. Increasing altitudinal gradient of spring vegetation phenology during the last decade on the Qinghai–Tibetan Plateau. Agric. For. Meteorol. 2014, 189, 71–80. [Google Scholar] [CrossRef]
  25. Li, L.; Friedl, M.; Xin, Q.; Gray, J.; Pan, Y.; Frolking, S. Mapping Crop Cycles in China Using MODIS-EVI Time Series. Remote Sens. 2014, 6, 2473–2493. [Google Scholar] [CrossRef] [Green Version]
  26. Wang, Z.; Chen, J.; Li, Y.; Li, C.; Zhang, L.; Chen, F. Effects of climate change and cultivar on summer maize phenology. Int. J. Plant Prod. 2016, 10, 509–525. [Google Scholar]
  27. Lizaso, J.I.; Ruiz-Ramos, M.; Rodríguez, L.; Gabaldon-Leal, C.; Oliveira, J.A.; Lorite, I.J.; Sánchez, D.; García, E.; Rodríguez, A. Impact of high temperatures in maize: Phenology and yield components. Field Crops Res. 2018, 216, 129–140. [Google Scholar] [CrossRef] [Green Version]
  28. Wang, N.; Wang, E.; Wang, J.; Zhang, J.; Zheng, B.; Huang, Y.; Tan, M. Modelling maize phenology, biomass growth and yield under contrasting temperature conditions. Agric. For. Meteorol. 2018, 250, 319–329. [Google Scholar] [CrossRef]
  29. Xiao, D.P.; Qi, Y.Q.; Shen, Y.J.; Tao, F.L.; Moiwo, J.P.; Liu, J.F.; Wang, R.D.; Zhang, H.; Liu, F.S. Impact of warming climate and cultivar change on maize phenology in the last three decades in North China Plain. Theor. Appl. Climatol. 2016, 124, 653–661. [Google Scholar] [CrossRef]
  30. Ahmad, I.; Wajid, S.A.; Ahmad, A.; Cheema, M.J.M.; Judge, J. Assessing the Impact of Thermo-temporal Changes on the Productivity of Spring Maize under Semi-Arid Environment. Int. J. Agric. Biol. 2018, 20, 2203–2210. [Google Scholar] [CrossRef]
  31. Riley, G.J. Effects of high temperature on the germination of maize (Zea mays L.). Planta 1981, 151, 68–74. [Google Scholar] [CrossRef]
  32. Tan, M.-X.; Wang, J.; Yu, W.-D.; He, D.; Wang, N.; Dai, T.; Sun, Y.; Tang, J.-Z.; Chang, Q. Temporal and spatial variation of the optimal sowing dates of summer maize based on both statistical and processes models in Henan Province, China. J. Appl. Ecol. 2015, 26, 3670–3678. [Google Scholar]
  33. Hou, P.; Liu, Y.; Xie, R.; Ming, B.; Ma, D.; Li, S.; Mei, X. Temporal and spatial variation in accumulated temperature requirements of maize. Field Crops Res. 2014, 158, 55–64. [Google Scholar] [CrossRef]
  34. Guo, E.; Zhang, J.; Wang, Y.; Alu, S.; Wang, R.; Li, D.; Ha, S. Assessing non-linear variation of temperature and precipitation for different growth periods of maize and their impacts on phenology in the Midwest of Jilin Province, China. Theor. Appl. Climatol. 2018, 132, 685–699. [Google Scholar] [CrossRef]
  35. Yan, H.; Zhen, Y.; Dongbing, W.U.; Cao, G.; Yao, J.; Liu, X. Effect of Latitude on Growth Period and Quality of Maize (Zea mays L.). Chin. Agric. Sci. Bull. 2009, 27, 38–41. [Google Scholar]
  36. Lu, A.G.; Pang, D.Q.; He, Y.Q.; Pang, H.X.; Yuan, L.L. Impact of Global Warming on Latitudinal Temperature Gradients in China. Sci. Geogr. Sin. 2006, 26, 345–350. [Google Scholar]
  37. Liu, Y.; Xie, R.; Hou, P.; Li, S.; Zhang, H.; Ming, B.; Long, H.; Liang, S. Phenological responses of maize to changes in environment when grown at different latitudes in China. Field Crops Res. 2013, 144, 192–199. [Google Scholar] [CrossRef]
  38. Wang, J.a.; Xiao, H.; Hartmann, R.; Yue, Y. Physical Geography of China and the U.S. In A Comparative Geography of China and the U.S.; Hartmann, R., Wang, J.A., Ye, T., Eds.; Springer: Dordrecht, The Netherlands, 2014; pp. 23–81. [Google Scholar] [CrossRef]
  39. Zhu, X. Features of climate changes in typical rural area of Huanghuaihai Plain. Guizhou Agric. Sci. 2012, 3, 104–109. [Google Scholar]
  40. Siqing, C.; Jiyuan, L.; Dafang, Z.; Xiangming, X. Characterization of land cover types in Xilin River Basin using multi-temporal Landsat images. J. Geogr. Sci. 2003, 13, 131–138. [Google Scholar] [CrossRef]
  41. Kontgis, C.; Schneider, A.; Ozdogan, M. Mapping rice paddy extent and intensification in the Vietnamese Mekong River Delta with dense time stacks of Landsat data. Remote Sens. Environ. 2015, 169, 255–269. [Google Scholar] [CrossRef]
  42. Bureau, Beijing Statistical. Beijing Statistical Yearbook; Beijing Statistical Press: Beijing, China, 2012.
  43. Bureau, Hebei Province Statistical. Hebei Rual Statistical Yearbook; Beijing Statistical Press: Beijing, China, 2012.
  44. Bureau, Henan Province Statistical. Henan Statistical Yearbook; Beijing Statistical Press: Beijing, China, 2012.
  45. Bureau, Shandong Province Statistics. Shandong Statistical Yearbook; Beijing Statistical Press: Beijing, China, 2012.
  46. Bureau, Tianjin Statistical. Tianjin Statistical Yearbook; Beijing Statistical Press: Beijing, China, 2012.
  47. Bureau, Beijing Statistical. Beijing Statistical Yearbook; Beijing Statistical Press: Beijing, China, 2013.
  48. Bureau, Hebei Province Statistical. Hebei Rual Statistical Yearbook; Beijing Statistical Press: Beijing, China, 2013.
  49. Bureau, Henan Province Statistical. Henan Statistical Yearbook; Beijing Statistical Press: Beijing, China, 2013.
  50. Bureau, Shandong Province Statistics. Shandong Statistical Yearbook; Beijing Statistical Press: Beijing, China, 2013.
  51. Bureau, Tianjin Statistical. Tianjin Statistical Yearbook; Beijing Statistical Press: Beijing, China, 2013.
  52. Pan, Z.K.; Huang, J.F.; Zhou, Q.B.; Wang, L.M.; Cheng, Y.X.; Zhang, H.K.; Blackburn, G.A.; Yan, J.; Liu, J.H. Mapping crop phenology using NDVI time-series derived from HJ-1 A/B data. Int. J. Appl. Earth Obs. Geoinf. 2015, 34, 188–197. [Google Scholar] [CrossRef] [Green Version]
  53. Duan, S.W.; He, H.S.; Spetich, M. Effects of Growing-Season Drought on Phenology and Productivity in the West Region of Central Hardwood Forests, USA. Forests 2018, 9, 377. [Google Scholar] [CrossRef] [Green Version]
  54. Bian, J.H.; Li, A.N.; Song, M.Q.; Ma, L.Q.; Jiang, J.G. Reconstruction of NDVI time-series datasets of MODIS based on Savitzky-Golay filter. J. Remote Sens. 2010, 14, 725–741. [Google Scholar]
  55. Savitzky, A.; Golay, M.J.E. Smoothing and Differentiation of Data by Simplified Least Squares Procedures. Anal. Chem. 1964, 36, 1627–1639. [Google Scholar] [CrossRef]
  56. Yang, J.Y.; Mei, X.R.; Qin, L.; Yan, C.R.; He, W.Q.; Liu, E.K.; Liu, S. Variations of winter wheat growth stages under climate changes in northern China. Chin. J. Plant Ecol. 2011, 35, 623–631. [Google Scholar] [CrossRef]
  57. Khikmah, L.; Wijayanto, H.; Syafitri, U. Modeling Governance KB with CATPCA to Overcome Multicollinearity in the Logistic Regression. J. Phys. Conf. Ser. 2017, 824, 012027. [Google Scholar] [CrossRef] [Green Version]
  58. Lee, S.H.-H. Analysis of the multicollinearity of regression equations of shear wave velocities. Soils Found. 1992, 32, 205–214. [Google Scholar] [CrossRef] [Green Version]
  59. Zhao, D.; Dong, C.; Guo, H.; Tian, W. Kinematic Calibration Based on the Multicollinearity Diagnosis of a 6-DOF Polishing Hybrid Robot Using a Laser Tracker. Math. Probl. Eng. 2018, 2018, 5602397. [Google Scholar] [CrossRef] [Green Version]
  60. Evans, J.P.; Geerken, R. Classifying rangeland vegetation type and coverage using a Fourier component based similarity measure. Remote Sens. Environ. 2006, 105, 1–8. [Google Scholar] [CrossRef]
  61. Guo, Y.S.; Liu, Q.S.; Liu, G.H.; Huang, C. Extraction of Main Crops in Yellow River Delta Based on MODIS NDVI Time Series. J. Nat. Resour. 2017, 32, 1808–1818. [Google Scholar] [CrossRef]
  62. Guan, X.D.; Huang, C.; Liu, G.H.; Xu, Z.R.; Liu, Q.S. Extraction of Paddy Rice Area Using a DTW Distance Based Similarity Measure. Resour. Sci. 2014, 36, 267–272. [Google Scholar]
  63. Li, H.Z.; Yang, C.; Liu, E.H.; Yin, H. P-tile Combined with Histogram-based FCM for Pavement Image Partitioning. Comput. Era 2010, 8, 32–34. [Google Scholar]
  64. Zheng, J.Y.; Yi, Y.H.; Li, B.Y. A New Scheme for Climate Regionalization in China. Acta Geogr. Sin. 2010, 65, 3–12. [Google Scholar] [CrossRef]
  65. Zheng, J.Y.; Bian, J.J.; Ge, Q.S.; Hao, Z.X.; Yin, Y.H.; Liao, Y.M. The climate regionalization in China for 1981–2010. Chin. Sci. Bull. 2013, 58, 3088–3099. [Google Scholar]
  66. Zhao, J.; Yang, X. Average amount and stability of available agro-climate resources in the main maize cropping regions in China during 1981–2010. J. Meteorol. Res. 2018, 32, 146–156. [Google Scholar] [CrossRef]
  67. Shi, S.; Han, Y.; Yu, W.; Cao, Y.; Cai, W.; Yang, P.; Wu, W.; Yu, Q. Spatio-temporal differences and factors influencing intensive cropland use in the Huang-Huai-Hai Plain. J. Geogr. Sci. 2018, 28, 1626–1640. [Google Scholar] [CrossRef] [Green Version]
  68. Wang, H.Y.; Pan, X.P.; Luo, J.M.; Luo, Z.P.; Chang, C.P.; Shen, Y.J. Using remote sensing to analyze spatiotemporal variations in crop planting in the North China Plain. Chin. J. Eco-Agric. 2015, 23, 1199–1209. [Google Scholar]
  69. Liu, J.; Huang, Y. Dynamic Monitoring of Summer Maize Planting Information for Spatial and Temporal Variations in Huanghuaihai Plain During 2000–2010. Spectrosc. Spectr. Anal. 2012, 32, 2534–2539. [Google Scholar]
Figure 1. The spatial distribution of the study area (a) and reference area (b).
Applsci 10 02667 g001
Figure 2. The spatial distribution of agro-meteorological sites in Huanghuaihai Plain.
Applsci 10 02667 g002
Figure 3. The flowchart to map the summer maize cultivated area over Huanghuaihai Plain.
Applsci 10 02667 g003
Figure 4. Phenology calendar of principal crops in the reference area.
Applsci 10 02667 g004
Figure 5. The spatial distribution of summer maize in the reference area from Landsat ETM+.
Applsci 10 02667 g005
Figure 6. Moderate Resolution Imaging Spectroradiometer (MODIS) EVI time series curve of summer maize in the reference area.
Applsci 10 02667 g006
Figure 7. Correlation between actual summer maize phenology and simulated summer maize phenology with environmental factors in Huanghuaihai Plain in 2012.
Applsci 10 02667 g007
Figure 8. The simulated maize phenology using environmental factors in Huanghuaihai Plain in 2012.
Applsci 10 02667 g008
Figure 9. The mean absolute distance (MAD) map in Huanghuaihai Plain in 2012.
Applsci 10 02667 g009
Figure 10. The distribution of the maize planting area in Huanghuaihai Plain in 2012.
Applsci 10 02667 g010
Figure 11. Correlation between the extracted area based on remote sensing and statistical area of summer maize in Huanghuaihai Plain in 2012.
Applsci 10 02667 g011
Figure 12. Comparison of spatial distribution of summer maize extraction results based on MODIS and Landsat images in 2012 (Left: MODIS, Right: Landsat).
Applsci 10 02667 g012
Figure 13. Correlation between the extracted area based on remote sensing and statistical area of summer maize in Huanghuaihai Plain in 2013; (a) City level, (b). County level.
Applsci 10 02667 g013
Table 1. Phenology and environmental factors of summer maize in Huanghuaihai Plain in 2012.
SitesEnvironmental FactorsPhenological Information (DOY)
NameLongit-ude (°E)Latitude (°N)Average Annual Temperature (°C)≥10 °C Accumulated Temperature (°C day)Precipitation (mm)SowingSeeding EmergenceTrefoilSeven-LeafJoint-ingTassel-ingMilk-ripeMatura-tion
Nanyang112.5833.0314.61640.34919.5155164168180192209235254
Neixiang111.8633.0514.51635.15014.5163169171181198212232252
Ruzhou112.8334.187.08422.84930.8157164168180192212241258
Shangqiu115.6634.4514.91638.55035.6168174176186200219243262
Qixian114.7834.539.5479.54969.8160166170186198215241261
Zhengzho-u113.6534.7214.81435.95093.4161166168180194216241260
Heze115.4335.2515.39417.54854.4170176178190202220243268
Xinxiang113.8835.3113.84439.45085.9160166172182198214235262
Jining116.5835.4513.48518.95050.5170184188198208228250272
Juxian118.8335.5813.42842.14614.6171178182192206221248268
Puyang115.0135.713.42398.14793.8159176182192210221252262
Anyang114.3736.1214.55498.14878.3166172177186198219245268
Taian117.1536.1613.57587.74783.9179184188200217235248272
Jiaozhou12036.313.226064545.7167174178190210228262276
Gaomi119.7536.4113.67650.94521.4168172178188200212243264
Liaocheng115.9636.4814.06465.34739165172180190208220252272
Feixiang114.836.5514.81531.54850.1158168174188208219243268
Shexian113.6636.5611.71524.13701.2168174180194208227258282
Hanting119.1836.7513.47563.74600.7164168176188200219241262
Laiyang120.736.9311.71587.34360.4173179182194206223254272
Jiyang117.1136.9812.68659.64850.6166170174186200216243270
Neiqiu114.537.2812.15539.44840.3158165171182197215242272
Gaoyi114.6237.614.68521.84823.8159166170178184198217241
Luanchen-g114.6337.8812.12521.84823.8165182176186198219239272
Huanghua117.3538.3711.7760.24649.1175182186196212228252278
Hejian116.0838.4512.49666.44658.8164170178190204217241272
Rongchen-g115.8539.0513.57730.94493.9167175181191202221248276
Bazhou116.3839.1212.03791.24587.1160168182174196217243266
Zhuozhou115.9639.4812.71730.94493.9169176178189202221249272
Baodi117.2839.713.05881.64542.8168178176192202221250267
Tongxian116.6339.9212.88875.54554.2172178183198206225256274
Sanhe117.0839.9613.09881.64542.8173178182190202223252273
Table 2. Simulated enhanced vegetation index (EVI) function parameters of summer maize in reference area.
ParametersDataParametersDataParametersData
a10.282a20.321a30.341
b1217.8b2254.7b3204.7
c120.87c223.17c361.9
Table 3. The corresponding values of i, s, and summer maize phenology.
i161177193209225241257273289
s245667888
Summer maize phenology Seedling emergenceSeven-leafJoin-tingTassel-ingTassel-ingMilk-ripeMaturationMaturationMaturation
Table 4. Correlation analysis between the actual MODIS EVI curve and the simulation standard EVI curve of maize.
Bao-diDong-ngGao-MiGu-ChengKai-FengLu-ShanMeng-HouShou-UangXi-PingXu-Shui
R0.905 **0.917 **0.907 **0.926 **0.989 **0.955 **0.989 **0.922 **0.968 **0.912 **
Sig. (Two-tailed)0.0020.0010.0020.0000.0000.0000.0000.0000.0000.001
N9999999999
Note: ** Indicates the correlation is significant with p < 0.01.
Table 5. Comparison of extracted area and statistical data of summer maize for each province in 2012.
ProvinceStatistical Area/103 haExtracted Area/103 haHigh (+) or Low (−)/%Accuracy/%
Beijing133.0129.7−2.5197.49
Tianjin179.0175.4−1.9698.04
Hebei2684.32995.411.5988.41
Henan3100.03322.77.1892.81
Shandong3010.03428.213.5986.41
Note: High (+) or low (−)/% = (statistical area-extracted area)/statistical area × 100, and accuracy (%) is 100-Abs (high or low).
Table 6. Comparison of summer maize extraction results based on MODIS and Landsat images in 2012.
RegionStatistical Data/103 haExtracted Area of MODIS/103 haExtracted Area of Landsat/103 haPublic Area/103 haProportions of the Public to the Statistical Data/%Proportions of the Public to the Results Based on MODIS/%Proportions of the Public to the Results Based on Landsat/%
Changyua-n29.429.729.320.168.467.768.6
Gaotang37.734.034.428.375.183.282.3
Linzhang36.643.937.532.989.974.987.7
Lushan24.725.937.623.595.190.762.5
Yongnian33.935.025.322.365.863.788.1
Xinji43.260.151.245.999.476.489.6
average82.376.179.8
Table 7. Comparison of extracted area and statistical data of summer maize for each province in 2013.
ProvinceStatistical Area/103 haExtracted Area/103 haHigh (+) or Low (−)/%Accuracy/%
Beijing114.5105.1−8.2191.79
Tianjin191.7178.2−7.0592.95
Hebei2693.62630.4−2.3397.67
Henan3203.33104.3−3.0996.91
Shandong3060.72707.0−11.5688.44
Note: High (+) or low (−)/% = (statistical area-extracted area)/statistical area × 100, and accuracy (%) is 100-Abs (high or low).

