Article

Damage Detection of CFRP Stiffened Panels by Using Cross-Correlated Spatially Shifted Distributed Strain Sensors

1
CIRA, Italian Aerospace Research Center, 81043 Capua, Italy
2
Department of Industrial Engineering—Aerospace Division, University of Naples Federico II, Via Claudio, 21, 80125 Napoli, Italy
*
Author to whom correspondence should be addressed.
Appl. Sci. 2020, 10(8), 2662; https://doi.org/10.3390/app10082662
Submission received: 3 March 2020 / Revised: 8 April 2020 / Accepted: 9 April 2020 / Published: 12 April 2020
(This article belongs to the Special Issue NondestructiveTesting in Composite Materials Ⅱ)

Abstract

:
This paper presents a cross-correlation function-based method applied to a spatially shifted differential strain readout vectors using distributed sensors under backscattering random noise and impact excitations. Structural damage is generated by low/medium energy impact on two aeronautical 24-ply CFRP (carbon fiber reinforced plastic) stiffened panels. Two different drop impact locations, two different sensor layouts and two different post-impact solicitations are provided for a skin-stringer debonding detection and length estimation. The differential signal with respect to an arbitrarily selected grounding is used. Then the effects of noise filtering are evaluated post-processing the differential signal by cross-correlating two strain vectors having one sensor gauge position lag. A Rayleigh backscattering sensing technology, with 5 mm of spatial resolution, is used to log the strain map. The results show a good coherence with respect to the NDI (nondestructive inspection) performed by ultrasonic C-scan (an ultrasonic imaging system) flaw detector.

1. Introduction

Structural damage investigation is of a primary importance for improving the safety levels and keeping operation costs under control. Maintenance processes are among the highest operative costs in the aircraft life. In recent years, for many reasons, also related to the enlarging “globalization” scenario, attention towards economic aspects has grown. Safety is also increasing its role more than ever since the continuous expansion of the flight market causes the current percentage protection levels should prevent increment of accident. The consolidated introduction of composite technologies in the commercial products, moreover, makes the structural monitoring valuable for future planes competitiveness. From this point of view, in fact, there are many open points, hard to be overcome by the current understanding of the engineering artefacts behavior. Penalties induced by certification authorities’ requirements [1] make the promised advantages almost vanish (indeed, there are even technical limitations like “acoustic transparency” that in turn require additive weight integration—insulators). Among many others, there is one aspect on which the authors concentrated their efforts in this paper: the bonding line reliability after low/medium energy impact. A system including reliable observability of the bonding state can lead in principle to a “condition-based” maintenance and is therefore of absolute interest. Then the impact could be extended to the design segment, such a system allowing the assessment of lighter components.
Low/medium energy impact causes internal delamination and sometimes bonding line failure (called BVID [2]) that drop the compressive strength by nearly 50% [3].
Under this topic, in the context of the Italian Aerospace Research Center’s (CIRA) SMAF project (SMartAirFrame), funded by PRORA (Italian Program for Aerospace Research), a cost-effective maintenance approach is investigated by using the strain information given by an integrated SHM (structural health monitoring) system. In particular, the detection of damage with size and indentation smaller than that one currently assumed for design and certification, is used as requirement for the tests. Besides, the use of a monitoring system can overcome the current uncertainty of long-term adhesive performance and a fully integrated sensor network with low weight and naturally EM (electromagnetic) shielding, must be a core issue.
Many scientists worldwide, indeed, approached the problem of the damage identification in composite structures by using fiber optics, with Bragg grating, long period, chirped grating or even distributed [4,5,6], with static or even dynamic methodologies. Much work has been done to develop nondestructive inspection (NDI)/evaluation/ testing techniques, useful for the structural health monitoring (SHM) of composite structures. In aerospace applications [7], for instance, SHM techniques can be operated online during the flight or offline on the ground and can be focused on global inspection of large surface areas or limited region of interest thanks to distributed sensor system like optical fiber [8]. From the bibliographic analysis, many signal processing [9] methodologies for SHM are also resumed. Most of them use the change of the strain curves shape [10,11]. Others use the differences between a baseline set of measurements and the dataset at an unknown structural state [12,13,14].
Hence, the computation of a metric [15] (i.e., Mahalanobis distance—MD) can be performed, producing a damage alert when this difference exceeds a predefined limit. However, it is not trivial to select a ‘‘normal’’ or ‘‘healthy’’ group before constructing the Mahalanobis space.
Modal or frequency filter-based algorithms are other possible approaches [16,17,18]. These methodologies could detect multidefects, as long as each defect is located in between a pair of sensors. A damage index (DI) is based on the output voltages obtained through sensors which are passed through the band pass filter to ensure that they only contain the first natural frequency of the system.
Guided wave-based algorithms instead are based on the principle [19,20,21,22,23,24] that the propagation of guided waves between the actuator and sensor locations is affected by the presence of damages. Measurements acquisitions consists of broadband signals due to ultrasonic waves propagating in the structure. The damage index method provides information on which sensing paths cross the damage area.
All these SHM techniques are able to detect position and extension of damage, by using a reference baseline signal.
Nevertheless, it is a common vision that damage detection methods with unknown input force or unknown healthy structural response, are more promising for real engineering applications scenarios, but are usually difficult to be measured. Thus, the identification of a system that works only with the current readout responses is a challenging and (still) open issue [25].
Some interesting approaches involve distributed sensors networks bonded or even embedded into the structural component. In this case, dealing with hundreds or even thousands of sensing points, statistical-based data processing is still demonstrated to be effective and robust [3,13,26].
Within this frame, an SHM methodology is presented for BVID damage detection of composite stiffened panels representative for aeronautical applications. The authors focused on a specific feature selection approach. The paper presents a cross-correlation function-based method using distributed responses under backscattering random noise and impulse excitations. Algorithms based on this specific signal filtering method are already proposed and demonstrated to be effective for discrete array of sensors or for dynamic applications [27,28].
In this study, the cross correlation (X-Cor) functions are applied to spatially shifted distributed strain readout vectors. The cross-correlation function is used to highlight minor changes due to structural failure from backscattering noise with a general improvement of the signal quality.
The proposed methodology is applied to investigate the debonding line extension caused by low/medium (45 J) energy impact on 24-ply carbon fiber reinforced plastic (CFRP) stiffened panels. A Rayleigh backscattering technology, providing 5 mm of spatial resolution, is used to identify the strain output vector along a surface bonded fiber optic. The results show a good coherence with respect to the ultrasonic C-scan NDI controls.

2. Materials and Methods

The paper proposes a damage identification method, based on a specific data processing provided by the application of the cross-correlation function to differential strain vectors having a spatial shift lag (i.e., one sensor position). A description of the methodology flow-chart is summarized in Figure 1.

2.1. Motivation

The main physical effect of a structural damage is to give rise to local signal scattering in the readout signal. In this application the distributed fiber optic sensor measures residual strain; this means that the initial state (pre-impact), whatever it is, is set as reference for the current (after impact) measure. The readouts are provided in matrix form, whose rows are timestamps and whose columns are the sensors readouts. If the current structural condition is unchanged (with respect to the initial reference state) sensors readouts do not modify their values. On the contrary, if a gradient exists, this is due to an unexpected structural deformation visible both in time for each single sensor evolution (matrix columns) then in spatially adjacent sensors (matrix rows).
The readouts locations geometrically laying outside an expiring distance (about 2 cm) [6] from the damage, provide a quite unchanged strain value. For this reason, most of the SHM methodologies use the approach based on the difference between a baseline set of measurements and the current set, the so called “differential strain approach”. But this difference does not compensate for the background random-like noise. Indeed, to overcome the difficult interpretation of the results due to the signal-to-noise ratio, which sometimes hide too small deviations, an effective data filtering post process technique is needed [29,30]. In this scope, the cross-correlation function is herein applied in order to highlight minor changes owing to structural failure from backscattering noise with a general improvement of the signal quality. The cross-correlation filters portions of the signal slowly variable (or identical) whose characteristics are defined by a null value.

2.2. Mathematic Resume

In signal processing, cross-correlation is a mathematical operator measuring the rate of similarity of two series of data, as a function of the displacement of one set relative to the other. It is commonly used for searching a long signal for a shorter, known feature. For vectors defined on the set of reals R, the cross correlation of two finite sequences v1 and v2 is given by Equation (1):
( v 1 v 2 ) [ i 1 ] = i = 2 n s v 1 [ i ] v 2 [ i 1 ] ,
In this application, the vectors v1 and v2 are spatially shifted (one sensor gauge lag) strain readouts of the same fiber optic sensor. The operation is implemented in Matlab code.
The vectors v1 and v2 are obtained by the mean value (in time domain) of the original matrix raw data (En). The interrogation system provides a matrix set where each row is a timestamp of the current strain readouts at a predefined sample rate, and the columns is the time evolution history of each sensor readout.
A damage index (DI) can be then estimated. Generally speaking, given two signals of different structural configurations (baseline and current), a DI could be simply defined as follows:
DI = CS BS BS ,
where CS is the current signal and it represents the strain vector of the signal response after an impact or more generally an operational life. BS is the baseline signal and it represents the strain vector of the structure when it is supposed in healthy state, generally after component assembly or after manufacturing. According to this definition, with a DI close to zero, the structure is in a healthy state; when the DI overcomes a certain threshold, this means that damage appears; the greater the index, the more serious the damage would be.
In this application, having fixed a baseline configuration, the readout is the relative measured output with respect to their initial state. So, the fiber optic readout (Δε) is actually a differential strain vector. The Equation (2) can be specialized as follows:
D I F O = Δ ε ˜ max ( Δ ε ˜ ) ,
where, Δ ε ˜ is the cross-correlated differential strain readout. The normalized damage index definition provides information on which sensing paths is closely located to a damaged area. In addition, it does also return the absolute position of the damage and its extension all along the fiber optic length. For the DIFO a threshold level (TL) can be set. At this stage, the authors arbitrarily decided to define a TL according to Equation (4):
T L = μ + k σ
where μ is the mean value of the DIFO, σ its standard deviation, and k is a dimensionless constant value herein set to 3, indicating the probability the measure is within the normal distribution with the 98% [30]. In the end, the TL is drawn and used to plot “eligible” sensors among those exceeding the TL value. The cluster of eligible sensors position along the fiber optic is used to indicate the damage position and extension onto the structural component under test.

2.3. Setup Description

2.3.1. Test Specimen

Two panels under test are herein briefly described. Both have a dimension of 230 mm (stringer direction) × 350 mm with two T shaped stringers (Figure 2).
The material is an orthotropic carbon fiber with a Young modulus in fiber direction equal to E1 = 137,500 MPa and a Young Modulus in matrix direction equal to E2 = 8200 MPa. The skin has a rectangular shape, 230 mm long, 350 mm wide and 5 mm thick. The sequence of lamination is symmetrical and balanced with a total number of 24 ply. The stringer cap is 170 mm long, 67.3 mm wide and 2.5 mm thick with a symmetrical and balanced lamination sequence for a total number of 12 ply.
These panels are representative of the upper skin of a typical wing box of a Regional Aircraft (CS 23), reference baseline in the SMAF project, in terms of layups, material (IMS/977-2), stiffness, manufacturing process, and in particular in terms of impact damage resistance (dent depth, damage area, compression after impact, etc.) due to low energy impacts (BVID-Barely Visible Impact Damage, EASA AMC 20-29).

2.3.2. Test Rig

Structural damage is generated by low/medium energy impact (45 J). Damage is provided by out-of-plane, concentrated impact, using a drop-weight device with a hemispherical impactor. In both the cases the impact causes a delamination and a skin-stringer debonding. In order to host the panel in the drop machine (Figure 3a) and to control the position of the impactor, a dedicated fixture is manufactured (Figure 3b). The two panels (namely PNL1 and PNL2) are tested under impact at 45 J. Two different drop impact events are considered. The first coupon PNL1 is impacted in the center of the skin (Figure 4a) and the second coupon PNL2 is impacted under the stringer cap (Figure 4b).

2.4. Instrumentation

A high-resolution Rayleigh backscattering photonic sensor is used (Figure 5) providing a continuous (in this case 2 m max length) strain map with a gauge length of 5.2 mm for a total number of 468 sensing points, with a resolution <1 µε and accuracy of ±30 µε [31].
The NDI is instead performed by phased array ultrasonic testing (PAUT) tests with an Olympus OmniScan SX flaw detector with a 16:64PR phased array unit equipped also with a conventional UT channel for pulse-echo, pitch-catch or TOFD (Time of Flight Diffraction) inspection [32]. Phased array ultrasonic instruments utilize high frequency sound waves to check for the internal structure of a test piece, or measure its thickness, and rely on the same basic laws of physics that govern sound wave propagation. The probe is moved along one axis while the beam electronically scans along the other one, according to the focal law sequence (Figure 6).
Tests are carried out by exploiting an encoded 5 MHz, 64 elements linear array probe with a straight wedge and by employing a specific gel as coupling medium. No calibration blocks are used, the measurement of the specimen thickness being taken as reference [33], and the nondestructive control is performed by sliding the probe along the longitudinal axis of each stringer (Figure 6).

2.5. Data Processing

  • To qualitatively evaluate the reliability of the SHM system, postprocessing is applied on output data provided by: Two different sensor layouts are used: on the PNL1 panel, the fiber optic path considers both the two stringers perimeter (dotted curve in Figure 7a). For the PNL 2 panel only one stringer cap is sensorized and a sinusoidal (arbitrarily selected) path on the skin in the region between the two stringers is proposed (Figure 7b).
  • Two different post-impact solicitations: unloaded condition for PNL1 and quasi-static three point bending for the PNL2.
Sensor bonding procedure is another crucial point for a reliable measurement process. From previous work, of the author [34], the influence of different adhesives on fiber optic sensors are investigated. The results showed that at room temperature for low strain values (<0.5%) and quasi-static excitation, the sensor fixed by cyanoacrylate and two other epoxy resins with different viscosity, has a high linearity, with a linear correlation coefficient of 0.9996. In this current application, since the strain amplitude is expected to be lower than 0.1%, and static residual strain is considered, a M-Bond 200 modified acrylate is used. On the other hand, attention is mostly paid to provide a very thin bond line at the interface and enough glue around the fiber to improve the strain transfer [35,36]. In addition, a second thicker layer of adhesive in combination to Kapton tape was used to seal and protect the outer surface of the fiber optic just during the impact to prevent accidental breakage or debonding. A double check of the bonding line integrity can be done by looking for unexpected strain values dropping to zero, from the output map provided by the interrogator.
In addition, fiber optic sensor has a pig tail and a transition zone of protection loose tube being the first 20 cm of its length from the connector. When a temperature compensation is required, this transition zone, being a strain free section, is used to estimate the thermo-optic effect to be off-line subtracted to the mechanical effect. In this current activity, the measures are performed at constant RT, so no temperature compensation is applied.

3. Results

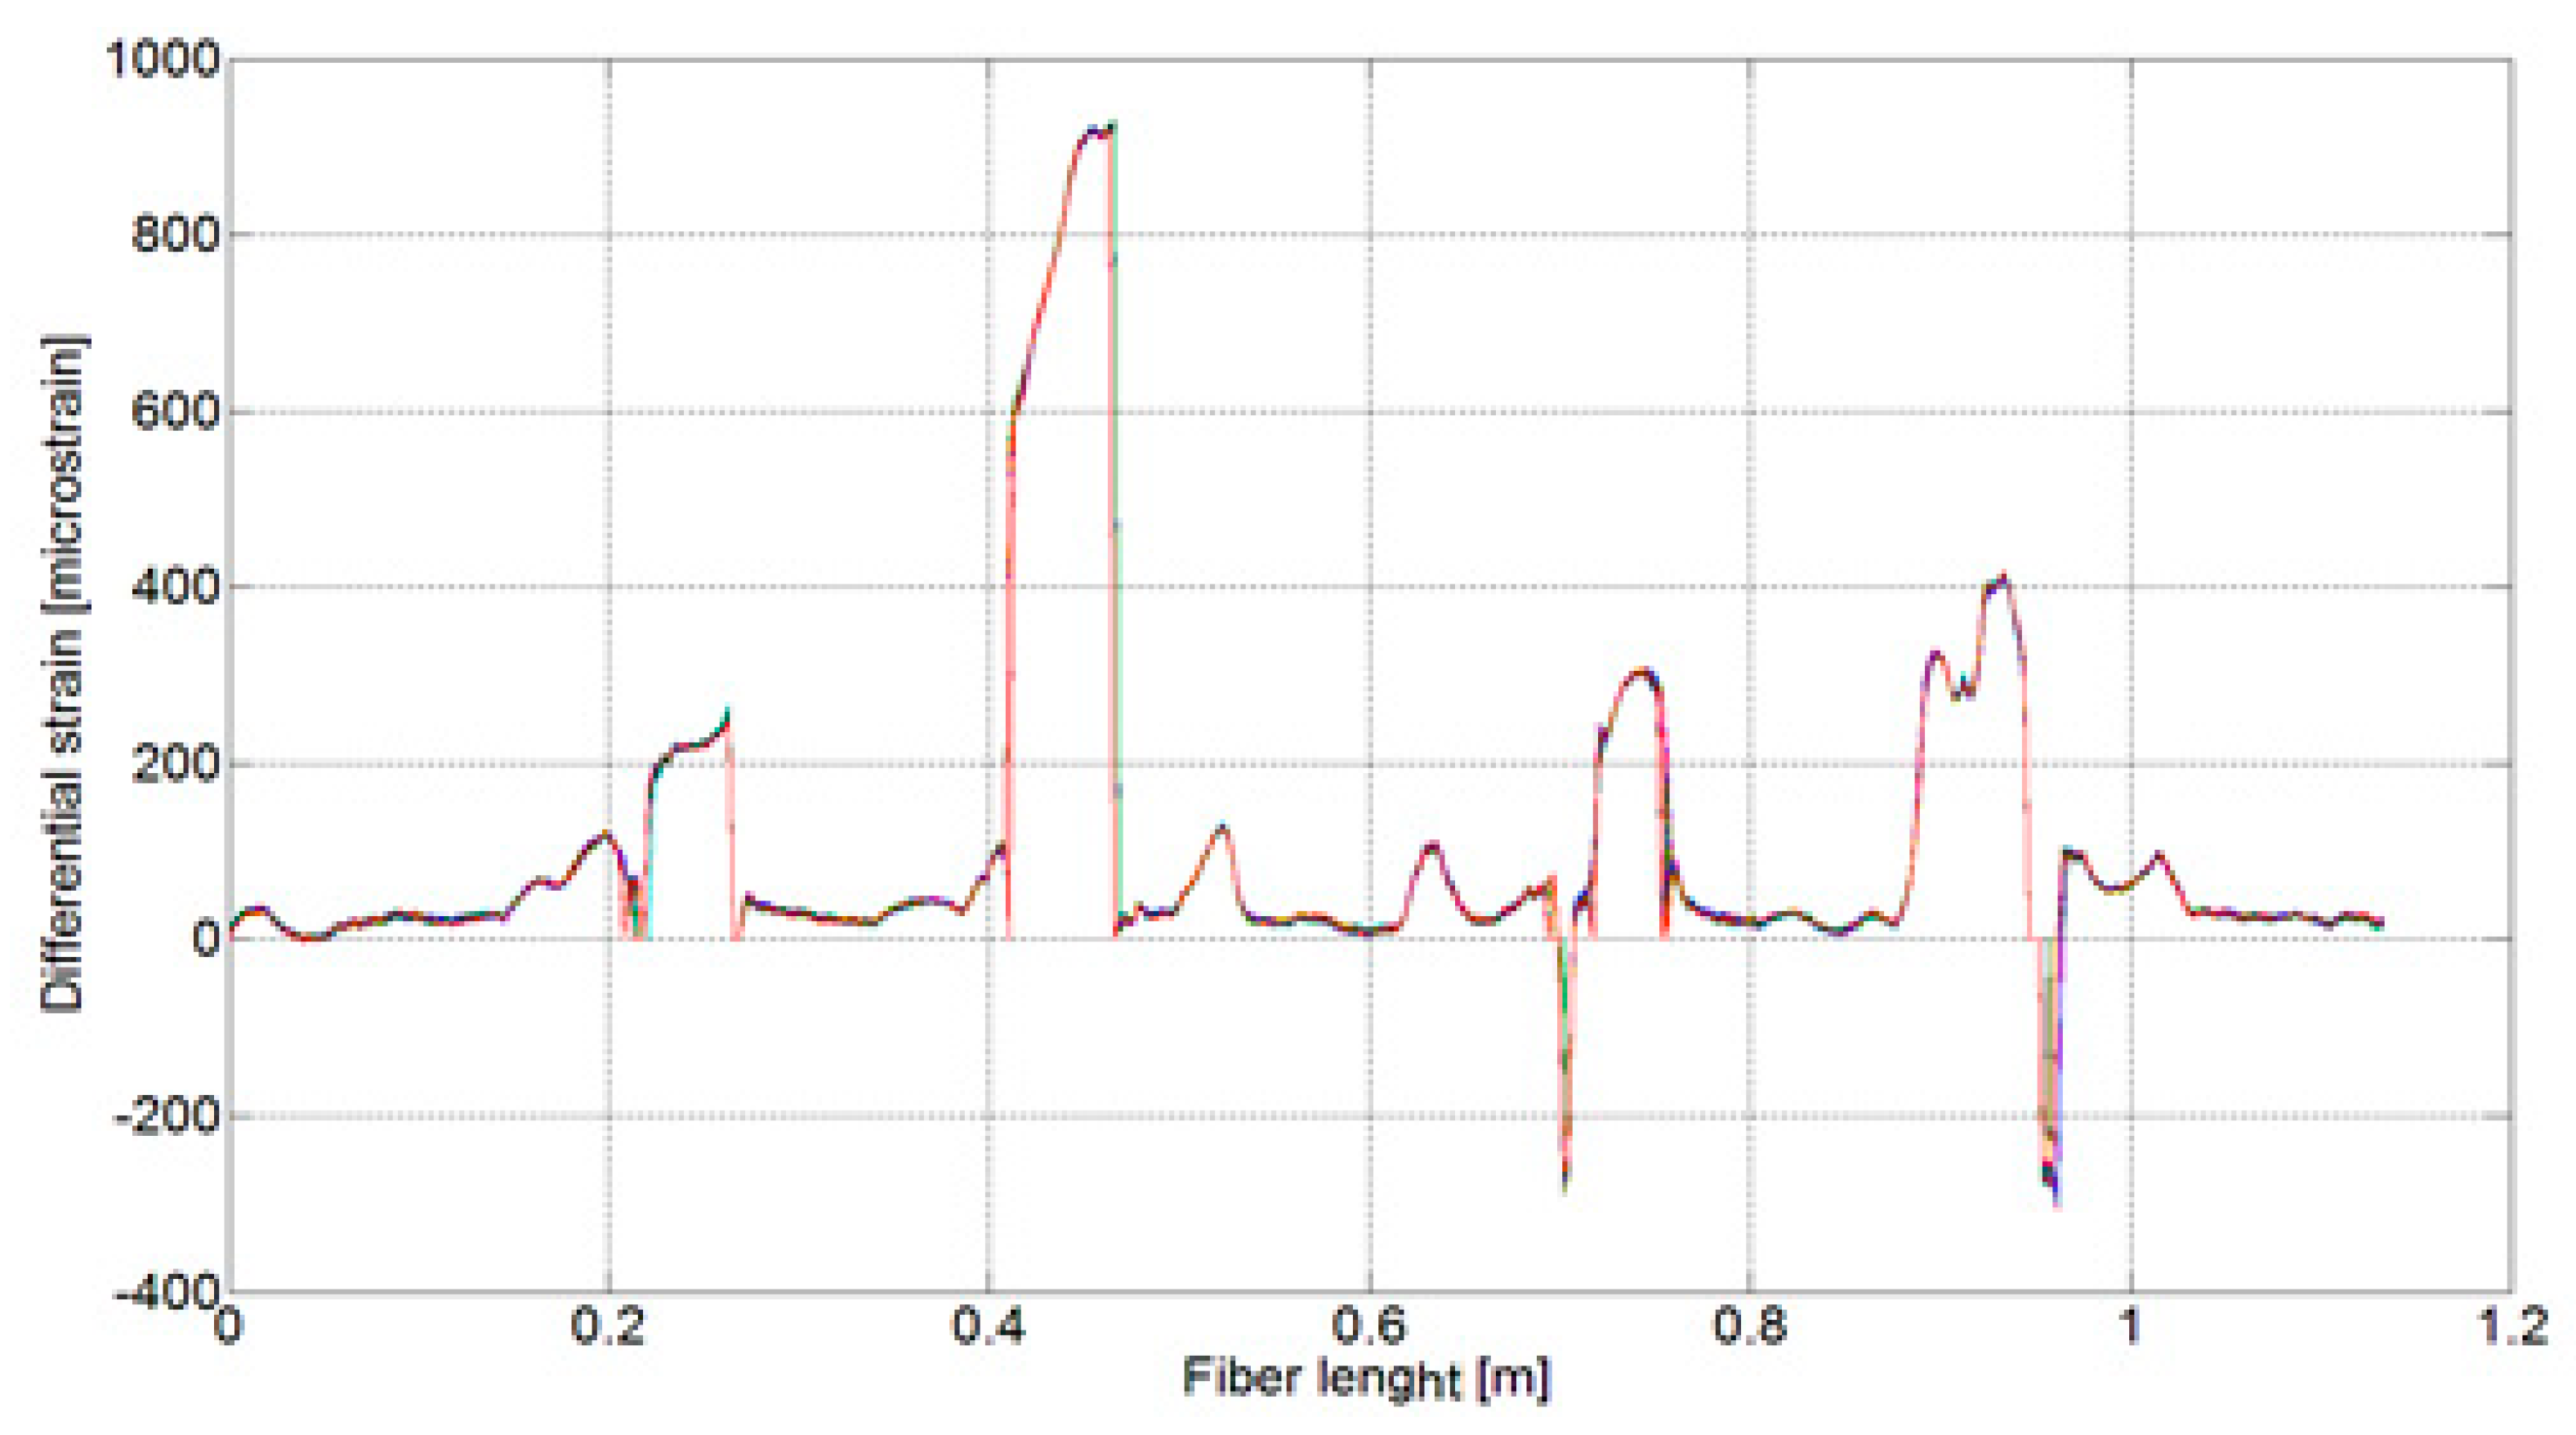
3.1. Data Analysis for PNL1

The differential strain for panel PNL1 after impact is reported in Figure 8. The damage index is evaluated according to Equation (3) and is provided in Figure 9. The damage index is the normalized cross-correlation applied to the differential strain vector (Figure 8) and its spatial transition (one sensor gauge). The threshold line (red line in Figure 9) is estimated according to Equation (4), that is, the mean value of the cross-correlation distribution.
The TL is applied to select eligible sensors, assuming that all the sensors (along the x-axis) of which the DI value (along the y-axis) exceeds the TL are associated to a damage event. The estimation of the damage extension is provided by the clustering of the eligible sensors position along the fiber optic.
A simple graphical user interface is realized to sketch the top view panel geometry and visualize the fiber optic layout (yellow line) and the damage position and extension (red dots) according to the SHM methodology (Figure 10).
The SHM estimations are validated by C-scan analysis. The C-scan signal amplitude and depth data are collected within gated regions of interest and plotted with each focal law progression, using the programmed beam aperture. Amplitude shows the presence of wide intense skin/stringer interface damage (Figure 11 and Figure 12).
In particular, it is possible to see a wide surface stringer disbond which affects both the feet of the two stiffeners, (black dashed line areas) with analogous detachment length, 80 mm for the left foot and 90 mm for the right foot, also confirmed by the B-scan section views. Similarly, there are further little disbonded areas at the tip of the stiffeners probably attributable to bending phenomena during impact.

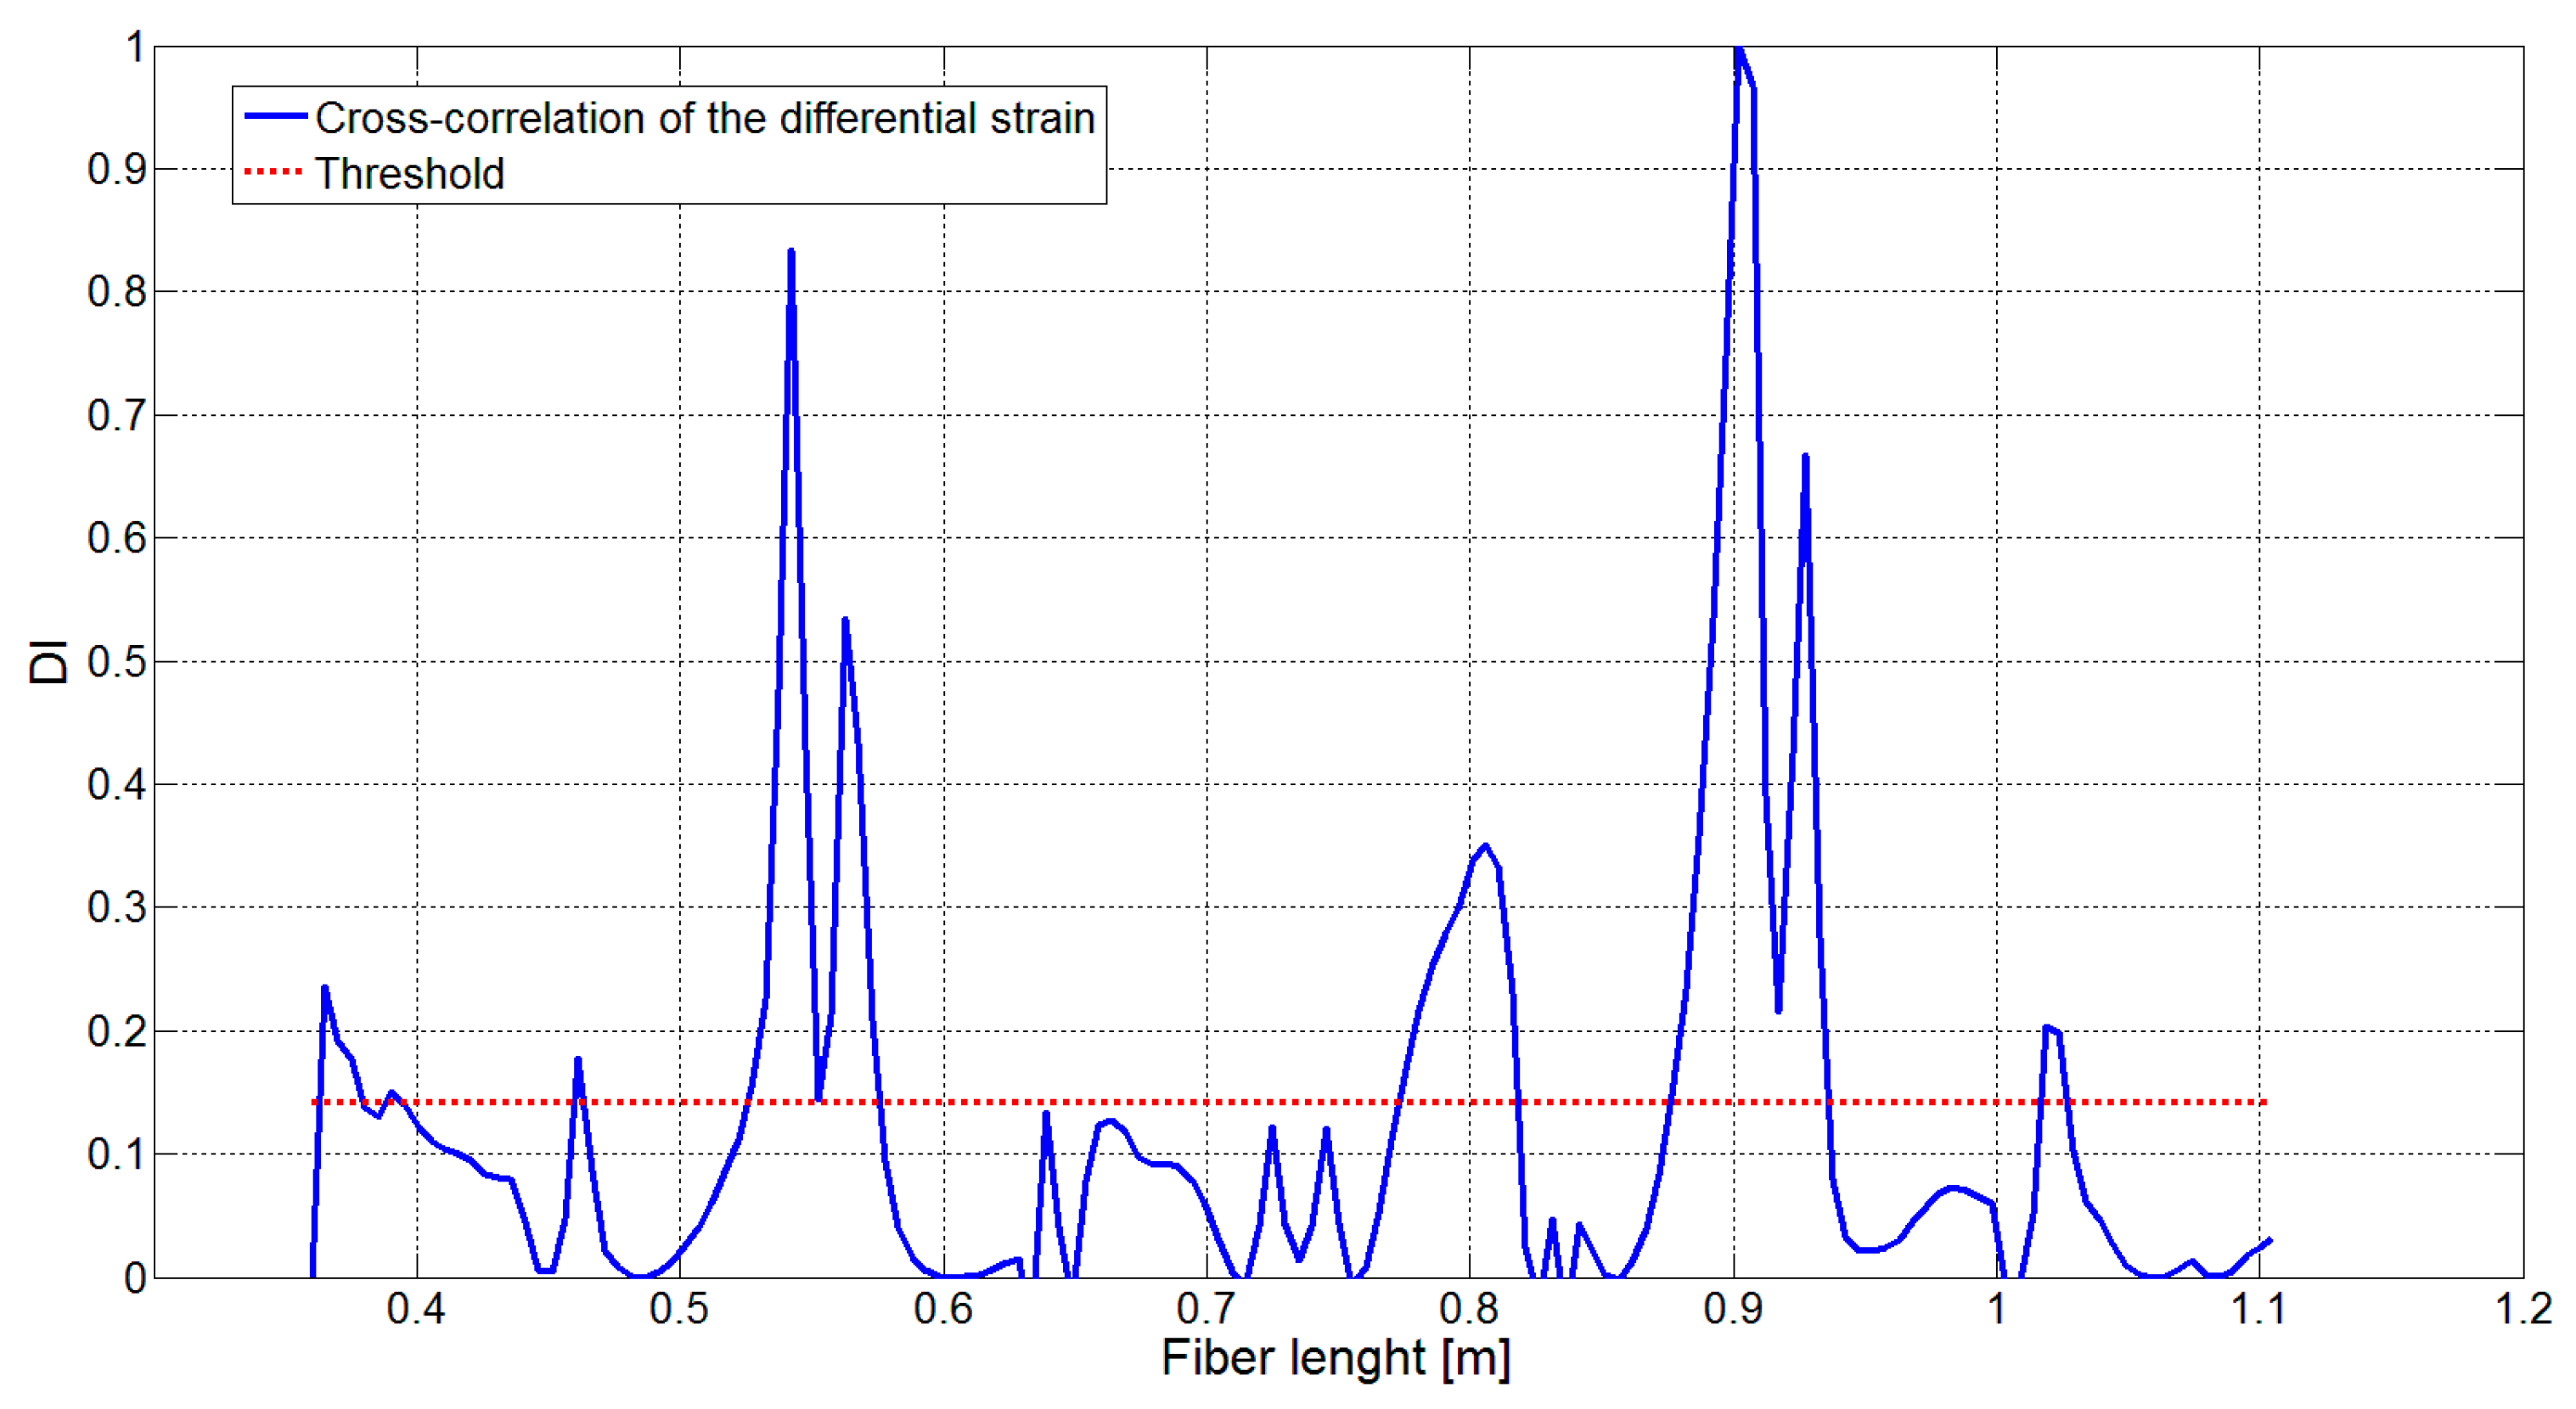
3.2. Data Analysis for PNL2

The strain distribution for panel PNL2, caused by the impact under the stringer cap, is reported in Figure 13. In this case, differently from the test executed on PNL1, the panel PNL2 is now solicited, just after the impact, by a 3-p (three point) bending load up to 80 N. The quasi-static time history is logged during the solicitation at a fixed sample rate of 10 Hz. The DI is again evaluated according to Equation (3). The DI distribution is reported in Figure 14 where the TL is also provided.
Again, the TL is applied to select the eligible sensors and their position all along the fiber length (Figure 15). The graphical user interface provides the panel geometry and the damage position (red dots distribution) all along the fiber optic length (yellow line). In this test case, the impact is performed under the left stringer and the fiber optic is bonded on the stringer cap and some portion of the skin. The scope of this choice is to verify the capability of the sensor redundancy to detect the stringer cap disbonding from the sensors at the stringer cap (red dots) and from the sensors at the skin (blue dots). The algorithm, also in the quasi-static solicitation condition, is able to successfully detect damaged locations as verified by C-scan analysis.
The C-scan amplitude view (Figure 16 upper) shows the presence of wide, intense local and skin/stringer interface damage. In particular, is possible to see a delamination around the impact site, highlighted with a dashed white line, and a wide surface stringer disbond, highlighted with black dashed line.
The left stringer disbond damage (Figure 16 upper), affects both the feet of the stiffener which show a detachment of 81 mm along the left foot and of 124 mm along the right foot. There is also a further little disbonded area at the right tip of the stiffener probably due to bending phenomena during impact. In the Figure 16 (bottom), on the right stringer C-scan, it is possible to see an indentation process of the material surface. However, the indentation, probably caused during manufacturing is too small and below the axial resolution of the B-scan analysis, (PAUT limited detection zone or dead zone). Then, it is possible to infer that no significant damage occurs, but only a faint indentation.

4. Discussion

Two tables are reported to synthesize the attained results, which are clustered for the left and the right stringers. In Table 1 and Table 2, the detected damage extension is provided for panel PNL1 and panel PNL2, respectively. In the first case, the fault zone is revealed with a max difference of 12.5%; therefore, it can be assumed that extrapolated data and actual measures (NDI) are in good agreement. In the second case, predicted performance is still good, even it should be considered in that case, only a single stringer (the left one) is affected by debonding. In that case, the error estimated is 3.2% as algorithm is compared with C-scan output in the region of interest.
These results are extremely encouraging, even if the damaged region is very extensive, and then easily detectable in principle by visual inspection. On the other side, it is evident that the precision shown by the proposed SHM system is relevant, from both the point of view of damage extension and damage position (start/end) detection. Furthermore, selected damage indexes assume remarkable value along the whole range of interest. The system is able to catch the strain variation correlated to the elastic energy that is released as debonding occurs, and consequent to the impact. Such energy corresponds to deformations of about 100 microstrains. The system, on the other hand is able to discern strains of about 10 microstrains that could be set as the “observation” threshold. If we consider that displacement may be represented as a fourth degree polynomial (free-free element), it follows that deformation has a quadratic dependence on the damage extension. Therefore, standing the observed results, it could be extrapolated that faults can be detected, whose size is up to a third of the currently investigated size. Such a value brings the SHM system capability to a bottom margin of 30 to 40 mm, wide enough for real applications where limits are often imposed at 80 mm (typical step of fasteners).

5. Conclusions

In this study, the cross-correlation functions are applied to spatially shifted distributed strain readout vectors. The cross-correlation function is used to highlight minor changes due to structural failure from backscattering noise with a general improvement of the signal quality.
In the investigated case, in particular, faults were derived by point impacts, whose magnitude and position were controlled in lab. Damage was detected by selecting eligible sensors whose DI exceed the threshold level. No information about the constraint or loading conditions are required.
Application studies consisted of two different impact events, two different sensor layouts, and two different load conditions after impact (unloaded and quasi-static load, respectively). Damage detection capability was proved to be effective in both the conditions, even if for practical reasons the first one should be always preferred. Experimental examples are used to demonstrate the effectiveness of the proposed technique. In the first test case, a max error of 12.5% is obtained, probably due to a bonding failure at the very stringer cap edges where the fiber is forced to change its curvature. In the second test case, an error of 3.2% is obtained when comparing the C-scan readouts.
In light of the above considerations, further extensive tests are planned on multi-impact and dynamic solicitations, in order to have a first estimate of the SHM system behavior under the following variability:
-
Impact magnitude (and, then, damage size);
-
Imposed external loads, moving from unloaded (released elastic energy, only) to loaded configurations (imposed external disturbances);
-
Structural thickness, in turn affecting strain and therefore deformation value, essential for SHM operation.

Author Contributions

Conceptualization, M.C.; Investigation, B.G. and F.R.; Supervision, A.C. and E.M.; Writing—original draft, M.C. and N.D.B.; Writing—review & editing, N.D.B. All authors have read and agreed to the published version of the manuscript.

Funding

This research was funded by the project Smart Airframe (SMAF), within the National Aerospace Research Program (PRORA).

Acknowledgments

The authors are grateful to Langella from University of Naples “Federico II” to support us in this research.

Conflicts of Interest

The authors declare no conflict of interest.

References

  1. Boffa, N.D.; Monaco, E.; Ricci, F.; Amoroso, F. Investigation of manufacturing effects by strength assessment, NDI and guided waves based SHM in composite plates reinforced with bonded stringers. In Proceedings of the SPIE 10972, Health Monitoring of Structural and Biological Systems XIII, 109720Y, Denver, CO, USA, 1 April 2019. [Google Scholar] [CrossRef]
  2. EASA AMC 20-29. In Composite Aircraft Structure; EASA: Cologne, Germany, 2010.
  3. Güemes, A.; Fernández-Lòpez, A.; Díaz-Maroto, P.F.; Lozano, A.; Sierra-Perez, J. Structural health monitoring in composite structures by fiber-optic sensors. Sensors 2018, 18, 1094. [Google Scholar] [CrossRef] [PubMed] [Green Version]
  4. Ciminello, M. Distributed fiber optic for structural health monitoring system based on auto-correlation of the first order derivative of strain. IEEE Sens. J. 2019. [Google Scholar] [CrossRef]
  5. Yari, T.; Nagai, K.; Hotate, K.; Ishioka, M.; Ibaragi, M.; Koshioka, Y. Monitoring Aircraft Structural Health Using Optical Fiber Sensors. Mitsubishi Heavy Ind. Tech. Rev. 2008, 45, 5–8. [Google Scholar]
  6. Sierra-Pérez, J.; Güemes, A.; Mujica, L.E. Damage detection by using FBGs and strain field pattern recognition techniques. Smart Mater. Struct. 2013, 22, 25011. [Google Scholar] [CrossRef] [Green Version]
  7. Boller, C.; Chang, F.K.; Fujino, Y. Encyclopedia of Structural Health Monitoring; John Wiley & Sons, Ltd.: Southern Gate, Chichester, UK, 2009. [Google Scholar]
  8. Boffa, N.D.; Monaco, E.; Ricci, F.; Lecce, L.; Barile, M.; Memmolo, V. Hybrid structural health monitoring on a composite plate manufactured with automatic fibers placement including embedded fiber Bragg gratings and bonded piezoelectric patches. In Proceedings of the SPIE 10972, Health Monitoring of Structural and Biological Systems XIII, 109720U, Denver, CO, USA, 5 March 2019. [Google Scholar] [CrossRef]
  9. Di Sante, R. Fibre optic sensors for structural health monitoring of aircraft composite structures: Recent advances and applications. Sensors 2015, 15, 18666–18713. [Google Scholar] [CrossRef] [PubMed]
  10. Wada, D.; Murayama, W.; Igawa, H. Lateral load measurements based a distributed sensing system of optical frequency domain reflectometry using long-length fiber Bragg gratings. J. Lightwave Technol. 2012, 30, 2337–2344. [Google Scholar] [CrossRef]
  11. Tsamasphyros, G.J.; Kanderakis, G.N.; Furnarakis, N.K.; Marioli-Riga, Z.P. Detection of patch debonding in composite repaired cracked metallic specimens, using optical fibers and sensors. In Proceedings of the SPIE Optical Metrology Conference, Munich, Germany, 23–26 June 2003. [Google Scholar]
  12. Maurin, L.; Ferdinand, P.; Nony, F.; Villalonga, S.; Bertin, M.; Langlois, C.; Devilliers, C. Controle santé par fibresoptiques de réservoirs composites pour le stockaged’ hydrogene sous haute pression–projet H2E (Horizon HydrogéneEnergie). In Instrumentation and Interdisciplinarité: Capteurs Chimiques and Physiques; Jaffrezic-Renault, N., Ed.; EDP Sciences: Les Ulis, France, 2013; pp. 39–44. [Google Scholar]
  13. Fernandez, A.; Menendez, J.; Guemes, A. Damage detection in a stiffened curved plate by measuring differential strains. In Proceedings of the 16th International Conference on Composite Materials, Kyoto, Japan, 8 July 2007. [Google Scholar]
  14. Shapira, O.; Ben-Simon, U.; Bergman, A.; Shoham, S.; Glam, B.; Kressel, I.; Tur, M. Structural health monitoring of a UAV fleet using fiber optic distributed strain sensing. In Proceedings of the International Workshop on Structural Health Monitoring, Stanford University, Stanford, CA, USA, 1–3 September 2015. [Google Scholar]
  15. Taguchi, G.; Jugulum, R. The Mahalanobis-Taguchi Strategy: A Pattern Technology System; John Wiley & Sons Inc.: Hoboken, NJ, USA, 2002. [Google Scholar]
  16. Li, H.J.; Yang, H.Z.; Hu, S.L. Modal strain energy decomposition method for damage localization in 3D frame structures. J. Eng. Mech. 2006, 132, 941–951. [Google Scholar] [CrossRef]
  17. Dimino, I.; Calabrò, A.M. Structural damage identification by vibration parametres and fibre optic sensors. Czech Aerosp. 2009, 3, 33–41. [Google Scholar]
  18. Stubbs, N.; Kim, J.T.; Topole, K. An efficient and robust algorithm for damage localization in offshore platforms. In Proceedings of the ASCE 10th Structures Congress, San Antonio, TX, USA, 13–15 April 1992; Volume 92, pp. 543–546. [Google Scholar]
  19. Ciminello, M.; Boffa, N.D.; Concilio, A.; Memmolo, V.; Monaco, E.; Ricci, F. Stringer debonding edge detection employing fiber optics by combined distributed strain profile and wave scattering approaches for non-model based SHM. Compos. Struct. J. 2019, 216, 58–66. [Google Scholar] [CrossRef]
  20. Memmolo, V.; Ricci, F.; Maio, L.; Boffa, N.D.; Monaco, E. Model assisted probability of detection for a guided-waves based SHM technique. In Proceedings of the SPIE 9805, Health Monitoring of Structural and Biological Systems 980504, Las Vegas, NV, USA, 1 April 2016. [Google Scholar] [CrossRef]
  21. Memmolo, V.; Boffa, N.D.; Maio, L.; Monaco, E.; Ricci, F.; Pasquino, N. Experimental Characterization of a Composite Structures Health Monitoring Methodology. In Proceedings of the 3rd IEEE International Workshop on Metrology for Aerospace, Florence, Italy, 21–23 June 2016. [Google Scholar]
  22. Ricci, F.; Mal, A.; Monaco, E.; Maio, L.; Boffa, N.D.; Di Palma, M.; Lecce, L. Guided Waves in Layered Plate with Delaminations. In Proceedings of the 7th European Workshop on Structural Health Monitoring, EWSHM 2014-2nd European Conference of the Prognostic and Health Management (PHM) Society, Nantes, France, 8–10 July 2014; pp. 80–87. [Google Scholar]
  23. Memmolo, V.; Ricci, F.; Boffa, N.D.; Maio, L.; Monaco, E. Structural Health Monitoring in Composites Based on Probabilistic Reconstruction Techniques. Procedia Eng. 2016, 167, 48–55. [Google Scholar] [CrossRef]
  24. Maio, L.; Memmolo, V.; Boffa, N.D.; Monaco, E.; Ricci, F. Investigation on fundamental modes of guided waves propagating in symmetric and nonsymmetric composite laminates. Proc. Inst. Mech. Eng. Part C J. Mech. Eng. Sci. 2017, 231, 2988–3000. [Google Scholar] [CrossRef]
  25. Lei, Y.; Jiang, Y.; Xu, Z. Structural damage detection with limited input and output measurement signals. Mech. Syst. Signal Process. 2012, 28, 229–243. [Google Scholar] [CrossRef]
  26. Ciminello, M.; Concilio, A.; Galasso, B.; Pisano, F.M. Skin–stringer debonding detection using distributed dispersion index features. Struct. Health Monit. 2018, 5, 1245–1254. [Google Scholar] [CrossRef]
  27. Wang, L.; Yang, Z.C.; Waters, T.P. Structural damage detection using cross-correlation functions of vibration response. J. Sound Vib. 2010, 329, 5070–5086. [Google Scholar] [CrossRef]
  28. Li, X.Y.; Law, S.S. Matrix of the covariance of covariance of acceleration responses for damage detection from ambient vibration measurements. Mech. Syst. Signal Process. 2010, 24, 945–956. [Google Scholar] [CrossRef]
  29. Freedman, D. Statistical Models: Theory and Practice; Cambridge University Press: Cambridge, UK, 2000; ISBN 978-0-521-67105-7. [Google Scholar]
  30. Montgomery, D.C.; Peck, E.A. Introduction to Linear Regression Analysis, 2nd ed.; Wiley: New York, NY, USA, 1992. [Google Scholar] [CrossRef]
  31. User’s Guide ODiSI-B; Luna Innovations. Available online: https://lunainc.com/wp-content/.../ODiSI-B-Users-Guide.pdf (accessed on 14 May 2014).
  32. Advances in Phased Array Ultrasonic Technology Applications; Olympus IMS. Available online: https://www.olympus-ims.com/it/books/pa/pa-advances/ (accessed on 4 February 2020).
  33. Boccardi, S.; Boffa, N.D.; Carlomagno, G.M.; Maio, L.; Meola, C.; Ricci, F. Infrared thermography and ultrasonics to evaluate composite materials for aeronautical applications. J. Phys. Conf. Ser. 2015, 658, 18. [Google Scholar] [CrossRef]
  34. Ciminello, M.; Concilio, A.; Galasso, B.; Richiello, C.; Fabbi, G.; Mataloni, A.; Perugini, P. Sensitivity analysis of OFDR-based distributed sensing for flaws detection in representative coupon from filament wound motor vessel. In Proceedings of the SPIE—The International Society for Optical Engineering, Orlando, FL, USA, 14 May 2018. [Google Scholar] [CrossRef]
  35. Wang, H.; Jiang, L.; Xiang, P. Improving the durability of optical fiber sensor based on strain transfer analysis. Opt. Fiber Technol. 2018, 42, 97–104. [Google Scholar] [CrossRef]
  36. Wang, H.; Xiang, P.; Jiang, L. Strain transfer theory of industrialized optical fiber-based sensors in civil engineering: A review on measurement accuracy, design and calibration. Sens. Actuators A Phys. 2019, 285, 414–426. [Google Scholar] [CrossRef]
Figure 1. Methodology flowchart.
Applsci 10 02662 g001
Figure 2. Carbon fiber reinforced plastic (CFRP) geometry: front view (a); dymetric view with thickness detail (b).
Applsci 10 02662 g002
Figure 3. Test rig: drop-weight machine (a); aluminum fixture for the panel (b).
Applsci 10 02662 g003
Figure 4. Impact position indicated by a star: PNL1 panel in the center of the skin (a); PNL2 panel under a stringer (b).
Applsci 10 02662 g004
Figure 5. Fiber optic sensor interrogation unit.
Applsci 10 02662 g005
Figure 6. Scan pattern section view (upper) and scan setup (lower).
Applsci 10 02662 g006
Figure 7. Sensor layout dotted line: on PNL1 all along the stringer perimeter (a); on PNL2 along the inner line of left stringer and on the skin (b). The red arrow indicates the light insertion origin.
Applsci 10 02662 g007
Figure 8. Differential strain after impact for PNL1.
Applsci 10 02662 g008
Figure 9. Damage index and threshold level (red line) estimated from the Damage Index (DI).
Applsci 10 02662 g009
Figure 10. Graphical user interface of the panel geometry and fiber optic layout (yellow dotted line). The red dots are the sensors with higher DI value.
Applsci 10 02662 g010
Figure 11. Panel PNL1: left stringers C-scan (upper) and B–B longitudinal section with B-scan view (bottom)—scan length 200 mm.
Applsci 10 02662 g011aApplsci 10 02662 g011b
Figure 12. Panel PNL1: right stringers C-scan (upper) and B–B longitudinal section B scan view (bottom)—scan length 200 mm.
Applsci 10 02662 g012
Figure 13. Dynamic differential strain acquisition after impact for PNL2.
Applsci 10 02662 g013
Figure 14. Damage index and threshold level (red line) estimated from the DI.
Applsci 10 02662 g014
Figure 15. Graphical user interface of the panel geometry and fiber optic layout (yellow dotted line). The red and blue dots are the sensors with higher DI value.
Applsci 10 02662 g015
Figure 16. Panel PNL2: left (upper) and right (bottom) stringers C-scan amplitude views—scan length 200 mm.
Applsci 10 02662 g016aApplsci 10 02662 g016b
Table 1. Damage position estimation for PNL1.
Skin/Stringer Debonding on PNL1
Left Cap on
Left stringer
Right Cap on
Left stringer
Left Cap on
Right stringer
Right Cap on Right stringer
X-Cor Algorithm
Position [mm]
from 890 to 980from 690 to 780from 400 to 470from 200 to 290
X-Cor Algorithm
Extension [mm]
90907090
C-scan
Extension [mm]
80908090
Error [%]:
( X C o r C s c a n   ) C s c a n 100
+12.50−12.50
Table 2. Damage position estimation for PNL2.
Skin/Stringer Debonding on PNL2
FO on the Cap of Left stringer FO on the Skin of Left stringer
X-Cor Algorithm
Position [mm]
from 360 to 480from 780 to 810from 880 to 930from 1040 to 1045
X-Cor Algorithm
Extension [mm]
12030505
C-scan
Extension [mm]
124---
Error [%]:
( X C o r C s c a n   ) C s c a n 100
−3.2---

