Abstract
Damage detection in complex mechanical structures is important for cost-effective and safe operation. Conveyor belts with steel cords are used for bulk material transport in mining companies. Due to harsh environmental conditions, both covers and cords are subjected to damage. As lengths of conveyors may vary from dozens of meters to kilometers, a belt loop consists of many connected belt pieces. Thus, the condition of splices between belt pieces is also critical. For both steel cord damage/wear detection and splice condition evaluations the NDT techniques based on magnetic field measurement and variability analysis are used. To obtain appropriate resolution, multi-channel data are collected. Here we propose a pre-processing technique developed for signal synchronization for biased splices data. The biased splices mean a phase shift between signals from a multi-channel sensor due to the design technology of the splice. As the quality of the splice is related to the appropriate precision of splice production, splice evaluation is defined as a similarity analysis of each signal with respect to the estimated pattern. Due to the mentioned phase shift, signals should be "synchronized" first, before final analysis. In industrial conditions, many factors may influence the signal shape. Thus, the problem of automated synchronization by shifting the signals may be defined as a multidimensional optimization problem. Here, we proposed to use a genetic algorithm with an algorithmically simple cost function for that purpose. In this paper, the authors propose an automated procedure applied to real measurement data and final results. A multidimensional optimization has been compared to simple signal shifting according to several criteria, and GA-based results were the best.
1. Introduction
Conveyor belts are used for transport in many industries, mainly: mining, logistics and civil engineering. From the very beginning, various studies related to optimization, energy efficiency or condition monitoring including magnetic monitoring of steel cord conveyor belts were initiated. Since then a number of solutions/systems were developed worldwide that allow optimization and non-invasive inspection of a whole conveyor [1,2,3,4,5,6,7], the belt core [8,9,10,11,12,13] or drive units (gearbox, pulleys, bearings) [14,15,16,17], idlers [18,19,20,21,22,23,24]. Recently, inspection procedures started to be robotized [3,19,25].
One of the most difficult components to diagnose is the conveyor belt. For a belt with steel cords, magnetic field measurements were proposed in the 80s by Harrison [8]. Magnetic field measurements are an accurate technique for testing ferromagnetic materials [26]. Non-destructive testing using a magnetic phenomenon is a common method in detecting geometric discontinuities (damages) and fatigue states in materials. Examples of using magnetic defectoscopy to assess the technical condition of machine elements are the cases of examinations of train wheels [27], pipes [28] and wire ropes [29]. The issue raised in this article is magnetic signals measured from steel cords in a conveyor belt.
Although there are some works on the diagnosis of belts with steel cords [8,9,10,11,12,13], they are mainly concerned with detecting damage and evaluating the technical condition of belt sections. Surprisingly, issues relating to the splices have been omitted. Splice technical condition may be evaluated during both regular service inspection of the belt as well as during the production phase, as splice quality control.
NDT-related processing of signals acquired from the belt one may face several important issues. First of all, to obtain the appropriate precision of damage detection, the multi-channel measurement system is used. As mentioned, it may be assumed that the average length of belt conveyors is 1 km. That gives a 2 km belt length and consequently, generates a lot of data to process. These data may be noisy and usual in a real industrial case. For example, the paper [30] deals with the issue of removing noise from electromagnetic signals coming from a conveyor belt with steel cords.
From a signal processing point of view the task is to detect, extract and model (describe) disturbances in the signal related to splices, i.e., places when two pieces of the belt are connected. It should be done for each sensor (each sensor array section, i.e., each part of the belt width) and depends on the design of the splice.
From a theoretical point of view, each signal (each belt width part) should be very similar for high-quality splices. If some errors have appeared during splice production, they will be sources of additional disturbances and they will influence the signal shape. Changes in signal shape may be also related to wear or fault that will rise during operation.
Practically, we would like to compare signals from all channels using some criteria. In cases of biased splices, signals are phase-shifted, as the beginning of the splice is shifted for each belt-width section. For good condition splice-one may simply find a difference in phase of each signal with comparison to the selected reference channel. In cases of damaged splices (or with poor quality), simple-shifting becomes a multidimensional optimization problem. The reason for this is that it will be hard to find one reference point in the reference signal. Incorrect synchronization may lead to wrong conclusions. To overcome it, we have proposed a genetic algorithm-based procedure to optimize signals shifting. Criteria for optimization have been defined too. The presented method has been applied for both damaged belt splices and good quality splices.
The paper is organized in the following way: Section 2 presents a description of the multi-channel data acquisition system and provides some details about the experiment in the mine. Section 3 provides basic knowledge about belt splice design that is the basis of defining the problem for signal processing (discussed in Section 4). The developed procedure for multi-channel data processing is provided in Section 5, and Section 6 presents results and discussion regarding the comparison of methods and obtained results. Finally, the conclusions section ends the paper.
2. HRDS Measurement System
The High Resolution Diagnostic System (HRDS) is a unique solution developed at Wroclaw University of Science and Technology as an output of research project. It was designed for the magnetic testing of conveyor belts with steel cords. The HRDS system is based on the modified EyeQ system from rEscan company. The effects of the work, including the modification of the existing and available system, mainly consisted of its expansion and increasing the measurement capabilities. The number of sensors was increased, which resulted in a six-fold increase in the resolution of the measuring system and the development of a mobile data acquisition device. The extension and measurement capabilities of the developed HRDS system are described in the article [31].
The measurement method is based on the pre-magnetization of the steel cords in the core using a magnetic bar. The next step consists of the acquisition of the data from a magnetic head. In the magnetic head 24 coils with a resolution of 10 cm are located. This allows for testing on conveyor belts up to the width of 2.4 m with resolution of 0.1 m. The magnetic head and magnetic bar are placed perpendicularly to the direction of belt movement. The coils (sensors) detect changes in the magnetic field generated by the magnetized steel cords located in the core of the conveyor belt. Magnetic field changes occur in the vicinity of damaged steel cords or splices. The schemes of the system (Figure 1) and the HRDS system during measurement have been presented in Figure 2 and Figure 3. The measurement system allows testing conveyor belts with speed of up to 10 m/s.
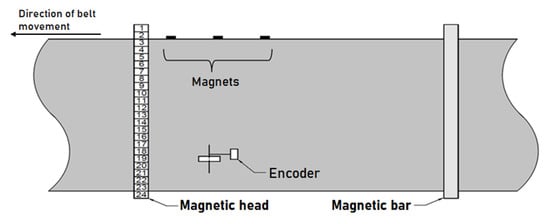
Figure 1.
Scheme of the HRDS measuring system.

Figure 2.
Magnetic head (1) and magnetic bar (2) installed on the belt conveyor.
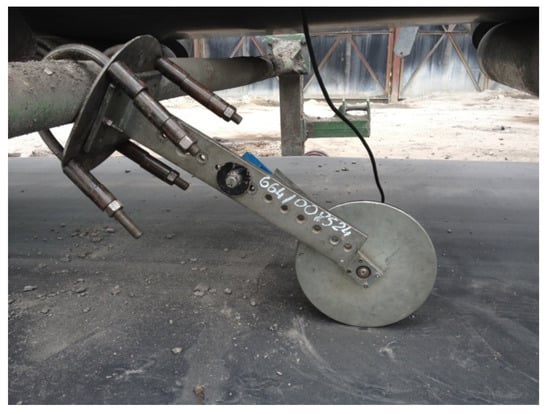
Figure 3.
Encoder installed on the belt conveyor.
Additionally, several small neodymium magnets are attached to the periphery of the conveyor belt. The magnets are positioned 8–12 m apart to automatically identify full runs of the belt loop and thus the beginning and end of the belt loop. The magnets should not be attached in the area of the splices. The amplitude of the signal in the splice area distorts the reading of the signal generated by the neodymium magnets. Likewise, the sections where the magnets are attached to the belt can be marked. It allows one to quickly find the magnets and remove them after the measurement (Figure 4).
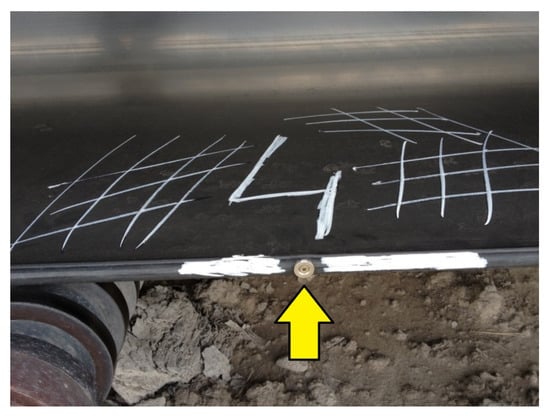
Figure 4.
One of the marked neodymium magnets attached to the conveyor belt.
The HRDS system data acquisition module is built into the Peli box. It consists of a signal recording module (CompactDAQ) and a portable tablet (Durabook) with an application (Figure 5). After performing the measurement, it is possible to copy the data directly from the tablet to the computer, which allows for further analysis.
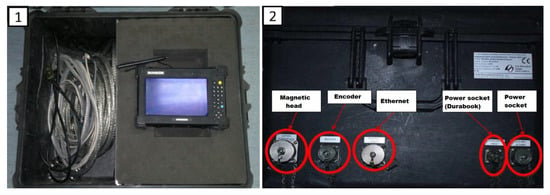
Figure 5.
HRDS system data acquisition module: Durabook tablet and CompactDAQ (1); plugs installed in the box (2).
3. Conveyor Belt Splices
As mentioned, due to the length of a conveyor, and the weight and size of the required belt, it is not possible to use one piece of a belt, so it is divided into sections (100–400 m) and these pieces are "reconnected" by adhesive, mechanical joints or vulcanization depending on the belt type. These parts of the belt loop are by definition the weakest parts and thus evaluation of their condition is important; see Figure 6.
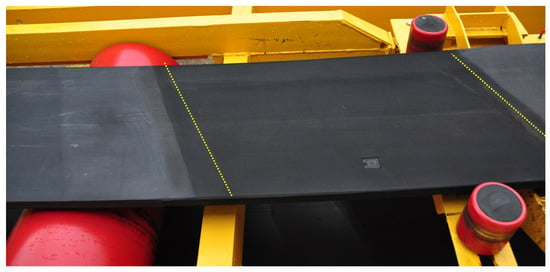
Figure 6.
Picture of the conveyor belt with splices.
In the case of a conveyor belt splice, the change in the magnetic field is much greater than the change in the field due to the belt damage (see Figure 7). Unlike damage, the signal from the splice has a high amplitude across the entire width of the belt. This property was used to automatically detect splices in data from over the entire length of the belt.
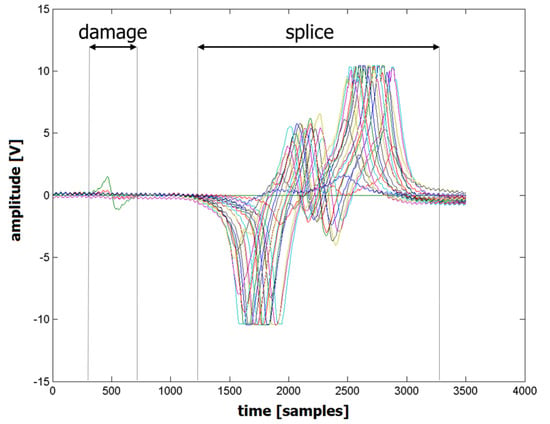
Figure 7.
The raw magnetic field variations recorded for a belt with damage and splices.
The measurement data provide information on magnetic field variations across the belt’s length. This great amount of data requires initial classification. The first group comprises magnetic signals from belt sections; the second group comprises signals from splices. The algorithm described in [32] included data from the first group. Splices are always the weakest parts of a conveyor belt. Splices were not analyzed due to the different characteristics of signals. The algorithm can save each splice to a separate file (Figure 8).

Figure 8.
The magnetic field variations recorded for a belt section with damages and splices (1); a belt section with only splices (2); a single splice (3).
Unlike in the case of straight splices, the signals generated by bias splices are shifted in relation to each other as a function of time. Figure 9 schematically shows signals characteristic of both splice types.

Figure 9.
Signals characteristic of both splice types: straight splice (left) and bias splice (right).
4. Problem Definition
The analysis and comparison of signals from splices is problematic, as the signals are shifted with respect to each other. Shift values depend on splice geometry, production technology and wear processes. Note that shifts (nearly) do not occur in straight splices, which therefore cannot be compared with bias splices.
For good condition splices, each signal should have a similar shape, so just finding the phase difference and then shifting all signals with reference to the first channel may fix the problem. For bad conditions, it is very difficult to find a reference point and shifting the signal may provide misleading results.
From an engineering perspective, the main goal is to shift each signal for bias splices by a certain value (with reference to selected signal) that would allow finding a minimum of their difference defined as simple sample-by-sample residual and RMS errors. The ideal case means no difference between signals, so the RMSE will be zero. For simple (not biased) splices, the shifting procedure is not required; one may simply compare signals as they are. It may be said that we developed a "synchronization" procedure for biased splices to convert them to "straight" splices and use a simple technique for splice condition evaluation.
From a practical point of view, the problem can be defined as finding the shift value for each channel, such that some predefined objective function describing error in mutual positioning of all channels is minimized. In the past, several attempts have been made to solve this problem either manually or using simple deterministic algorithms (also presented in this paper for reference). However, the authors propose to define the problem as an optimization problem. We consider the genetic algorithm (GA) as a potential tool, because of its ease of implementation and the problem definition in such a case. GA is also very robust regarding avoiding local minima due to intrinsic solutions such as random mutation.
5. Methodology
Synchronization was performed using three methods: a manual method, a single-point method and a genetic algorithm method, which is the selling point of this paper. The authors considered other methods that would allow one to automatically synchronize the channels; however, they turned out to be infeasible in the realistic scenario.
The first considered method assumes using relative cross-correlation of the channels to detect shifts between them. It seems very straightforward and robust; however, edge channels with signal shapes, dissimilar to the rest, were in practice too irregular to be able to properly detect the shift for them. For this reason, it cannot be used, because there is a need to synchronize all the channels and not disregard the edge ones. For poor-quality splices, this method was completely unusable because cross-correlation did not allow one to reliably detect the relative shifts because of overly irregular shapes of the channels.
The second considered method assumes using a neural network to estimate the values of relative shifts. While theoretically possible, it would require a large dataset for learning. In such set parts of the signal containing information about the splices, they would need to be perfectly segmented, parameterized and labeled, which is practically impossible (another large-scale automated method would be needed to do that), but most importantly, it is infeasible because even within a single belt the splices can be so different that common parameterization, even if possible, would be meaningless, especially for automatic pre-labeling.
For those and other reasons, the authors decided to use a well-known, easy to set up optimization technique—the genetic algorithm. The descriptions of the methods and their results are presented below.
5.1. Manual Method
The first method consisted of manually matching all signals from a single splice. The method was based on the following algorithm (Figure 10).
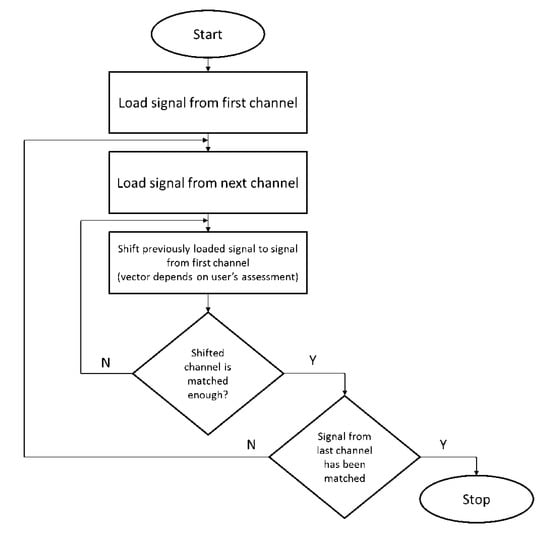
Figure 10.
The manual method’s synchronization algorithm.
The above algorithm assumes that initial shift values may not be satisfying to the user and allows one to modify them repeatedly. Figure 11 shows the first three steps of the algorithm: (1) loading two channels; (2) shifting the second channel in relation to the first channel; (3) loading the third channel, etc.
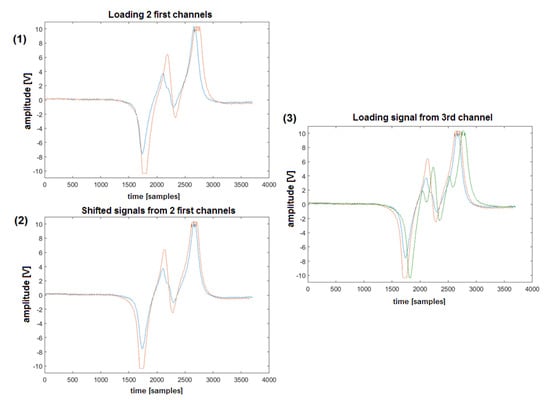
Figure 11.
First three steps presented for manual channel synchronization.
As the above method is very time-consuming and provides results that depend on the user’s experience, automated synchronization methods are required to speed up the process. The disadvantages of the method make it impractical and hence this solution was not included in the comparison of the remaining methods discussed in the results section. The method cannot be used in a mine, where the number of belt conveyors (and hence splices) makes it highly ineffective.
5.2. Single-Point Algorithm
Manual synchronization of one splice is time-consuming and inaccurate. This fact necessitated another method for signal matching. It was assumed that all signals (from one splice) should have uniform length (Figure 12). Matching was performed for both correctly made and faulty splices (Figure 13).
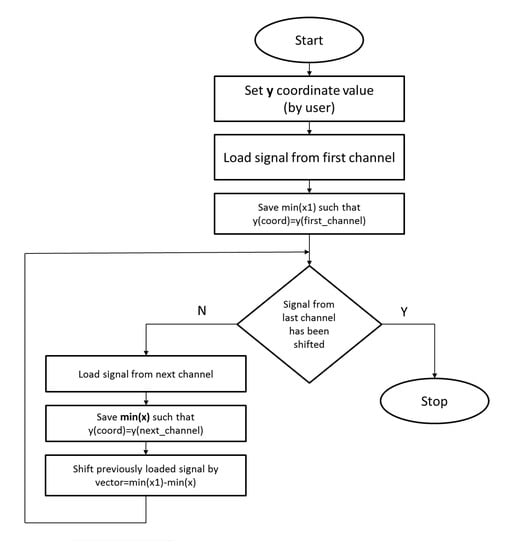
Figure 12.
Single-point synchronization algorithm.
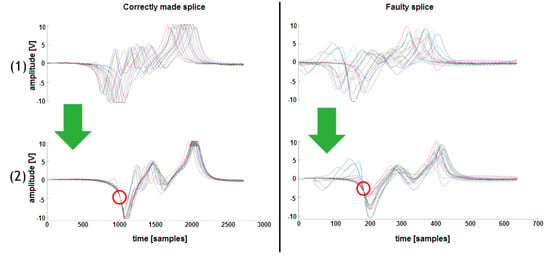
Figure 13.
The results of synchronization performed with a single-point algorithm for a correctly made splice (on the left) and for a faulty splice (on the right) with the synchronization point marked (red circle).
The results of using the single-point algorithm were not satisfactory. In cases of a faulty splice, the differences between the lengths of particular signals were much greater that in cases of a correctly made splice. The algorithm that synchronizes signals in relation to a single-point can be run within just a few seconds. This allowed for significant time savings as compared to the first method.
5.3. Genetic Algorithm
The genetic algorithm is a simulated process of evolution that contains the main features seen in biology [33]. From an implementation point of view, GA is a metaheuristic optimization technique. This concept has been introduced by Bagley’s thesis [34] and then developed in large part by Holland [35,36]. Typically, optimization problems are given as follows:
Problem 1.
Find an such that f is minimal in , where is an arbitrary real-valued function; i.e., .
Sometimes it is very difficult to obtain strict global solution, so in practice we want to find values x that minimize the objective function f. One can write down the elementary structure of GA (Algorithm 1) as follows:
| Algorithm 1: structure of GA |
| Compute initial population ; WHILEstopping condition not fulfilledDO BEGIN select individuals for reproduction; create offspring by crossing individuals; occasionally mutate some individuals; compute new generation;END |
The main loop of GA performs the transition from one generation to the next using four basic components:
- Selection: Selection of individuals for reproduction with respect to their fitness defined with objective function.
- Crossover: Generation of offspring based on the information pulled from two individuals.
- Mutation: Random deformation of the chromosomes with a certain probability. This serves for generating genetic diversity, and as an effect, local minima can be avoided.
- Sampling: The procedure which computes a new generation from the previous one and its offspring.
For the described application, GA was used to evolve the vector of 24 values corresponding to the shift of each channel to the right, expressed in samples. The number of total generations was set to 200, with a stall limit of 20 generations. Each population consisted of 450 individuals. The algorithm used the roulette method for the selection of individuals for reproduction and intermediate crossover function with a weight ratio equal to 0.8. The gene mutation probability was set to 0.01%. The lower and upper bound for channel shift was defined as 1/6 of initial channel length.
The fitness function is defined to be the sum of RMS errors between each channel in the current state of synchronization, and the median of all channels calculated in this state. This means that the more cohesively channels are synchronized, the lower the value of error. In fitness function, we use median instead of often used mean because it is less susceptible to outliers (i.e., edge channels that very often take a different shape than most) or to dissimilar shapes of individual channels (the worse the splice quality the worse the mean value describes the trend across the channels in comparison to the median).
The results of the GA-based synchronization of channels are presented in Figure 14. Residual errors are low and channels are positioned very cohesively, especially for correctly made splices. Faulty splices are also synchronized very well, but it is more difficult to observe the synchronization quality just by looking at the result. The matrix of synchronized signals is not much longer than the original (about 15% for the correctly made splice, about 20% for the faulty splice).
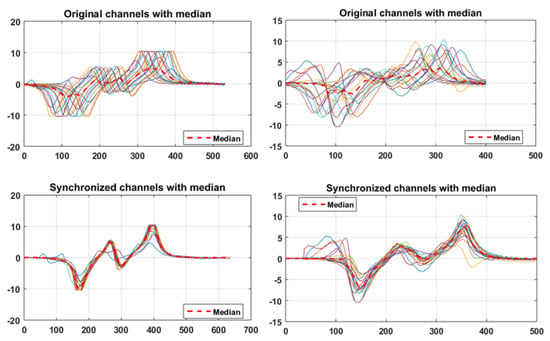
Figure 14.
Results of synchronization with a genetic algorithm for the correctly made splice (left panels) and the faulty splice (right panels).
6. Results and the Comparison of the Algorithms’ Efficiencies
In this section we compare the performances of genetic algorithm and single-point algorithm. We disregard manual synchronization due to its impractical character, lack of repeatability and very long time of performing the task manually.
6.1. Linearity Criterion
The linearity criterion works under the assumption that diagonal splices are manufactured with the linear shift, which translates into the idea that consecutive measurement channels should be shifted relative to each other by evenly spaced values (other words, each consecutive channel should be shifted by the linear function relative to the first channel). Results show that the genetic algorithm produces more linear shift than the single-point algorithm (Figure 15 and Figure 16). Besides visual evaluation, RMS error between the shift vector and its linear fit has been calculated (see Table 1).
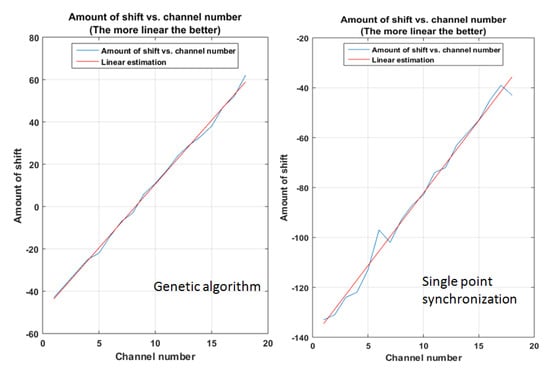
Figure 15.
Linearity comparison for the correctly made splice.
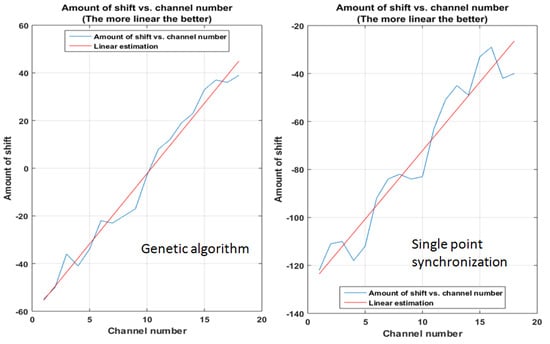
Figure 16.
Linearity comparison for the faulty splice.

Table 1.
RMS errors between shift vector and its linear approximation function.
The genetic algorithm outperforms single-point synchronization by far. In terms of linearity criterion, it performs about 30% better for the correctly made splice and about 117% better for a faulty splice.
6.2. RMSE Criterion
This criterion is based on the measurement of RMS error between channels and the median. Table 2 presents errors measured in both quality scenarios for the initial matrix of data, and then for the results of the single-point synchronization and genetic algorithms.

Table 2.
RMS errors for initial data and the results of synchronization with both algorithms.
The genetic algorithm again performed better, with a gain from single-point synchronization to the genetic algorithm of about 15%.
6.3. Extension Criterion
In this case, we measure by how much-given algorithm has to extend the length of the initial data matrix. Each algorithm extends the matrix, which is necessary to perform any shifting, but it is expected that the extension will be as small as possible. Table 3 shows the lengths of initial matrices along with final lengths after synchronization with both algorithms.

Table 3.
Lengths of initial data matrices and output matrices after synchronization.
Again, the genetic algorithm reveals better quality than single-point synchronization, with a gain of about 12%.
7. Conclusions
Magnetic signals from conveyor belt bias splices were synchronized using the manual method, single-point method and genetic algorithm method. Each of the methods was implemented in the Matlab software. Manual synchronization was flawed with disadvantages and time consumption that disqualified it from comparison with the remaining algorithms. Signal synchronization for total splice length was performed only in the case of the genetic algorithm. This fact was significant due to the differences between signal lengths for the same splice. The fitness function was set to be the sum of RMS errors between each channel and the median. This means that the more cohesively channels are synchronized, the lower the value of error. The single-point algorithm and genetic algorithm were compared with each other using the criteria of linearity, RMSE and extension. The best results were obtained for the signals synchronized using the genetic algorithm and therefore this algorithm will be used in further research. In particular, GA was better than single-point method by 15% using the RMSE criterion, 12% using the extension criterion and even up to 117% using the linearity criterion. Signals synchronized using the genetic algorithm allow us to employ identical algorithms for inspecting the technical condition of both straight and bias splices, which significantly simplifies maintenance-related analytical procedures.
Author Contributions
Conceptualization, M.H.; funding acquisition, R.B.; methodology, T.K.; resources, M.H.; software, J.W; supervision, R.Z. and R.B.; validation, T.K.; writing—original draft and editing, T.K., J.W. and R.Z. All authors have read and agreed to the published version of the manuscript.
Funding
This research received no external funding.
Conflicts of Interest
The authors declare no conflict of interest.
References
- Cao, X.; Zhang, X.; Zhou, Z.; Fei, J.; Zhang, G.; Jiang, W. Research on the Monitoring System of Belt Conveyor Based on Suspension Inspection Robot. In Proceedings of the 2018 IEEE International Conference on Real-time Computing and Robotics (RCAR), Kandima, Maldives, 1–5 August 2018; pp. 657–661. [Google Scholar]
- Stefaniak, P.; Wodecki, J.; Zimroz, R. Maintenance Management of Mining Belt Conveyor System Based on Data Fusion and Advanced Analytics. In Advances in Technical Diagnostics; Timofiejczuk, A., Lazarz, B.E., Chaari, F., Burdzik, R., Eds.; Springer International Publishing: Cham, Switzerland, 2018; pp. 465–476. [Google Scholar]
- Carvalho, R.; Nascimento, R.; D’angelo, T.; Delabrida, S.; Bianchi, A.; Oliveira, R.; Azpúrua, H.; Garcia, L. A UAV-based framework for semi-automated thermographic inspection of belt conveyors in the mining industry. Sensors 2020, 20, 2243. [Google Scholar] [CrossRef] [PubMed]
- Mu, Y.; Yao, T.; Jia, H.; Yu, X.; Zhao, B.; Zhang, X.; Ni, C.; Du, L. Optimal scheduling method for belt conveyor system in coal mine considering silo virtual energy storage. Appl. Energy 2020, 275, 115368. [Google Scholar] [CrossRef]
- Yao, Y.; Zhang, B. Influence of the elastic modulus of a conveyor belt on the power allocation of multi-drive conveyors. PLoS ONE 2020, 15, e0235768. [Google Scholar] [CrossRef] [PubMed]
- Zhang, M.; Shi, H.; Yu, Y.; Zhou, M. A computer vision based conveyor deviation detection system. Appl. Sci. 2020, 10, 2402. [Google Scholar] [CrossRef]
- Rudawska, A.; Madleňák, R.; Madleňáková, L.; Droździel, P. Investigation of the effect of operational factors on conveyor belt mechanical properties. Appl. Sci. 2020, 10, 4201. [Google Scholar] [CrossRef]
- Harrison, A. A magnetic transducer for testing steel-cord deterioration in high-tensile strength conveyor belts. NDT Int. 1985, 18, 133–138. [Google Scholar] [CrossRef]
- Kuzik, L.; Blum, D. Scanning steel cord conveyor belts with the BELT C. A. T. MDR system. Bulk Solids Handl. 1996, 16, 437–441. [Google Scholar]
- Gao, Y.L.; Cai, L. Development of technology for conveyor belt rope condition assessment in China. Min. Sci. Technol. 1999, 99, 667–670. [Google Scholar]
- Xiao, G.; Yang, Z. The Electromagnetic Nondestructive Testing Device of the wirerope-core transmission belt. In Proceedings of the 2012 Power Engineering and Automation Conference, Wuhan, China, 18–20 September 2012; pp. 1–4. [Google Scholar]
- Błażej, R.; Kirjanów, B.; Kozłowski, T. A high resolution system for automatic diagnosing the condition of the core of conveyor belts with steel cords. Diagnostyka 2014, 15, 41–45. [Google Scholar]
- Fedorko, G.; Molnar, V.; Ferková, Ž.; Peterka, P.; Krešák, J.; Tomašková, M. Possibilities of failure analysis for steel cord conveyor belts using knowledge obtained from non-destructive testing of steel ropes. Eng. Fail. Anal. 2016, 67, 33–45. [Google Scholar] [CrossRef]
- Grzesiek, A.; Zimroz, R.; Śliwiński, P.; Gomolla, N.; Wyłomańska, A. Long term belt conveyor gearbox temperature data analysis—Statistical tests for anomaly detection. Meas. J. Int. Meas. Confed. 2020, 165. [Google Scholar] [CrossRef]
- Obuchowski, J.; Wylomanska, A.; Zimroz, R. Recent developments in vibration based diagnostics of gear and bearings used in belt conveyors. Appl. Mech. Mater. 2014, 683, 171–176. [Google Scholar] [CrossRef]
- Hebda-Sobkowicz, J.; Zimroz, R.; Wyłomańska, A. Selection of the Informative Frequency Band in a Bearing Fault Diagnosis in the Presence of Non-Gaussian Noise—Comparison of Recently Developed Methods. Appl. Sci. 2020, 10, 2657. [Google Scholar] [CrossRef]
- Wodecki, J.; Kruczek, P.; Hebda-Sobkowicz, J.; Wylomanska, A.; Zimroz, R.; Gryllias, K. Informative frequency band identification method using bi-frequency map clustering for fault detection in rotating machines. Vibroeng. Procedia 2018, 19, 86–90. [Google Scholar] [CrossRef][Green Version]
- Molnar, V.; Fedorko, G.; Honus, S.; Andrejiova, M.; Grincova, A.; Michalik, P.; Palencar, J. Research in placement of measuring sensors on hexagonal idler housing with regard to requirements of pipe conveyor failure analysis. Eng. Fail. Anal. 2020, 116. [Google Scholar] [CrossRef]
- Szrek, J.; Wodecki, J.; Błazej, R.; Zimroz, R. An inspection robot for belt conveyor maintenance in underground mine-infrared thermography for overheated idlers detection. Appl. Sci. 2020, 10, 4984. [Google Scholar] [CrossRef]
- Liu, X.; Pei, D.; Lodewijks, G.; Zhao, Z.; Mei, J. Acoustic signal based fault detection on belt conveyor idlers using machine learning. Adv. Powder Technol. 2020, 31, 2689–2698. [Google Scholar] [CrossRef]
- Stehlikova, B.; Molnar, V.; Fedorko, G.; Michalik, P.; Paulikova, A. Research about influence of the tension forces, asymmetrical tensioning and filling rate of pipe conveyor belt filled with the material on the contact forces of idler rolls in hexagonal idler housing. Meas. J. Int. Meas. Confed. 2020, 156. [Google Scholar] [CrossRef]
- Liu, X.; Pang, Y.; Lodewijks, G.; He, D. Experimental research on condition monitoring of belt conveyor idlers. Measurement 2018, 127, 277–282. [Google Scholar] [CrossRef]
- Król, R.; Kisielewski, W. Research of loading carrying idlers used in belt conveyor—Practical applications. Diagnostyka 2014, 15, 67–73. [Google Scholar]
- Król, R.; Kisielewski, W. The influence of idlers on energy consumption of belt conveyor. Min. Sci. 2014, 21, 61–72. [Google Scholar]
- Zimroz, R.; Hutter, M.; Mistry, M.; Stefaniak, P.; Walas, K.; Wodecki, J. Why Should Inspection Robots be used in Deep Underground Mines? In Proceedings of the 27th International Symposium on Mine Planning and Equipment Selection-MPES 2018; Widzyk-Capehart, E., Hekmat, A., Singhal, R., Eds.; Springer International Publishing: Cham, Switzerland, 2019; pp. 497–507. [Google Scholar]
- Wang, Z.; Gu, Y.; Wang, Y. A review of three magnetic NDT technologies. J. Magn. Magn. Mater. 2012, 324, 382–388. [Google Scholar] [CrossRef]
- Le, M.; Jun, J.; Kim, J.; Lee, J. Nondestructive testing of train wheels using differential-type integrated Hall sensor matrixes embedded in train rails. NDT E Int. 2013, 55, 28–35. [Google Scholar] [CrossRef]
- Jarvis, R.; Cawley, P.; Nagy, P. Current deflection NDE for the inspection and monitoring of pipes. NDT E Int. 2016, 81, 46–59. [Google Scholar] [CrossRef]
- Yan, X.; Zhang, D.; Pan, S.; Zhang, E.; Gao, W. Online nondestructive testing for fine steel wire rope in electromagnetic interference environment. NDT E Int. 2017, 92, 75–81. [Google Scholar] [CrossRef]
- Ma, H.W.; Fan, H.W.; Mao, Q.H.; Zhang, X.H.; Xing, W. Noise reduction of steel cord conveyor belt defect electromagnetic signal by combined use of improved wavelet and EMD. Algorithms 2016, 9, 62. [Google Scholar] [CrossRef]
- Błażej, R.; Jurdziak, L.; Hardygóra, M.; Zimroz, R.; Bujak, C.; Salata, R.; Domański, A.; Kurp, Ł. Diagnostics of steel cord conveyor belts–HRDS system and its application. Min. Sci 2014, 21, 15–24. [Google Scholar]
- Blazej, R.; Jurdziak, L.; Zimroz, R. Novel approaches for processing of multi-channels NDT signals for damage detection in conveyor belts with steel cords. In Key Engineering Materials; Trans Tech Publications Ltd.: Bäch SZ, Switzerland, 2013; Volume 569, pp. 978–985. [Google Scholar]
- Darwin, C. On the Origin of Species by Means of Natural Selection; Culture et Civilisation: London, UK, 1969. [Google Scholar]
- Bagley, J.D. The Behavior of Adaptive Systems Which Employ Genetic and Correlation Algorithms. Ph.D. Thesis, University of Michigan, Ann Arbor, MI, USA, 1967. [Google Scholar]
- Holland, J.H. Induction: Processes of Inference, Learning, and Discovery; MIT Press: Cambridge, MA, USA, 1989. [Google Scholar]
- Holland, J.H. Adaptation in Natural and Artificial Systems: An Introductory Analysis with Applications to Biology, Control, and Artificial Intelligence; MIT Press: Cambridge, MA, USA, 1992. [Google Scholar]
© 2020 by the authors. Licensee MDPI, Basel, Switzerland. This article is an open access article distributed under the terms and conditions of the Creative Commons Attribution (CC BY) license (http://creativecommons.org/licenses/by/4.0/).