Article

2-LED-µSpectrophotometer for Rapid On-Site Detection of Pathogens Using Noble-Metal Nanoparticle-Based Colorimetric Assays

Leibniz Institute of Photonic Technology (Leibniz IPHT) Jena, Member of the Leibniz Research Alliance, Leibniz Health Technologies, Albert-Einstein-Straße 9, 07745 Jena, Germany
*
Author to whom correspondence should be addressed.
Appl. Sci. 2020, 10(8), 2658; https://doi.org/10.3390/app10082658
Submission received: 12 March 2020 / Revised: 2 April 2020 / Accepted: 8 April 2020 / Published: 12 April 2020
(This article belongs to the Special Issue Nanoparticles in Sensing and Labelling)

Abstract

:
Novel point-of-care compatible methods such as colorimetric assays have become increasingly important in the field of early pathogen detection. A simple and hand-held prototype device for carrying out DNA-amplification assay based on plasmonic nanoparticles in the colorimetric detection is presented. The low-cost device with two channels (sample and reference) consists of two spectrally different light emitting diodes (LEDs) for detection of the plasmon shift. The color change of the gold-nanoparticle-DNA conjugates caused by a salt-induced aggregation test is examined in particular. A specific and sensitive detection of the waterborne human pathogen Legionella pneumophila is demonstrated. This colorimetric assay, with a simple assay design and simple readout device requirements, can be monitored in real-time on-site.

Graphical Abstract

1. Introduction

In the field of pathogen diagnostics, innovative point-of-care compatible methods such as colorimetry have become increasingly important in recent years. Precious noble-metal nanoparticles with distinct optical properties, induced by the localized surface plasmon resonance (LSPR), are of growing interest for diagnostics. This optical effect is based on the oscillation of the conduction electrons in the nanoscale noble-metal particles. The intensity and position of their LSPR band are strongly dependent on the shape, size, material, dielectric environment, and the distance between the colloidal nanoparticles [1]. In case of plasmonic nanoparticles, the extinction coefficient and the absorption cross section are several orders of magnitude higher compared with common dyes [2]. Therefore, colorimetric assays using plasmonic particles have an outstanding detection capability [3]. The absorption spectrum of plasmonic nanoparticles is usually in the visible range [4], which enables simple optical detection for the detection of various analytes. Colorimetric assays [5,6] are based on an effect caused by a changing distance between the particles; the resonance coupling on neighboring nanoparticles results in their spectral shift. The nanoparticle solution color can change owing to salt-induced coalescence and the resulting coupling of the resonances. Colorimetric assays can be realized in different ways [7,8].
On the one hand, particle could be linked by specific binding of attached (bio-) molecules to bridging target molecules. This so-called interparticle cross-linking is usually reversible, both for antigen–antibody and DNA–DNA interactions [9]. On the other hand, non-crosslinking aggregation describes a controlled gold nanoparticles (AuNPs) interaction using the ability of noble-metal nanoparticles to interact without actual bond formation [10]. Other studies investigate anti-aggregation or de-aggregation assays [11].
To perform colorimetric assays, the colloidal noble-metal nanoparticles have to exhibit a specific binding capability [12]. For the detection of proteins, for example, in immunoassays, antibodies are usually used as receptors [13]. Enzyme activity can be detected using peptides [14]. Further, the in situ formation of protein corona can be detected using nanoparticles optical signal [15]. Carbohydrate functionalized nanoparticles allow the detection of toxins such as cholera toxin (CTB), which binds to the lactose derivative on particles and induces their aggregation [16]. Gold nanoparticles-based colorimetric aptasensors are currently used for a wide variety of analytes [17,18]. Further studies focus on the nanoparticle-based detection of metal ions [19,20]. DNA-oligonucleotides can be used as recognition elements for the specific detection of pathogen DNA. The DNA to be examined hybridizes with single-stranded oligonucleotides on the particles. Several rapid assays based on the amplification of nucleic acids have previously been presented to detect both environmental and clinical samples, but these assays are expensive, more complex, or of lower sensitivity, and often require sophisticated instrumentation [21,22]. Different approaches with DNA-functionalized gold nanoparticles have been published, such as the detection of white spot syndrome virus in combination with loop-mediated isothermal amplification (LAMP) [23], the detection of viral DNA with mono- and bifunctional gold nanoparticles conjugated oligonucleotide probes [24], the use of a single Au-nanoprobe for detection of two distinct targets (pathogens), and one-step detection [25].
In principle, the sensor response can be qualitatively read out with the naked eye. However, for quantification or higher sensitivity, a quantification instrument is needed. UV/vis photometry is widely used for measuring a variety of sample properties, typically the concentration of an analyte in a liquid sample. In general, the optical signal of colorimetric assays can be read out quantitatively well with a benchtop spectrometer, but the necessity for on-site analysis of biological contamination is increasing. Over the last decade, a number of spectroscopic detection devices have been developed that allow optical on-site detection for colorimetric assays. These on-site spectrometers usually include a single or a few light emitting diodes (LEDs) as a light source and a phototransistor or light-dependent resistor (LDR) as a spectral detector. An early low-cost transportable spectrometer was realized with four different color LEDs [26]. This photometer is a pseudo-dual-beam instrument and is similar to benchtop spectrometers, but with a much lower spectral resolution. The application of an LED array, composed of more LEDs, for spectrometer construction is also widespread [27]. Within an array of eight LEDs, a simple method for discrimination of mineral waters in a flow-cell is possible. Another portable diode array spectrophotometer, requiring only two AAA-batteries for 200 h measurement by their low-power consumption, was presented [28]. However, this system lacks a reference channel. Other approaches use moveable optics to scan through the spectral range [29]. However, the use of mechanical parts increases the complexity of the system. This leads to low light throughput and slow scanning compared with benchtop devices. An interesting development represents the open source movement for free access to soft- and hardware technology, as demonstrated with an open source photometric system for enzymatic nitrate quantification with color generation over enzymatic reduction [30]. This simple detector was developed for low cost application and yields the potential to create a large network of users that will eventually improve future system optimization to reach the largest possible audience.
Especially for colorimetric assays based on plasmonic nanoparticles, transportable spectrometers have been proposed. One example represents the detection of lead and aluminum ions in water by means of a narrow-band LED array with an custom-made microwell plate [31]. Another example represents a devices that monitors the wavelength-ratiometric resonance Rayleigh scattering signal of the chemical sensor upon white-LED illumination [32]. Other groups developed modules that are based on digital image colorimetry (via smartphone) [33] or make use of a diffraction grating and image processing to measure the particle size and concentration [34], or use a tungsten-filament lamp with optical fibers and a commercial portable spectrometer [35].
Multichannel spectrophotometers, particularly those based on diode arrays and custom-made detection cells [36], present many advantages, such as spectrum acquisition in a very short interval of time, good resolution and accuracy in wavelength measurements, and adequate sensitivity and dynamic range for many applications. In spite of these advantages, the measurements of absorbance intensity continuously through all wavelengths in a given range may be not necessary. A variable selection is useful to reduce noise and to minimize redundancies. Moreover, an LED-based photometer can be realized at minimal costs, and has low power consumption, permitting the construction of miniaturized instruments for field measurements.
In this paper, the development of a simple, hand-held, and low-cost device for carrying out colorimetric detection based on plasmonic nanoparticles and a DNA-amplification (LAMP) assay is presented, utilizing the high amplification efficiency of the LAMP method (quantity of synthesizes DNA: >10 µg 25 µL−1) [37,38]. The device with a 3D-printed central part and dual channel (sample and reference) includes two spectrally different LEDs for the detection of the plasmon shift (color change). The LEDs are easily adaptable according to the intended colorimetric assay. The design thus brings together three innovative features—firstly, the beam splitter, which allows self-referencing regarding the introduced light; secondly, the adjustable LED current (1 mA–20 mA); and thirdly, the adjustable amplification. A specific and sensitive detection of the waterborne human pathogen Legionella pneumophila is demonstrated, which to our knowledge is the first approach using colorimetric LAMP for Legionella pneumophila. There has been work on colorimetric assays utilizing DNA-AuNP probe (one-step) [39], but without amplification and with higher detection limits. This assay, with a simple assay design and simple readout device requirements, can be monitored in real-time on-site and allows thereby rapid testing for different analytes.

2. Materials and Methods

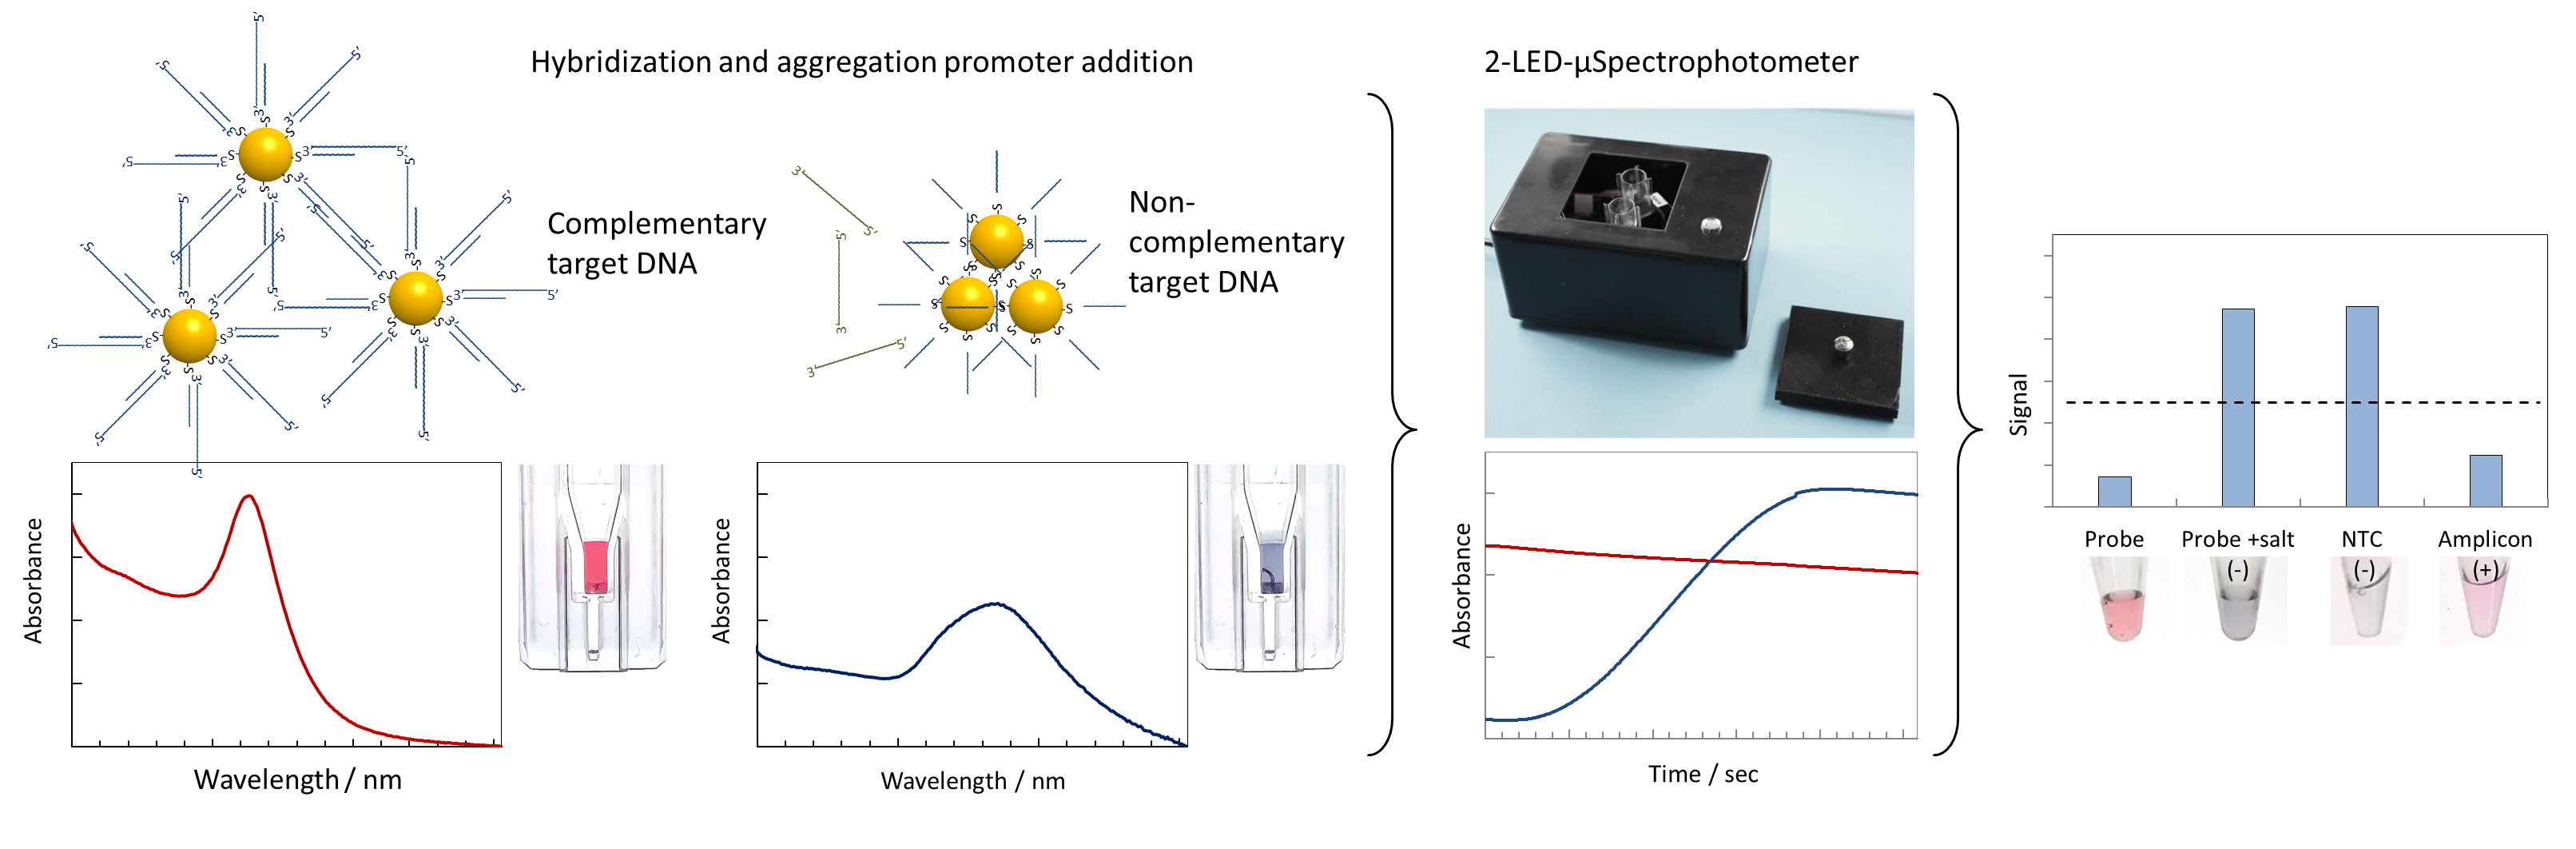
2.1. 2-LED-µSpectrophotometer Set-Up

The whole instrument is located in an enclosure with a lid (Figure 1a), allowing easy access to the cuvettes. During measurements, the lid was closed to avoid ambient light inside. The central element was developed and optimized for production on consumer-level 3D printers with polylactic acid (PLA, Ultimaker B.V., Utrecht, The Netherlands) filaments (Figure 1c). It enables the mounting of two disposable UV/vis micro cuvettes (sample and blank) (Carl Roth GmbH + Co. KG, Karlsruhe, Germany). Below this central unit, there is a base plate with a mounted two-layer printed circuit board (PCB), which contains the microcontroller, a USB interface, the LED control, and a 16-bit analog-to-digital converter (Figure 1b). This system is equipped with two replaceable LEDs, each for illumination of both cuvettes, respectively, via a beam splitter. Two standard 5 mm LEDs of the desired wavelength were utilized. For the detection, two smaller PCBs with a photodiode (TEMD5080X1) and a self-developed low-noise, each a highly sensitive two-stage-programmable amplifier (IC AD8228, Analog Devices Inc., Norwood, MA, US), are located behind the cuvettes (Figure 1d). The software for device control is implemented in the popular and widely applied open programming platform Java.
After optimizing the operating conditions, the effectiveness of the developed system for determining the color change/absorption over time as a function of DNA specificity was evaluated. Conventional spectrophotometers used in comparative study were Jasco UV/vis benchtop spectrometer V-670 (JASCO Deutschland GmbH, Pfungstadt, Germany) and NanoDrop™One (Thermo Fisher Scientific Inc., Schwerte, Germany).

2.2. Chemicals, Reagents, and Samples

All the chemicals and reagents used in experiments were of analytical grade.

2.2.1. Synthesis of AuNPs

The spherical gold nanoparticles (AuNPs) were prepared according to Bastus et al. [40]. Briefly, gold spheres (~10 nm, ~ 3*1012 NP mL−1) were prepared by adding 1 mL HAuCl4 (25 mM) into 150 mL sodium citrate 2.2 mM at 100 °C. After the addition, another 10 min was waited. The as-prepared AuNP solution was cooled down to room temperature (RT) and stored at 4 °C for further experiments. The so-synthesized AuNPs had a diameter of 13.4 ± 1.8 nm, an extinction maximum at 520 nm, and a concentration of 5.8 nM, as revealed by transmission electron microscopy (TEM) and UV/vis spectroscopy, respectively (Figure S1).

2.2.2. Bacterial Strains and Legionella Isolates

L. pneumophila ATCC 33152 was used as a positive control in this study. Other bacterial strains were used to investigate the specificity of the DNA-AuNP probe assay [41]. Total genomic bacterial DNA was isolated with the innuPREP DNA Micro Kit (Analytik Jena AG, Jena, Germany). A two-day culture on GVPC medium (Fisher Scientific GmbH, Schwerte, Germany) at 37 °C was harvested by centrifugation for 5 min at 16,000 g. The total DNA was eluted in 50 μL elution buffer and stored at −20 °C.

2.2.3. Preparation of AuNPs Probes

The preparation of the AuNPs probes was done according to the pH-assisted conjugation method [42], with slightly modifications. For the loading of the thiol-modified oligonucleotides (Table S1) on gold nanoparticles, 200 μL gold nanoparticles (5.8 nM), 13 μL of Tris-(2-carboxyethyl)-phosphin (TCEP)-pre-treated 50 mM 5’-thiol-modified oligonucleotides (biomers.de, Ulm, Germany), and 87 μL DEPC-H2O (Carl Roth GMBH + CO. KG, Karlsruhe, Germany) were combined in a reaction vessel and incubated for 30 min at 300 rpm in a shaker (Eppendorf Thermomixer compact, Sigma-Aldrich Chemie GmbH, Steinheim, Germany). Subsequently, 6 μL citrate buffer (pH 3, 0.5 M) was added and incubated for further 30 min at 300 rpm. Finally, 41.7 μL of 5 M NaCl (Sigma-Aldrich Chemie GmbH, Taufkirchen, Germany) was added and incubated for 60 min at 300 rpm. The conjugated gold nanoparticles were purified with a centrifuge filter (Amicon, 0.5 mL, Ultra, Merck Millipore, Burlington, MA, US), and all reactions were carried out at room temperature (RT). As-prepared DNA-AuNP probes were stored in the dark at 4 °C until use.

2.2.4. LAMP Assay Design and Evaluation

A 20 μL LAMP reaction was prepared using 1.0 × Bst buffer and 0.2 U μL−1 Bst 2.0 polymerase (New England Biolabs GmbH, Frankfurt am Main, Germany); 5.0 mM magnesium sulfate (MgSO4, Sigma-Aldrich Chemie GmbH, Taufkirchen, Germany); 0.8 M betaine (Sigma-Aldrich Chemie GmbH, Taufkirchen, Germany); 1.0 × EvaGreen® (Biotium, Inc., Fremont, CA, USA); 1.4 mM dNTPs (Genaxxon, Ulm, Germany), GmbH, Taufkirchen, Germany); and 1.0 μM of forward inner primer (FIP) and backward inner primer (BIP), 0.2 μM of primers F3 and B3, and 0.2 μM of loop primers (LF and LB), respectively (biomers.net, Ulm, Germany). Primer sequences are listed in Table S2 targeting the lepB or dotA gene of Legionella spp. A volume of 1.0 μL DNA was added in different concentrations and filled up to a total volume of 20 μL with DEPC-H2O (Carl Roth GMBH + CO. KG, Karlsruhe, Germany). The negative template control (NTC) contained 1.0 μL DEPC-H2O instead of DNA. The amplification mixtures were incubated at 63 °C for 60 min. Subsequent evaluation of the DNA amplicons was done by agarose gel electrophoresis. For this purpose, we used 2% agarose gels (agarose GTQ, Carl Roth GmbH & Co. KG, Karlsruhe, Germany) under 100 V for 30 min. The gels were stained with 1 × GelRed™ (Biotium, Hayward, USA) and documented with a UV-transilluminator (Herolab GmbH Laborgeräte, Wiesloch, Germany).

2.2.5. Colorimetric Assay

For the detection of DNA samples, a 5 μL LAMP amplicon was mixed with 5 μL DNA-AuNP probe at the optimized condition. The colorimetric assays were performed in a final volume of 70 μL containing DNA-AuNP probes in DECP-H20. The mixture was heated up at 65 °C for 5 min and then cooled down to RT for 5 min. Then, 1 μL of magnesium chloride (MgCl2) or 1 µL of hydrochloric acid (HCl) at predetermined concentration was added, and the absorbance and color of the reaction mixture were recorded. After 15 min at RT for color development, the mixtures were measured with the 2-LED-µSpectrophotometer and in direct reference with UV/vis spectroscopy. The assay consisted of the spectrophotometric comparison of a DNA-AuNP probe without DNA, a negative control with DNA-AuNP probe with non-amplifiable DNA (NTC), and a DNA-AuNP probe with the DNA-LAMP amplicons (samples). The aggregation profiles were analyzed with respect to the ratio of two different absorbances (AbsLED1/AbsLED2 ratio) for each DNA-AuNP probe and time dependencies were evaluated. At least three independent assays were performed for each sample and a threshold value was determined for dispersed DNA-AuNP probes, as well as a second value that indicates aggregated DNA-AuNP probes.

3. Results

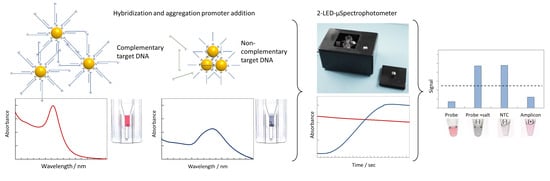
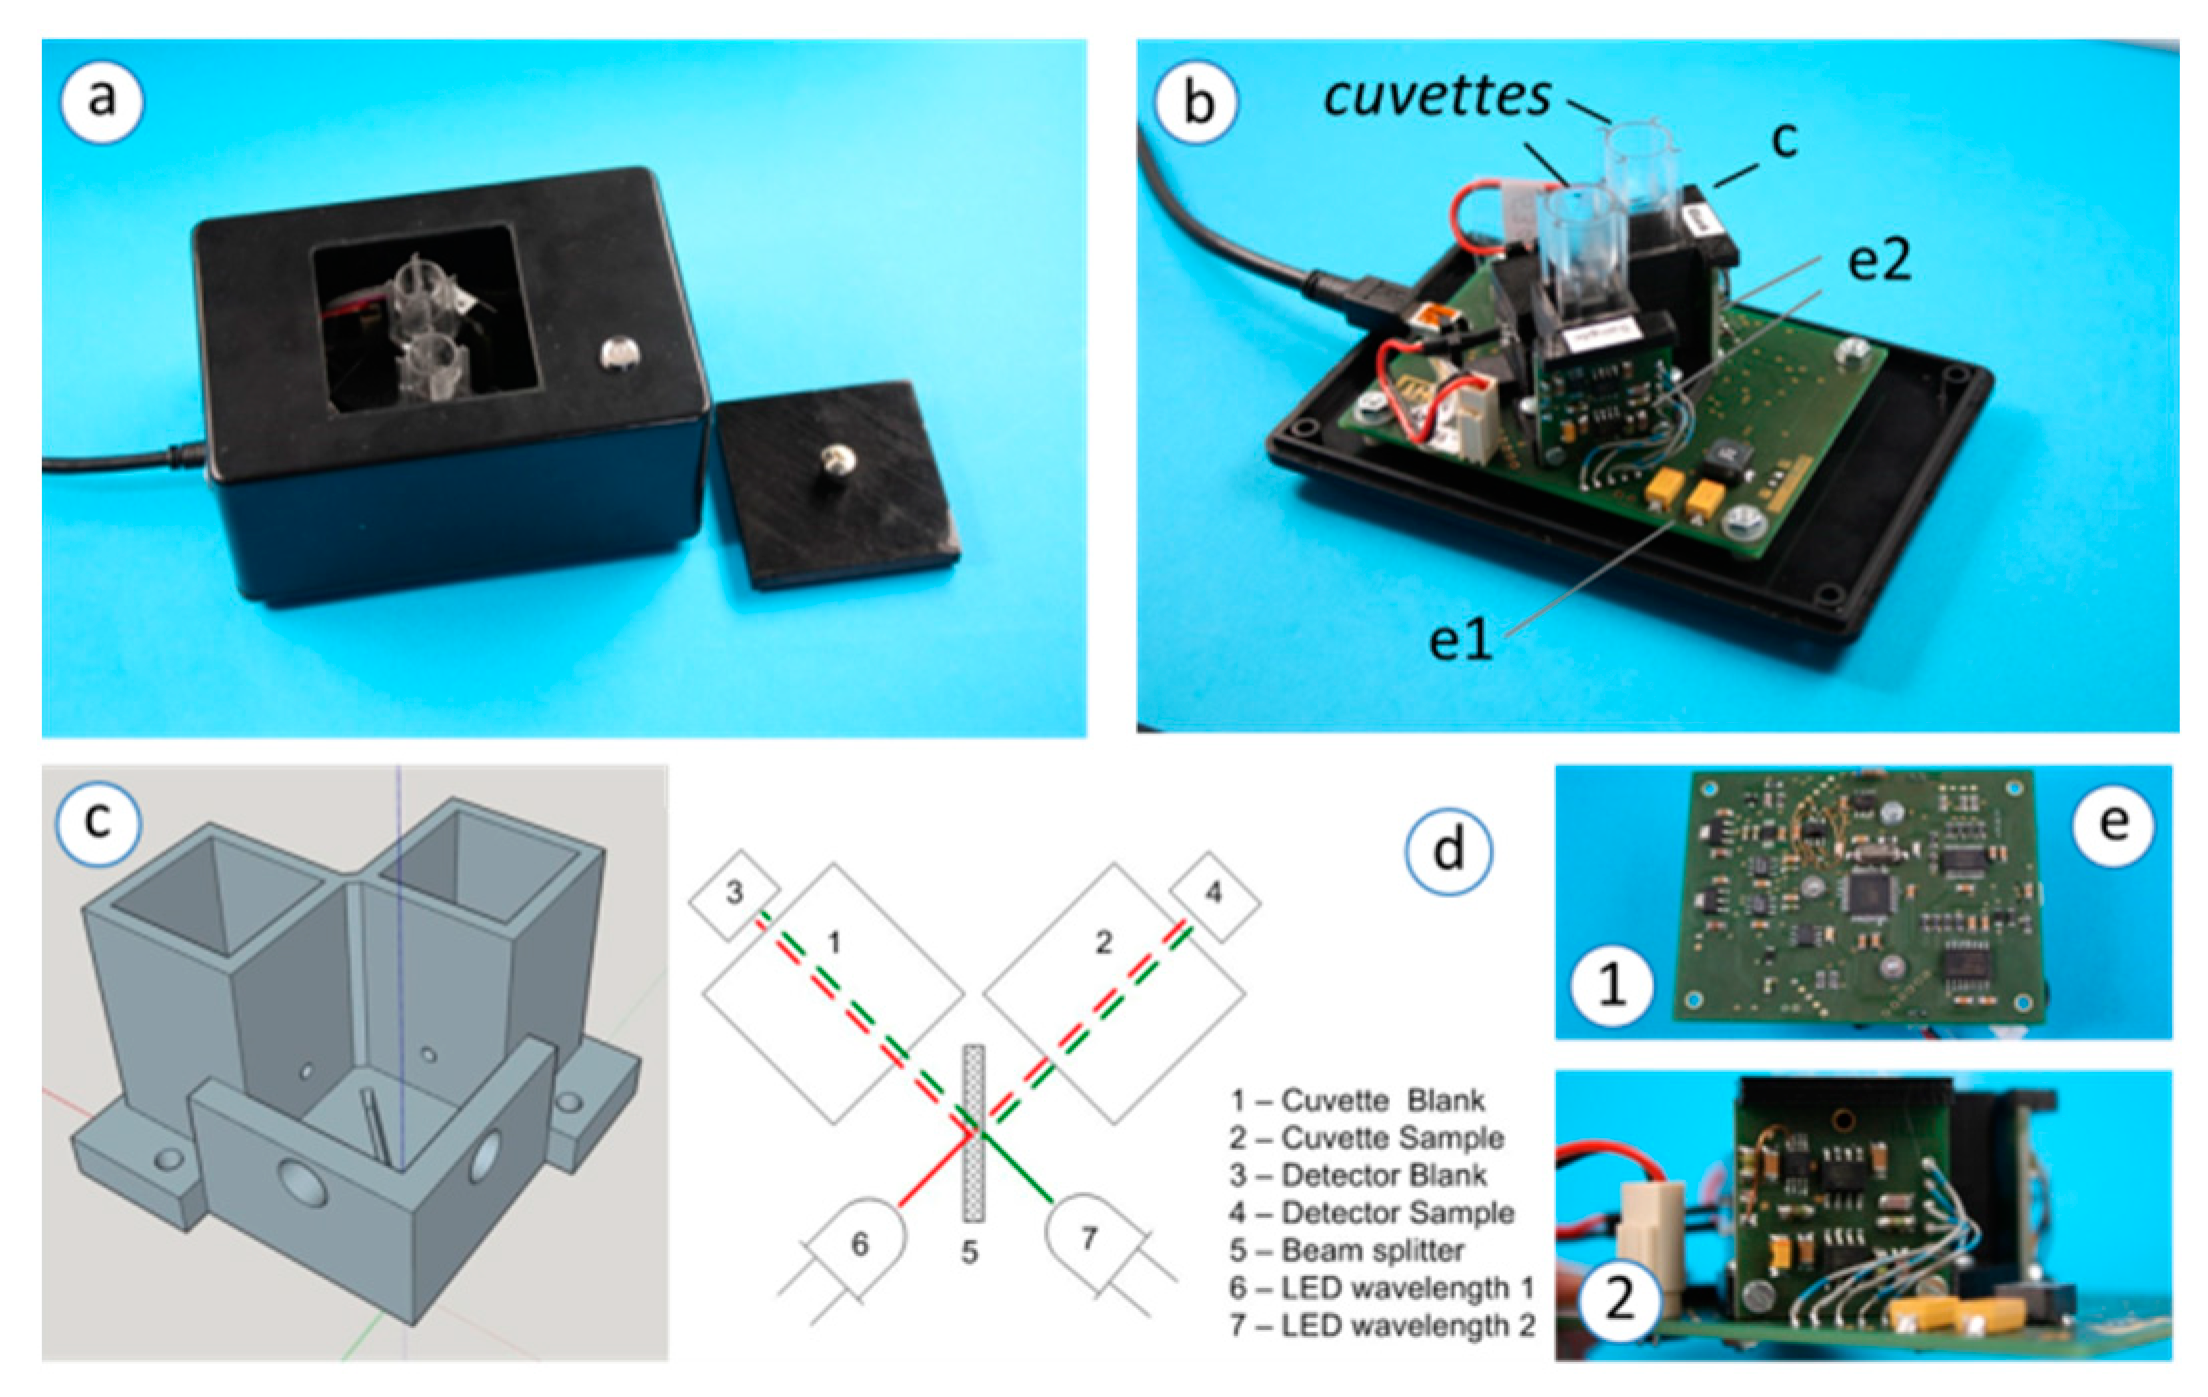
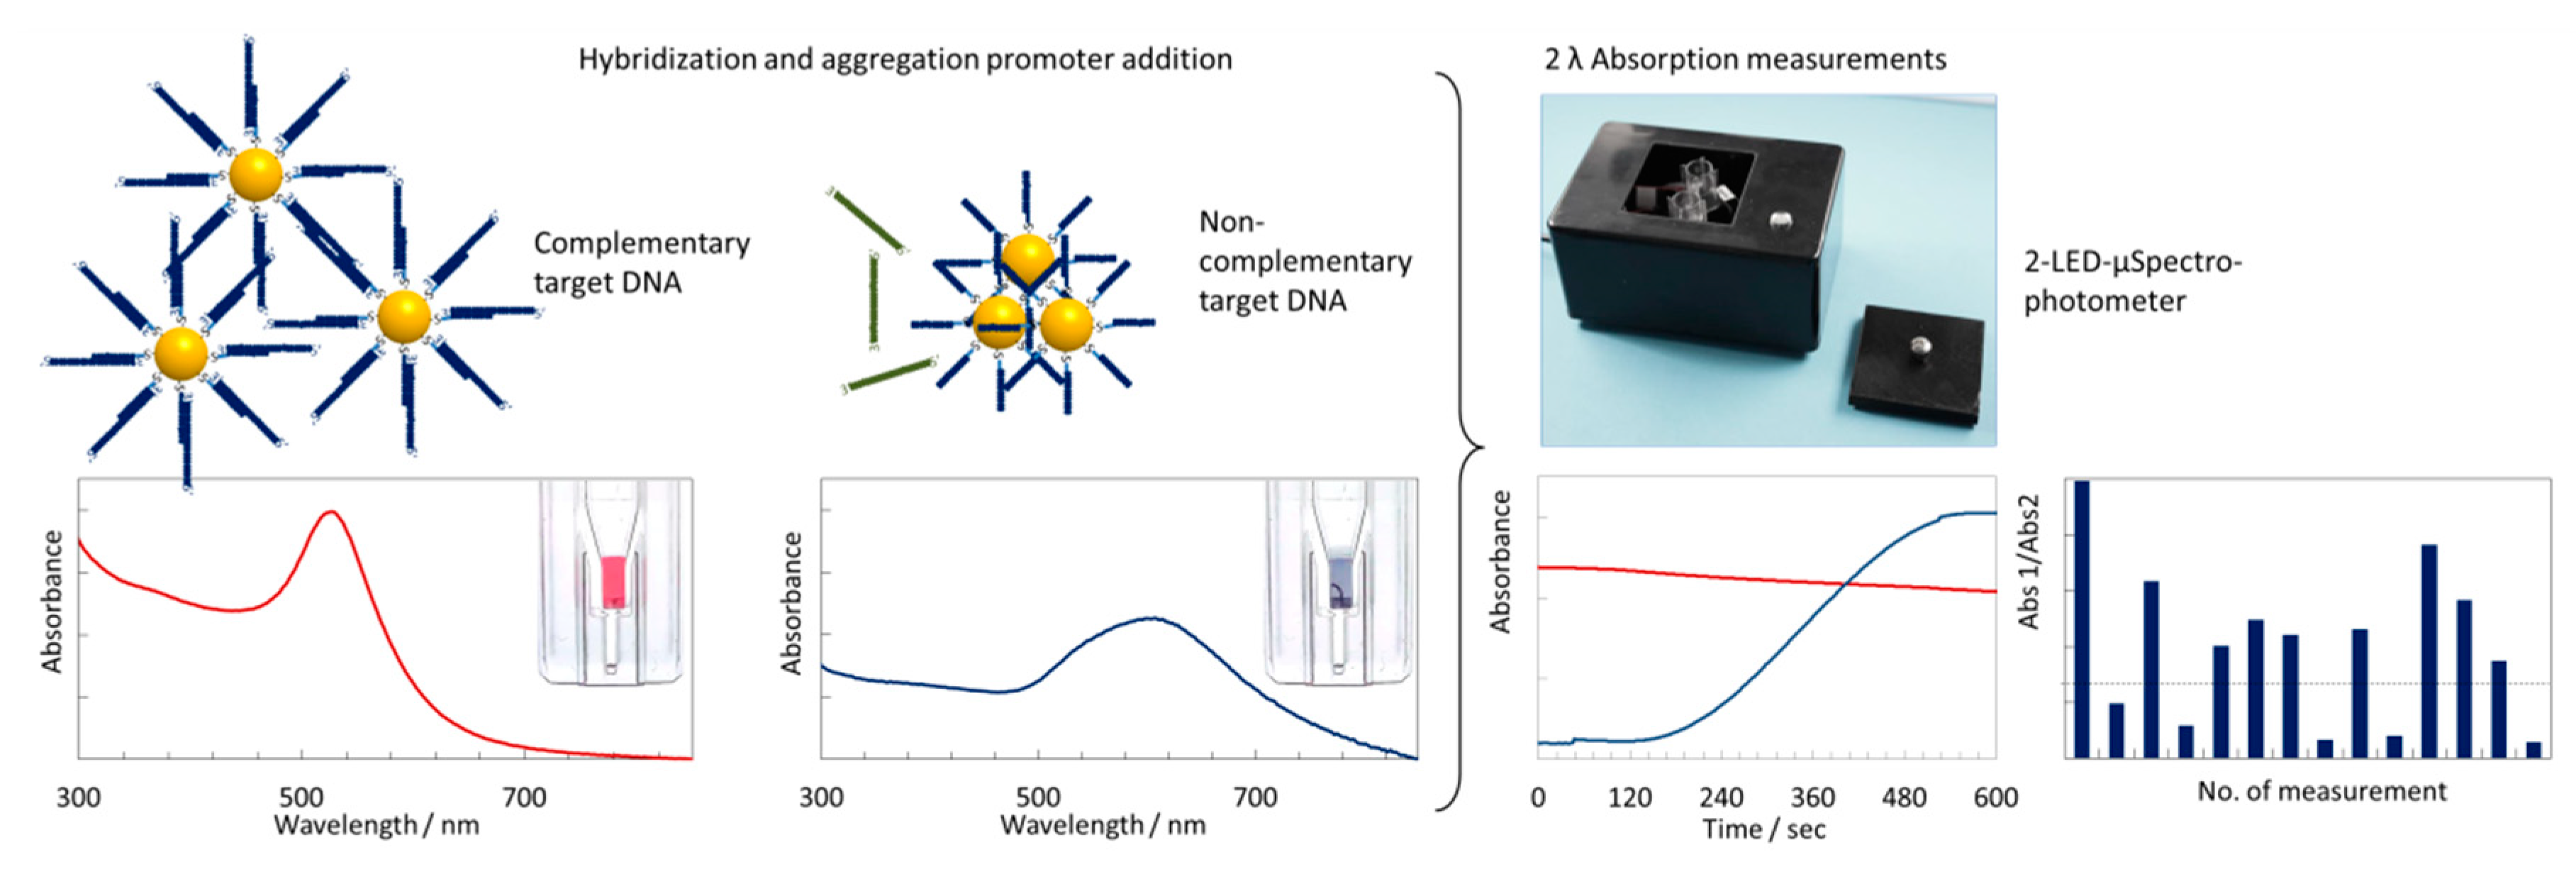
3.1. Principle of the Sensing Strategy

A schematic representation of the colorimetric DNA sensing method is depicted in Figure 2. To develop the assay, we selected a colorimetric sensing strategy based on the non-crosslinking aggregation model of AuNPs and oligonucleotide-functionalized AuNPs (DNA-AuNP probes) promoted by pH- and salt-induced aggregation. This assay is convenient and simple, as it works with any negatively charged noble-metal nanoparticles, especially with the as-prepared citrate-capped AuNPs, as well as functionalized AuNPs using thiol-modified oligonucleotides. Aggregation leads to a shift in the spectrum, and thus a color change of the solution as a result of interparticle plasmonic coupling. This is measured as localized surface plasmon resonance intensity at preselected wavelengths of 430 nm, 530 nm, 630 nm, and 690 nm. The aggregation profiles were analyzed in terms of different absorption ratios Abs630nm/Abs530nm ratio and the Abs690nm/Abs430nm ratio. The ratio increases in the case of aggregation and a corresponding change in color.

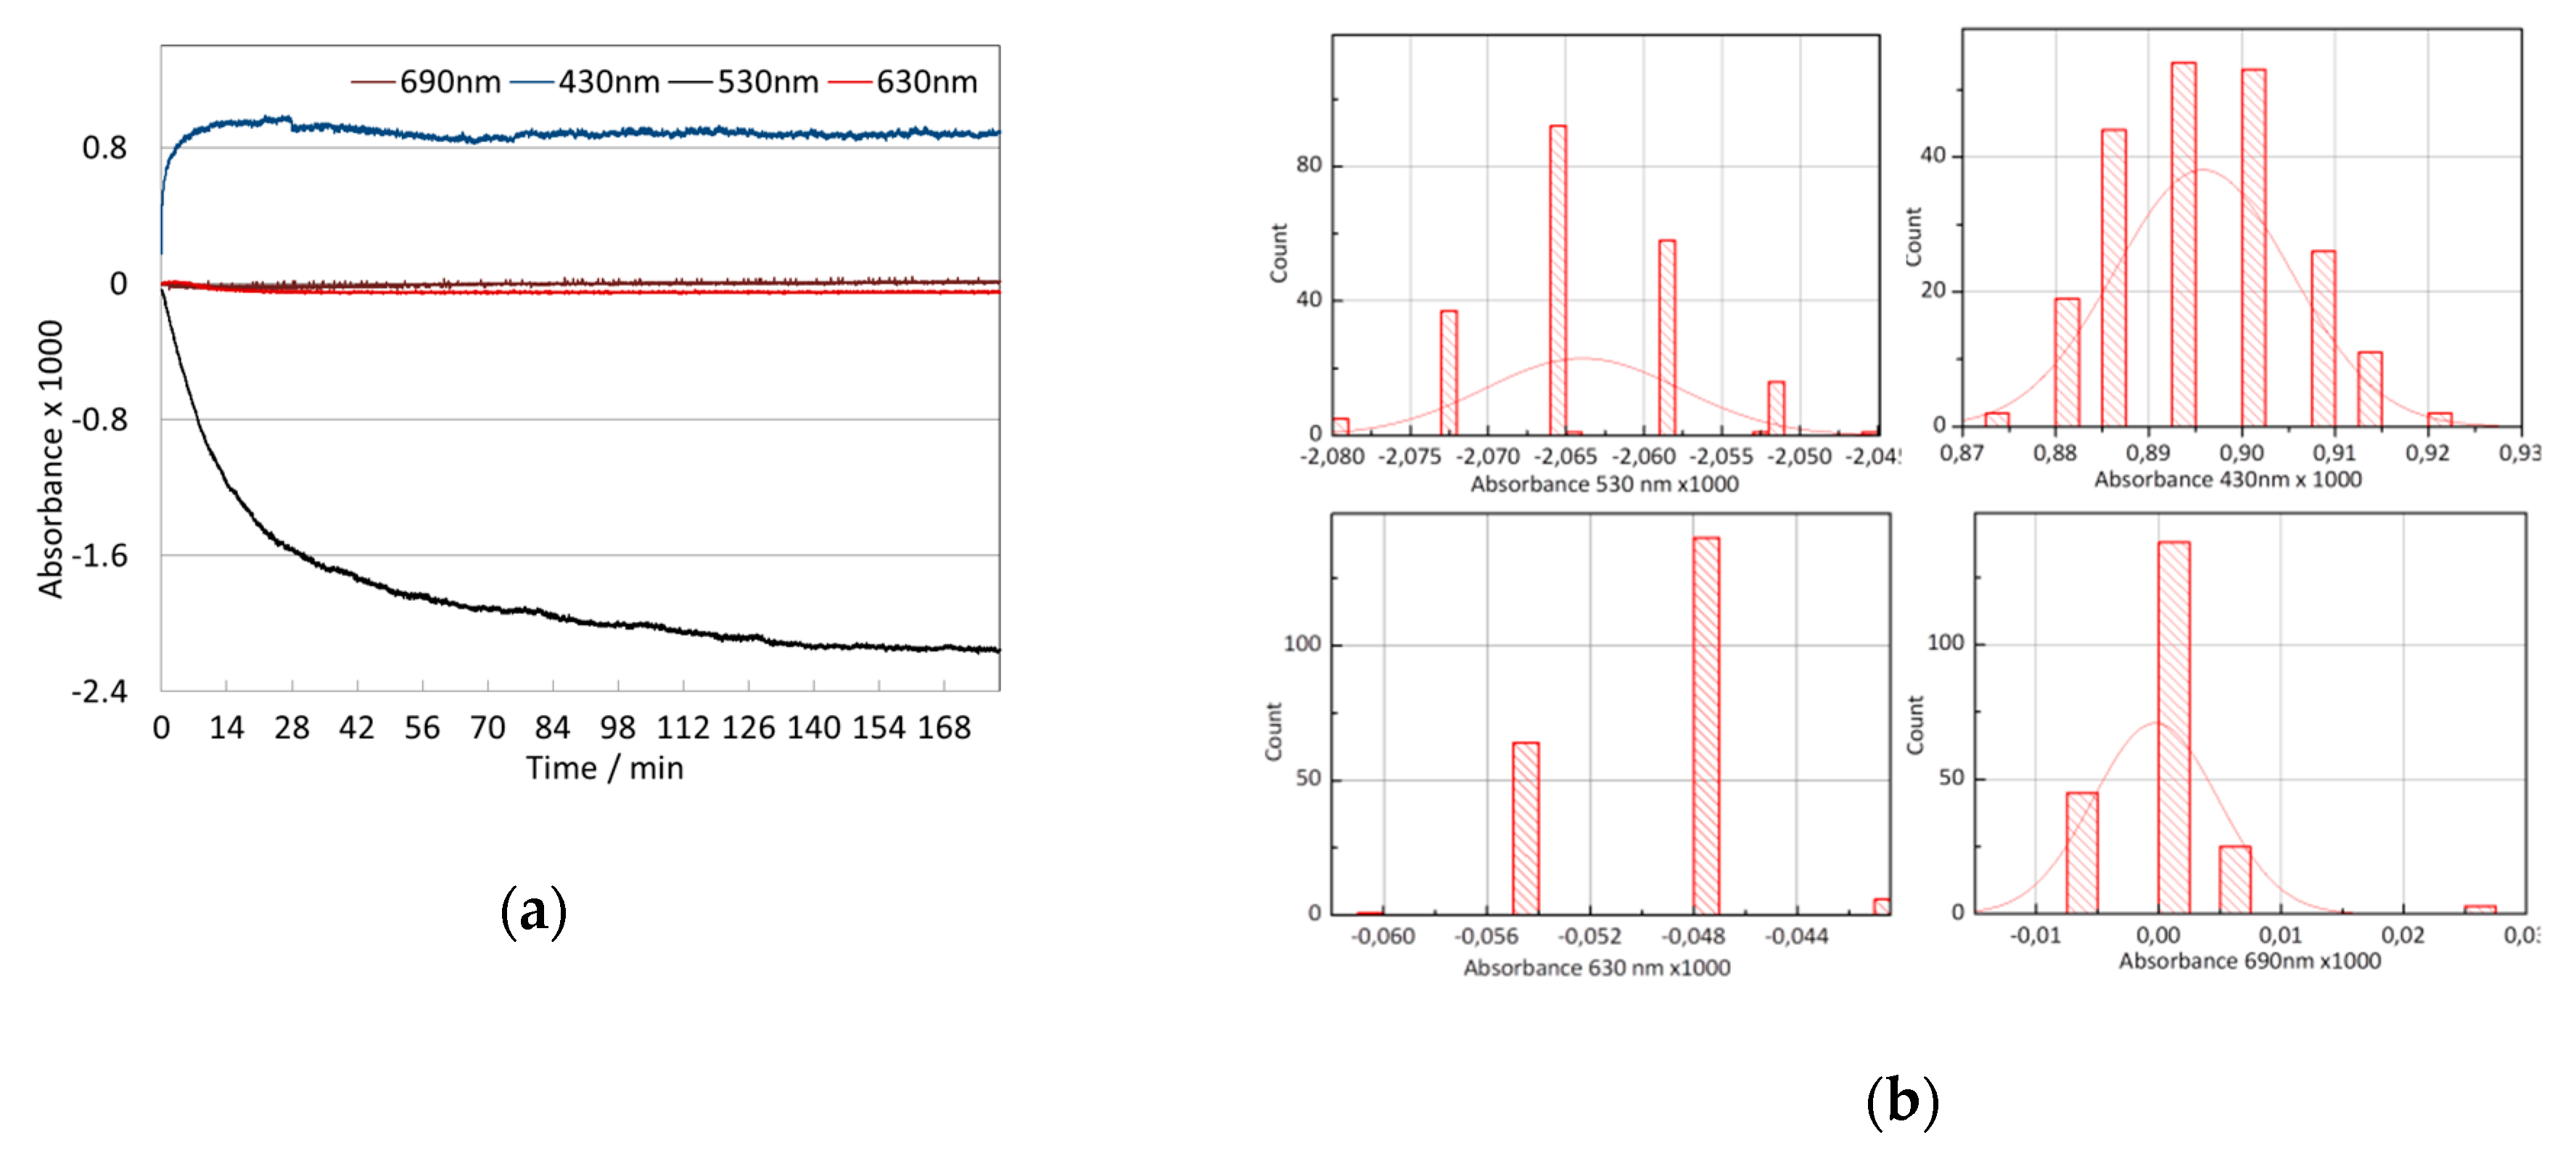
3.2. Signal Stability

The stability of the optical signal of the 2-LED-µSpectrophotometer was characterized by an hour scan of various LEDs (Figure 3). The signal drift was determined, and values of −1.0 × 10⁻⁷ (430 nm), −2.0 × 10⁻⁹ (530 nm), −4.0 × 10⁻⁹ (630 nm), and 3.0 × 10⁻⁹ (690 nm) were calculated. As visible in the histogram plots (Figure 3d) determining the short-term noise, signal variations of ±0.000027 and below were observed.
In order to test the suitability of the chosen approach of a 2-LED-µSpectrophotometer for monitoring the gold nanoparticle aggregation, an AuNP solution inside the cuvette of the spectrophotometer was subjected to aggregation by salt addition (Figure 4a), and continuously monitored using two LEDs of different wavelengths. The various wavelengths showed different behavior, in some spectral ranges (colors), the absorbance increased (such as in red), while in others (like blue), it decreased. This effect is the result of the localized surface plasmon resonance intensity and the plasmon peak shift to higher wavelengths upon salt addition. The behavior over time of an aggregation for the absorptions at separate wavelengths can also be observed. The example shows a gold nanoparticle solution and is comparable to the corresponding spectra measured by a benchtop spectrometer (Figure 4b). These measurements confirmed the ability of a 2-LED-µSpectrophotometer to monitor the reaction and other possible reactions at different wavelengths sufficiently.

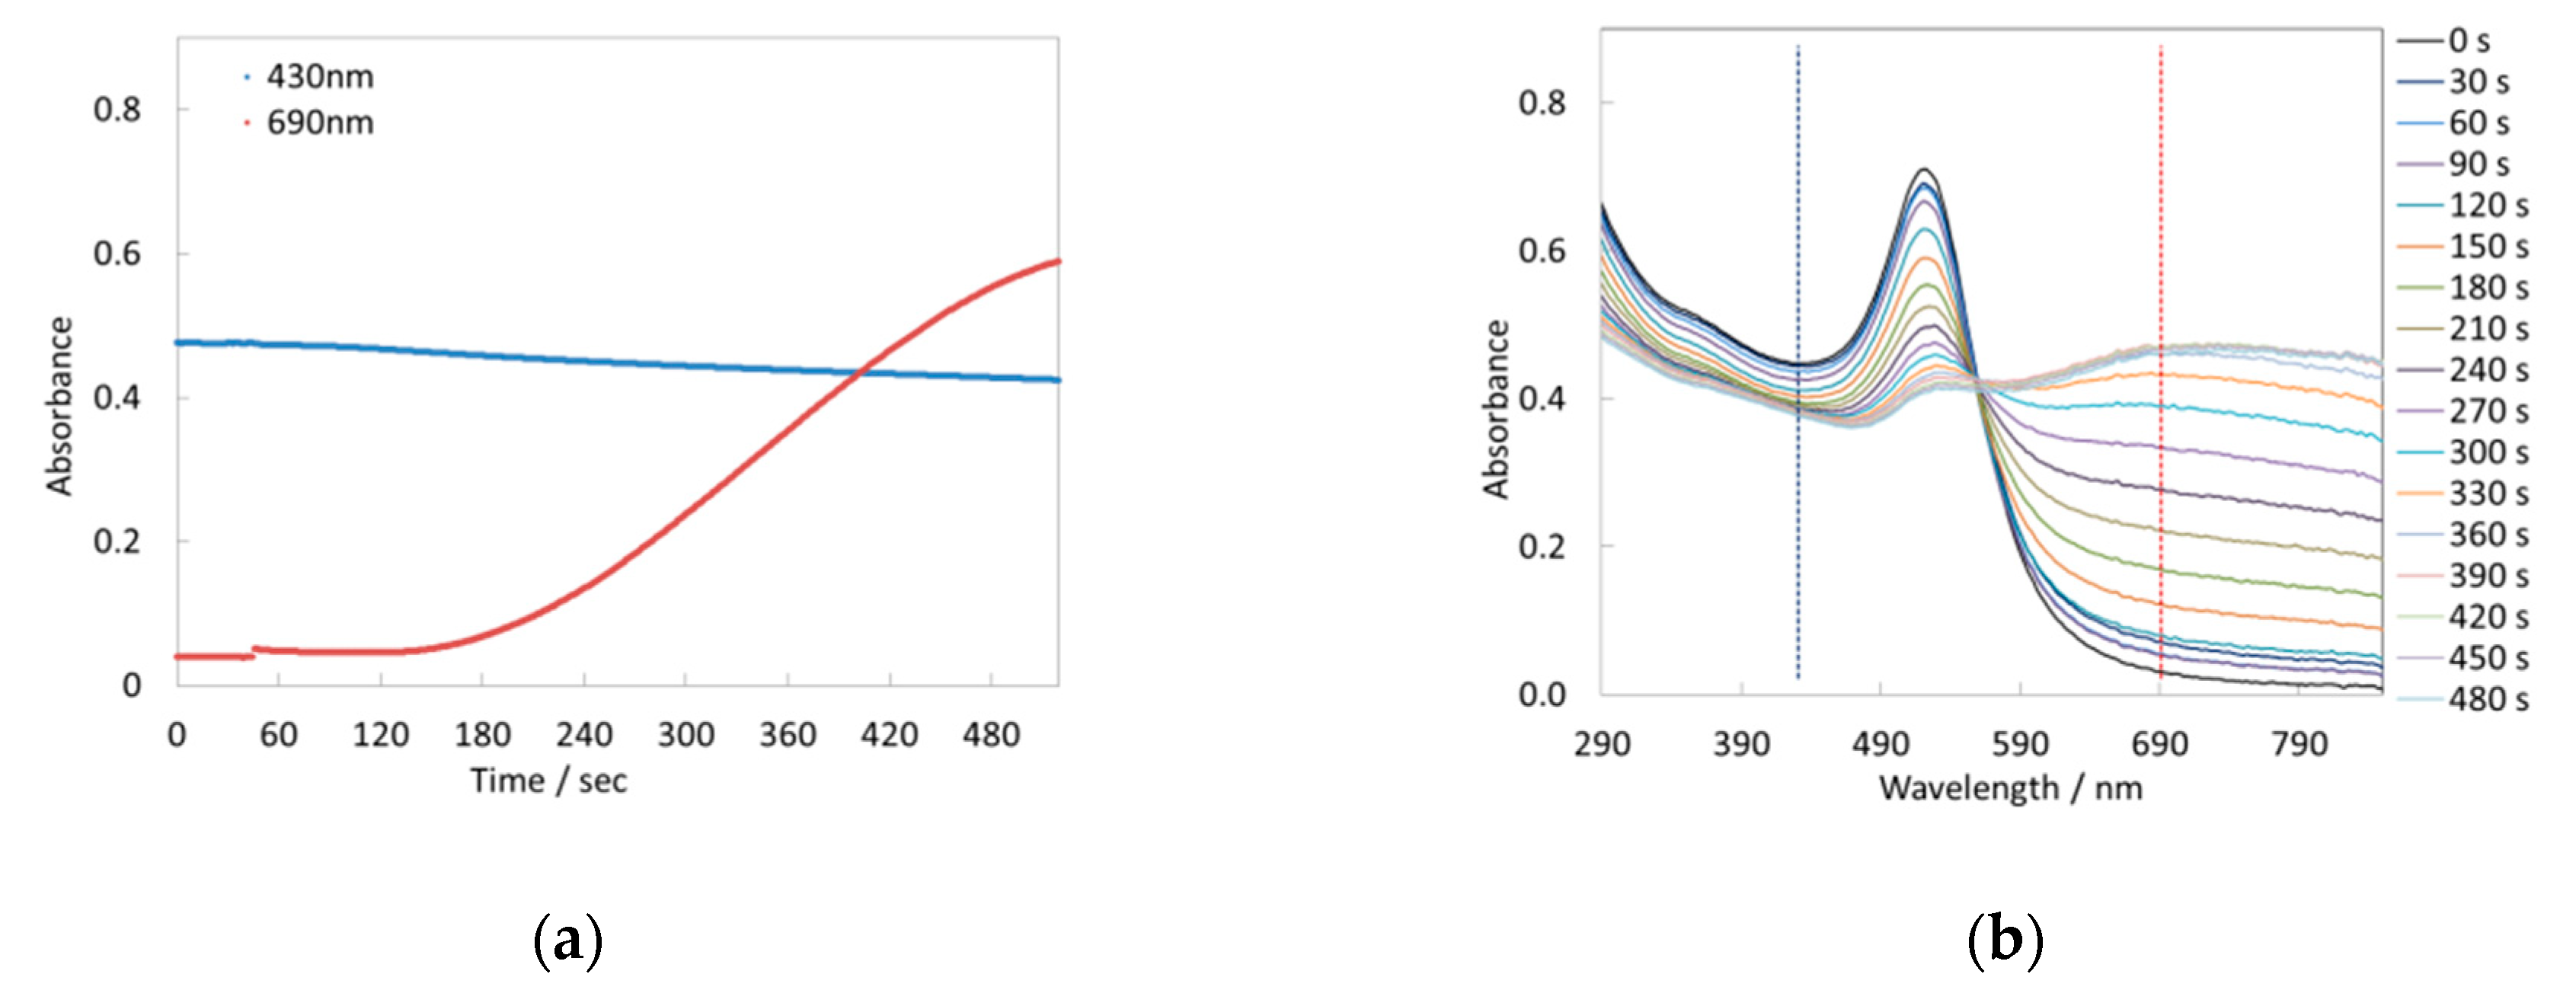
3.3. Wavelength Selection

To understand the kinetics of AuNP aggregation during assays, we quantified the changes in absorbance of the mixture of water sample and detection reagent at selected wavelengths using the portable system. LEDs used for the presented assay emit light at wavelengths of 430 nm, 530 nm, 630 nm, 660 nm, and 690 nm. The aggregation profiles were analyzed in terms of different absorption ratios Abs630nm/Abs530nm ratio and the Abs690nm/Abs430nm ratio for each DNA-AuNP probe. Owing to the characteristics of noble-metal nanoparticles and their spectra, it is important to choose the appropriate illumination wavelength. The used citrate capped AuNPs had a maximum at 520 nm. Nevertheless, the plasmonic peak varies slightly, depending on the surrounding media, size distribution, and functionalization of the noble-metal nanoparticles. The detection efficiency of our instrument does not differ much at 530 nm and 430 nm (Figure 5). To be useful for photometric sensing, the absorption intensity ratio must be independent of colloid concentrations. Our measurements show that a ratio for Abs690nm/Abs430nm is more useful than choosing a wavelength close to the resonance peak.

3.4. 2-LED µSpectrophotometer for Colorimetric Measurements

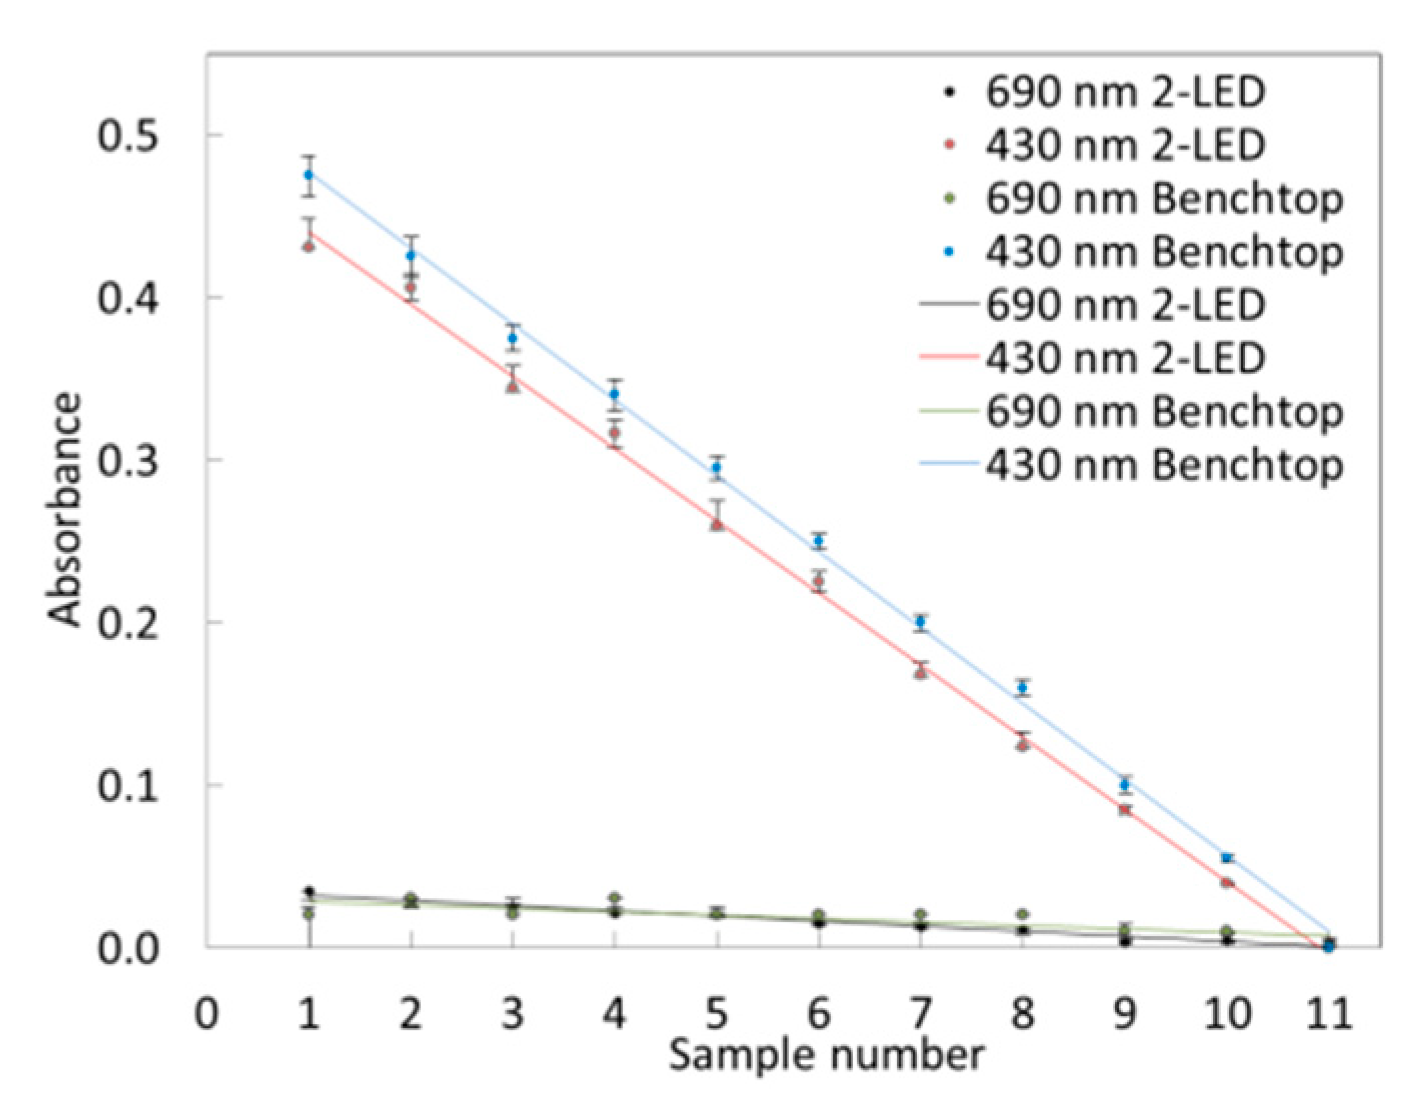
3.4.1. Limit of Detection

Figure 6 shows the absorbance for different AuNP concentrations. The absorbance intensities remain constant down to an optical density (OD) of 0.08, where background from the sample contributes to the signal. A study showed that absorption from the AuNP samples was detectable close to an optical density of 8 × 10⁻³.
The aggregation process was monitored by measuring the absorbance at 1 s intervals (430 nm and 690 nm). Figure 7 shows the signal for different AuNP solution concentrations obtained from the 2-LED-µSpectrophotometer. The aggregation is faster for lower concentrations of AuNPs for an OD of 0.07 (concentration of 20%), and the curve exceeds the threshold value of 1 after 3 min. When there are no external influences, the aggregation was finished on average after 15 min.

3.4.2. LAMP Assay

The success of DNA amplification was confirmed by the typical LAMP band pattern after gel electrophoresis (Figure 8). The colorimetric method uses LAMP amplicons derived from a set of different DNA amplifications targeting the dotA and the lepB gene from L. pneumophila of several serogroups (SG); the results are shown in Figure 8a,b. Additionally, a concentration row for the selected LAMP DNA amplification assay shown in Figure 8c reveals a limit of detection (LOD) of 0.5 pg µL−1 of initial target DNA from L. pneumophila SG 1 using the LepB primerset.

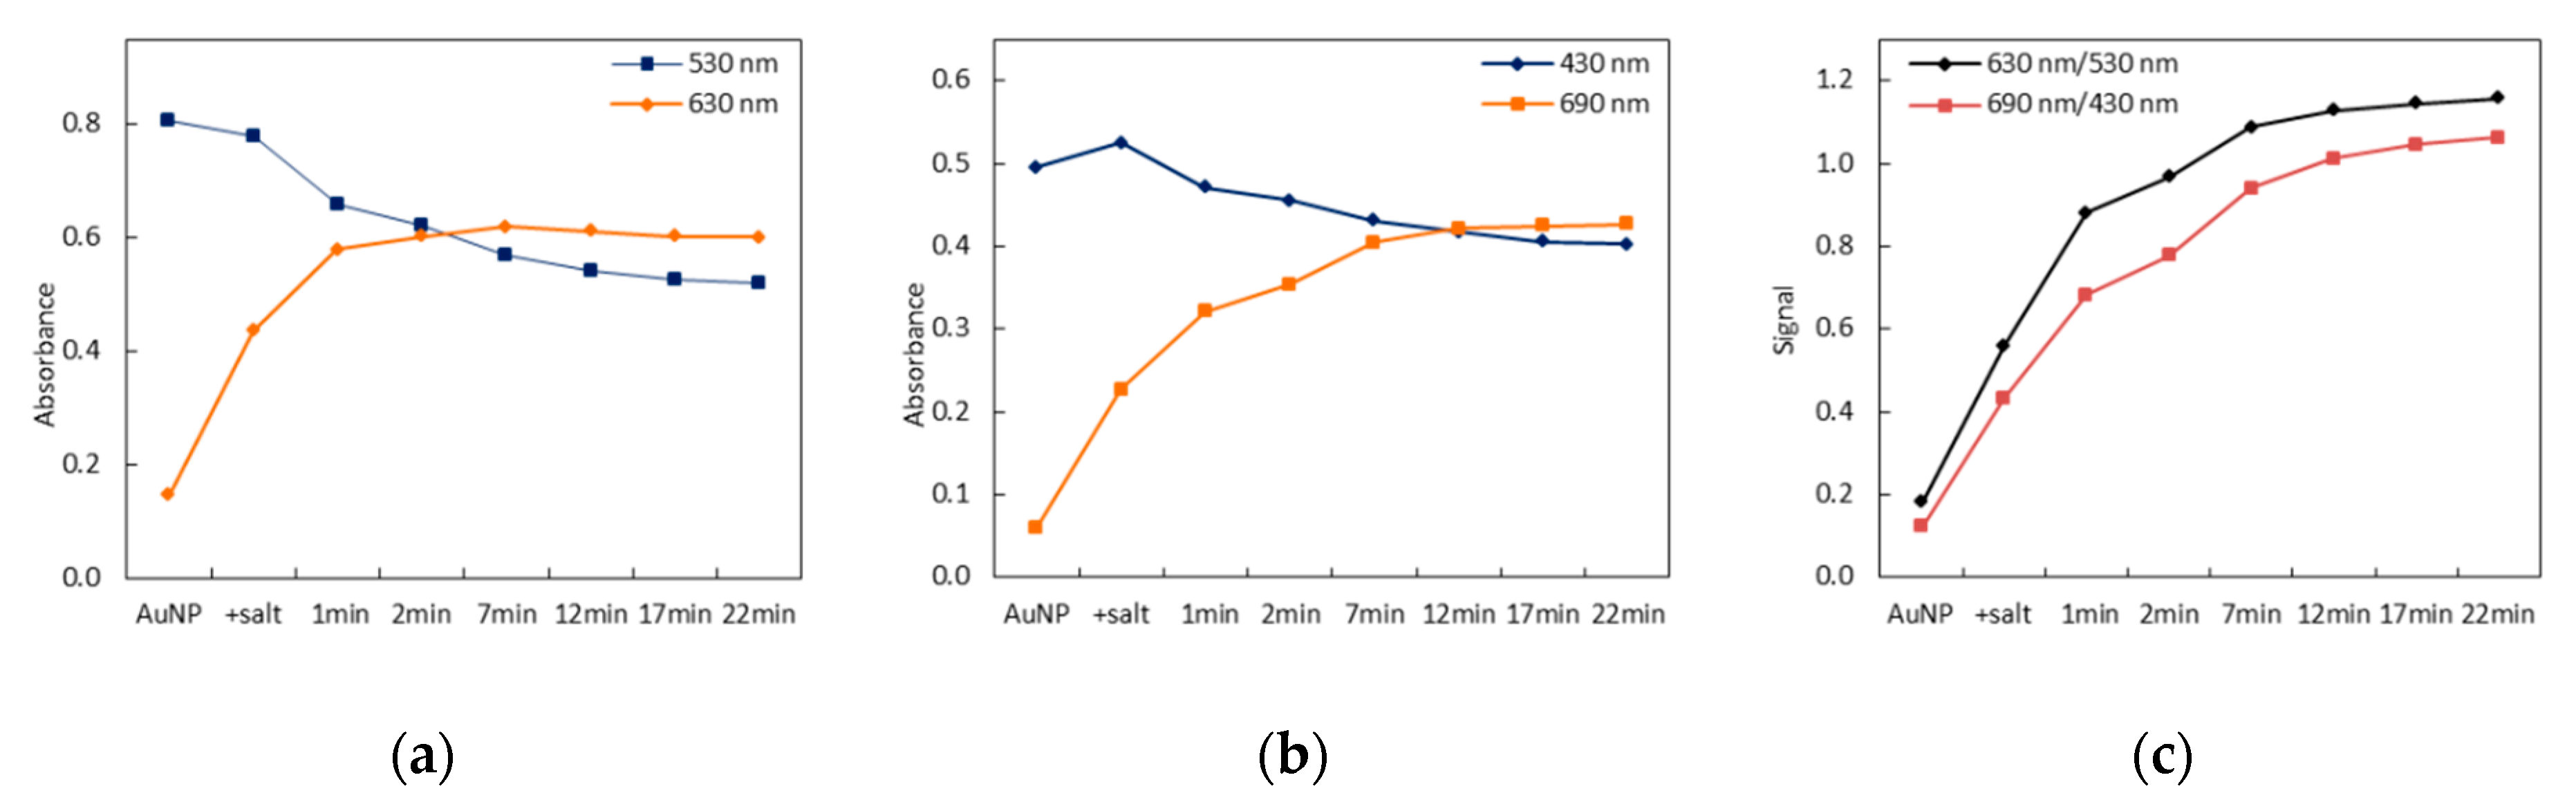
3.4.3. Colorimetric Assay

LAMP is an extremely efficient amplification method (10 µg in a 25 μL reaction mixture) [37,38]. Calibration experiments of these LAMP products with our 2-LED-µ-Spectrophotometer were performed and the obtained data were compared with the results achieved with the conventional UV/vis spectrometer. The assay is based on the observation that DNA-AuNP probes remained dispersed in the presence of specific LAMP amplicons that bind on the functionalized particle, but aggregate without DNA or unspecific DNA after addition of MgCl2 or HCl at RT. Clear color differences (red vs. blue/purple) were observed after the hybridization of the DNA-AuNP probes with the LAMP amplification product, as shown in Figure 9a. The selectivity of the AuNP probes is crucial. The experimental results show that the probes were highly selective and non-target DNA leads to a color shift. More precisely, the sample containing the non-specific template turned blue (+), just like the sample without templates (−. Moreover, the samples containing only the specific template remained as red solution (+). These differences, the aggregation profiles, and thus the change in absorbance ratio are also clearly visualized and analyzed with the 2-LED-µ-Spectrophotometer and show aggregation for the negative control (AuNP probe + salt) as well as for the no template control. Alternatively, the positive control (AuNP probe) and the specific LAMP product that hybridized with the AuNP probe in the reaction remained red. The addition of salt cannot induce aggregation (Figure 9c). Despite this, the use of HCl as aggregation promoter reveals another finding, which is the reversibility of the coalescence of the AuNP probe by adding sodium hydroxide (NaOH), shown in Figure 9c. The threshold of 0.8 was determined for discrimination between positive (Absλ2/Absλ1 ≥ 0.8) and negative (Absλ2/Absλ1 < 0.8) aggregation results.

4. Discussion

This work focused on the development of an on-site readout device for the implementation of colorimetric assays and the corresponding assay development. The assay is based on the observation that DNA-AuNP probes remain dispersed within the presence of specific LAMP amplicons that bind to the functionalized particles, but aggregate without DNA or unspecific DNA after the addition of an aggregation promoter (MgCl2, HCl). The 2-LED-µSpectrophotometer has the capabilities to monitor the progress of a nanoparticle aggregation in real-time by measuring the absorbance of the solution at two selectable and spectrally different wavelengths.
The performance of the assay was assessed in terms of specificity, dynamic range, and LOD. For specificity evaluation, Legionella DNA was used as specific and non-specific templates, respectively. We demonstrated the abilities by an application of noble-metal nanoparticles in which the reactions contain complementary DNA sequences (specific amplicon), hybridized with the DNA probe on the surface of the AuNPs, resulting in stabilization. Therefore, the addition of MgCl2 salt or HCl cannot induce aggregation of the DNA-AuNP probe. As a result, the color of the reaction remains red. Alternatively, the reaction without complementary DNA sequences (NTC, non-specific amplicon) after adding MgCl2 salt leads to aggregation of the AuNP probes and the reaction turns blue/purple. This approach is highly sensitive and selective compared with others without previous DNA amplification [39]. The DNA-AuNP probe assay is faster than the culture method (60 min vs. 24 h) and the DNA amplification requires only a thermal block or a water bath. LAMP requires less sophisticated instrumentation, no temperature cycling, as well as lower maximum temperatures (only about 60 °C), and is more robust towards inhibitors of unpurified samples [43,44]. LAMP can achieve excellent specificity and other advantages in comparison with other DNA amplification methods that were previously mentioned [41]. The spectrophotometric analyses of the synthesized AuNPs show an absorbance peak at 520 nm. Their size and the functionalization success were also confirmed using dynamic light scattering measurements (Zetasizer nano series, Malvern Instruments Limited, Worcestershire, UK) (Figure S2). The developed DNA-AuNP probe assay has a clearly visible detection limit at a DNA concentration of 0.5 pg µL−1, depending on the LAMP LOD. In addition, the DNA-AuNP probe used in this study had no cross-reactivity with the Legionella isolates and the other bacteria. The results were also consistent with the LAMP methods. It should be pointed out that the hybridization of the specific LAMP amplicons and the DNA-AuNP probe was temperature-independent. The colorimetric step of the assay after LAMP amplification took an 8–15 min response time to fully aggregate and obtain a reliable signal. The aggregation process could be monitored by measuring the absorbance at 1 s intervals (530 nm, 430 nm, 630 nm, 690 nm).
The instrument fulfills a set of criteria, starting with simplicity and cost-efficiency. It can measure dual wavelengths, including a versatile choice of different wavelengths, and also allows the use of standard disposable cuvettes, preventing cross-contamination. The platform is robust and compact, including an internal referencing system in small size. Online measurement and evaluation is possible and the own developed software can be implemented on different end devices. Modular extensions for temperature control and mixing are intended. For this photometer, instrument costs of about 100 EUR are envisioned. For the measurements, two-stage-programmable amplifiers are integrated. Therefore, much less light is needed for the detection and LEDs could be implemented. The programmable signal amplifiers allow a better control of the analog-to-digital converter even with darker blanks. In contrast to other devices [26,28], a beam splitter is integrated, and as a result, the sample and reference were illuminated by the same light source simultaneously. Thus, the presented design is insensitive to intensity changes of the light source. The LEDs flash, which is particularly important for light-sensitive samples and prevents bleaching. Furthermore, this prevents significant heating of the LEDs. This also eliminates the question of the long-term measurement stability of laser diodes [45]. The design thus brings together two features, firstly the adjustable LED current (1 mA–20 mA), and secondly the adjustable amplification. The flexibility of this platform allows running the program on diverse devices such as desktop computers, tables, smartphones, and single board computers. The written open-source code allows high modularity, so it can be easily adapted for further detection schemes. Temperature control and control from a smartphone could be easily implemented in future steps.

5. Conclusions

The 2-LED-µ-Spectrophotometer is a simple and cost-efficient analytical approach for rapid pathogen detection with noble-metal colloids, utilizing a DNA-AuNP probe aggregation assay. This colorimetric assay is robust, easy to use, and highly specific. The sensitivity is comparable to that of conventional devices. The presented method can be applied to any bioaffinity reaction, including protein assays. Future research directions include the direct implementation of heating as well as DNA amplification. This portable device may easily be applicable to decentralized pathogen testing.

Supplementary Materials

The following are available online at https://www.mdpi.com/2076-3417/10/8/2658/s1, Figure S1: Colloidal spherical gold nanoparticles (a) UV/vis spectrum of used particles with a resonance peak at 520 nm; (b) corresponding transmission electron microscopy (TEM) image. Scalebar: 50 nm; Figure S2: Experimental results of the dynamic light scattering (DLS) measurements with pure AuNPs, LepB AuNP probes, and complementary LAMP amplicon hybridized to LepB AuNP probes; Table S1: Oligonucleotides used in this study; Table S2: Primers used in this study.

Author Contributions

Conceptualization, O.S., A.C., and C.R.; methodology, C.R., M.A., O.S., A.C., and W.F.; software, M.U.; validation, C.R. and M.U.; investigation, C.R. and M.A.; writing—original draft preparation, C.R.; writing—review and editing, C.R., M.A, O.S., A.C., and W.F.; visualization, C.R.; supervision, W.F. and A.C. All authors have read and agreed to the published version of the manuscript.

Funding

This research was funded by BMBF DeSPaC, grant number 01DH17058, and IGSTC/BMBF WaterChip, grant number 01DQ16009A.

Acknowledgments

We acknowledge the fruitful discussion with Hassan Azzazy (AU Cairo). We thank Lisa Stolle and Viktor Weißenborn for particle synthesis and Franka Jahn for transmission electron microscopy. We also thank the researcher Bruno Veigas (Universidade Nova de Lisboa) for his support.

Conflicts of Interest

The authors declare no conflict of interest.

References

  1. Ma, X.; He, S.; Qiu, B.; Luo, F.; Guo, L.; Lin, Z. Noble Metal Nanoparticle-Based Multicolor Immunoassays: An Approach toward Visual Quantification of the Analytes with the Naked Eye. ACS Sens. 2019, 4, 782–791. [Google Scholar] [CrossRef] [PubMed]
  2. Jain, P.K.; Lee, K.S.; El-Sayed, I.H.; El-Sayed, M.A. Calculated Absorption and Scattering Properties of Gold Nanoparticles of Different Size, Shape, and Composition:  Applications in Biological Imaging and Biomedicine. J. Phys. Chem. B 2006, 110, 7238–7248. [Google Scholar] [CrossRef] [Green Version]
  3. Chang, C.-C.; Chen, C.-P.; Wu, T.-H.; Yang, C.-H.; Lin, C.-W.; Chen, C.-Y. Gold Nanoparticle-Based Colorimetric Strategies for Chemical and Biological Sensing Applications. Nanomater. Basel Switz. 2019, 9. [Google Scholar] [CrossRef] [PubMed] [Green Version]
  4. Creighton, J.A.; Eadon, D.G. Ultraviolet–visible absorption spectra of the colloidal metallic elements. J. Chem. Soc. Faraday Trans. 1991, 87, 3881–3891. [Google Scholar] [CrossRef]
  5. Baptista, P.; Pereira, E.; Eaton, P.; Doria, G.; Miranda, A.; Gomes, I.; Quaresma, P.; Franco, R. Gold nanoparticles for the development of clinical diagnosis methods. Anal. Bioanal. Chem. 2008, 391, 943–950. [Google Scholar] [CrossRef] [PubMed]
  6. Elghanian, R.; Storhoff, J.J.; Mucic, R.C.; Letsinger, R.L.; Mirkin, C.A. Selective Colorimetric Detection of Polynucleotides Based on the Distance-Dependent Optical Properties of Gold Nanoparticles. Science 1997, 277, 1078. [Google Scholar] [CrossRef] [PubMed] [Green Version]
  7. Aldewachi, H.; Chalati, T.; Woodroofe, M.N.; Bricklebank, N.; Sharrack, B.; Gardiner, P. Gold nanoparticle-based colorimetric biosensors. Nanoscale 2018, 10, 18–33. [Google Scholar] [CrossRef] [Green Version]
  8. Sabela, M.; Balme, S.; Bechelany, M.; Janot, J.-M.; Bisetty, K. A Review of Gold and Silver Nanoparticle-Based Colorimetric Sensing Assays. Adv. Eng. Mater. 2017, 19, 1700270. [Google Scholar] [CrossRef]
  9. Liu, J.; Lu, Y. Design of asymmetric DNAzymes for dynamic control of nanoparticle aggregation states in response to chemical stimuli. Org. Biomol. Chem. 2006, 4, 3435–3441. [Google Scholar] [CrossRef]
  10. Wang, G.; Akiyama, Y.; Shiraishi, S.; Kanayama, N.; Takarada, T.; Maeda, M. Cross-Linking versus Non-Cross-Linking Aggregation of Gold Nanoparticles Induced by DNA Hybridization: A Comparison of the Rapidity of Solution Color Change. Bioconjug. Chem. 2017, 28, 270–277. [Google Scholar] [CrossRef]
  11. Liu, G.; Lu, M.; Huang, X.; Li, T.; Xu, D. Application of Gold-Nanoparticle Colorimetric Sensing to Rapid Food Safety Screening. Sensors 2018, 18, 4166. [Google Scholar] [CrossRef] [PubMed] [Green Version]
  12. Csáki, A.; Thiele, M.; Jatschka, J.; Dathe, A.; Zopf, D.; Stranik, O.; Fritzsche, W. Plasmonic nanoparticle synthesis and bioconjugation for bioanalytical sensing. Eng. Life Sci. 2015, 15, 266–275. [Google Scholar] [CrossRef]
  13. Oliveira, J.P.; Prado, A.R.; Keijok, W.J.; Antunes, P.W.P.; Yapuchura, E.R.; Guimarães, M.C.C. Impact of conjugation strategies for targeting of antibodies in gold nanoparticles for ultrasensitive detection of 17β-estradiol. Sci. Rep. 2019, 9, 13859. [Google Scholar] [CrossRef] [Green Version]
  14. Wang, Z.; Lévy, R.; Fernig, D.G.; Brust, M. Kinase-Catalyzed Modification of Gold Nanoparticles:  A New Approach to Colorimetric Kinase Activity Screening. J. Am. Chem. Soc. 2006, 128, 2214–2215. [Google Scholar] [CrossRef] [PubMed]
  15. Ho, Y.T.; Poinard, B.; Yeo, E.L.L.; Kah, J.C.Y. An instantaneous colorimetric protein assay based on spontaneous formation of a protein corona on gold nanoparticles. Analyst 2015, 140, 1026–1036. [Google Scholar] [CrossRef] [PubMed]
  16. Schofield, C.L.; Field, R.A.; Russell, D.A. Glyconanoparticles for the Colorimetric Detection of Cholera Toxin. Anal. Chem. 2007, 79, 1356–1361. [Google Scholar] [CrossRef]
  17. Borghei, Y.-S.; Hosseini, M.; Dadmehr, M.; Hosseinkhani, S.; Ganjali, M.R.; Sheikhnejad, R. Visual detection of cancer cells by colorimetric aptasensor based on aggregation of gold nanoparticles induced by DNA hybridization. Anal. Chim. Acta 2016, 904, 92–97. [Google Scholar] [CrossRef]
  18. Dehghani, Z.; Hosseini, M.; Mohammadnejad, J.; Bakhshi, B.; Rezayan, A.H. Colorimetric aptasensor for Campylobacter jejuni cells by exploiting the peroxidase like activity of Au@Pd nanoparticles. Microchim. Acta 2018, 185, 448. [Google Scholar] [CrossRef]
  19. Priyadarshini, E.; Pradhan, N. Metal-induced aggregation of valine capped gold nanoparticles: An efficient and rapid approach for colorimetric detection of Pb2+ ions. Sci. Rep. 2017, 7, 9278. [Google Scholar] [CrossRef]
  20. Ullah, N.; Mansha, M.; Khan, I.; Qurashi, A. Nanomaterial-based optical chemical sensors for the detection of heavy metals in water: Recent advances and challenges. TrAC Trends Anal. Chem. 2018, 100, 155–166. [Google Scholar] [CrossRef]
  21. Doria, G.; Conde, J.; Veigas, B.; Giestas, L.; Almeida, C.; Assunção, M.; Rosa, J.; Baptista, P.V. Noble metal nanoparticles for biosensing applications. Sensors 2012, 12, 1657–1687. [Google Scholar] [CrossRef] [PubMed]
  22. Ankireddy, S.R.; Kim, J. Chapter 23 - Status and Recent Developments in Analytical Methods for the Detection of Foodborne Microorganisms. In Recent Developments in Applied Microbiology and Biochemistry; Buddolla, V., Ed.; Academic Press: Cambridge, MA, USA, 2019; pp. 323–334. ISBN 978-0-12-816328-3. [Google Scholar]
  23. Seetang-Nun, Y.; Jaroenram, W.; Sriurairatana, S.; Suebsing, R.; Kiatpathomchai, W. Visual detection of white spot syndrome virus using DNA-functionalized gold nanoparticles as probes combined with loop-mediated isothermal amplification. Mol. Cell. Probes 2013, 27, 71–79. [Google Scholar] [CrossRef] [PubMed]
  24. Dharanivasan, G.; Jesse, D.M.I.; Rajamuthuramalingam, T.; Rajendran, G.; Shanthi, S.; Kathiravan, K. Scanometric Detection of Tomato Leaf Curl New Delhi Viral DNA Using Mono- and Bifunctional AuNP-Conjugated Oligonucleotide Probes. ACS Omega 2019, 4, 10094–10107. [Google Scholar] [CrossRef] [PubMed] [Green Version]
  25. Veigas, B.; Pedrosa, P.; Carlos, F.F.; Mancio-Silva, L.; Grosso, A.R.; Fortunato, E.; Mota, M.M.; Baptista, P.V. One nanoprobe, two pathogens: gold nanoprobes multiplexing for point-of-care. J. Nanobiotechnology 2015, 13, 48. [Google Scholar] [CrossRef] [PubMed] [Green Version]
  26. Hamilton, J.R.; White, J.S.; Nakhleh, M.B. Development of a Low-Cost Four-Color LED Photometer. J. Chem. Educ. 1996, 73, 1052. [Google Scholar] [CrossRef]
  27. Fonseca, A.; Raimundo, I.M. A simple method for water discrimination based on an light emitting diode (LED) photometer. Anal. Chim. Acta 2007, 596, 66–72. [Google Scholar] [CrossRef]
  28. Stephenson, D. A Portable Diode Array Spectrophotometer. Appl. Spectrosc. 2016, 70, 874–878. [Google Scholar] [CrossRef]
  29. Albert, D.R.; Todt, M.A.; Davis, H.F. A Low-Cost Quantitative Absorption Spectrophotometer. J. Chem. Educ. 2012, 89, 1432–1435. [Google Scholar] [CrossRef]
  30. Wittbrodt, B.T.; Squires, D.A.; Walbeck, J.; Campbell, E.; Campbell, W.H.; Pearce, J.M. Open-Source Photometric System for Enzymatic Nitrate Quantification. PLOS ONE 2015, 10, e0134989. [Google Scholar] [CrossRef]
  31. Zhao, C.; Zhong, G.; Kim, D.-E.; Liu, J.; Liu, X. A portable lab-on-a-chip system for gold-nanoparticle-based colorimetric detection of metal ions in water. Biomicrofluidics 2014, 8, 052107. [Google Scholar] [CrossRef] [Green Version]
  32. Vasquez, G.; Hernández, Y.; Coello, Y. Portable low-cost instrumentation for monitoring Rayleigh scattering from chemical sensors based on metallic nanoparticles. Sci. Rep. 2018, 8, 14903. [Google Scholar] [CrossRef] [PubMed] [Green Version]
  33. Firdaus, M.L.; Parlindungan, D.; Sundaryono, A.; Farid, M.; Rahmidar, L.; Maidartati, M.; Amir, H. Development of Low-Cost Spectrophotometry Laboratory Practice Based on the Digital Image for Analytical Chemistry Subject. In Proceedings of the 3rd Asian Education Symposium (AES 2018), Bandung, Indonesia, 25–26 September 2018; Atlantis Press: Paris, France, 2019. [Google Scholar]
  34. Nuryantini, A.Y.; Mahen, E.C.S.; Sawitri, A.; Nuryadin, B.W. Do it yourself: optical spectrometer for physics undergraduate instruction in nanomaterial characterization. Eur. J. Phys. 2017, 38, 055501. [Google Scholar] [CrossRef]
  35. Verma, M.S.; Tsuji, J.M.; Hall, B.; Chen, P.Z.; Forrest, J.; Jones, L.; Gu, F.X. Towards point-of-care detection of polymicrobial infections: Rapid colorimetric response using a portable spectrophotometer. Sens. Bio-Sens. Res. 2016, 10, 15–19. [Google Scholar] [CrossRef] [Green Version]
  36. de Morais, C.D.; Carvalho, J.C.; Sant'Anna, C.; Eugênio, M.; Gasparotto, L.H.; Lima, K.M. A low-cost microcontrolled photometer with one color recognition sensor for selective detection of Pb2+ using gold nanoparticles. Anal. Methods 2015, 7, 7917–7922. [Google Scholar] [CrossRef]
  37. Mori, Y.; Nagamine, K.; Tomita, N.; Notomi, T. Detection of Loop-Mediated Isothermal Amplification Reaction by Turbidity Derived from Magnesium Pyrophosphate Formation. Biochem. Biophys. Res. Commun. 2001, 289, 150–154. [Google Scholar] [CrossRef]
  38. Shirato, K. Detecting amplicons of loop-mediated isothermal amplification. Microbiol. Immunol. 2019, 63, 407–412. [Google Scholar] [CrossRef]
  39. Nuthong, B.; Wilailuckana, C.; Tavichakorntrakool, R.; Boonsiri, P.; Daduang, S.; Bunyaraksyotin, G.; Suphan, O.; Daduang, J. One step for Legionella pneumophila detection in environmental samples by DNA-gold nanoparticle probe. J. Appl. Microbiol. 2018, 125, 1534–1540. [Google Scholar] [CrossRef]
  40. Bastús, N.G.; Comenge, J.; Puntes, V. Kinetically Controlled Seeded Growth Synthesis of Citrate-Stabilized Gold Nanoparticles of up to 200 nm: Size Focusing versus Ostwald Ripening. Langmuir 2011, 27, 11098–11105. [Google Scholar] [CrossRef]
  41. Reuter, C.; Slesiona, N.; Hentschel, S.; Aehlig, O.; Breitenstein, A.; Csáki, A.; Henkel, T.; Fritzsche, W. Loop-mediated amplification as promising on-site detection approach for Legionella pneumophila and Legionella spp. Appl. Microbiol. Biotechnol. 2020, 104, 405–415. [Google Scholar] [CrossRef]
  42. Zhang, X.; Servos, M.R.; Liu, J. Instantaneous and Quantitative Functionalization of Gold Nanoparticles with Thiolated DNA Using a pH-Assisted and Surfactant-Free Route. J. Am. Chem. Soc. 2012, 134, 7266–7269. [Google Scholar] [CrossRef] [Green Version]
  43. Kaneko, H.; Kawana, T.; Fukushima, E.; Suzutani, T. Tolerance of loop-mediated isothermal amplification to a culture medium and biological substances. J. Biochem. Biophys. Methods 2007, 70, 499–501. [Google Scholar] [CrossRef] [PubMed]
  44. Francois, P.; Tangomo, M.; Hibbs, J.; Bonetti, E.-J.; Boehme, C.C.; Notomi, T.; Perkins, M.D.; Schrenzel, J. Robustness of a loop-mediated isothermal amplification reaction for diagnostic applications. FEMS Immunol. Med. Microbiol. 2011, 62, 41–48. [Google Scholar] [CrossRef] [PubMed] [Green Version]
  45. Qin, A.; Fu, L.T.; Wong, J.K.F.; Chau, L.Y.; Yip, S.P.; Lee, T.M.H. Precipitation of PEG/Carboxyl-Modified Gold Nanoparticles with Magnesium Pyrophosphate: A New Platform for Real-Time Monitoring of Loop-Mediated Isothermal Amplification. ACS Appl. Mater. Interfaces 2017, 9, 10472–10480. [Google Scholar] [CrossRef] [PubMed]
Figure 1. 2-light emitting diode (LED)-µSpectrophotometer for colorimetric real-time loop-mediated isothermal amplification (LAMP) assay. (a) Instrument in enclosure. (b) On the main board (e1) with the electronic control, a holder for two cuvettes (sample as well as blank) is positioned. A detector is also attached to each of the holders on a smaller board (e2). (c) Drawing of the cuvette holder, which is 3D-printed. (d) Optical setup with two LEDs of different wavelength, the beam splitter, the cuvettes (inside their holder), and the respective detectors. (e) Electronic mainboard (e1) as well as the two detector boards (e2).
Applsci 10 02658 g001
Figure 2. Schematic representation of the DNA sensing strategy. In the presence of DNA and an aggregation promoter (such as salt, acid), oligonucleotide-functionalized AuNPs aggregate, leading to a color change from red to blue, and simultaneously to a shift in the spectrum to higher wavelengths as a result of interparticle plasmonic coupling.
Applsci 10 02658 g002
Figure 3. Characterization of the signal stability and measurements: (a) stability of the optical signal of various LEDs of different wavelength over a time of 3 h; (b) histogram plots of the short-term noise.
Applsci 10 02658 g003
Figure 4. Aggregation kinetics of an AuNP solution, run-time = 8.5 min. Addition of an aggregation promoter generates different levels of color change, which leads to changes in the LED signals. (a) 2-LED-µSpectrophotometer absorbance values at the selected wavelengths after salt addition at t = 40 s; (b) corresponding UV/vis curve using benchtop spectrometer in an overall time of 8 min.
Applsci 10 02658 g004
Figure 5. Kinetics of the magnesium salt-induced aggregation of AuNPs. MgCl2 = 50.0 mM, run-time = 22 min. Selected wavelengths λ1 = 430 nm and λ2 = 690 nm (a) or λ1 = 530 nm and λ2 = 630 nm (b); (c) ratio of the predetermined wavelengths in terms of λ21.
Applsci 10 02658 g005
Figure 6. Comparison between the 2-LED-µSpectrophotometer and a commercial benchtop spectrometer. Measurements regarding sensitivity using two wavelengths and standard UV/vis-cuvettes, selected wavelengths λ1 = 430 nm and λ2 = 690 nm. Absorbance measurements of dilution series are an example that includes the concentrations in a number of dilutions.
Applsci 10 02658 g006
Figure 7. Experimental results for ratio determination of aggregation of AuNP solutions, run-time = 8.5 min. (a) 2-LED-µSpectrophotometer absorbance ratio of selected dilutions: 1 = 100%, 3 = 80%, 6 = 50%, 9 = 20%, and 11 = water.
Applsci 10 02658 g007
Figure 8. LAMP results for L. pneumophila, 2% agarose gel, targeting the dotA (a) and the lepB (b,c) gene; (a,b) DNA ladder 100 bp, line 1 = no template control, line 2 = serogroup (SG) 1, line 3 = SG 3, line 4 = SG 6, line 5 = SG 8, line 6 = SG 9, line 7 = SG 15; (c) dilution row. DNA ladder 100 bp, line 1 = no template control, line 2 = 500 pg µL−1, line 3 = 0.5 pg µL−1 line 4 = 0.05 pg µL−1, line 5 = 0.005 pg µL−1, line 6 = 0.0005 pg µL−1, line 7 = empty.
Applsci 10 02658 g008
Figure 9. Colorimetric LAMP assay using non-crosslinking method for DNA detection. (a) Aggregation assay with specific and unspecific LAMP products using the lepB specific AuNP probe and amplicons (specific) obtained from the LepB primerset as well as amplicons (unspecific) obtained from the dotA primerset. (b) Absorption ratio mean values: salt-induced method and corresponding tube images, obtained after 15 min. (c) Absorption ratio mean values: pH induced method and corresponding tube images obtained after 15 min. Horizontal line: threshold value. NTC, negative template control.
Applsci 10 02658 g009

