Article

Luminous Intensity Field Optimization for Antiglare LED Desk Lamp without Second Optical Element

1
Department of Mechanical Engineering, Advanced Institute of Manufacturing with High-Tech Innovations, National Chung Cheng University, 168, University Rd., Min-Hsiung, Chia-Yi 62102, Taiwan
2
Department of Hospital and Health Care Management. Chia-Nan University of Pharmacy, No.60, Sec. 1, Erren Rd., Rende Dist. Tainan 71710, Taiwan
3
Department of Electro-Optical Engineering, National United University, 2, Lienda, Miaoli 26063, Taiwan
4
Department of Materials Science and Engineering, National United University, 2, Lienda, Miaoli 26063, Taiwan
*
Author to whom correspondence should be addressed.
Appl. Sci. 2020, 10(7), 2607; https://doi.org/10.3390/app10072607
Submission received: 11 March 2020 / Revised: 27 March 2020 / Accepted: 7 April 2020 / Published: 10 April 2020
(This article belongs to the Special Issue Joint Special Issue With OPTIC 2019)

Abstract

:
This study proposes a model of a light module with an optimized luminous intensity field for realizing an antiglare light-emitting diode (LED) desk lamp without a second optical element. We simulated different luminous intensity field profiles to analyze the unified glare rating (UGR) and illumination uniformity performance of a desk lamp. The spatial effect of UGR and the illumination uniformity affect eye comfort. The light module was set to different beam angles without a second optical element, louver structure, and reflective element on the luminaire to compare different UGRs and uniformity values for evaluating human eye comfort. The simulation and experimental results indicated that the luminous intensity curve for a beam angle of 90° achieved an illumination uniformity of 80% and a UGR of 18.1 at a height of 45 cm, thus realizing a human-friendly antiglare desk lamp.

1. Introduction

Light-emitting diodes (LEDs) offer advantages such as high efficiency, a high color-rendering index, energy saving, and environmental protection [1,2,3]. Therefore, they have been widely applied as the light source in desk lamps [4]. However, the luminous flux and unified glare rating (UGR) of desk lamps affect the comfort of the human eye. At the same luminous flux, a smaller light-emitting area has more serious glare problems. Converting a point light source into a light source with a larger, uniform area and adjusting the appropriate light beam angle can suppress UGRs effectively. Because of their light-emitting characteristics, LEDs are point light sources; therefore, they must first be converted into planar light sources.
Some studies have discussed how to convert LED point light sources into a planar light source to reduce the UGR index. In 2015, a hollow light guide with edge-lit LED sources was proposed. A hollow-type planar light source with reflecting, scattering, and multiple point light sources along at least one side plane was proposed to build a planar light source module [5]. A hollow light guide comprising LEDs with an asymmetric light field was proposed to transform an LED point light source into a planar light source without a light guide plate, so that it had 40% lower weight than a solid light guide module [6]. Another study developed a light guide plate with LEDs with an asymmetric light distribution and a light guide plate with a printed diffusion reflection on the bottom surface to achieve a circular large-area light source [7]. A light source module with adjustable diffusion includes an array of illumination elements and a light-diffusing material [8]. A light regulation device includes a first light guide structure with an incident light, a second light guide structure with a light-emitting surface, and a light deflection sheet with a first light deflection layer [9]. In industrial applications, some design methods have been proposed to achieve sufficient and uniform luminance over the entire surface—which is irradiated with light—of a light guide plate, and to achieve uniform luminance over an entire range to be irradiated with light [10,11,12]. A linear light source device was developed with a rectangular-shaped wiring substrate and a wiring pattern on it, and multiple light-emitting elements were arranged on the wiring substrate to achieve a linear light source device and a planar light source device [13]. A planar light source device with an illumination apparatus was developed to realize a planar light source device that can provide planar, uniform, and high-quality planar illumination [14,15,16,17].
The UGR value is an important function for evaluating the suitability of desk lamp lighting for the human eye. The lighting-driven spatial light field distribution can affect the perception of the human eye. Overly bright light sources can cause glare, which may impair visual efficiency. Luminaire designers use multiple structures to reduce glare; for instance, reflective matrix bars can improve the UGR and illumination uniformity and simultaneously achieve adequate illuminance. However, this causes a large loss in luminaire efficiency. Therefore, we proposed luminous intensity field optimization for an antiglare LED desk lamp without a second optical element. This study used DIALux evo 8.2 for simulations.

2. Glare Definition and Spatial Characteristics

The glare calculation method recommended by the International Commission on Illumination (CIE) was used to combine the Einhorn and Hopkinson formulas and the Guth position parameter. The calculated uniform glare index was used to predict the visual impact on the environment from the glare of a light source based on human factors. According to CIE 55-1983 and CIE 119-1995, the CIE Glare Index (CGI) of indoor lighting fixtures is defined as follows [18,19]
C G I = 8 l o g [ 2 · 1 + E d 500 E d + E i · L a 2 ω a P a 2 ]
where Ed is the direct vertical illumination of human eyes (direct vertical illuminance, lux), Ei is the indirect illumination on human eyes (indirect illuminance, lux), La is the brightness value of a single lamp in the line of sight of the human eye (luminance, nit), ωa is the solid angle formed by a single lamp on human eyes (steradian, sr), and Pa is the Guth Position Index of a single luminaire. The Guth position refers to the position of the lamp and the human eye, and it is defined as follows
1 P a = d 2 E X P d 2 + 1.5 d + 4.6 + 0.12 ( 1 E X P )
where EXP is defined as follows
E X P = e ( 0.18 S 2 d + 0.011 S 3 d )
where d is the horizontal distance between the luminaire and the human eye divided by the vertical height between the luminaire and the human eye (forward distance of source/height), and S is the horizontal distance between the luminaire and the vertical line of sight divided by the vertical height between the luminaire and the human eye (sideways distance of source/height).
CIE 117-1995 also defines another uncomfortable glare index called the UGR that considers the effect of background brightness on glare. Therefore, the parameters of the background luminance of the environment Lb are added as follows [20]
U G R = 8 log [ 0.25 L b ( L 2 ω i p 2 ) ]
where 8 gives UGR numbers that optimize and range from approximately 5 to 40, the logarithm (log) is used because human eyes react logarithmically to light, and Σ shows that the equation includes all the fittings located within the area, where Lb is defined as follows:
L b = E i n d π
Here, Lb is the value of the background luminance in cd/m2, Eind is the vertical indirect illuminance of the viewer’s eye, and L is defined as follows:
L = I A p
Here, L is the luminance value of the luminous parts of each luminaire in the direction of the viewer’s eye in cd/m2, I is the luminaire’s luminance, Ap is the project area, and ωi is defined as follows:
ω i = A p r 2
Here, ωi is the solid angle of the luminous parts of each luminaire on the viewer’s eye in steradian (sr), r is the distance from the light source to the viewer’s eyes, and p is the Guth position index for each individual luminaire that corresponds to its displacement from the line of sight and is related to the horizontal and tangent function of the observer to the light source.
Uniformity is calculated as follows [21]:
U n i f o r m i t y = m i n i m u m   i l l u m i n a n c e   ( l u x ) a v e r a g e   i l l u m i n a n c e   ( l u x )

3. Simulation of UGR and Illumination Uniformity

3.1. Spatial Characteristics

We set up a desk lamp for a study desk, as illustrated in Figure 1a, with a desk length and desk width of L0 and W0, respectively. P1 and P2 indicate the positions of the desk lamp and observer, respectively; the distance between them is D1. As shown in Figure 1b, the observer and desk lamp are positioned at P3 and P4 above the desk surface at height H1 and height H2. The calculation object has a length and width of L1 and W1, respectively. The observer on the edge of the desk indicates a student in front of the desk. We set the desk lamp rotation angles as +θ and −θ. Table 1 shows the simulation setup parameters.
The simulation setup parameters of symbol and characteristics are shown in Table 2.

3.2. UGR and Uniformity at Beam Angles of 70–120° at the Same Height

Table 2 shows the DIALux simulation parameters. It has a luminous flux of 800 lm, reflection factors of desk surface of 50% and desk lamp height of 45 cm.
Table 3 shows the variation in the UGR with the beam angle of 70–120°. We can vary the beam angles without changing the height of the desk lamp on the study desk to compare the corresponding UGR values.
Figure 2 shows the isoline and color illumination map (lux) of uniformity under different beam angle conditions.
Figure 2 shows the isoline and color illumination map under different beam angles: 70°, 80°, 90°, 100°, 110°, and 120° respectively. Figure 2c shows the simulation result with a desk lamp beam angle of 90° in the illumination isoline. This result indicates that the 1000–1400 lux isoline is distributed in most of the space and the >1000 lux isoline is at the four corners, as indicated by the orange and yellow regions, respectively. The lux isoline changes with a variation in the beam angle. When the beam angle increases, the isoline distribution becomes more uniform because the light exposure range is wider.
The simulation results were used to calculate the illumination and uniformity for different beam angles. As shown in Table 4, the uniformity had its maximum value of 0.83 for a beam angle of 120°. The average illumination was 1139 lux for a beam angle of 90°; this was higher than the values for beam angles of 100–120°. The illumination value is greater than 500 lux to comply with the regulations for a desk lamp for a study desk.
Figure 3 shows the luminous intensity profile for beam angles of 70–120°.
The luminous intensity field for a beam angle of 70° was the narrowest; with an increase in the beam angle, the luminous intensity field widened. In the determination of the UGR, a narrow beam angle outperformed a wide beam angle. By contrast, in the determination of the illumination uniformity, a wide beam angle was superior to a narrow beam angle. Table 3 and Table 4 show the homogenized UGR and uniformity values, respectively.
Figure 4 shows the relationship between UGR and uniformity at various beam angles. For a beam angle of 90°, the UGR is less than the threshold value of 19, and the uniformity is higher than that for beam angles of 70° and 80°; this is similar to the uniformity for beam angles of 100° and 110°. Therefore, considering the UGR and the uniformity values simultaneously, the best beam angle is 90°.

3.3. UGR and Uniformity at Beam Angle of 90° for Different Desk Lamp Heights

Table 5 shows the variation in the UGR with the desk lamp height for a beam angle of 90°. We can modulate desk lamp height without changing the beam angle of the desk lamp to compare UGR.
Figure 5 shows the isoline and color illumination map (lux) of uniformity for different desk lamp heights with a beam angle of 90°.
Figure 5 shows the isoline and color illumination map (lux) with different light source heights: 35, 40, 41, 42, 43, 44, 45, 46, 47, 48, and 50 cm, respectively. Figure 5g shows the lux isolines simulated using a 45 cm high desk lamp; the 1000–1400 lux isoline is distributed in most of the space and the >1000 lux isoline is at the four corners, as indicated by the orange and yellow regions, respectively.
The simulation results were used to calculate the illumination uniformity for different desk lamp heights. To comply with the regulations for a study desk, a desk lamp height of 50 cm resulted in the highest uniformity, and a height of 35 cm resulted in the highest average flux.
Table 5 and Table 6 present the homogenized UGR and uniformity values, respectively. Figure 6 shows the variation in the UGR and the uniformity with the desk lamp height. For a beam angle of 90° and desk lamp height of 45 cm, the UGR is less than the threshold value of 19, and the uniformity is higher than that for heights of 35, 40, 41, 42, 43, and 44 cm.

3.4. UGR and Uniformity for Beam Angle of 90° and Desk Lamp Height of 45 cm with Different Rotation Angles

Table 7 shows the UGR for a beam angle of 90° and desk lamp height of 45 cm with different rotation angles. We can modulate the desk lamp rotation angle without changing the beam angle and height of the desk lamp on the study desk to compare UGR.
Figure 7 shows the isoline and color illumination map (lux) of the uniformity for a beam angle of 90° and desk lamp height of 45 cm with different rotation angles.
Figure 7 shows isoline and color illumination map (lux) with different desk lamp rotation angles 5°, 4°, 3°, 2°, 1°, 0°, −1°, −2°, −3°, −4°, and −5°, respectively. Figure 7f shows the lux isolines simulated using a desk lamp rotation angle of 0°; the 1000–1400 lux isoline and the >1000 lux isoline are at the four corners, similar to the situation resulting from a rotation angle of 1°, as indicated by the orange and yellow regions, respectively.
The simulation results were used to calculate the illumination and uniformity for different desk lamp rotation angles, as shown in Table 8. For a desk lamp rotation angle of 0°, the uniformity achieved the maximum value of 0.8.
For the determination of the illumination and uniformity, a rotation angle of 0° was better than other rotation angles. Table 7 and Table 8 show the homogenized UGR and uniformity values, respectively. Figure 8 shows the variation in the UGR and the uniformity with the rotation angle. For a rotation angle of 0°, the UGR was less than the threshold value of 19, and the uniformity was higher than that for the other rotation angles.
The simulation results indicate that the rotation of the desk lamp has a great effect on the glare value, and the glare value exceeds the threshold of 19 for a rotation angle of −1° to −5°.

4. Experimental Results

Figure 9 shows a side view of the structure of the desk lamp module. It contains a microstructure diffuser, a brightness enhancement film (BEF), a light guide, a reflective sheet at the bottom, and two LED strips on opposite sides of the light guide. The desk lamp has a width of 42.5 mm, height of 12 mm, and length of 100 mm. The LED model used was Lextar PC35H11, the color temperature of 4000 K and a color-rendering index of 80 was used.
Figure 10 shows the illumination map of the desk lamp module when it was (a) shut down and (b) in operation.
Figure 11 shows that the illumination values at heights of 0.27, 0.36, and 0.45 m were 3491, 2128, and 1414 lux, respectively, for a beam angle of 90°. The horizontal coordinate axis represents the illuminance and the vertical coordinate axis represents the distance from the light source.
Table 9 shows a comparison between the simulated and the measured illumination values. The result indicates good agreement between the two sets of values.
Table 10 shows a comparison between the simulated and the measured illumination values at the corners of the object area. The result indicates good agreement between the two sets of values.

5. Conclusions

Taking account of human factors, this study proposed modulation of the light-emitting field of a desk lamp without using a second optical element, louver structure, or second lens on the luminaire to reduce glare-related effects and maintain illumination uniformity in a reading range. The simulation results demonstrate that the light module in the desk lamp should ideally have a beam angle of 90°; the corresponding UGR is less than 19 and illumination uniformity is more than 0.8. The experimental results obtained using the prototype achieved good agreement with the simulation results. This light model can be used to design a desk lamp lighting plan with a UGR of 18.1 and uniformity of 0.8 and to obtain an average illumination value of 1394 lux at a height of 45 cm. Overall, this study proposes a model of a light module with an optimized luminous intensity field for realizing an antiglare light-emitting diode (LED) desk lamp without a second optical element complying with CNS 16048:2018 C4585 regulations.

Author Contributions

Z.-T.Y., original concept provider, organized and wrote the manuscript. Z.-T.Y., C.C. and K.-J.C. were responsible for data and optical measurements. Z.-T.Y. and M.-C.J. simulation and optimized design. All authors have read and agreed to the published version of the manuscript.

Funding

This research received no external funding.

Conflicts of Interest

The authors declare no conflict of interests.

References

  1. Son, C.-G.; Yi, J.-H.; Gwag, J.-S.; Kwon, J.H.; Park, G.-J. Improvement of Color and Luminance Uniformity of the Edge-Lit Backlight Using the RGB LEDs. J. Opt. Soc. Korea 2011, 15, 272–277. [Google Scholar] [CrossRef] [Green Version]
  2. Huang, Y.-S.; Luo, W.-C.; Wang, H.-C.; Feng, S.-W.; Kuo, C.-T.; Lu, C.-M. How Smart LEDs Lighting Benefit Color Temperature and Luminosity Transformation. Energies 2017, 10, 518. [Google Scholar] [CrossRef] [Green Version]
  3. Tsao, J.Y.; Coltrin, M.E.; Crawford, M.H.; Simmons, J.A. Solid-State Lighting: An Integrated Human Factors, Technology, and Economic Perspective. Proc. IEEE 2010, 98, 1162–1179. [Google Scholar] [CrossRef]
  4. Chen, Y.-S.; Lin, C.-Y.; Yeh, C.-M.; Kuo, C.-T.; Hsu, C.-W.; Wang, H.-C. Anti-glare LED lamps with adjustable illumination light field. Opt. Express 2014, 22, 5183–5195. [Google Scholar] [CrossRef] [PubMed]
  5. Ye, Z.T.; Kuo, H.-C.; Chen, C.-H. Thin hollow light guide for high-efficiency planar illuminator. Appl. Opt. 2015, 54, E23–E29. [Google Scholar] [CrossRef] [PubMed]
  6. Ye, Z.T.; Chen, C.L.; Chen, L.-C.; Tien, C.-H.; Nguyen, H.T.; Wang, H.-C. Hollow Light Guide Module Involving Mini Light-Emitting Diodes for Asymmetric Luminous Planar Illuminators. Energies 2019, 12, 2755. [Google Scholar] [CrossRef] [Green Version]
  7. Ye, Z.T.; Pai, Y.; Chen, C.-H.; Kuo, H.-C.; Chen, L.-C. A Light Guide Plate That Uses Asymmetric Intensity Distribution of Mini-LEDs for the Planar Illuminator. Crystals 2019, 9, 141. [Google Scholar] [CrossRef] [Green Version]
  8. Fournier, F.R.; Alaimo, A.M.; Lee, S.S.; Scepanovic, M.; Weber, A.G. Light Source Module with Adjustable Diffusion. U.S. Patent 9,894,257,B2, 13 February 2015. [Google Scholar]
  9. Teng, T.C.; Sun, C.H.; Xu, S.G. Light Regulation Device for Light Deflection and Backlight Module Having the Same. U.S. Patent 1,037,187,8B1, 6 August 2018. [Google Scholar]
  10. Dohan, P.; Jaehyeok, K.; Eunseok, K.; Dawoon, J. Light Source Module and Planar Light Source Device Including the Same. U.S. Patent 1,025,446,2B2, 9 April 2019. [Google Scholar]
  11. Itaya, H. Planar Light Source Device and Liquid Crystal Display Apparatus. U.S. Patent 1,049,581,0B2, 3 December 2019. [Google Scholar]
  12. Itoh, Y.; Manabu, O.; Motoki, T. Edge-Light Type Planar Light Source Device. U.S. Patent 9,244,213,B2, 26 January 2016. [Google Scholar]
  13. Ito, Y. Linear Light Source Device and Planar Light Source Device. U.S. Patent 9,022,633,B2, 5 May 2015. [Google Scholar]
  14. Sato, E.; Kenji, F.; Hiroyasu, S.; Rihito, S. Planar Light Source Device and Illumination Apparatus. U.S. Patent 8,911,133,B2, 9 September 2014. [Google Scholar]
  15. Hideki, K.; Yuhki, I. Linear Light Source Device and Planar Light Source Device. U.S. Patent 9,316,781,B2, 19 April 2016. [Google Scholar]
  16. Yasuo, W.; Tomonari, Y.; Kenji, Y. Light Guide, Manufacturing Method of Light Guide, Optical Shutter, and Planar Light-Source Device. U.S. Patent 9,507,072,B2, 29 November 2016. [Google Scholar]
  17. Takahiko, U.; Hiroshi, K. Light Reflector, and Planar Light Source Device and Illuminating Device Using the Light Reflector. U.S. Patent 8,950,920,B2, 10 February 2015. [Google Scholar]
  18. CIE 55:1983; International Commission on Illumination (CIE): Vienna, Austria, 1983.
  19. CIE 119-1995; International Commission on Illumination (CIE): Vienna, Austria, 1995.
  20. CIE 117-1995; International Commission on Illumination (CIE): Vienna, Austria, 1995.
  21. Lighting of Indoor Work Places, ISO CIE 8995, 2nd ed.; International Commission on Illumination (CIE): Vienna, Austria, 2002.
Figure 1. 
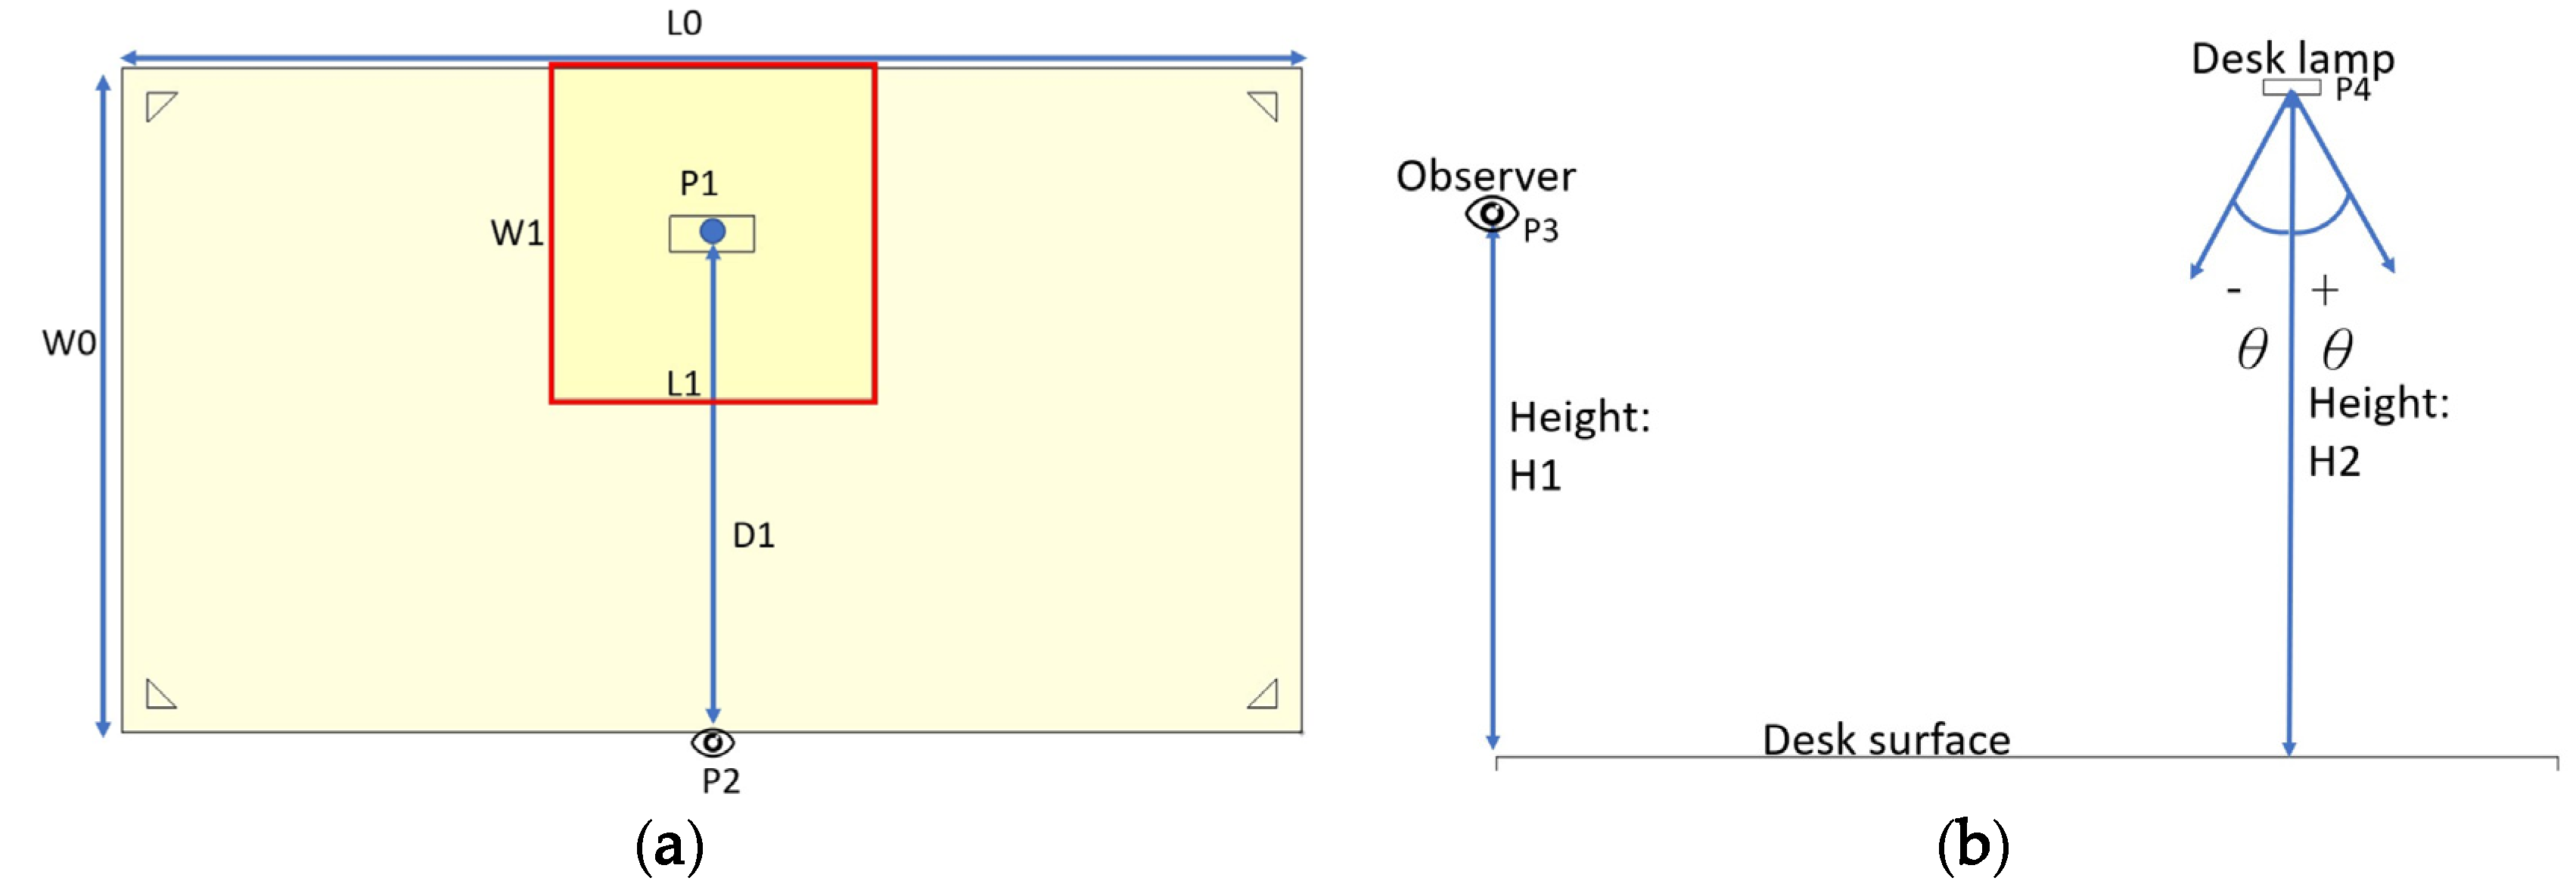
Simulation spatial characteristic in software: (a) desk luminaire plan and (b) side view of desk lamp on study desk.
Applsci 10 02607 g001
Figure 2. Isoline and color illumination map (lux) under different beam angles: (a) 70°, (b) 80°, (c) 90°, (d) 100°, (e) 110°, and (f) 120°.
Applsci 10 02607 g002aApplsci 10 02607 g002b
Figure 3. Luminous intensity field profile for beam angles of 70–120°.
Applsci 10 02607 g003
Figure 4. UGR and uniformity for beam angles of 70–120°.
Applsci 10 02607 g004
Figure 5. 
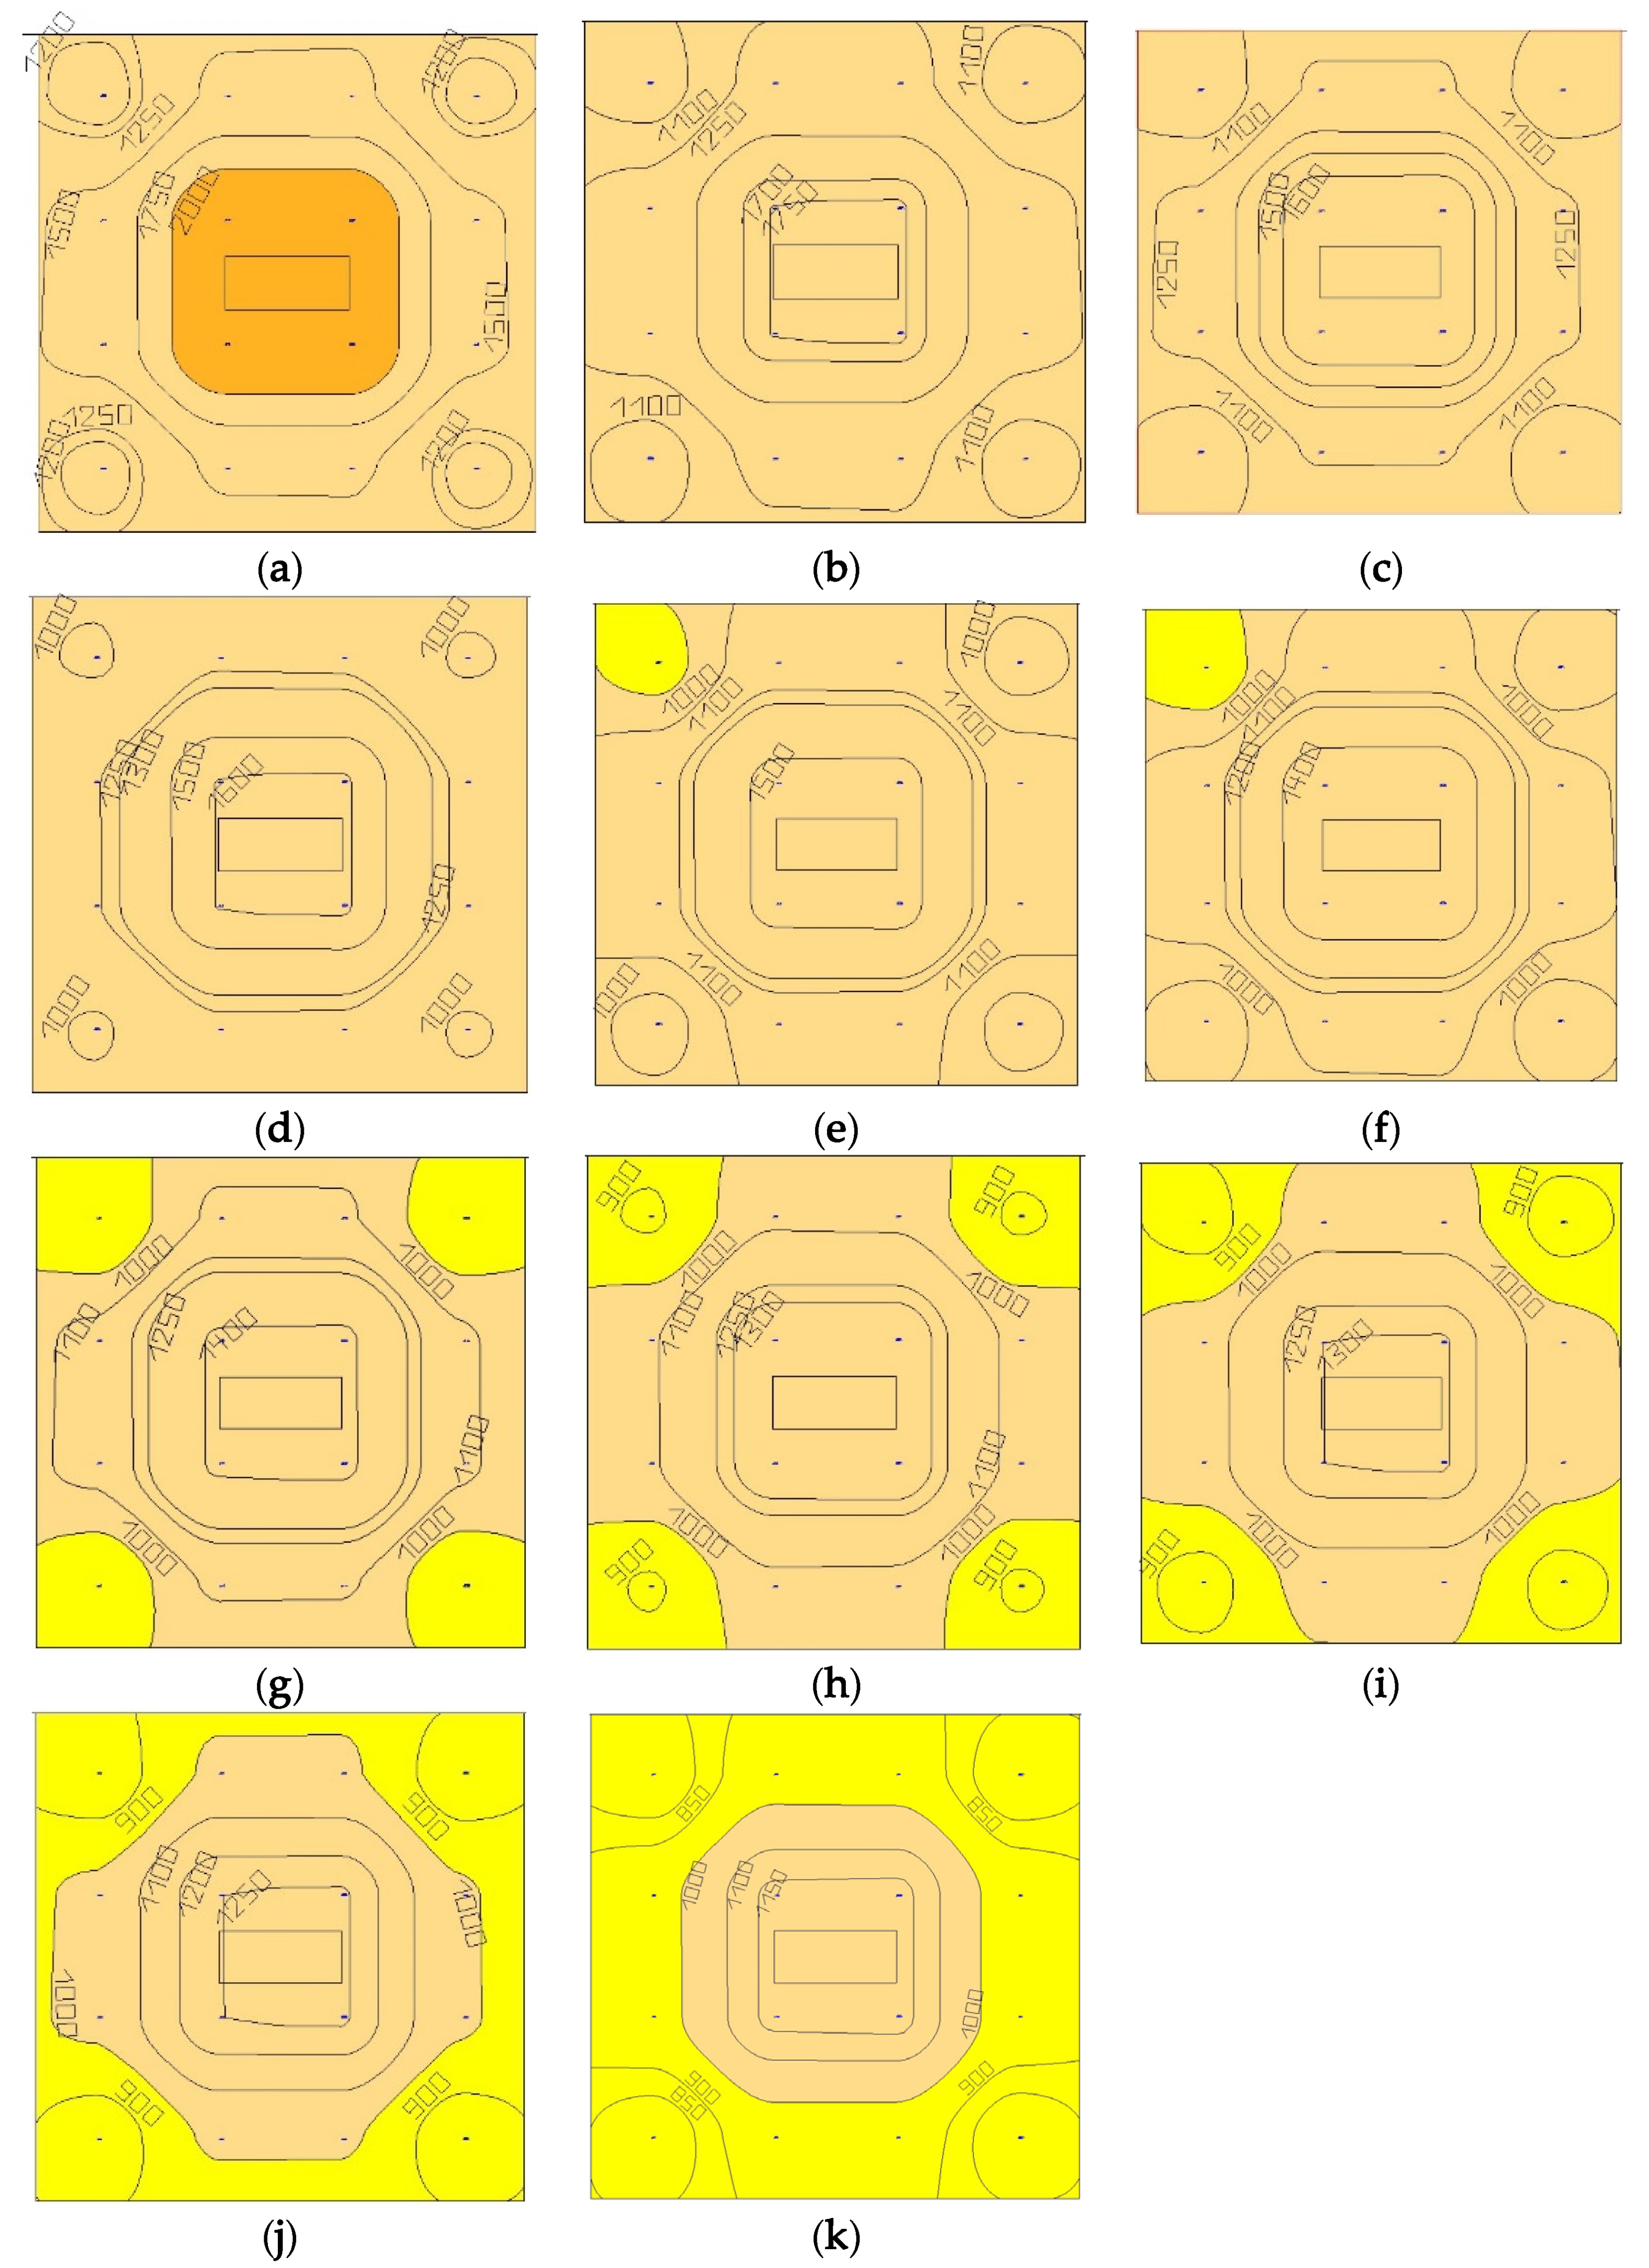
Isoline and color illumination map (lux) with different light source heights: (a) 35 cm, (b) 40 cm, (c) 41 cm, (d) 42 cm, (e) 43 cm, (f) 44 cm, (g) 45 cm, (h) 46 cm, (i) 47 cm, (j) 48 cm, and (k) 50 cm.
Applsci 10 02607 g005
Figure 6. 
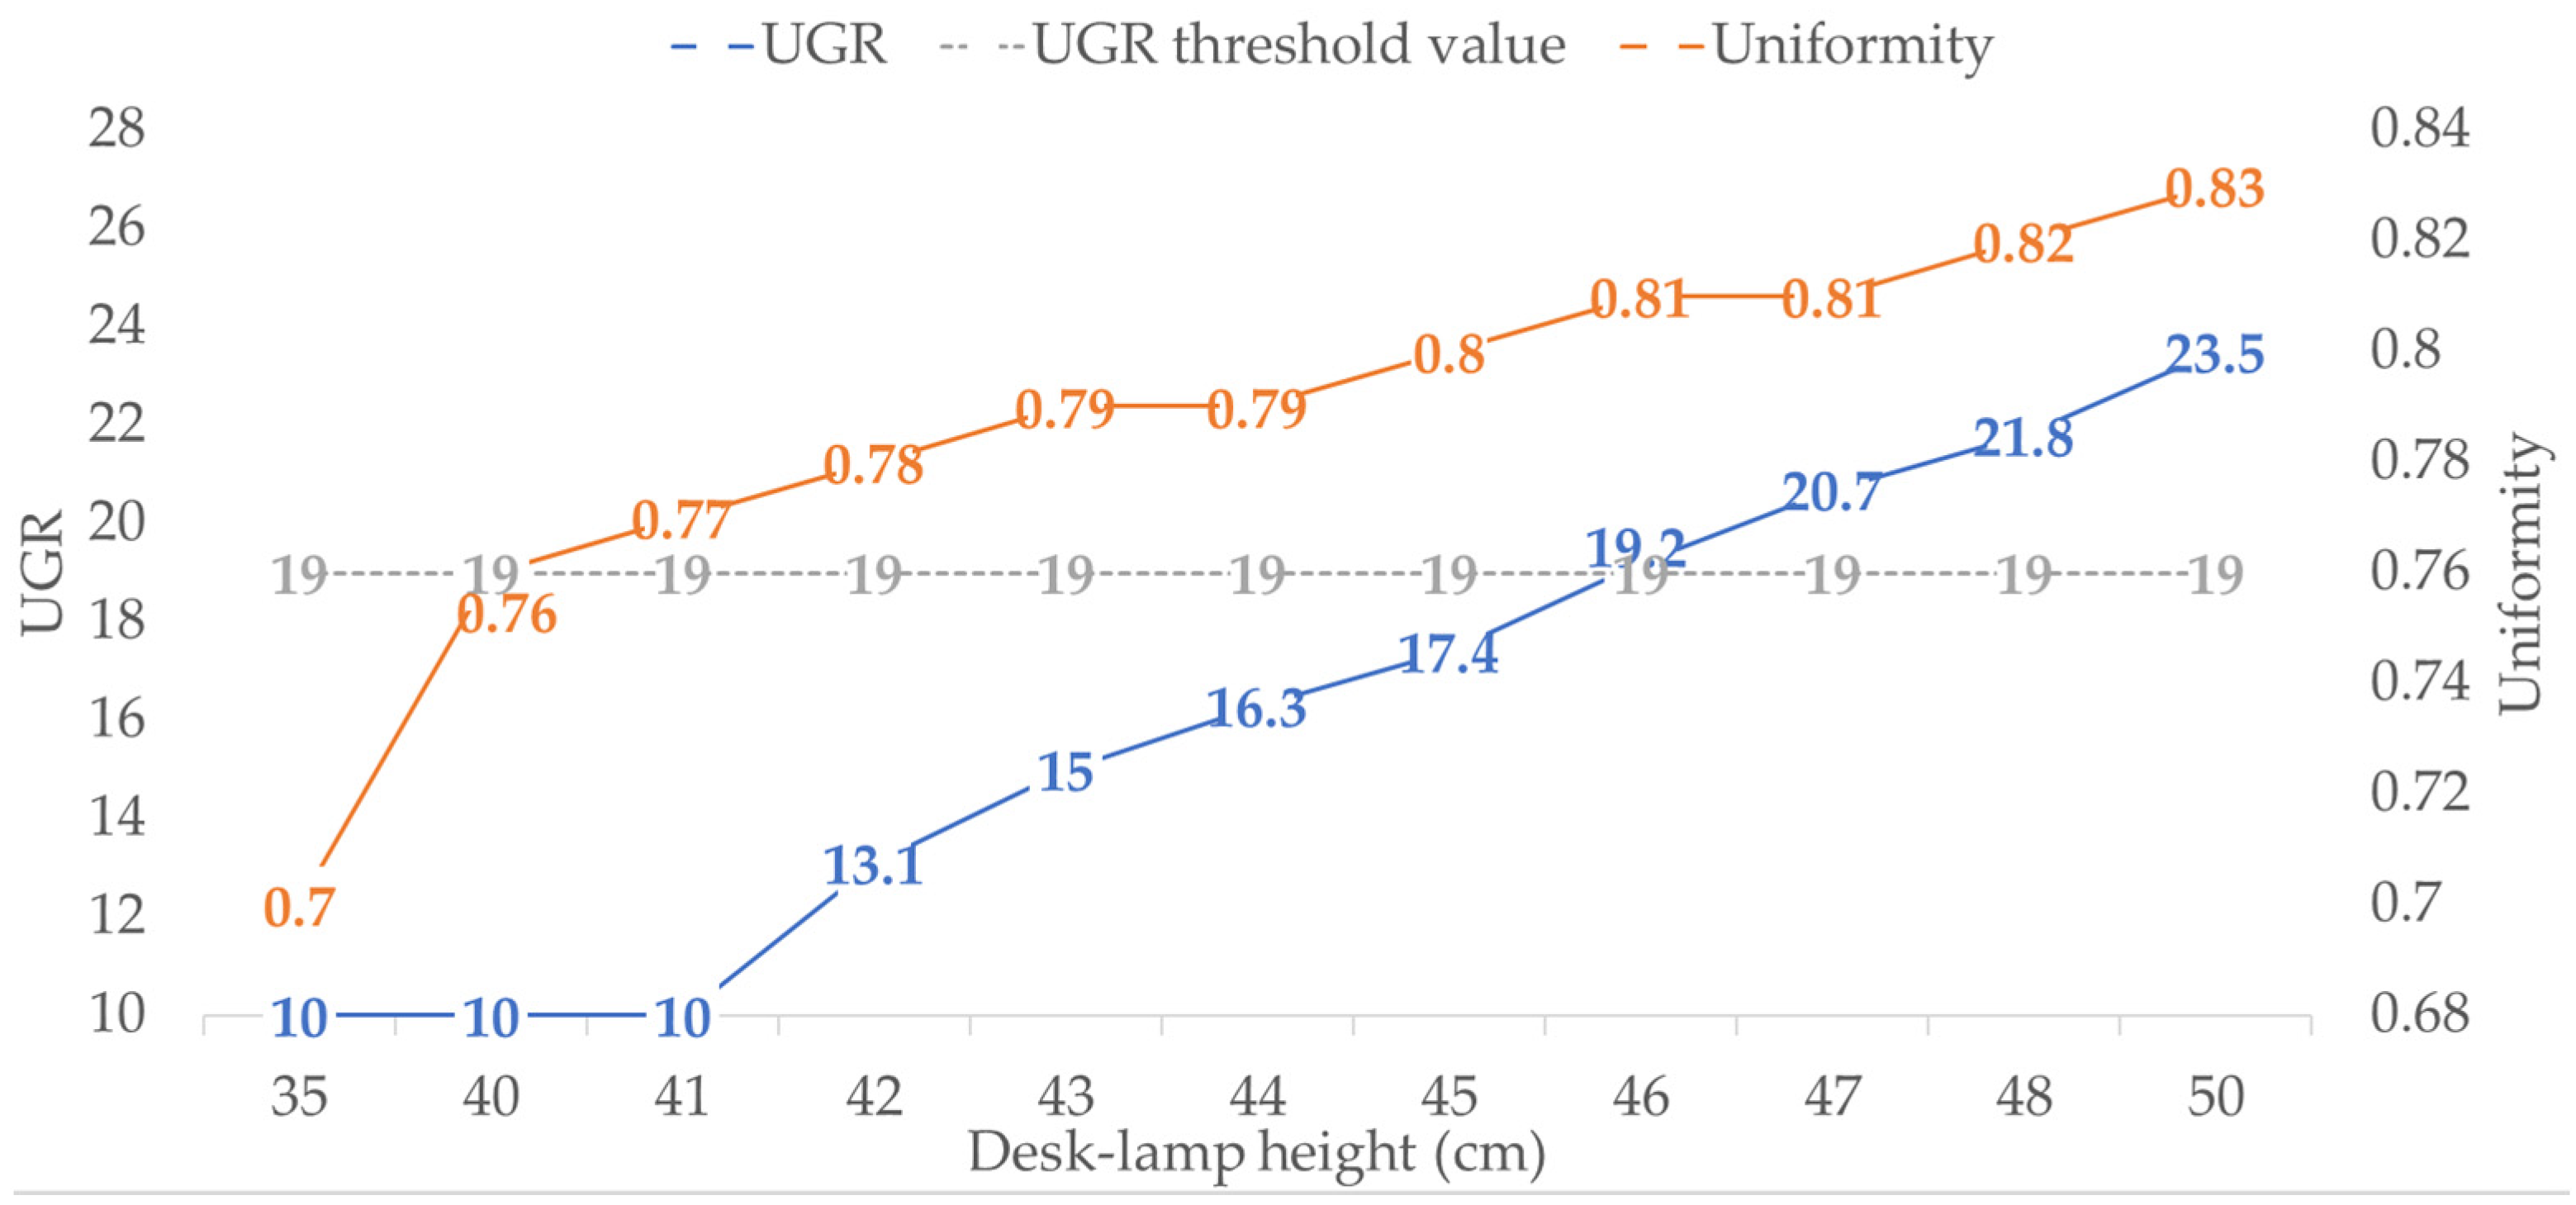
UGR and uniformity for desk lamp heights of 35–50 cm.
Applsci 10 02607 g006
Figure 7. Isoline and color illumination map (lux) with different desk lamp rotation angles: (a) 5°, (b) 4°, (c) 3°, (d) 2°, (e) 1°, (f) 0°, (g) −1°, (h) −2°, (i) −3°, (j) −4°, and (k) −5°.
Applsci 10 02607 g007
Figure 8. UGR and uniformity for a desk lamp height of 45 cm and rotation angles of 5° to −5°.
Applsci 10 02607 g008
Figure 9. 
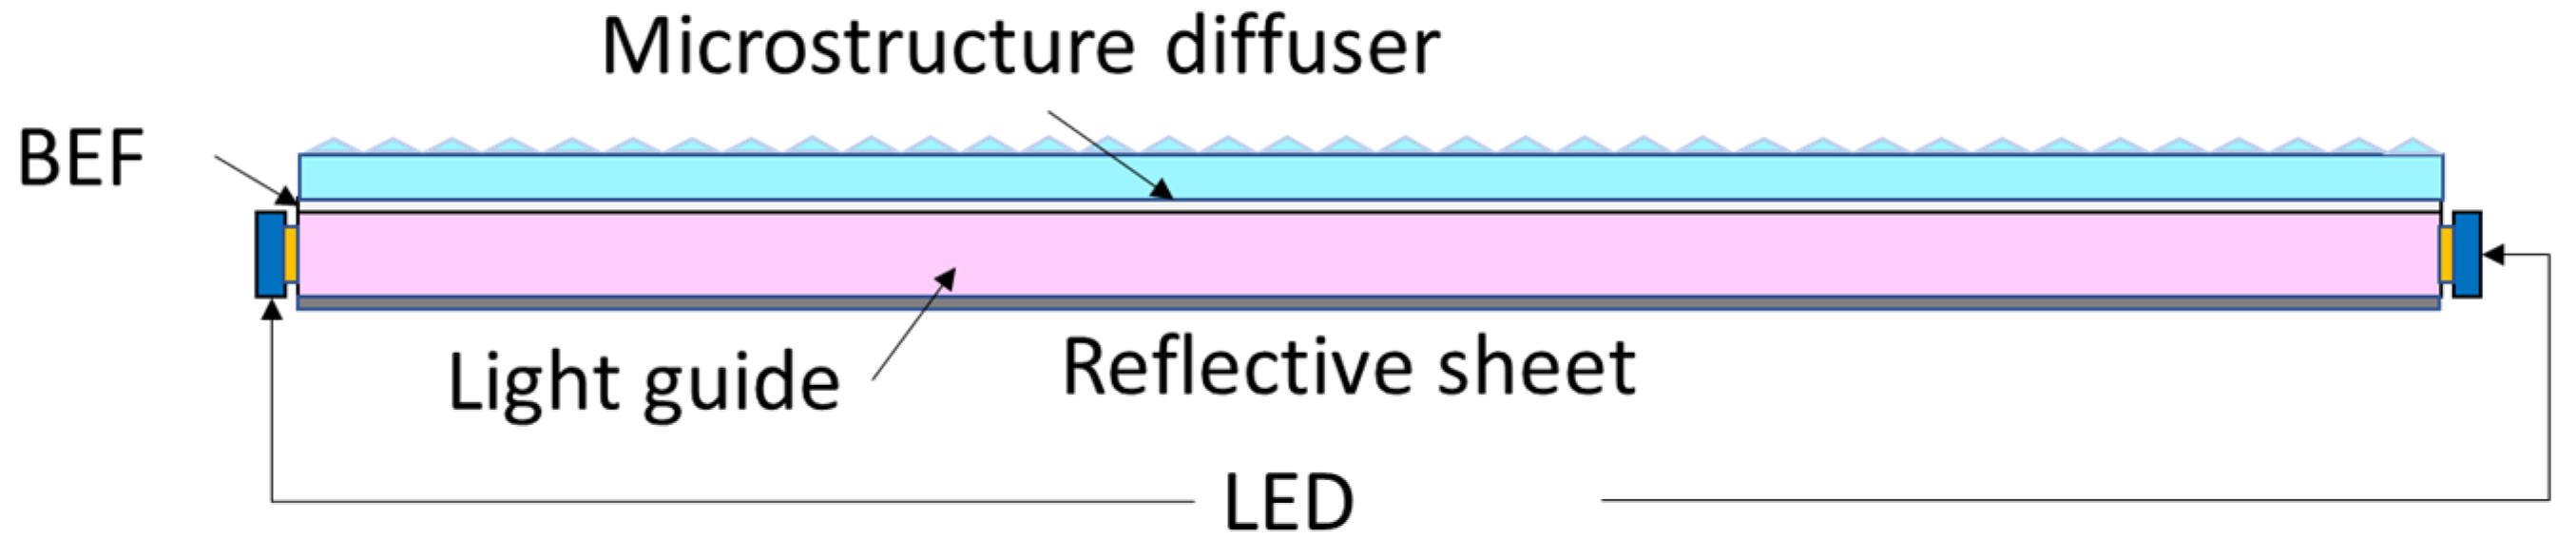
Side view of structure of the desk lamp.
Applsci 10 02607 g009
Figure 10. 
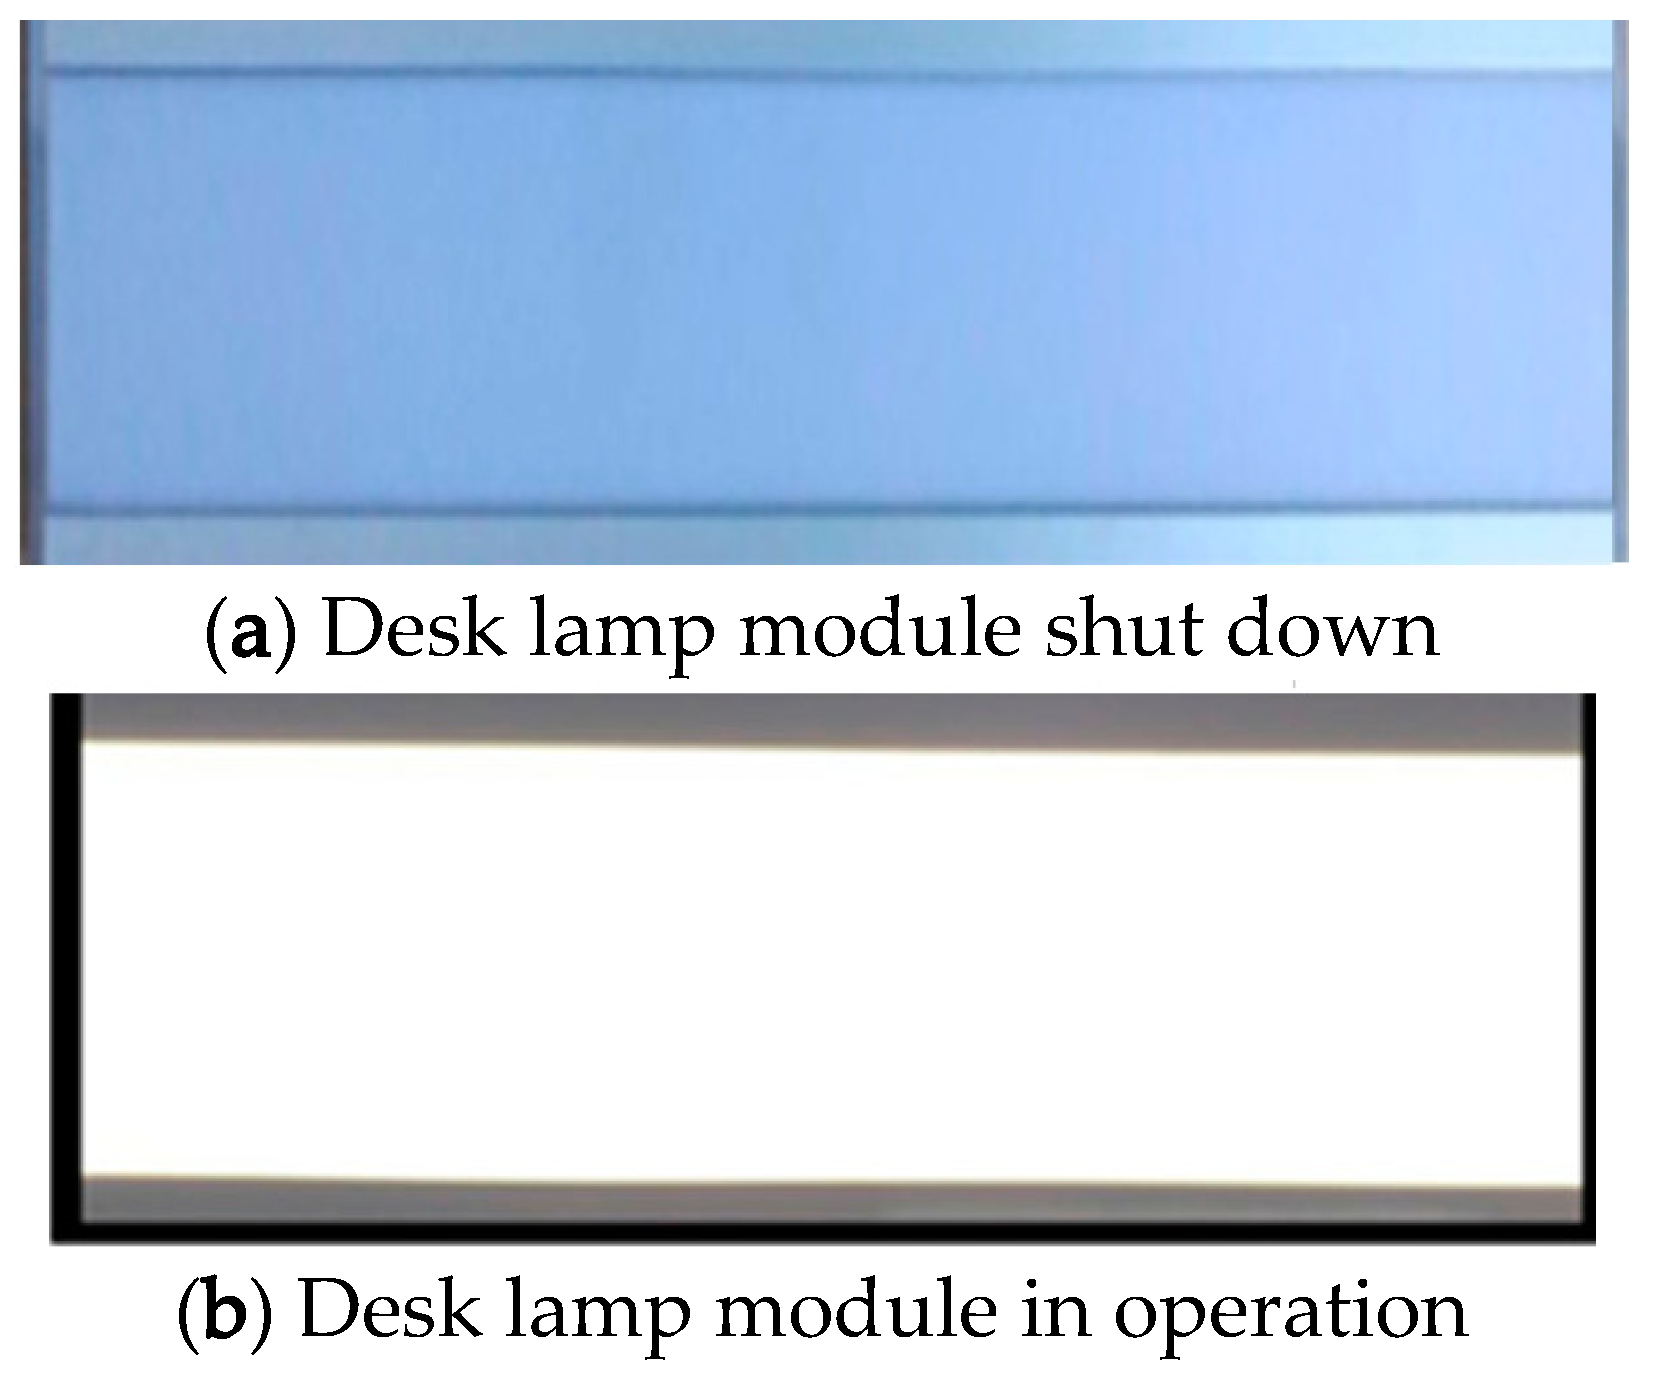
Illumination map when the desk lamp module was (a) shut down and (b) in operation.
Applsci 10 02607 g010
Figure 11. Illumination values at different heights for a beam angle of 90°.
Applsci 10 02607 g011
Table 1. Simulation setup parameters.
SymbolCharacteristics
L0 (desk length)140 cm
W0 (desk width)80 cm
L1 (calculation object length)40 cm
W1 (calculation object width)40 cm
D1 (the distance between desk lamp and observer)60 cm
H1 (the distance between desk surface and observer)40 cm
Table 2. DIALux simulation parameters.
SpecificationsCharacteristics
Luminous flux800 lumens
Reflection factors of desk surface50%
Desk lamp height (H2)45 cm
Table 3. Relationship between unified glare rating (UGR) and beam angle.
Beam Angle DegreeDesk Lamp Height H2 (cm)UGR
7045<10
804510
904517.4
1004522.6 (fail)
1104527.1 (fail)
12045>30 (fail)
Table 4. Illumination and uniformity for beam angles of 70–120°.
Beam Angle
70°80°90°100°110°120°
Average flux (lux)157113221139998891805
Minimum flux (lux)11751032911810731666
Maximum flux (lux)20531676141412201074959
Uniformity0.750.780.80.810.820.83
Table 5. Relationship between UGR and desk lamp height.
Beam Angle DegreeDesk Lamp Height H2 (cm)UGR
9035<10
9040<10
9041<10
904213.1
904315
904416.3
904517.4
904619.2 (fail)
904720.7 (fail)
904821.8 (fail)
905023.5 (fail)
Table 6. Illumination and uniformity for different desk lamp heights of 35–50 cm.
Desk Lamp Height (H2)
35 cm40 cm41 cm42 cm43 cm44 cm45 cm46 cm47 cm48 cm50 cm
Average flux (lux)1624135413071262126211781139110210661033969
Minimum flux (lux)114410301007983959935911889866845803
Maximum flux (lux)22391757167916071538147414141357130412541161
Uniformity0.70.760.770.780.790.790.80.810.810.820.83
Table 7. Relationship between UGR and rotation angle.
Beam Angle DegreeDesk Lamp Height H2 (cm)Rotation Angle (θ)UGR
9045<10
9045<10
904512.1
904514.4
904516.1
904517.4
9045−1°19.4 (fail)
9045−2°21.2 (fail)
9045−3°22.6 (fail)
9045−4°23.6 (fail)
9045−5°24.5 (fail)
Table 8. Illumination and uniformity for different desk lamp heights of 35–50 cm.
Rotation Angle (θ)
−1°−2°−3°−4°−5°
Average flux (lux)11331136113811391139113911391139113811361133
Minimum flux (lux)853866879892902911902892879866853
Maximum flux (lux)14291428142714241419141414191424142714281429
Uniformity0.750.760.770.780.790.80.790.780.770.760.75
Table 9. Comparison between simulated and measured illumination values.
Measuring Distance (m)Simulated Center Illumination Value (lux)Measured Center Illumination Value (lux)
0.2734913428
0.3621282094
0.4514141394
Table 10. Comparison between simulated and measured illumination values at the corners of the object area with a desk lamp height of 45 cm.
Measurement Coordinates (Distance from Point P1) x, y (cm)Simulated Center Illumination Value (Lux)Measured Center Illumination Value (lux)
x − 11, y − 1210481032
x − 11, y + 1210501029
x + 12, y − 1210401020
x + 12, y + 1210691046

