Article

Business Analytics in Telemarketing: Cost-Sensitive Analysis of Bank Campaigns Using Artificial Neural Networks

1
Department of Information Technology, The University of Jordan, 77110 Aqaba, Jordan
2
Department of Information Technology, The University of Jordan, 11942 Amman, Jordan
3
Department of Computer Information Systems, The University of Jordan, 77110 Aqaba, Jordan
4
Department of Management Information Systems, Yarmouk University, 21163 Irbid, Jordan
5
Department of Hotel Management, The University of Jordan, 77110 Aqaba, Jordan
*
Author to whom correspondence should be addressed.
Appl. Sci. 2020, 10(7), 2581; https://doi.org/10.3390/app10072581
Submission received: 26 February 2020 / Revised: 24 March 2020 / Accepted: 2 April 2020 / Published: 9 April 2020
(This article belongs to the Section Computing and Artificial Intelligence)

Abstract

:

Featured Application

This study attempts to mitigate the effects of highly imbalanced data in realizing an enhanced cost-sensitive prediction model. The model intends to enable telemarketing decision makers in the banking industry to have more insights on their marketing efforts, such that potential clients gain more focus based on quantifiable cost estimates.

Abstract

The banking industry has been seeking novel ways to leverage database marketing efficiency. However, the nature of bank marketing data hindered the researchers in the process of finding a reliable analytical scheme. Various studies have attempted to improve the performance of Artificial Neural Networks in predicting clients’ intentions but did not resolve the issue of imbalanced data. This research aims at improving the performance of predicting the willingness of bank clients to apply for a term deposit in highly imbalanced datasets. It proposes enhanced Artificial Neural Network models (i.e., cost-sensitive) to mitigate the dramatic effects of highly imbalanced data, without distorting the original data samples. The generated models are evaluated, validated, and consequently compared to different machine-learning models. A real-world telemarketing dataset from a Portuguese bank is used in all the experiments. The best prediction model achieved 79% of geometric mean, and misclassification errors were minimized to 0.192, 0.229 of Type I & Type II Errors, respectively. In summary, an interesting Meta-Cost method improved the performance of the prediction model without imposing significant processing overhead or altering original data samples.

Graphical Abstract

1. Introduction

Data-driven decision-making process [1,2,3,4,5,6,7] has been playing an essential part of the critical responses to the stringent business environment [4,8,9,10,11,12,13]. Identifying profitable or costly customer is crucial for businesses to maximize the returns, preserve a long-term relationship with the customers, and sustain a competitive advantage [14]. In the banking industry, there are several opportunities yet to be considered in sustaining a competitive advantage. Improving database marketing efficiency is still one of the main issues that requires intensive investigation. The nature of bank marketing data presents a challenge that is facing the researchers in business analytics [3,7,10]. The low volume of the potential target/important customer data (i.e., imbalanced data distribution) is a major challenge in extracting the latent knowledge in banks marketing data [1,3,10]. There is still an insisting need for handling the imbalanced dataset distribution reliably [15,16,17]; commonly used approaches [1,15,16,18,19,20,21] impose processing overhead or lead to loss of information.
Artificial Neural Network (ANN) models have been used broadly in marketing to predict the behavior of customers [22,23]. ANNs are supposed to discover non-linear relationships from complex domain data, e.g., in bank telemarketing data [14,24]. Interestingly, ANNs are able to generalize the “trained” model to predict the relationships of unseen inputs. In some business cases ANNs are highly competitive as they can handle any type of input data distribution [25,26,27,28]. Modifying an ANN to make it cost-sensitive is a promising approach to enhance its performance and mitigate the effects of imbalanced data distribution. Cost-sensitive methods preserve the quality of original datasets, in contrast to other methods (e.g., pre-processing the original dataset by re-sampling techniques to adjust the skewed distribution of classes) which may degrade the quality of the data [29]. In practice, bank telemarketing data are highly imbalanced (e.g., 11 % of the contacted clients in a marketing campaign may be interested to accept an offer). Therefore, a cost-sensitive ANN model is a strong candidate [1,30] to predict the willingness of bank clients to take a term deposit in a telemarketing database.
Researchers and practitioners in the field of electronic commerce have been striving to streamline and promote various business processes. For a few decades, different interesting research efforts have attempted to improve understanding of the behavior of customers using ANNs [1,14,22,23,24,26,27,31]. However, cost-sensitive algorithms have been with marginal interest to the researchers in bank marketing, while pre-processing the input dataset by re-sampling techniques to solve imbalanced class distribution have gained significant interest [1,15]. This research seeks unleashing the potentials of cost-sensitive analysis in providing enhanced bank marketing models, and reliable handling of imbalanced data distributions.
Predicting the potential bank clients who are willing to apply for a term deposit would reduce marketing costs by saving campaigns wasted efforts and resources. On the other hand, contacting uninterested clients is an incurred cost with marginal returns. It is a matter of fact that wrong prejudgments on client intentions (e.g., willing or not willing to accept an offer) have unequal consequent costs [29,30]. A marketing manager would expect a relatively higher cost of not contacting a potential client who is willing to invest than contacting an uninterested client. Therefore, it is with high value to find a reliable prediction model that takes misclassification costs into account.
Cost-sensitive approach has been proposed before to overcome the imbalanced nature of a bank telemarketing data. Cost-sensitive learning, by re-weighting instances [32], leveraging only nine features of the whole feature set was proposed in [30]. Compared to a previous study that considered re-sampling [30,33], proposed approach did not perform well. Therefore, they [30] did not recommend the use of cost-sensitive approaches to mitigate imbalance issue among bank telemarketing data. This study argues that cost-sensitive approaches are capable of handling the issue of imbalanced data. Moreover, it can improve prediction results while maintaining better reliability compared to instance re-sampling approaches. Both over-sampling and under-sampling scenarios may reduce imbalance ratio, but each scenario has its inherent shortcoming. The former scenario would result in over-fitting model while the latter discards potentially valuable instances [30]. In order to justify this claim, a wider range of cost-sensitive approaches [1,29,30,34,35] are applied and compared from different angles of view.
This research considered a highly imbalanced data [3] that is publicly released, concerning a Portuguese bank telemarketing campaign. The data alongside arbitrary cost matrix were used to generate different cost-sensitive ANN models. The generated models were evaluated using several evaluation measures. The best cost-sensitive models were compared against conventional machine-learning approaches. The main contributions of this research are:
  • Proposing a relatively reliable cost-sensitive ANN model to predict the intentions of bank clients in applying for a long-term deposit.
  • Mitigating the effects of imbalanced bank marketing data without distorting the distribution of real-world data.
  • Translating the best outcomes into a decision support formula, which could be used to quantify the estimated costs of running a telemarketing campaign.
The rest of the this paper is organized as follows: Section 2 provides the theoretical background supporting this research. The used data and proposed methodology are explained in Section 3. Experiments and corresponding results are illustrated in Section 4. A discussion of the obtained results is presented in Section 5. Conclusions, research limitations and the sought future works are stated in Section 6.

2. Theoretical Background

Telemarketing is one form of direct marketing. In telemarketing, a firm dedicates a call center to directly contact potentially interested customers/clients with offers through telephone. Telemarketing is accompanied with two merits: it raises response rates and reduces costs and allocated resources. Telemarketing campaigns become the preferred mean among banking sector to promote products or services being offered [10,27]. Due to its prevalence, ANN become the preferred classification algorithm to handle complex finance and marketing issues [14,22,23,28,31,36].
Imbalance data remains a key challenge against classification models [15,18]. The majority of literature considered re-sampling approaches, i.e., both over-sampling and under-sampling, to alleviate degradation due to the issue of imbalanced data [1,17,19,33,37]. Recent research contributions warn from the limitations and shortcomings accompany re-sampling approaches [16,38,39]. In particular, questionable reliability of produced models, i.e., while under-sampling approach may discard important instances, over-sampling approach may result in generating over-fitting models [30]. Among the vast majority of proposed approaches to replace conventional re-sampling approach, cost-sensitive classification seems to be overlooked or underestimated [1,30,34,35]. Therefore, this study aims to fill these gaps by advising a cost-sensitive-based ANN classifier, which is reliably capable of dealing with highly imbalanced datasets.

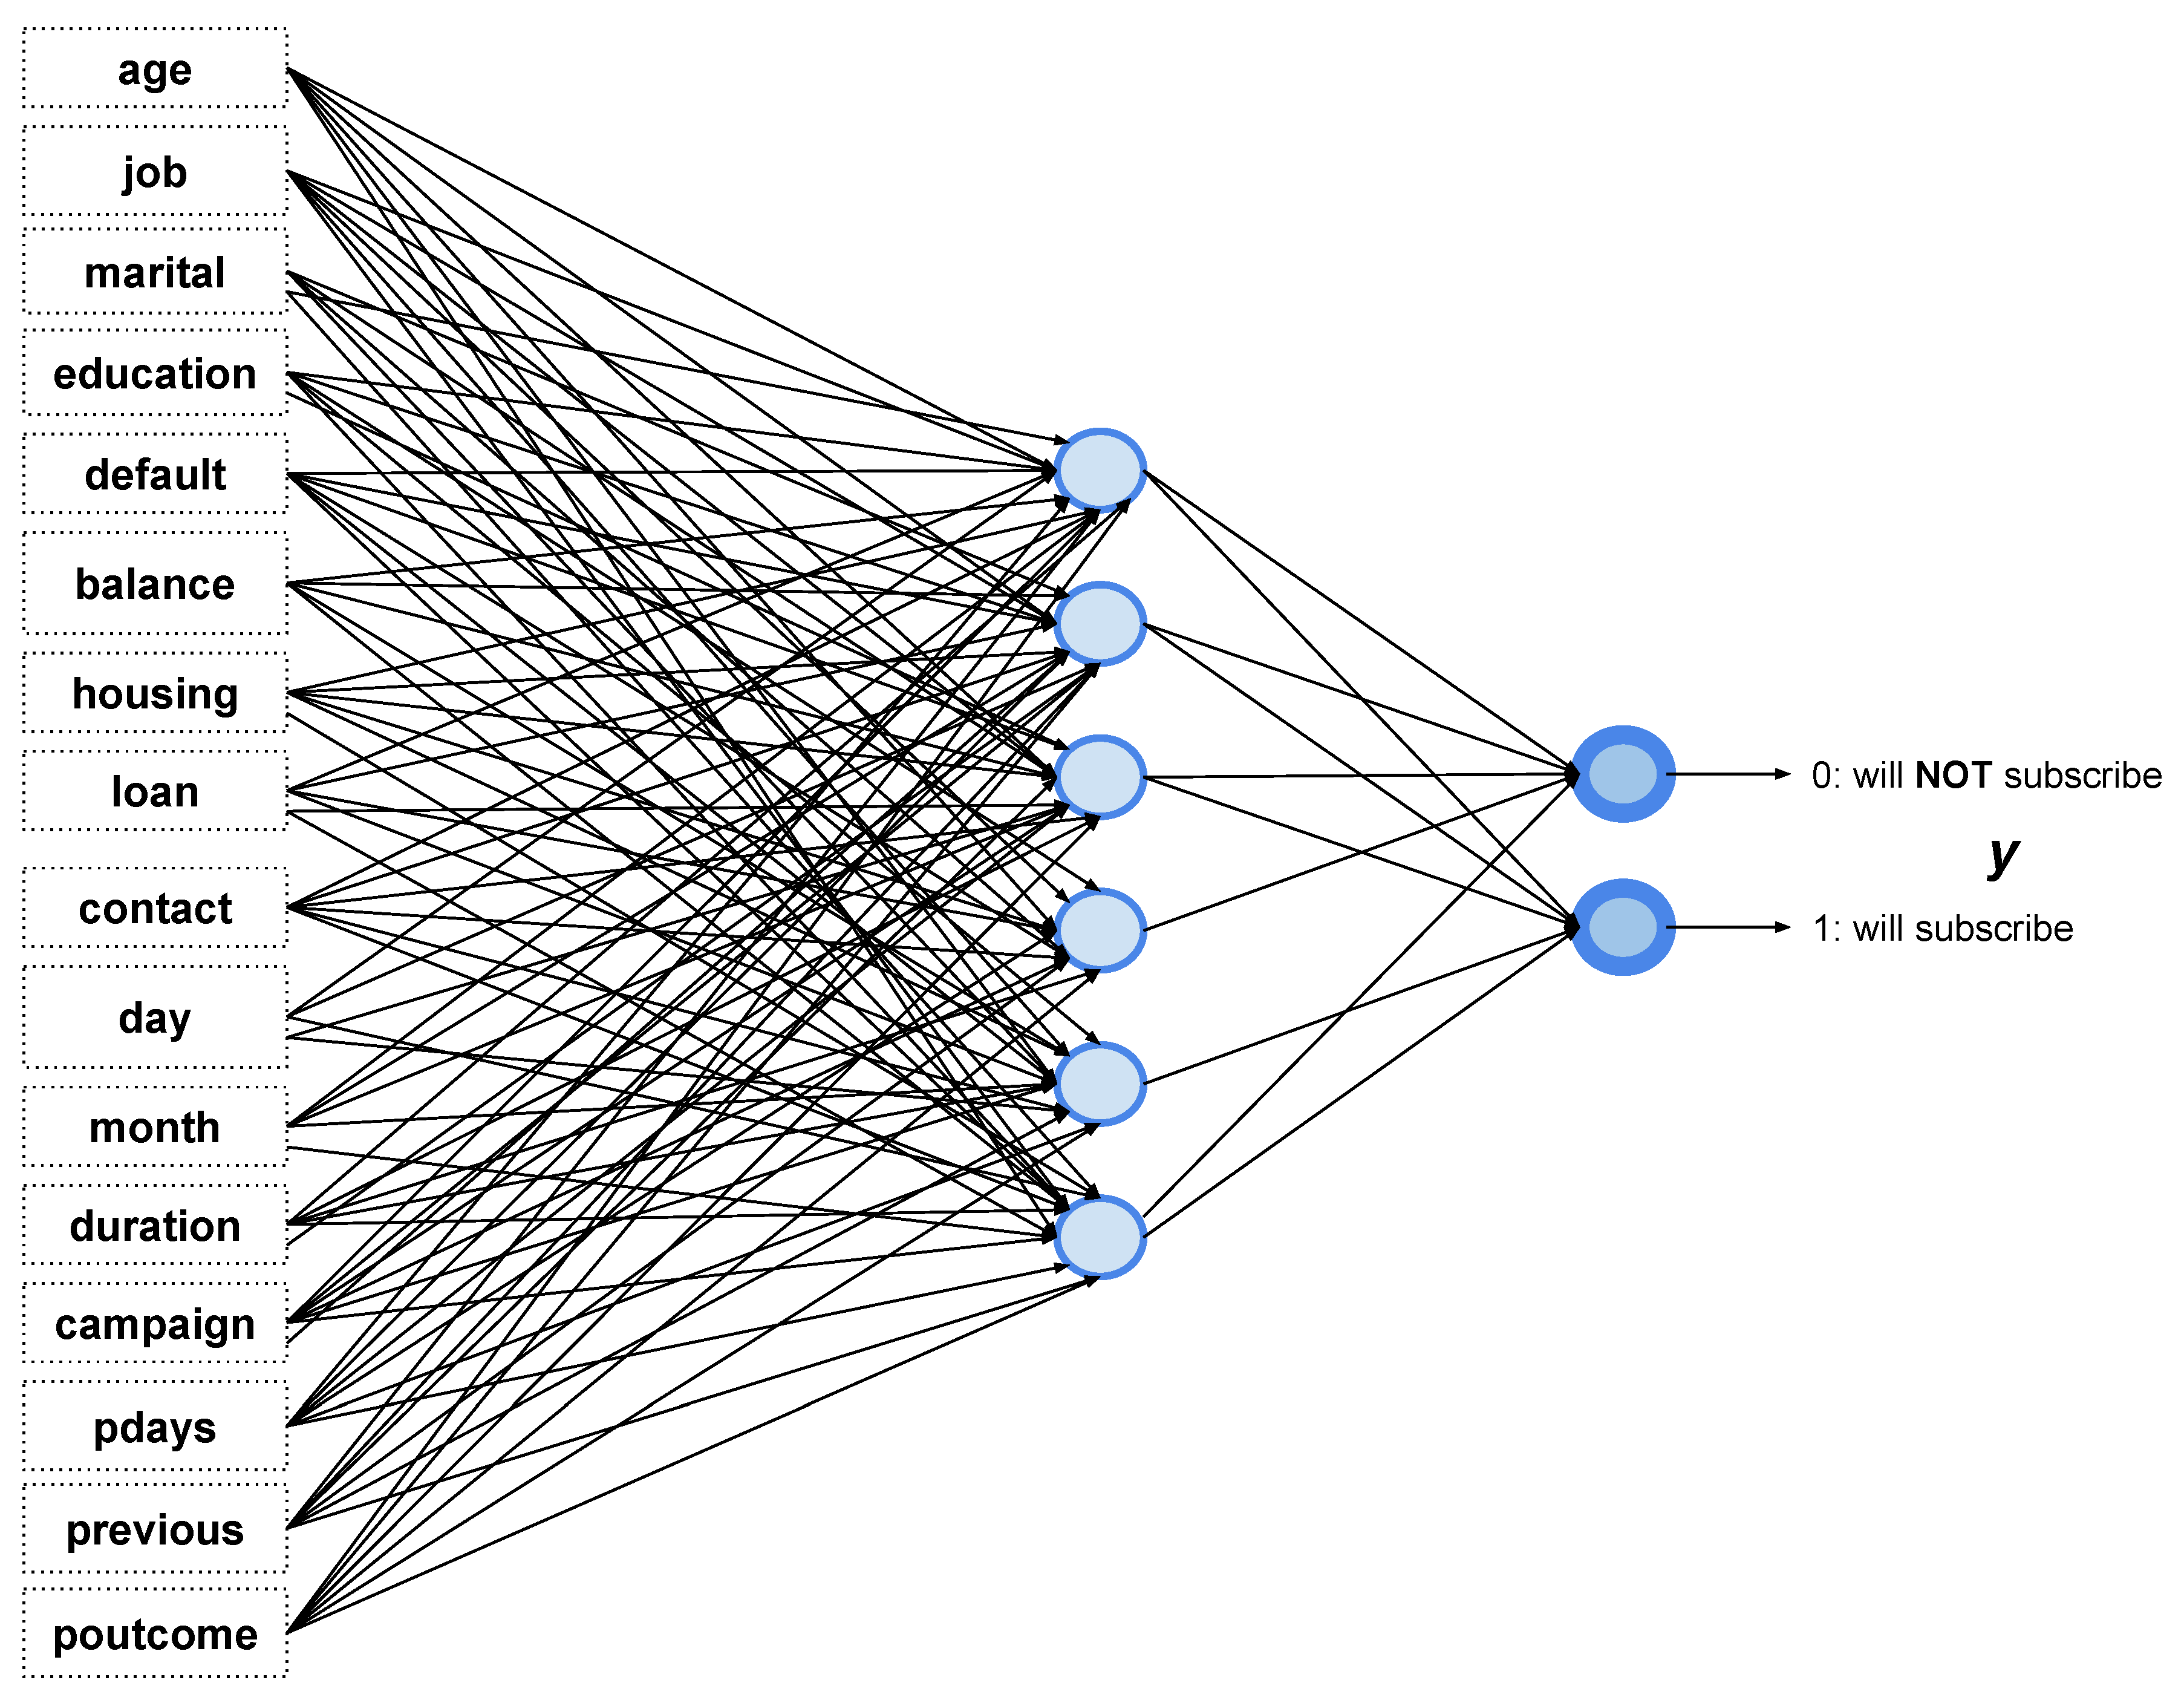
2.1. Base Classifier: Multilayer Perceptron

An Artificial Neural Network (ANN) consists of many neurons that are organized in a number of layers. The neurons are considered processing units that are updated with values according to a specific function. Such neuron values are results of a formula that processes several weights from input layer and propagate the results to subsequent layers. Therefore, it simulates the process of physiological neurons that transfer information from one node to another according to interconnection weights. Multilayer Perceptron (MLP) is a widely used special purpose implementation of ANNs that has been applied to many business domains [2,28]. A general architecture of MLP is illustrated in Figure 1, which has in this case 16 input variables at input layer. In turn, those input variables are fully connected to a hidden layer. Similarly, the hidden layer is connected to an output layer with two neurons. After the construction of a MLP-ANN, it passes a training phase, in which the weights are updated based on specific input variables that are mapped to identified output variables. The updated weights enable MLP network to predict outputs for instance with unseen input. A testing phase examines the performance of the MLP by providing input features only to the trained network, then the output layer specifies the prediction result of the network (i.e., to which class the variables belong).

2.2. Cost-Sensitive Classification

The theory behind cost-sensitive classification is to either (a) re-weight training inputs in line with a pre-defined class cost, or (b) predicting a class with lowest misclassification cost [1,40]. This scheme transforms the classifier into cost-sensitive meta-classifier. Improving the estimates probability of the base classifier is done usually by the use of bagged classifier. In essence, the predictor splits the outputs into minority or majority class according to an adjusted probability threshold. A general cost matrix C is illustrated in Equation (1). Where λ and μ denote the cost of each class misclassification.
C = 0 λ μ 0
Matrix C shown in Equation (1) is a general illustration of cost re-weighting, in which λ and μ are pre-defined cost factors that are determined by domain experts. Therefore, the classification algorithm uses matrix C to predict the minority and majority classes according to a specific probability threshold over the output of the classifier.

2.3. Cost-Sensitive Learning

In cost-sensitive learning the internal re-weighting of the original dataset instances creates an input for new classifier to build the prediction model [36,41]. With respect to MLP particularly, an update to the behavior of Naive Bayes classifier makes it cost-sensitive, which is achieved by label selection according to its cost (i.e., lowest cost) rather than those with high probability. In cost-sensitive learning, adding cost sensitivity to the base algorithm is done either by re-sampling input data [30] or by re-weighting misclassification errors [32]. Due to the raising concerns regarding reliability of re-sampling method, new trends of cost-sensitive learning shift towards re-weighting method [30].

3. Data and Methodology

This research aims to enhance the prediction accuracy of imbalanced telemarketing data leveraging cost-sensitive approaches. Such enhancement is attained by making base classifiers sensitive to different cost of target classes. Hence the cost of misclassification is supposed to be unequal [42]. Cost sensitivity is added to re-weight marketing campaign results during model building. Consequently, leaving an opportunity to improve prediction results toward class of interest. The dataset is described in Section 3.1, the proposed approach is illustrated in Section 3.2, and Section 3.3 describes the performance measures and metrics in detail.

3.1. Data Description

The public dataset is provided by [3] which includes real-world data from a Portuguese bank industry that is covering the years from May 2008 to June 2013. This research considers the Additional dataset file for model building and validation, which contains 4521 instances. There are 16 input variables divided into seven numeric and nine nominal attributes. The target variable named “y” is a binary class indicating whether a client applied for term deposit or not. All 17 variables are described in Table 1 and Table 2. The dataset is highly imbalanced as only 11.5% of the instances indicate a positive label (i.e., a client has subscribed for a term deposit), which is the class of interest in this case.

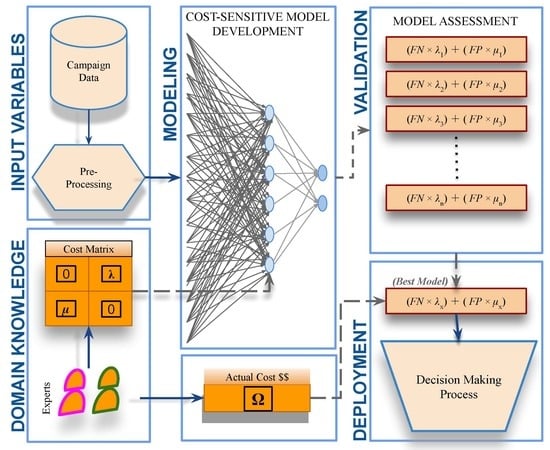
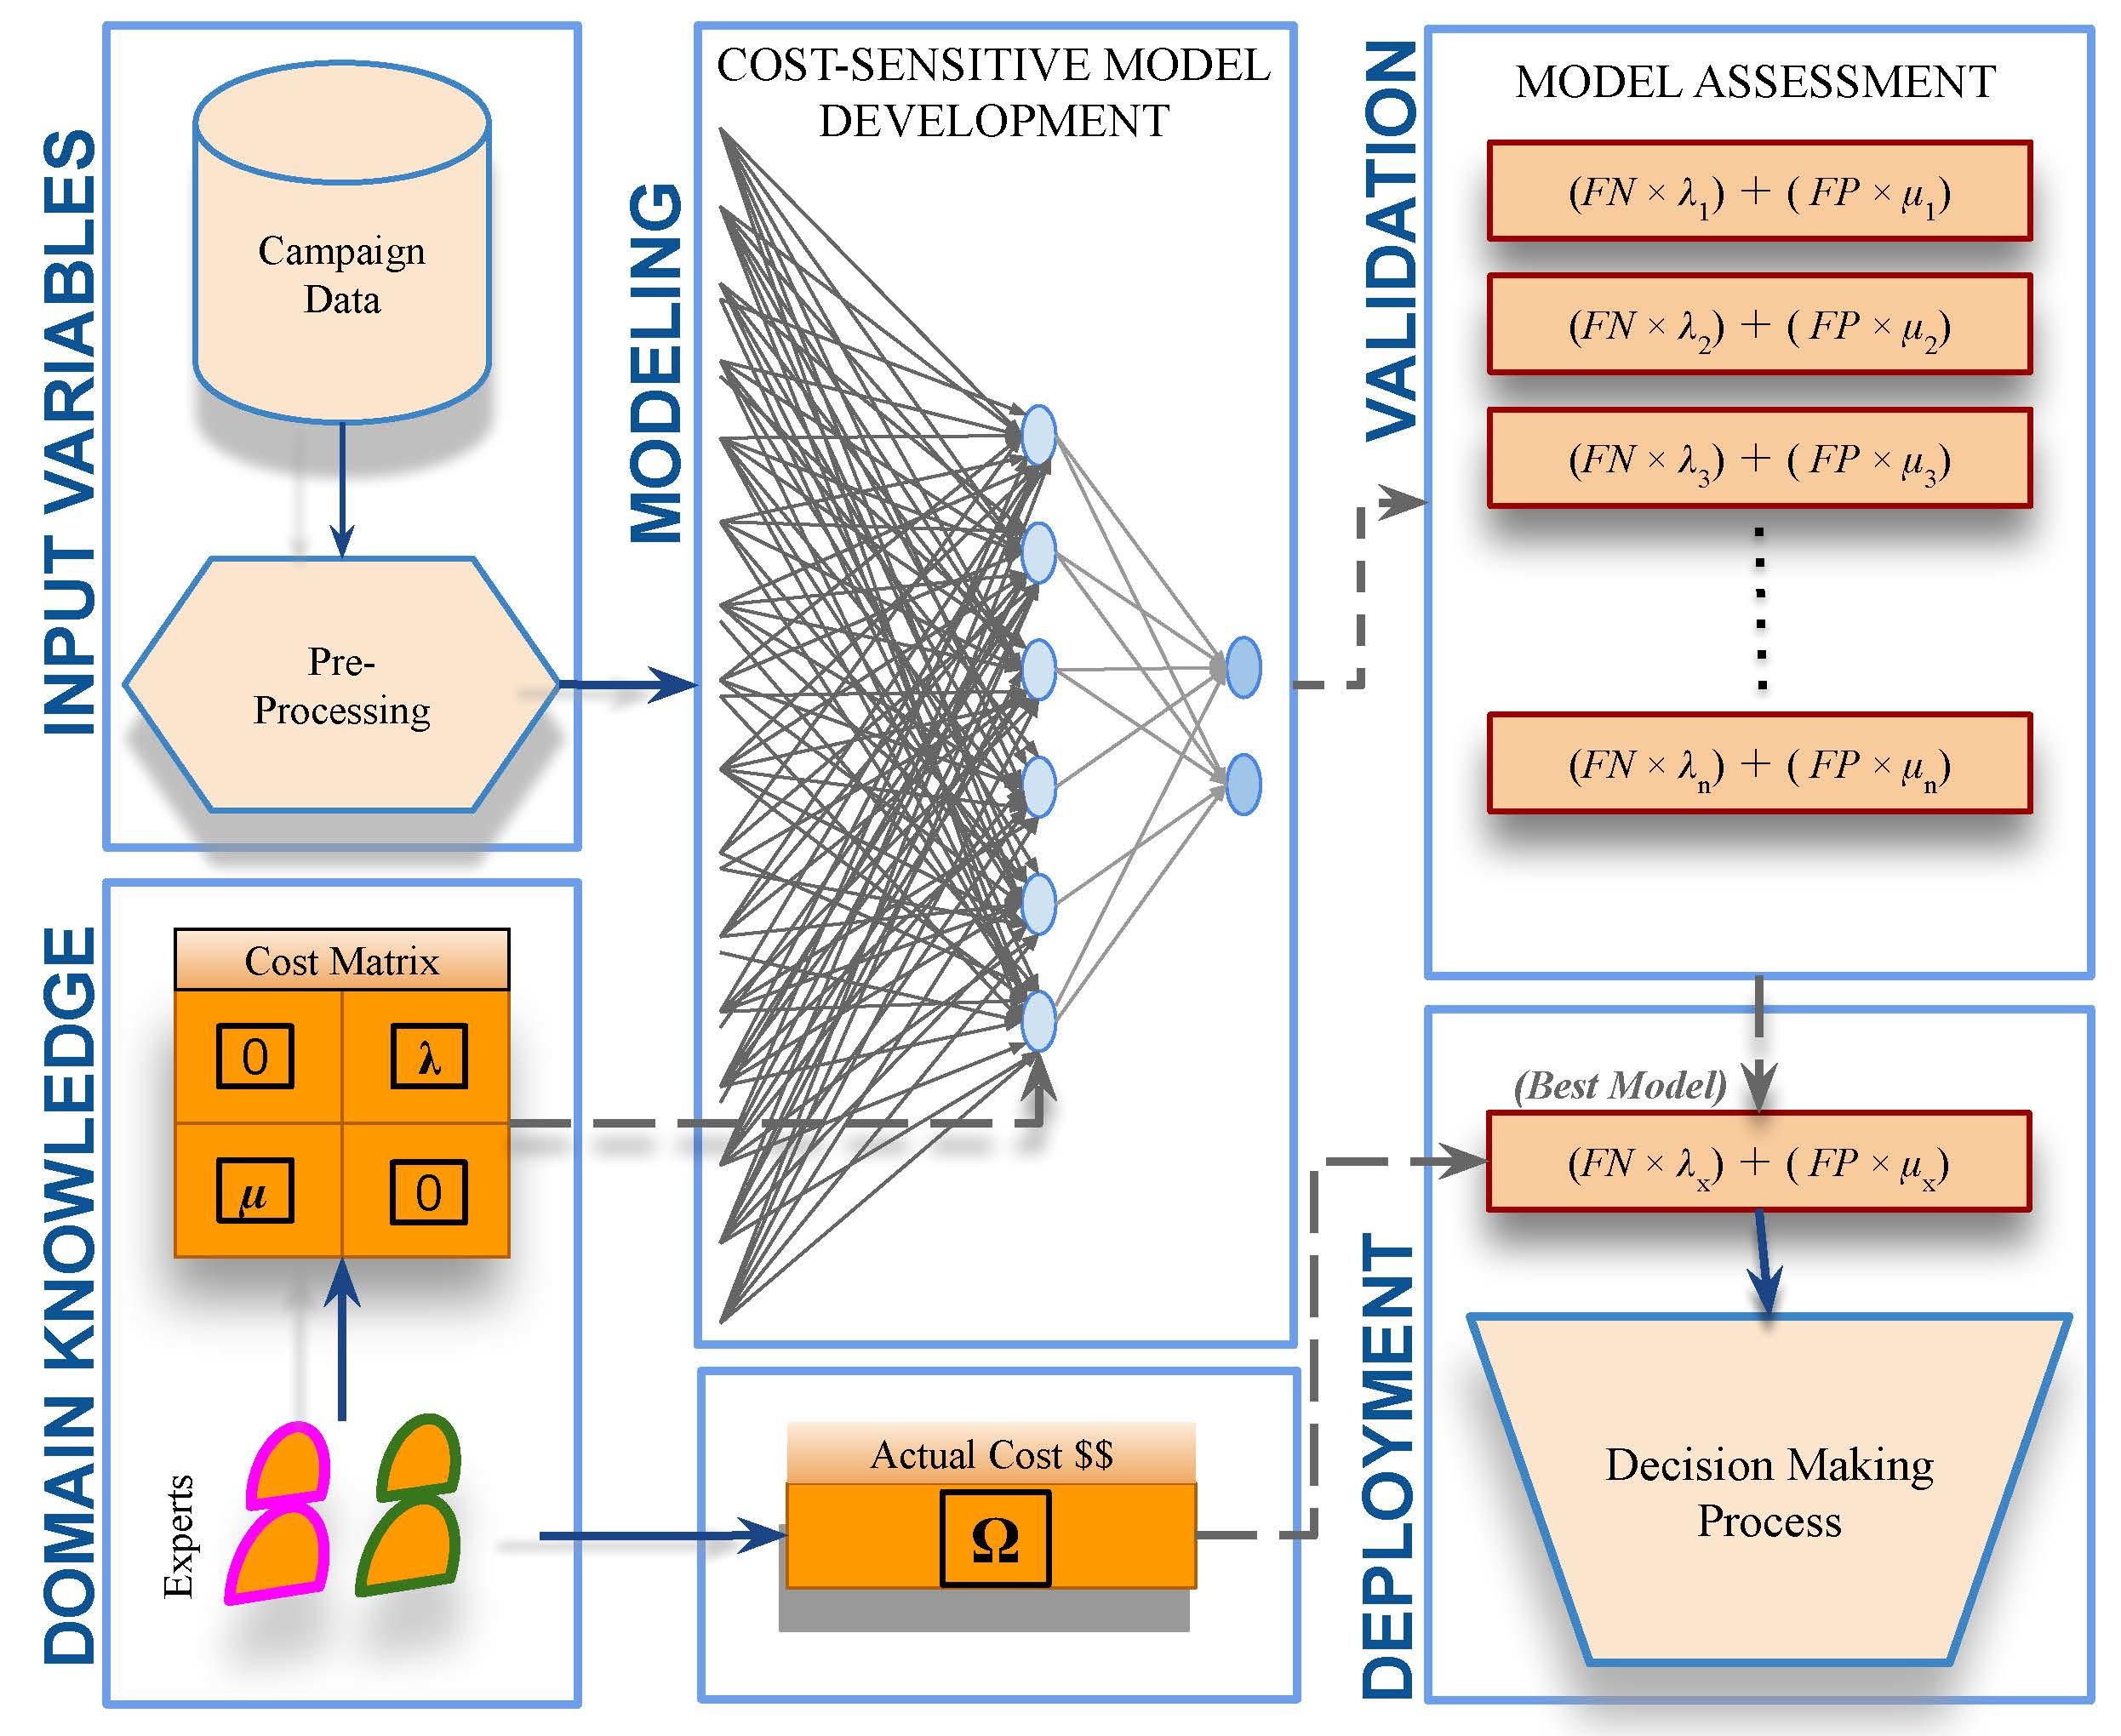
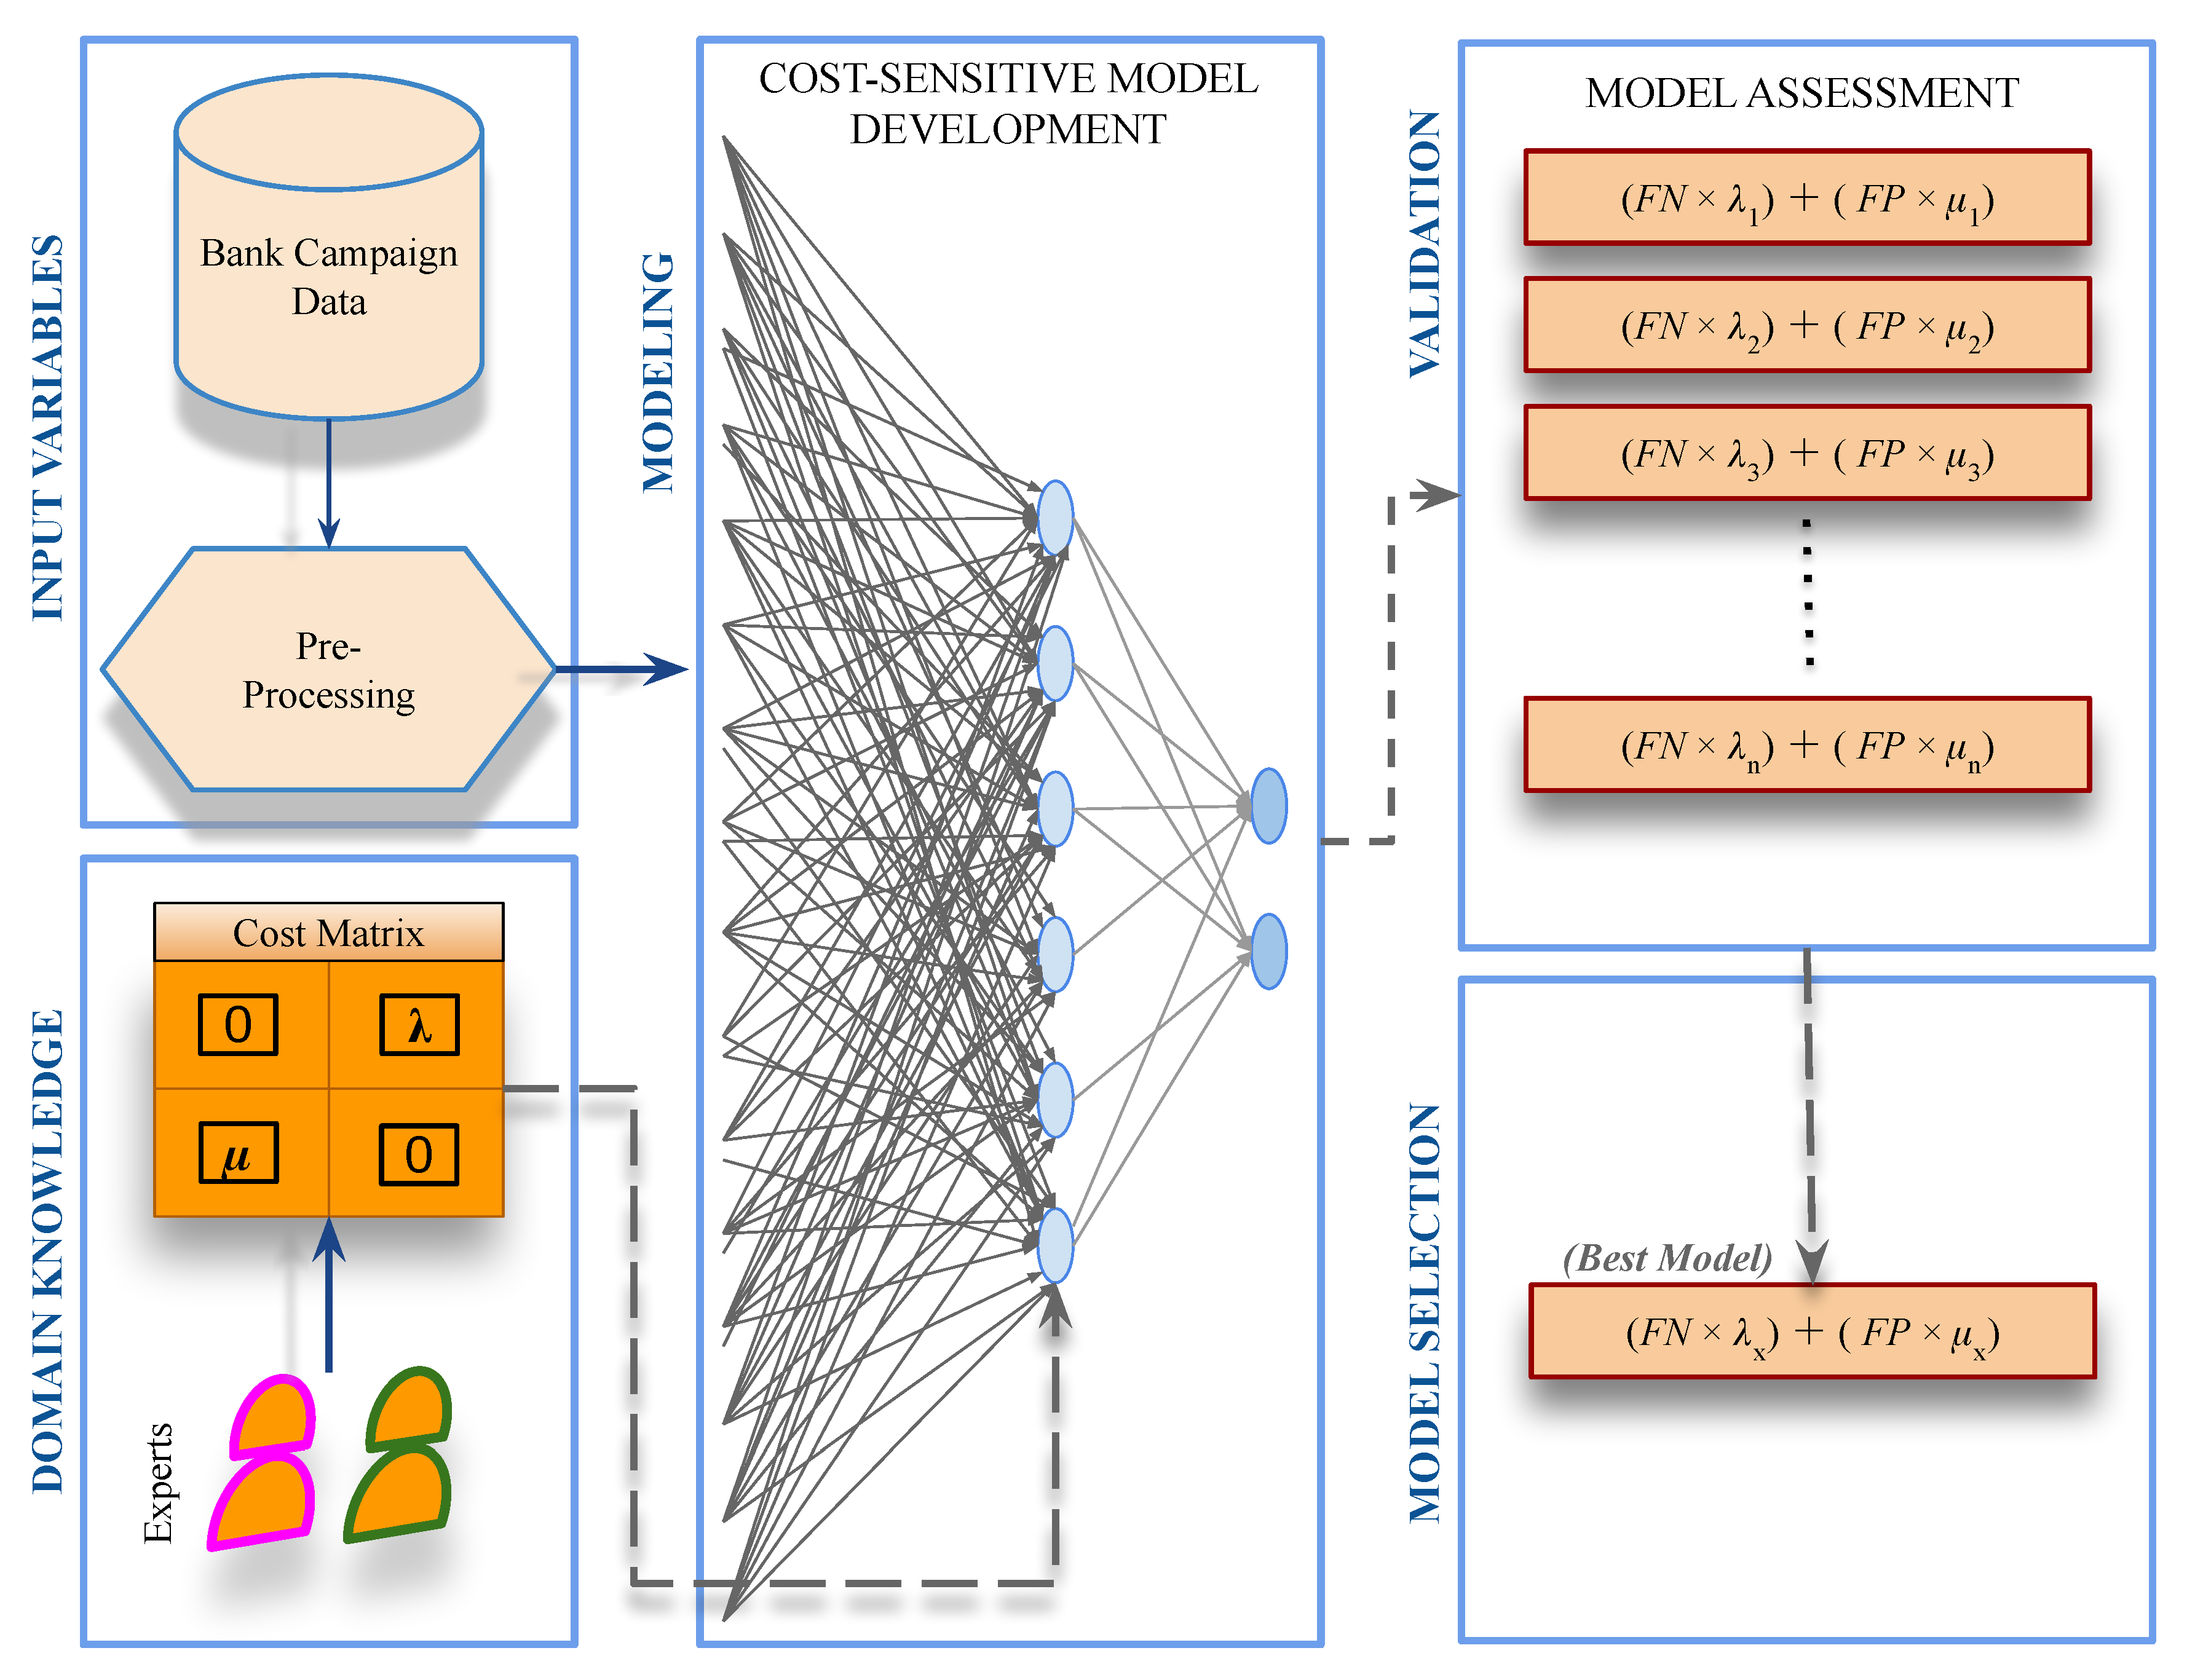
3.2. The Proposed Methodology

Basically, the phases of the proposed research scheme are: (a) data preparation (b) proposing an intuitive cost matrix, (c) adding cost sensitivity in different schemes to the classifier, and (d) assessing the resulted direct marketing prediction models. Figure 2 summarizes the main steps of the experiments.
Several classification models were constructed and evaluated in order to capture the added value by adding cost sensitivity analysis to the conventional classification algorithm. In particular, two distinct cost-sensitive methods used, namely CostSensitiveClassifier and Meta-Cost. The characteristics of these two methods are illustrated in Table 3. Furthermore, both methods are elaborated in Section 3.2.1 and Section 3.2.2 respectively. One base classifier is leveraged to evaluate each of those methods, which is MLP (Presented in Section 2.2). 10-fold cross validation scheme was maintained in all experiments. The proposed approaches do not maintain instance resample either for training or for testing.
Cost-sensitive algorithms deal with two types of cost factor, namely FN-Cost Factor and FP-Cost Factor. While the former represents an estimated loss value if a potentially deposit-take willing client is incorrectly classified as not willing to subscribe a term deposit, the latter represents an estimated loss value if an unwilling client is incorrectly classified as willing to subscribe a term deposit. Consisting with the stated objectives and in accordance with the imbalance nature of the dataset, FN-Cost Factor tuning is necessary. Usually, values of cost factors are set by domain experts. In this research, FP-Cost Factor was fixed at one, meanwhile, nine distinct values of FN-Cost Factor were examined, such that each classification model was evaluated against each FN-Cost Factor value in order to achieve a trade-off between type I and type II errors. Ordinary base classifier, MLP, was used in all experiments without any particular parameter tuning. Experimental setup configurations are shown in Table 4.

3.2.1. CostSensitiveClassifier Method

This research applied a generic “CostSensitiveClassifier” method in order to minimize the expected misclassification cost of the MLP-ANN algorithm. In which it re-weights the training instances according to the total assigned cost to every class. The assigned cost is defined by a cost matrix C.

3.2.2. Meta-Cost Method

Meta-Cost [44] method adds cost sensitivity to the base classifier, such that it generates a weighted dataset for training by labeling the estimated minimal cost classes in the original dataset. Afterwards, an error-based learner uses the weighted dataset in model building process. If the base classifier can produce understandable outcomes, then the adapted cost-sensitive classifier produces explanatory results. Combining bagging with cost-sensitive classifier is a common approach to handle imbalanced data issues. However, Meta-Cost algorithm is proven to gain better results [40,44].
Meta-Cost relies on partitioning the samples space X into x regions, where the class j in region x has the least cost. Cost-sensitive classifications aims at finding frontiers between resulted areas according to the cost matrix C. The main idea behind Meta-Cost is to find an estimate of the class probabilities P ( j | x ) then to label the training instances with their least cost classes (i.e., finding optimal classes). The pseudocode of Meta-Cost procedure is summarized and illustrated in Algorithm 1. For the sake of this particular research, Multilayer Perceptron (i.e., back-propagation artificial network) is used as base classifier [40].
Algorithm 1: Meta-Cost Algorithm (Adapted from [44])
Input: S - (Bank) training set
   L - (MLP) classification learning algorithm
   C - cost matrix
   m - number of resamples to generate
   n - number of examples in each resample
   p - True iff L produces class probabilities
   q - True iff all resamples are to be used for each example

Procedure Meta-Cost(S, L, C, m, n, p, q)
for i = 1 to m do
Applsci 10 02581 i001
for each example x in S do
Applsci 10 02581 i002
Let M = Model produced by applying L to S
Return M

3.3. Evaluation Measures

A useful visual representation of the classification results is the Confusion (Alternatively Contingency) Matrix [45]. The totals of correct predictions are presented under “True” area, while incorrect predictions totals are presented under “False” area. The outcomes of the prediction process are divided into Positive (P) and Negative (N) classes, hence this research tackles a binary classification problem. The class of interest is the positive class (i.e., a client has subscribed term deposit, y = y e s ) and the other is a negative class (i.e., a client not interested in a term deposit, y = n o ). To clarify more the predictions of the classification process, they are divided such that a True Positive ( T P ) and True Negative ( T N ) are considered correct predictions that match actual facts in the testing dataset. While False Positive ( F P ) and False Negative ( F N ) are incorrect classifications, meaning an actual negative classified as positive and actual positive classified as negative, respectively. Table 5 illustrates the organization of the classification results in the Confusion Matrix.
Furthermore, several performance metrics are derived from the confusion matrix to illustrate more the performance of the prediction model. Some of the metrics that are adopted by this research are listed in Table 6.

4. Results

This section presents the results of the experiments supporting the research methodology which is described in Section 3.2.
The intensive processing of the dataset asserts the high level of challenge in finding an accurate prediction model. Adding cost sensitivity to the classification algorithm increased dramatically the prediction accuracy of the positive class, i.e., the target class. At the same time, cost sensitivity led to relatively slight drop in the accuracy of the negative class. The effects of different cost factors on the classification performance are illustrated by Geometric Mean in Figure 3, and Type I and Type II Errors in Figure 4.
Taking into consideration the target class, i.e., bank clients who subscribed a term deposit. It is apparent that there is a positive correlation between the cost factor and the classification accuracy at FN-Cost Factor in the range 1 to 200; nonetheless, an increase of FN-Cost Factor over 200 degrades the performance of the prediction model. Interestingly, the classifiers do not attain any significant improvement in terms of geometric mean metric after the FN-Cost Factor of 10. However, it is clear that Meta-Cost algorithm outperforms Cost-Sensitive Classifier at higher values of FN-Cost Factor.
Error rates (i.e., Type I and Type II errors) reveal an interesting behavior of the cost-sensitive schemes. Meta-Cost scheme caused dramatic decrease in Type I error, while Cost-Sensitive Classifier resulted in a relatively slight increase of Type II Error. Since the target class, i.e., positive class, has more impact on the main research problem, Meta-Cost scheme of cost-sensitive analysis is proved to be a candidate solution in overcoming the issue of highly imbalanced bank marketing data. Figure 5 plots the Lift Curve of the Meta-Cost using MLP for classification with a FN-Cost Factor equals 200. The lift chart indicates the ratio of having positive responses (bank clients accept to subscribe to a term deposit) to all positive responses. According to this lift chart, reaching only 10% of the total clients by the developed prediction model we will hit 4.3 times more than if no model was applied (clients reached randomly).
To illustrate more the achieved enhancement in classification performance, Table 7 summarizes the performance of conventional machine-learning classifiers in Weka environment against the best cost-sensitive prediction models. The algorithms are namely: Lib-LINEAR (LL), i.e., an implementation of Support Vector Machines, Decision Table (DT), Very Fast Decision Rules (VFDR), Random Forest Trees (RF), Multilayer Perceptron (MLP), J48, and Deep Learning for MLP Classifier (DL-MLP). The experiments were repeated 10 times. 10-Fold Cross Validation is used to evaluate each run. Results are reported in terms of TPR, TNR, Geometric Mean, Type | Error, Type || Error, and Total Accuracy metrics. FPR for target class is reported in terms of the average and standard deviation (SD) of the 10 runs, while average of the 10 runs used to report the remaining metrics. The third part of the Table 7 (C) shows the results of the cost-sensitive analysis in [1] on the full version of a bank marketing dataset [3].

5. Discussion and Implications

All classification algorithms studied in Table 7 are sensitive against imbalanced datasets [47]. Results are expected to be biased towards the majority class, making more false negatives. In the case of this study, term deposit subscription, more interested bank clients are expected to be misclassified as uninterested (i.e., higher risk of losing potential opportunity).
Results of the experiments in this research support the propositions in [1,40,44]; which expect better results of Meta-Cost over Cost-Sensitive Classification method in some cases of imbalanced datasets. The nature of Meta-Cost method enables it to outperform other related methods in certain cases, this is apparent in the algorithms willingness to make more relevant heuristics. The overall results of using cost-sensitive approaches show classification performance improvement in comparison with classical classification algorithms. Such improvement is illustrated in Figure 6 that plots Type I and Type II errors base lines for Meta-Cost-MLP at 200 Cost Factor as comparison points with other classical classification algorithms. The base lines indicate that Type I and Type II errors are minimized to 0.192 and 0.229, respectively.
The comparison of performance asserts that Meta-Cost-based classification maintained an acceptable trade-off between Type I and II errors. Consequently, it would benefit the decision-making process in understanding and judging the probability of clients term deposit subscription.
Decision makers in the bank industry would have data-driven assessment of the risks associated with their marketing efforts. Instead of qualitative or probable subjective evaluations of marketing decisions; an objective, quantifiable, and justifiable prospective would support the decisions. Furthermore, market and client segmentation will be based on actual historical data that are derived from the market itself. Calibration of the cost Equation (2) is one of the possible data-driven risk assessment tools. In which ( F N × λ ) represents the cost not contacting the clients who are willing to apply for a term deposit, and ( F P × μ ) represents the cost of contacting uninterested clients.
T o t a l C o s t = ( F N × λ ) + ( F P × μ )
The cost of missing a potential client is much higher than contacting uninterested client. The quantification of the cost for decision makers, according to the best prediction model, is T o t a l C o s t = ( F N × 200 ) + ( F P × 1 ) = ( 100 × 200 ) + ( 918 × 1 ) = 20 , 918.00 . If a domain expert provides an equivalence of cost factor in local currency Ω , the exact cost will be T o t a l C o s t × Ω (i.e., 20 , 918.00 × Ω for the population of this study).

6. Limitations and Future Research

This research proposed an enhanced telemarketing prediction model using cost-sensitive analysis. Nonetheless, the research outcomes should be interpreted with caution and there might be some possible limitations. The issue of highly imbalanced datasets is challenging; such that it was almost impossible to completely evade its effects on the classification algorithms. The used cost matrix is an arbitrary selection of possible cost factors; domain experts should be consulted to assign realistic cost values. Cost-sensitive analysis improved the prediction accuracy of the target group; on the other side, there is a slight drop in the prediction accuracy of the second group of customer (i.e., customers not willing to apply for a term deposit). It is unavoidable to make a trade-off between Type I and Type II errors; this a fundamental characteristic of cost-sensitive methods. The ANN model itself is not self-explanatory; a representative practical model has been developed to support the streamlining of the decision-making process in the business domain. Several cost-sensitive classifiers applied; Meta-Cost classifier exhibited a high degree of granularity while maintaining best performance in most cases. Interestingly, obtained results are optimistic. Future research would attempt to overcome the research limitations and cover the areas that were difficult to be tackled in this research such as: estimating cost factor values from the perspective of domain experts. Applying real-cost values in prediction model building process. Applying the same approach on other real data. Developing self-explanatory decision process systems or algorithms.

Author Contributions

Conceptualization, N.G. and H.F.; methodology, N.G., H.F. and I.A.; software, N.G. and I.A.; validation, N.G. and I.A.; formal analysis, N.G., H.F. and I.A.; investigation, Y.H.; resources, N.G., H.F. and I.A.; data curation, N.G.; writing–original draft preparation, N.G., H.F., I.A., and Y.H.; writing–review and editing, N.G., H.F., I.A., Y.H. and A.H.; visualization, N.G. and I.A.; supervision, N.G. and H.F. All authors have read and approved the final version of the manuscript.

Funding

This research received no external funding.

Conflicts of Interest

The authors declare no conflict of interest.

References

  1. Wong, M.L.; Seng, K.; Wong, P.K. Cost-sensitive ensemble of stacked denoising autoencoders for class imbalance problems in business domain. Expert Syst. Appl. 2020, 141, 112918. [Google Scholar] [CrossRef]
  2. Bigus, J.P. Data Mining with Neural Networks: Solving Business Problems from Application Development to Decision Support; McGraw-Hill, Inc.: New York, NY, USA, 1996. [Google Scholar]
  3. Moro, S.; Cortez, P.; Rita, P. A data-driven approach to predict the success of bank telemarketing. Decis. Support Syst. 2014, 62, 22–31. [Google Scholar] [CrossRef] [Green Version]
  4. Waller, M.A.; Fawcett, S.E. Data science, predictive analytics, and big data: A revolution that will transform supply chain design and management. J. Bus. Logist. 2013, 34, 77–84. [Google Scholar] [CrossRef]
  5. Ghatasheh, N. Business Analytics using Random Forest Trees for Credit Risk Prediction: A Comparison Study. Int. J. Adv. Sci. Technol. 2014, 72, 19–30. [Google Scholar] [CrossRef]
  6. Faris, H.; Al-Shboul, B.; Ghatasheh, N. A genetic programming based framework for churn prediction in telecommunication industry. Lect. Notes Comput. Sci. 2014, 8733, 353–362. [Google Scholar]
  7. Ajah, I.A.; Nweke, H.F. Big Data and Business Analytics: Trends, Platforms, Success Factors and Applications. Big Data Cogn. Comput. 2019, 3, 32. [Google Scholar] [CrossRef] [Green Version]
  8. Chen, Y.; Guo, J.; Li, C.; Ren, W. FaDe: A Blockchain-Based Fair Data Exchange Scheme for Big Data Sharing. Future Internet 2019, 11, 225. [Google Scholar] [CrossRef] [Green Version]
  9. Liu, H.; Huang, Y.; Wang, Z.; Liu, K.; Hu, X.; Wang, W. Personality or Value: A Comparative Study of Psychographic Segmentation Based on an Online Review Enhanced Recommender System. Appl. Sci. 2019, 9, 1992. [Google Scholar] [CrossRef] [Green Version]
  10. Moro, S.; Cortez, P.; Rita, P. A divide-and-conquer strategy using feature relevance and expert knowledge for enhancing a data mining approach to bank telemarketing. Expert Syst. 2018, 35, e12253. [Google Scholar] [CrossRef] [Green Version]
  11. Gerrikagoitia, J.K.; Castander, I.; Rebón, F.; Alzua-Sorzabal, A. New trends of Intelligent E-Marketing based on Web Mining for e-shops. Procedia-Soc. Behav. Sci. 2015, 175, 75–83. [Google Scholar] [CrossRef] [Green Version]
  12. Burez, J.; Van den Poel, D. CRM at a pay-TV company: Using analytical models to reduce customer attrition by targeted marketing for subscription services. Expert Syst. Appl. 2007, 32, 277–288. [Google Scholar] [CrossRef] [Green Version]
  13. Corte, V.D.; Iavazzi, A.; D’Andrea, C. Customer involvement through social media: the cases of some telecommunication firms. J. Open Innov. Technol. Mark. Complex. 2015, 1. [Google Scholar] [CrossRef] [Green Version]
  14. Ayoubi, M. Customer Segmentation Based on CLV Model and Neural Network. Int. J. Comput. Sci. Issues 2016, 13, 31–37. [Google Scholar] [CrossRef] [Green Version]
  15. Rendón, E.; Alejo, R.; Castorena, C.; Isidro-Ortega, F.J.; Granda-Gutiérrez, E.E. Data Sampling Methods to Deal With the Big Data Multi-Class Imbalance Problem. Appl. Sci. 2020, 10, 1276. [Google Scholar] [CrossRef] [Green Version]
  16. Kaur, H.; Pannu, H.S.; Malhi, A.K. A Systematic Review on Imbalanced Data Challenges in Machine Learning: Applications and Solutions. ACM Comput. Surv. 2019, 52. [Google Scholar] [CrossRef] [Green Version]
  17. Haixiang, G.; Yijing, L.; Shang, J.; Mingyun, G.; Yuanyue, H.; Bing, G. Learning from class-imbalanced data: Review of methods and applications. Expert Syst. Appl. 2017, 73, 220–239. [Google Scholar] [CrossRef]
  18. Lin, H.I.; Nguyen, M.C. Boosting Minority Class Prediction on Imbalanced Point Cloud Data. Appl. Sci. 2020, 10, 973. [Google Scholar] [CrossRef] [Green Version]
  19. Gonzalez-Cuautle, D.; Hernandez-Suarez, A.; Sanchez-Perez, G.; Toscano-Medina, L.K.; Portillo-Portillo, J.; Olivares-Mercado, J.; Perez-Meana, H.M.; Sandoval-Orozco, A.L. Synthetic Minority Oversampling Technique for Optimizing Classification Tasks in Botnet and Intrusion-Detection-System Datasets. Appl. Sci. 2020, 10, 794. [Google Scholar] [CrossRef] [Green Version]
  20. Suh, S.; Lee, H.; Jo, J.; Lukowicz, P.; Lee, Y. Generative Oversampling Method for Imbalanced Data on Bearing Fault Detection and Diagnosis. Appl. Sci. 2019, 9, 746. [Google Scholar] [CrossRef] [Green Version]
  21. Alejo, R.; Monroy-De-Jesús, J.; Pacheco-Sánchez, J.; López-González, E.; Antonio-Velázquez, J. A Selective Dynamic Sampling Back-Propagation Approach for Handling the Two-Class Imbalance Problem. Appl. Sci. 2016, 6, 200. [Google Scholar] [CrossRef] [Green Version]
  22. Ghochani, M.; Afzalian, M.; Gheitasi, S.; Gheitasi, S. Simulation of customer behavior using artificial neural network techniques. Int. J. Inf. Bus. Manag. 2013, 5, 59–68. [Google Scholar]
  23. Kim, Y.; Street, W.N.; Russell, G.J.; Menczer, F. Customer Targeting: A Neural Network Approach Guided by Genetic Algorithms. Manag. Sci. 2005, 51, 264–276. [Google Scholar] [CrossRef] [Green Version]
  24. Elsalamony, H.A.; Elsayad, A.M. Bank Direct Marketing Based on Neural Network and C5. 0 Models. Int. J. Eng. Adv. Technol. 2013, 2, 392–400. [Google Scholar]
  25. Guresen, E.; Kayakutlu, G.; Daim, T.U. Using artificial neural network models in stock market index prediction. Expert Syst. Appl. 2011, 38, 10389–10397. [Google Scholar] [CrossRef]
  26. Zakaryazad, A.; Duman, E. A profit-driven Artificial Neural Network (ANN) with applications to fraud detection and direct marketing. Neurocomputing 2016, 175, 121–131. [Google Scholar] [CrossRef]
  27. Koç, A.; Yeniay, Ö. A Comparative Study of Artificial Neural Networks and Logistic Regression for Classification of Marketing Campaign Results. Math. Comput. Appl. 2013, 18, 392–398. [Google Scholar] [CrossRef] [Green Version]
  28. Adwan, O.; Faris, H.; Jaradat, K.; Harfoushi, O.; Ghatasheh, N. Predicting customer churn in telecom industry using multilayer preceptron neural networks: Modeling and analysis. Life Sci. J. 2014, 11, 75–81. [Google Scholar]
  29. Mitik, M.; Korkmaz, O.; Karagoz, P.; Toroslu, I.H.; Yucel, F. Data Mining Approach for Direct Marketing of Banking Products with Profit/Cost Analysis. Rev. Socionetw. Strateg. 2017, 11, 17–31. [Google Scholar] [CrossRef]
  30. Khor, K.C.; Ng, K.H. Evaluation of Cost Sensitive Learning for Imbalanced Bank Direct Marketing Data. Indian J. Sci. Technol. 2016, 9. [Google Scholar] [CrossRef]
  31. Naseri, M.B.; Elliott, G. A Comparative Analysis of Artificial Neural Networks and Logistic Regression. J. Decis. Syst. 2010, 19, 291–312. [Google Scholar] [CrossRef]
  32. Witten, I.H.; Frank, E.; Hall, M.A.; Pal, C.J. Data Mining, Fourth Edition: Practical Machine Learning Tools and Techniques, 4th ed.; Morgan Kaufmann Publishers Inc.: San Francisco, CA, USA, 2016. [Google Scholar]
  33. Kalid, S.N.; Khor, K.C.; Ng, K.H. Effective Classification for Unbalanced Bank Direct Marketing Data with Over-sampling. In Proceedings of the Knowledge Management International Conference (KMICe), Langkawi, Kedah, 12–15 August 2014; pp. 16–21. [Google Scholar]
  34. Jiang, X.; Pan, S.; Long, G.; Chang, J.; Jiang, J.; Zhang, C. Cost-sensitive hybrid neural networks for heterogeneous and imbalanced data. In Proceedings of the IEEE International Joint Conference on Neural Networks (IJCNN), Rio de Janeiro, Brazil, 8–13 July 2018; pp. 1–8. [Google Scholar]
  35. Ghazikhani, A.; Monsefi, R.; Yazdi, H.S. Online cost-sensitive neural network classifiers for non-stationary and imbalanced data streams. Neural Comput. Appl. 2013, 23, 1283–1295. [Google Scholar] [CrossRef]
  36. Elkan, C. The Foundations of Cost-sensitive Learning. In Proceedings of the 17th International Joint Conference on Artificial Intelligence, Seattle, WA, USA, 4–10 August 2001; Morgan Kaufmann Publishers Inc.: San Francisco, CA, USA, 2001; Volume 2, pp. 973–978. [Google Scholar]
  37. Chandrasekara, V.; Tilakaratne, C.; Mammadov, M. An Improved Probabilistic Neural Network Model for Directional Prediction of a Stock Market Index. Appl. Sci. 2019, 9, 5334. [Google Scholar] [CrossRef] [Green Version]
  38. Feng, W.; Huang, W.; Ren, J. Class Imbalance Ensemble Learning Based on the Margin Theory. Appl. Sci. 2018, 8, 815. [Google Scholar] [CrossRef] [Green Version]
  39. Collell, G.; Prelec, D.; Patil, K.R. A simple plug-in bagging ensemble based on threshold-moving for classifying binary and multiclass imbalanced data. Neurocomputing 2018, 275, 330–340. [Google Scholar] [CrossRef]
  40. Hall, M.; Frank, E.; Holmes, G.; Pfahringer, B.; Reutemann, P.; Witten, I.H. The WEKA Data Mining Software: An Update. SIGKDD Explor. Newsl. 2009, 11, 10–18. [Google Scholar] [CrossRef]
  41. Wang, J. Encyclopedia of Data Warehousing and Mining, Second Edition, 2nd ed.; IGI Publishing: Hershey, PA, USA, 2008. [Google Scholar]
  42. Han, X.; Cui, R.; Lan, Y.; Kang, Y.; Deng, J.; Jia, N. A Gaussian mixture model based combined resampling algorithm for classification of imbalanced credit data sets. Int. J. Mach. Learn. Cybern. 2019. [Google Scholar] [CrossRef]
  43. Ling, C.X.; Sheng, V.S. Cost-Sensitive Learning and the Class Imbalance Problem. In Encyclopedia of Machine Learning; Springer: Berlin, Germany, 2008. [Google Scholar]
  44. Domingos, P. MetaCost: A General Method for Making Classifiers Cost-sensitive. In Proceedings of the Fifth ACM SIGKDD International Conference on Knowledge Discovery and Data Mining, KDD ’99, San Diego, CA, USA, 15–18 August 1999; ACM: New York, NY, USA, 1999; pp. 155–164. [Google Scholar] [CrossRef]
  45. Powers, D.M.W. Evaluation: From Precision, Recall and F-Factor to ROC, Informedness, Markedness & Correlation; Technical Report SIE-07-001; School of Informatics and Engineering, Flinders University: Adelaide, Australia, 2007. [Google Scholar]
  46. Berry, M.J.; Linoff, G. Data Mining Techniques: For Marketing, Sales, and Customer Support; John Wiley & Sons, Inc.: New York, NY, USA, 1997. [Google Scholar]
  47. Palade, V. Class imbalance learning methods for support vector machines. In Imbalanced Learning: Foundations, Algorithms, and Applications; Wiley: Hoboken, NJ, USA, 2013; p. 83. [Google Scholar]
Figure 1. Multilayer Perceptron Artificial Neural Network (MLP).
Applsci 10 02581 g001
Figure 2. The Proposed Methodology.
Applsci 10 02581 g002
Figure 3. The effect of Adjusting FN-Cost Factor on Geometric Mean.
Applsci 10 02581 g003
Figure 4. The effect of Adjusting FN-Cost Factor on Type I and Type II Errors.
Applsci 10 02581 g004
Figure 5. Lift Curve, Meta-Cost using MLP with FN-Cost Factor of 200.
Applsci 10 02581 g005
Figure 6. Meta-Cost-MLP vs Conventional machine-learning classifiers.
Applsci 10 02581 g006
Table 1. Nominal Variables (Portuguese Bank dataset [3]).
AttributeDescriptionValuesCountPercent
jobType of jobmanagement96921.4%
blue-collar94620.9%
technician76817.0%
admin47810.6%
services4179.2%
retired2305.1%
self-employed1834.0%
entrepreneur1683.7%
unemployed1282.8%
housemaid1122.5%
student841.9%
unknown380.8%
maritalMarital statussingle119626.5%
married279761.9%
divorced52811.7%
educationLevel of educationprimary67815.0%
secondary230651.0%
tertiary135029.9%
unknown1874.1%
defaultHas credit in default accountyes761.7%
no444598.3%
housingIf there is a housing loanyes255956.6%
no196243.4%
loanHas a personal loanyes69115.3%
no383084.7%
contactType of communicationcellular289664.1%
telephone3016.7%
unknown132429.3%
monthLast contact month of the yearjan1483.3%
feb2224.9%
mar491.1%
apr2936.5%
may139830.9%
jun53111.7%
jul70615.6%
aug63314.0%
sep521.2%
oct801.8%
nov3898.6%
dec20.4%
poutcomePrevious outcome resultsfailure49010.8%
success1292.9%
other1974.4%
unknown370582.0%
y: Target ClassHas the client subscribed to a term deposit?yes52111.5%
no400088.5%
Table 2. Numeric Variables (Portuguese Bank dataset [3]).
VariableDescriptionMeanSDPercentile 25Percentile 50Percentile 75
ageInteger indicating client’s age41.1710.57633.0039.0049.00
balanceAverage yearly balance1422.663009.63869.00444.001480.00
dayLast contact day of the month15.928.2489.0016.0021.00
durationDuration of last contact in seconds263.96259.857104.00185.00329.00
campaignNumber of contacts performed during
this campaign and for this client
2.793.1101.002.003.00
daysNumber of days passed since
last campaign contact
39.77100.121−1.00−1.00−1.00
previousNumber of contacts performed for
this client from previous campaigns
0.541.6940.000.000.00
Table 3. Employed Cost-sensitive analysis algorithms.
AlgorithmTheoretical BaseWeka ImplementationBasis (Re-Sampling vs. Re-Weighting)
Cost-Sensitive ClassifierMeta-learning: Thresholding [43]CostSensitiveClassifier [40]Re-weighting
Meta-CostMeta-learning: Thresholding [43]Meta-Cost [44]Re-weighting
Table 4. Experiment Setup.
ConfigurationDescription
FN-Cost Factor ( λ )1, 5, 10, 25, 50, 75, 100, 150, 200
FP-Cost Factor ( μ )1 always
Base AlgorithmMLP
Adding Cost SensitivityCostSensitiveClassifier, Meta-Cost
Validation10-Fold Cross Validation
Target ClassYes ( the client will subscribe a term deposit )
Table 5. Confusion Matrix.
Predicted Willingness to
Take a Term Deposit
Willing toNot interested
Actual Willingness to
Take a Term Deposit
Willing to T P F N
Not interested F P T N
Table 6. Evaluation metrics that are used in this research.
MetricEquation
Total Accuracy (All Correctly Classified Instances) T P + T N T P + T N + F P + F N
True Positive Rate (TPR), alternatively Recall T P T P + F N
True Negative Rate (TNR), alternatively Precision T N T N + F P
Type I Error [45] 1 R e c a l l _ Y e s = F N T P + F N = false negative rate as α
Type II Error [45] 1 R e c a l l _ N o = F P T N + F P = false positive rate as β
Geometric Mean T P R × T N R
Lift [46] L i f t = T P R S a m p l e _ S i z e
Table 7. Performance Comparison of Different Classification Algorithms.
AlgorithmTPRTNRGeometric MeanType I ErrorType II ErrorAccuracy
(A) Our approach
Meta-Cost-MLP0.8080.77178.93%0.1920.22977.48
CostSensitiveClassifier-MLP0.6140.87273.17%0.3860.12884.18
(B) Conventional machine-learning classifiers
MLP (Baseline)0.390.9560.87%0.610.0588.98
DL-MLP0.360.9357.86%0.640.0786.24
J480.360.9658.79%0.640.0488.9
LL0.470.8362.46%0.530.1778.61
DT0.330.9756.58%0.670.0389.49
VFDR0.460.7659.13%0.540.2472.61
RF0.270.9851.44%0.730.0289.82
(C) Other cost-sensitive results from related works
CSDE * [1]0.7050.62.266.2%n.a.n.a.n.a.
CSDNN ** [1]0.6150.54257.9%n.a.n.a.n.a.
AdaCost [1]0.890.2244.2%n.a.n.a.n.a.
Meta-Cost [1]0.350.86855.1%n.a.n.a.n.a.
* CSDE: Cost-Sensitive Deep Neural Network Ensemble, ** CSDNN: Cost-Sensitive Deep Neural Network.

