Article

Soil Hg Contamination Impact on Earthworms’ Gut Microbiome

1
Swiss Federal Research Institute WSL, Zürcherstrasse 111, 8903 Birmensdorf, Switzerland
2
Swiss Federal Institute of Aquatic Science and Technology Eawag, Überlandstrasse 133, 8600 Dübendorf, Switzerland
3
Institute of Geography, University of Bern, Hallerstrasse 12, 3012 Bern, Switzerland
*
Author to whom correspondence should be addressed.
Appl. Sci. 2020, 10(7), 2565; https://doi.org/10.3390/app10072565
Submission received: 4 March 2020 / Revised: 27 March 2020 / Accepted: 27 March 2020 / Published: 8 April 2020

Abstract

:
Mercury (Hg) is one of the most toxic heavy metals and is known for its persistence in the environment and potential to accumulate along the food chain. In many terrestrial polluted sites, earthworms are in direct contact with Hg contamination by ingesting large quantities of soil. However, little is known about the impact of Hg soil pollution on earthworms’ gut microbiome. In this study, two incubation experiments involving earthworms in soils from a long-term Hg-polluted site were conducted to assess: (1) the effect of soil Hg contamination on the diversity and structure of microbial communities in earthworm, cast and soil samples; and (2) how the gut microbiome of different digestive track parts of the earthworm responds to soil Hg contamination. The large accumulation of total Hg and methyl-Hg within the earthworm tissues clearly impacted the bacterial and fungal gut community structures, drastically decreasing the relative abundance of the dominating gut bacterial class Mollicutes. Hg-tolerant taxa were found to be taxonomically widespread but consistent along the different parts of the earthworm digestive tract. This study revealed that although Hg might not directly affect the health of macro-organisms in the food-web such as earthworms, their metabolism and legacy in the soil might be impacted through changes in their gut microbiome.

1. Introduction

Mercury (Hg) is one of the most toxic non-essential trace metals in the environment and is globally considered a pollutant with high persistence in the environment. Hence, it remains a major threat to both aquatic and terrestrial ecosystems and to public health [1,2,3]. The toxicity of Hg in the soil is highly dependent on its chemical speciation. Of all its forms, methyl-Hg (MeHg) is a potent neurotoxin, which has a high potential for bioaccumulation along the food chain. The ecotoxicological impact of Hg in the soil also depends on its bioavailable fraction. Hg can adsorb to soil particles and minerals, and only a minor fraction of total Hg is soluble and thus available for microbial transformations [4]. Furthermore, soil organic matter and pH have been shown to be key abiotic factors in Hg bioavailability [5,6,7]. Similarly, the methylation of Hg into MeHg is affected by soil organic matter content and pH, as well as the ionic strength of soil particles [8,9].
Earthworms constitute up to 90% of the total faunal biomass in terrestrial ecosystems [10]. They are considered soil keystone species because they are an essential component of the soil–litter food-web, contributing to the decomposition of organic matter, the cycling of nutrients, the mixing of the organic and inorganic fractions of soil, the formation of stable aggregates, and the aeration and water infiltration of soil via their burrows. Earthworms are in direct contact with the soil, either by skin contact when moving through their habitat or by direct soil ingestion and metabolism, and are therefore potentially affected by Hg contamination. Earthworms have been observed to be relatively resistant to Hg concentrations: during an incubation experiment, they survived 28 days in a soil spiked with extremely high Hg concentrations (up to 262 mg kg−1; [4]). Nevertheless, Hg accumulation in earthworm tissues interfered negatively with their growth, reproduction, biochemistry, and genetics [4]. Furthermore, soil properties such as soil organic content, concentrations of organic acids, and pH have been shown to enhance the uptake of Hg and increase the MeHg accumulation in the organisms [11,12].
Interestingly, the ratio of methyl-Hg to total Hg (MeHg:THg) has been observed to deviate drastically in earthworm tissue compared to values in the soil [13]; it was up to 160 times higher in Eisenia fetida earthworm tissues than in the surrounding substrate [12]. However, the mechanisms behind the bioaccumulation of MeHg and THg in earthworms are still elusive. Increased MeHg:THg in earthworms could originate from a more efficient accumulation of MeHg over THg due to higher lipo-solubility [14,15]. Other lines of evidence support the idea that the methylation is controlled by the earthworm intestinal microbiome [16]. Supporting this last explanation, microbes isolated from the earthworm gut and epithelia have been observed to produce more MeHg than microbes isolated from the surrounding soil [17].
The capacity of microbes to methylate Hg relies on certain genes including the HgcAB cluster [18]. This genetic marker is phylogenetically widely dispersed within the bacterial kingdom [19]. Syntrophic and fermentative Firmicutes and Bacteroidetes, as well as many anaerobic iron- and sulfur-reducing bacteria have been found to carry these genes in their genomes [19,20]. Moreover, the abundance of these taxa has been shown to be positively correlated with total Hg content [21], implying that they are also resistant to total Hg contamination. The central gene cluster involved in the resistance mechanisms and detoxification of MeHg in microorganisms is the mer operon [22]. Among other genes, the merA gene encodes mercury reductase, which transforms Hg(II) into volatile Hg(0), and the merB gene is associated with the demethylation of Hg [23]. MerA gene abundance was found to increase drastically with soil Hg content [24], especially in soils with an acidic pH (<7), when a higher proportion of the Hg was bioavailable [5].
Limited information is available on the impact of Hg on the diversity, abundance, and function of earthworm gut microorganisms and their role in Hg transformation. The degree to which microbes are sensitive or tolerant to Hg is highly variable [21,24,25]. Generally, higher Hg contamination is reflected in decreased microbial abundances and shifts in community structures (e.g., [5]). However, the response of microbial diversity depends on the soil characteristics, and alpha diversity has been found to be positively correlated with total Hg concentration [5,21].
In this study, we investigated the impact of Hg soil contamination on earthworms’ gut bacterial and fungal communities. We conducted two incubation experiments to assess: (1) the effect of soil Hg contamination on the diversity and structure of microbial communities in earthworm, cast and soil samples; and (2) how soil Hg contamination affects the gut microbiome along the earthworm digestive tract. We hypothesized that Hg contamination in the soil would affect the diversity and community composition of bacteria and fungi in earthworms, as well as in their casts and in the soil. Moreover, we expected microbial taxa to show different levels of tolerance to Hg. Finally, we predicted that the microbial community structure along the earthworm digestive track would be differentially affected by Hg, with certain gut parts hosting more resistant communities than others.

2. Materials and Methods

2.1. Experimental Set-up

Two experiments were performed in 5-L polypropylene pots (19 cm in diameter) with perforated lids, where soil and earthworms were incubated. For both experiments, soils were collected (in October 2015 for experiment 1 and October 2016 for experiment 2) in a field near the town of Raron in Canton Valais, Switzerland (46°18′10.6″ N, 7°48′34.2″ E), where long-term severe Hg pollution had been reported [24,26,27,28]. The pollution originated from sediments of a canal that received a large amount of Hg (estimated at 50 to 250 tons) from ca. 1930 until 1976, released from industrial waste located upstream along the canal. Subsequently, the sediments from the canal were used to flatten and improve the nearby fluvial soils for pasture on several occasions between ca. 1930 and 1990.
Experiment 1 tested the effect of a Hg contaminated soil layer on the microbial communities of earthworm, cast and soil samples. In experiment 1, a total of 12 pots were used. Six pots were filled with 15 cm of a mix of 70% garden soil and 30% quartz sand. The other 6 pots were filled with 10 cm of the mixed soil, followed by a 5-cm layer of Hg-contaminated soil collected at the polluted site. Total Hg in the contaminated soil averaged 36.1 ± 4.8 µg Hg g−1 and methyl-mercury (MeHg) averaged 4.6 ± 0.5 µg g−1 (Table 1). Fine-cut iceberg lettuce (28 g) was placed on the soil surface of each pot every four days. Earthworms (Lombricus terrestris; origin Canada) were purchased in a local fishing shop as it was logistically impossible to collect local ones at the time of the experiment. Earthworms were kept in the uncontaminated mixed soil for a week for acclimation, and their gut systems were emptied by keeping the earthworms in boxes with only wet tissue for 2 days before the start of the experiment. Four worms were subsequently placed in each experimental pot and kept there in the dark at 20 °C for 10 days. The total mass of the four earthworms averaged 17.2 g per pot. At the end of the experiment, the earthworms were washed, their gut emptied again for 2 days following the same protocol before they were shock-frozen with liquid nitrogen. The frozen earthworm tissue was subsequently ground into powder to obtain homogenized samples. Earthworm casts were collected from the soil surface of each pot at the end of the experiment, weighed, homogenized and stored at −20 °C until further analysis.
Experiment 2 tested the effect of Hg contaminated soil on the gut microbiome of different parts along the earthworm digestive track. In experiment 2, a total of 16 pots were filled completely with soil from the vicinity of the Hg-polluted site in Raron. Half of the pots (8) were filled with highly Hg-contaminated soil (36.1 µg Hg g−1) collected very close to the contaminated canal, where soil Hg levels were previously found to be the highest [24]. The remaining eight pots were filled with uncontaminated soil (0.25 µg Hg g−1) collected about 100 m away from the canal. Earthworms (Lombricus terrestris) were collected from the vicinity of the WSL research institute in Birmensdorf, Canton Zürich, Switzerland (47°21′43.9″ N, 8°27′21.4″ E), and their gut systems were emptied for two days. Four earthworms were then added to each pot, with a total biomass per pot of 8.9 g at the start of the experiment. The pots were kept in the dark at 20 °C for two weeks. At the end of the experiment, the earthworms were washed, their gut systems were emptied for two days, and they were then weighed, shock-frozen with liquid nitrogen and stored at −20 °C. The gut system of each earthworm was extracted and divided into three parts: stomach, upper gut and lower gut. The upper and lower gut parts were further washed with sterile buffer to separate microbial cells attached to the worm tissue from those in the remaining soil in the gut. The dissection resulted in five parts: stomach (Sto), upper gut tissue (UgT), upper gut soil (UgS), lower gut tissue (LgT), and lower gut soil (LgS).

2.2. Soil Physico-Chemical Parameters

Soil samples were dried overnight at 105 °C to measure their gravimetric water content. Soil texture was determined by the hydrometer technique according to Gee and Bauder 1986 [29]. The pH was measured in a soil–extractant ratio of 1:2 using a glass electrode linked to a pH meter (FEP20-FiveEasy Plus, Mettler-Toledo GmbH, Greifensee, Switzerland). Around 2 g of well-homogenized soil was milled with a Teflon ball mill, and around 40 mg of soil was subsequently weighed into tin capsules for measurement of the total carbon (TC) and total nitrogen (TN) concentrations with a CHN analyzer (Shimadzu, Tokyo, Japan). Water-extractable Hg was extracted in a slurry with milli-Q water (1:10 g soil mL−1) for 16 h [13,30]. Total Hg concentrations in soils were analyzed using a direct mercury analyzer (AMA 254 Mercury Analyzer, LECO Corporation, St. Joseph, MI, USA; detection limit 0.001 µg Hg g−1 dw). Water-extractable Hg concentrations were determined in the Environmental Chemistry Laboratory (cLab) of the Institute of Geography of the University of Bern with the method detailed in Gygax et al. 2019 [27] using an inductively coupled plasma mass spectrometer (ICP-MS, 7700×, Agilent Technologies, Santa Clara, California, USA). MeHg concentrations were also performed at the cLab as described in Gygax et al. 2019 [27]. Briefly, the MeHg was selectively extracted from the solid samples using first hydrochloric acid and then dichloromethane. The extracted MeHg was then back-extracted in a L-cysteine solution. The MeHg was then quantified using High Performance Liquid Chromatography (HPLC, 1290 series, Agilent Technologies, Japan) coupled to ICP-MS. The method’s limit of detection for total Hg in solution and MeHg in solids were 0.003 µg Hg L−1 and 1 ng Hg g−1 respectively.

2.3. Sequencing of Bacterial and Fungal Ribosomal Markers

Total genomic DNA was extracted from 0.5 g sieved soil (2 mm) or earthworm tissue using the PowerSoil DNA Isolation Kit (MO-BIO Laboratories, Carlsbad, CA, USA). DNA concentrations were determined using PicoGreen (Molecular Probes, Eugene, OR, USA). PCR amplification of partial bacterial small-subunit ribosomal RNA genes (region V4–V5 of 16S) and fungal ribosomal internal transcribed spacers (region ITS2) was performed using 50 ng of DNA, as described previously [31]. Each sample was amplified in triplicate and pooled before purification with Agencourt AMPure XP beads (Beckman Colter, Berea, CA, USA) and quantified with the Qubit 2.0 fluorometric system (Life Technologies, Paisley, UK). Amplicons were sent to the Genome Quebec Innovation Center (Montreal, QC, Canada) for barcoding using the Fluidigm Access Array technology and paired-end sequencing on the Illumina MiSeq v3 platform (Illumina Inc., San Diego, CA, USA).

2.4. Quantitative PCR of Bacterial and Fungal Ribosomal Markers and Mercury Resistance Genes

Relative abundances of the bacterial 16S rRNA gene, fungal ITS, and mercury reductase (merA)-rRNA copies were determined by quantitative real-time PCR (qPCR) on an ABI7500 Fast Real-Time PCR system (Applied Biosystems, Foster City, CA, USA). The same primers (without barcodes) and cycling conditions used for the sequencing approach were used for the 16S and ITS. PCR amplifications of the merA gene were performed with the merAF and merAR primers [32], as described previously [24]. Three standard curves per target region (correlations ≥0.997) were obtained using tenfold serial dilutions (10−1 to 10−9 copies) of plasmids generated from cloned targets [33].

2.5. Sequence Analyses

Quality control of bacterial and fungal reads was performed as described previously [24] using a customized pipeline implemented in USEARCH [34]. Briefly, paired-end reads were matched with USEARCH [35], substitution errors were corrected using Bayeshammer [36], PCR primers were detected and trimmed (allowing for 1 mismatch, read length >300 bp for 16S and >200 bp for ITS primers) using Cutadapt [37]. Sequences were dereplicated and singleton reads removed prior to clustering into OTUs at 97% identity using USEARCH with an “on-the-fly” chimera detection algorithm [38].
Taxonomic assignments of the OTUs were obtained using a Bayesian classifier [39], with a minimum bootstrap support of 60% implemented in MOTHUR [40], by querying the bacterial (16S) and fungal (ITS) reads against the SILVA [41] and UNITE [42] reference databases, respectively. Raw sequences were deposited in the Sequence Read Archive of the National Center for Biotechnology Information (NCBI; Bethesda, Maryland, USA) under the accession numbers PRJNA596961 (experiment 1) and PRJNA597016 (experiment 2). After filtering, 476,622 reads were mapped to 2914 bacterial OTUs and 380,624 reads to 1104 fungal OTUs for experiment 1. For experiment 2, 512,163 reads were mapped to 2931 bacterial OTUs and 1,307,870 reads to 3094 fungal OTUs after filtering processes. Several samples in experiment 2 had very low coverage, potentially due to the small amount of DNA recovered from the earthworm tissues or to the small number of microbial cells in comparison to animal tissue. We discarded the samples with fewer than 2000 reads.

2.6. Statistical Analysis

All statistical analyses were performed with the program R [43], using the phyloseq and vegan packages. Analysis of variance (ANOVA) was conducted with the function lm to test for significant differences between Hg treatments. Tukey’s post-hoc tests were used to determine significance among factors levels (earthworm gut parts, sample types). Variables were log-transformed to achieve normality of the residual distribution and variance homoscedasticity, which were examined with QQ-plots and frequency histograms to ensure validity of the test. Alpha-diversity was analyzed as observed richness and Shannon diversity index based on randomly rarefied OTU abundance matrices. Rare OTUs, defined as singleton and doubleton OTUs, were retained in multivariate analyses because they only marginally influence these analyses [44]. Bray–Curtis dissimilarity matrices were generated based on the standardized matrices. The overall variability in bacterial and fungal community structures was examined by non-metric multidimensional scaling (NMDS) and canonical analysis of principal coordinates (CAP) with constrained factors of Hg treatment and earthworm gut part (experiment 2). Permutational multivariate analysis of variance (PERMANOVA), with either Hg treatment and sample type (experiment 1) or Hg treatment and earthworm gut part (experiment 2) as factors, was performed with the function adonis in vegan.
We use the DESeq package in R to identify OTUs that were significantly responsive to the Hg-contaminated treatments (either Hg-tolerant or Hg-sensitive) by calculating the log2-fold change in the OTU’s abundance between control and Hg-treated samples [45]. For this analysis, OTUs with fewer than 10 sequences were discarded. Hg-tolerant OTUs were defined as those with a read abundance that increased significantly in the Hg-contaminated treatments (p < 0.05). Hg-sensitive OTUs were defined as those with an abundance that was significantly lower in the Hg-contaminated soils compared with the uncontaminated ones (p < 0.05). A heatmap was computed using the responsive index of OTU abundance × log2-fold change (experiment 2). Boxplots and ordination graphs were generated with R (vegan and ggplot2 packages).

3. Results

3.1. Soil Physico-Chemical Parameters and Earthworm Biomass

The concentration of total Hg in the Hg-contaminated treatments (5-cm soil layer in experiment 1 and whole incubation soil in experiment 2) was more than 100 times higher than in the uncontaminated soil (used in experiment 2 only; Table 1). However, the soil water-extractable Hg (13.1 ± 4.8 µg g−1) represented only 0.04% of the total Hg in the Hg-contaminated soil and methyl-Hg (MeHg; 4.6 ± 0.5 µg kg−1) constituted an even smaller fraction of total Hg (0.01%). Although both Hg-contaminated and uncontaminated soils originated from the same site and were collected about 100 m apart, the pH was lower in the Hg-contaminated than in the uncontaminated one, whereas the total N and clay fraction were larger in the Hg-contaminated soil (Table 1). Although these differences were not significant between the two soils, total C and silt fraction tended to increase in the Hg-contaminated while the sand fraction tended to decrease.
In experiment 1, the Hg-contaminated soil layer did not significantly affect the earthworms. During the 10 days of incubation, the biomass of the earthworms increased by 0.64 and 0.67 g in the Hg-contaminated and uncontaminated control pots, respectively. Nonetheless, total Hg and MeHg levels in the earthworms’ tissue increased greatly in the presence of the Hg-contaminated soil layer, with an average increase of 32 times for total Hg (12.55 ± 5.46 µg g−1 in Hg-contaminated soil vs. 0.39 ± 0.1 µg g−1 in uncontaminated soil) and 27 times for MeHg (172.50 ± 42.15 µg kg−1 vs. 6.41 ± 5.82 µg kg−1; Table 1). In experiment 2, earthworm biomass decreased during the incubation in both treatments (−1.35 g in Hg-contaminated soil and −1.45 g in uncontaminated soil; Table 1). Similar to in experiment 1, the total Hg concentration in the earthworms was about 15 times higher in the Hg-contaminated soil (6.88 ± 2.91 µg g−1) than in the uncontaminated one (0.46 ± 0.09 µg g−1; Table 1).

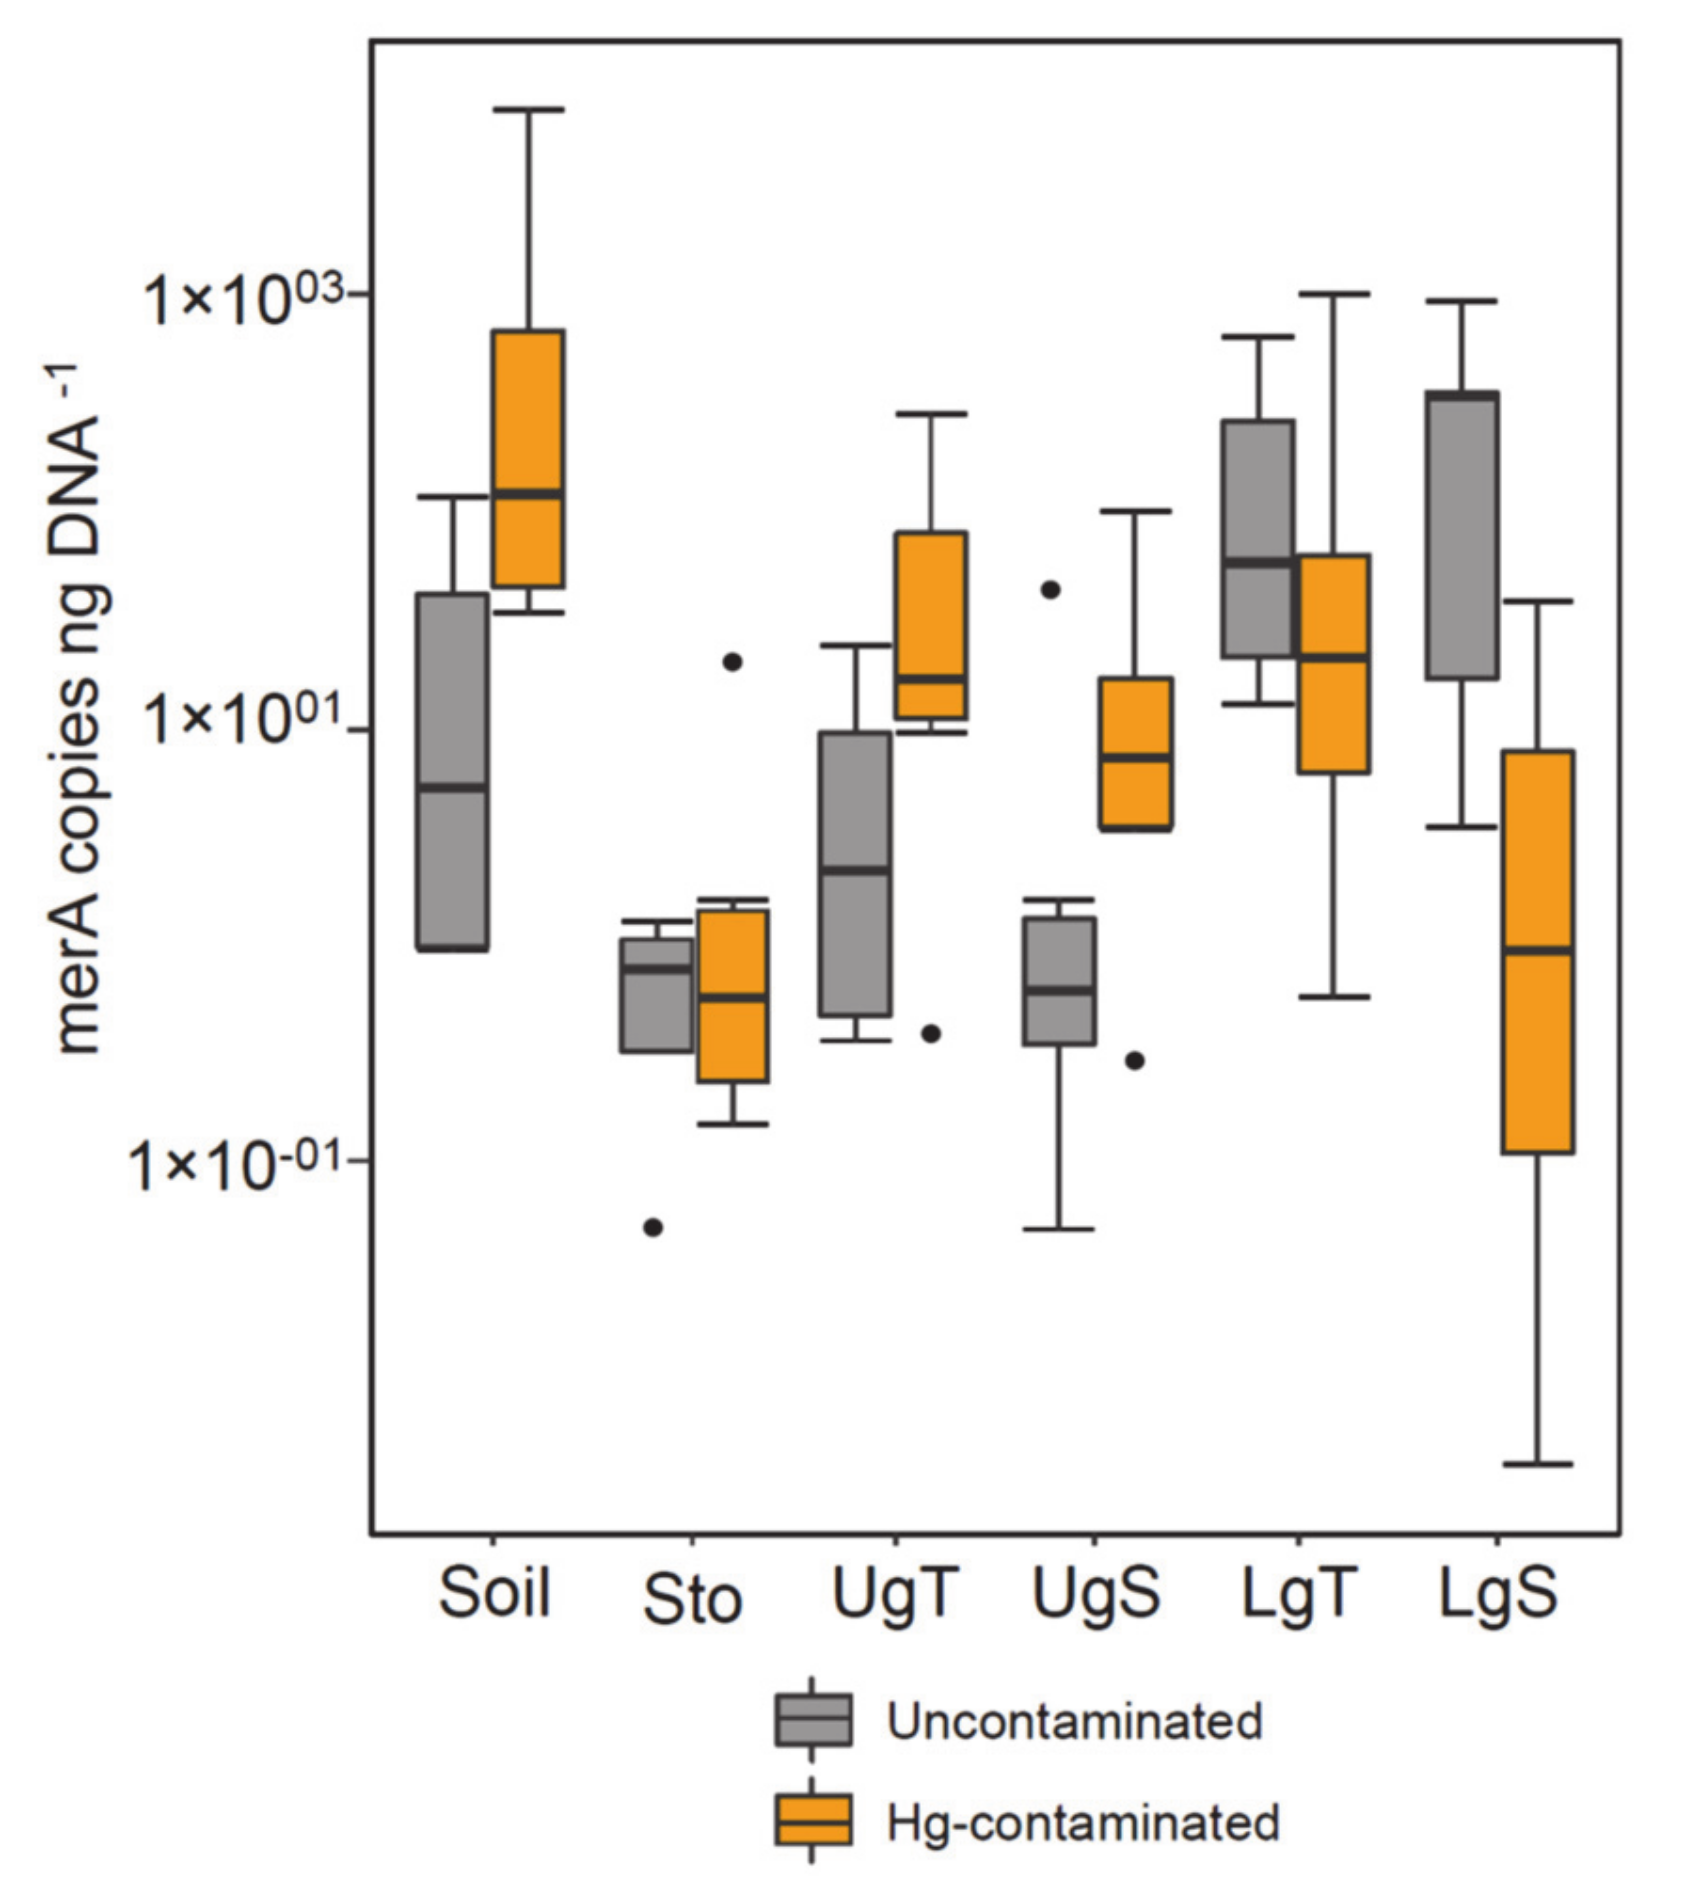
3.2. Bacterial, Fungal and Mercury Reductase Gene Abundance

Bacterial, fungal and mercury reductase gene abundances were assessed in experiment 2 in soil in the pots as well as in the earthworm gut parts. Both bacterial and fungal abundances varied considerably within replicated samples, leading to non-significant trends between Hg treatments or earthworm gut parts (Supplementary Figure S1, Table S1). The abundance of mercury reductase (merA) genes varied greatly among soil in the pot and earthworm gut parts in both the Hg-contaminated and uncontaminated treatment. It tended to increase in the pot soil and both upper gut samples (UgS and UgT) samples in the Hg-contaminated treatments, whereas it decreased in the lower gut samples (LgS and LgT), but a significant difference between the two Hg treatments was found only in the LgS samples (Figure 1, Supplementary Table S1).

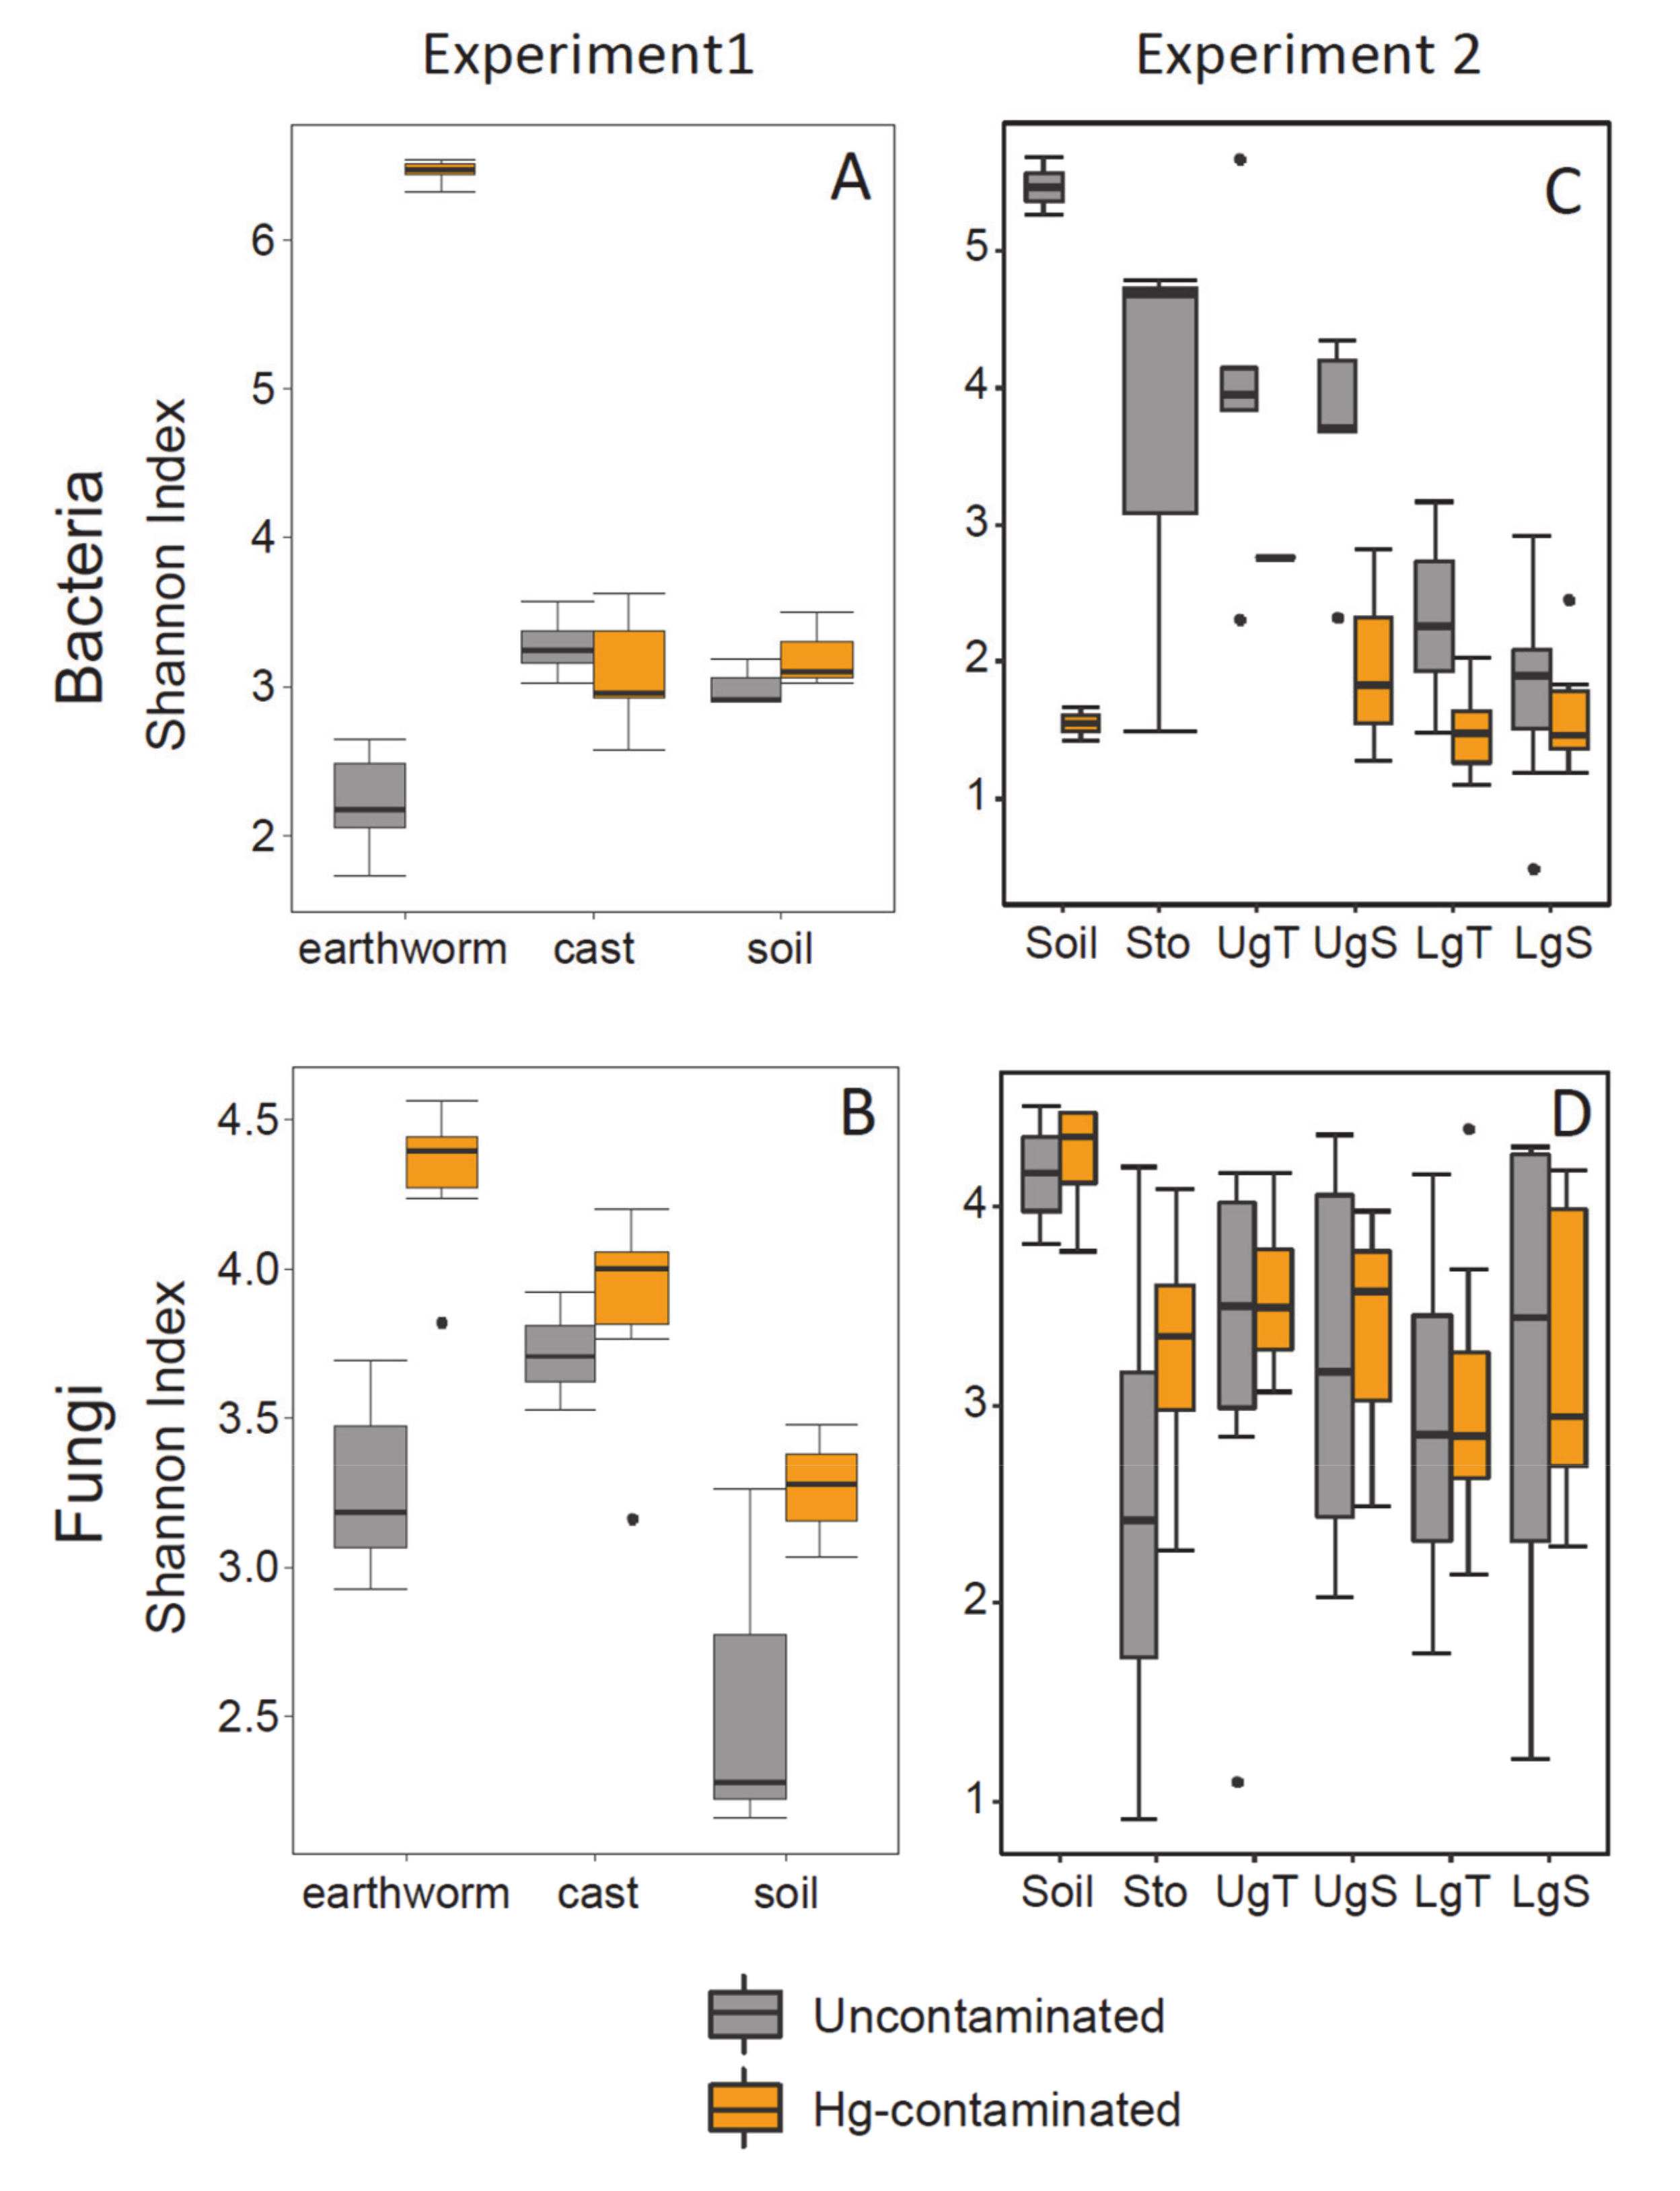
3.3. Alpha Diversity

In experiment 1, both bacterial and fungal richness and Shannon diversity increased drastically in the earthworm samples incubated with the Hg-contaminated soil layer (Figure 2, Table 2). In contrast, Shannon diversity in both cast and pot soil samples did not differ between Hg treatments for bacterial or fungal communities. Nevertheless, the bacterial richness increased in the Hg-treated soil and the fungal richness increased in the Hg-treated cast samples (Table 2, Supplementary Figure S2).
In experiment 2, the bacterial richness and Shannon diversity index decreased in the soil in the pot and most of the earthworm gut parts (no bacterial reads were retrieved in the stomach for the Hg-contaminated treatment) when the worms were incubated with Hg-contaminated soil (Figure 2, Table 2, Supplementary Figure S2). Interestingly, in both treatments, the bacterial richness and Shannon diversity tend to decrease along the earthworm gut, being significantly lower in the lower gut tissue (LgT) and soil (LgS) than in the pot soil and both upper gut tissue (UgT) and soil (UgS; Supplementary Table S2).
The fungal richness and Shannon diversity index did not differ between Hg treatments. However, these indices were lower in the tissue and soil from the lower gut parts (LgT and LgS) than in the soil samples (Supplementary Table S2).

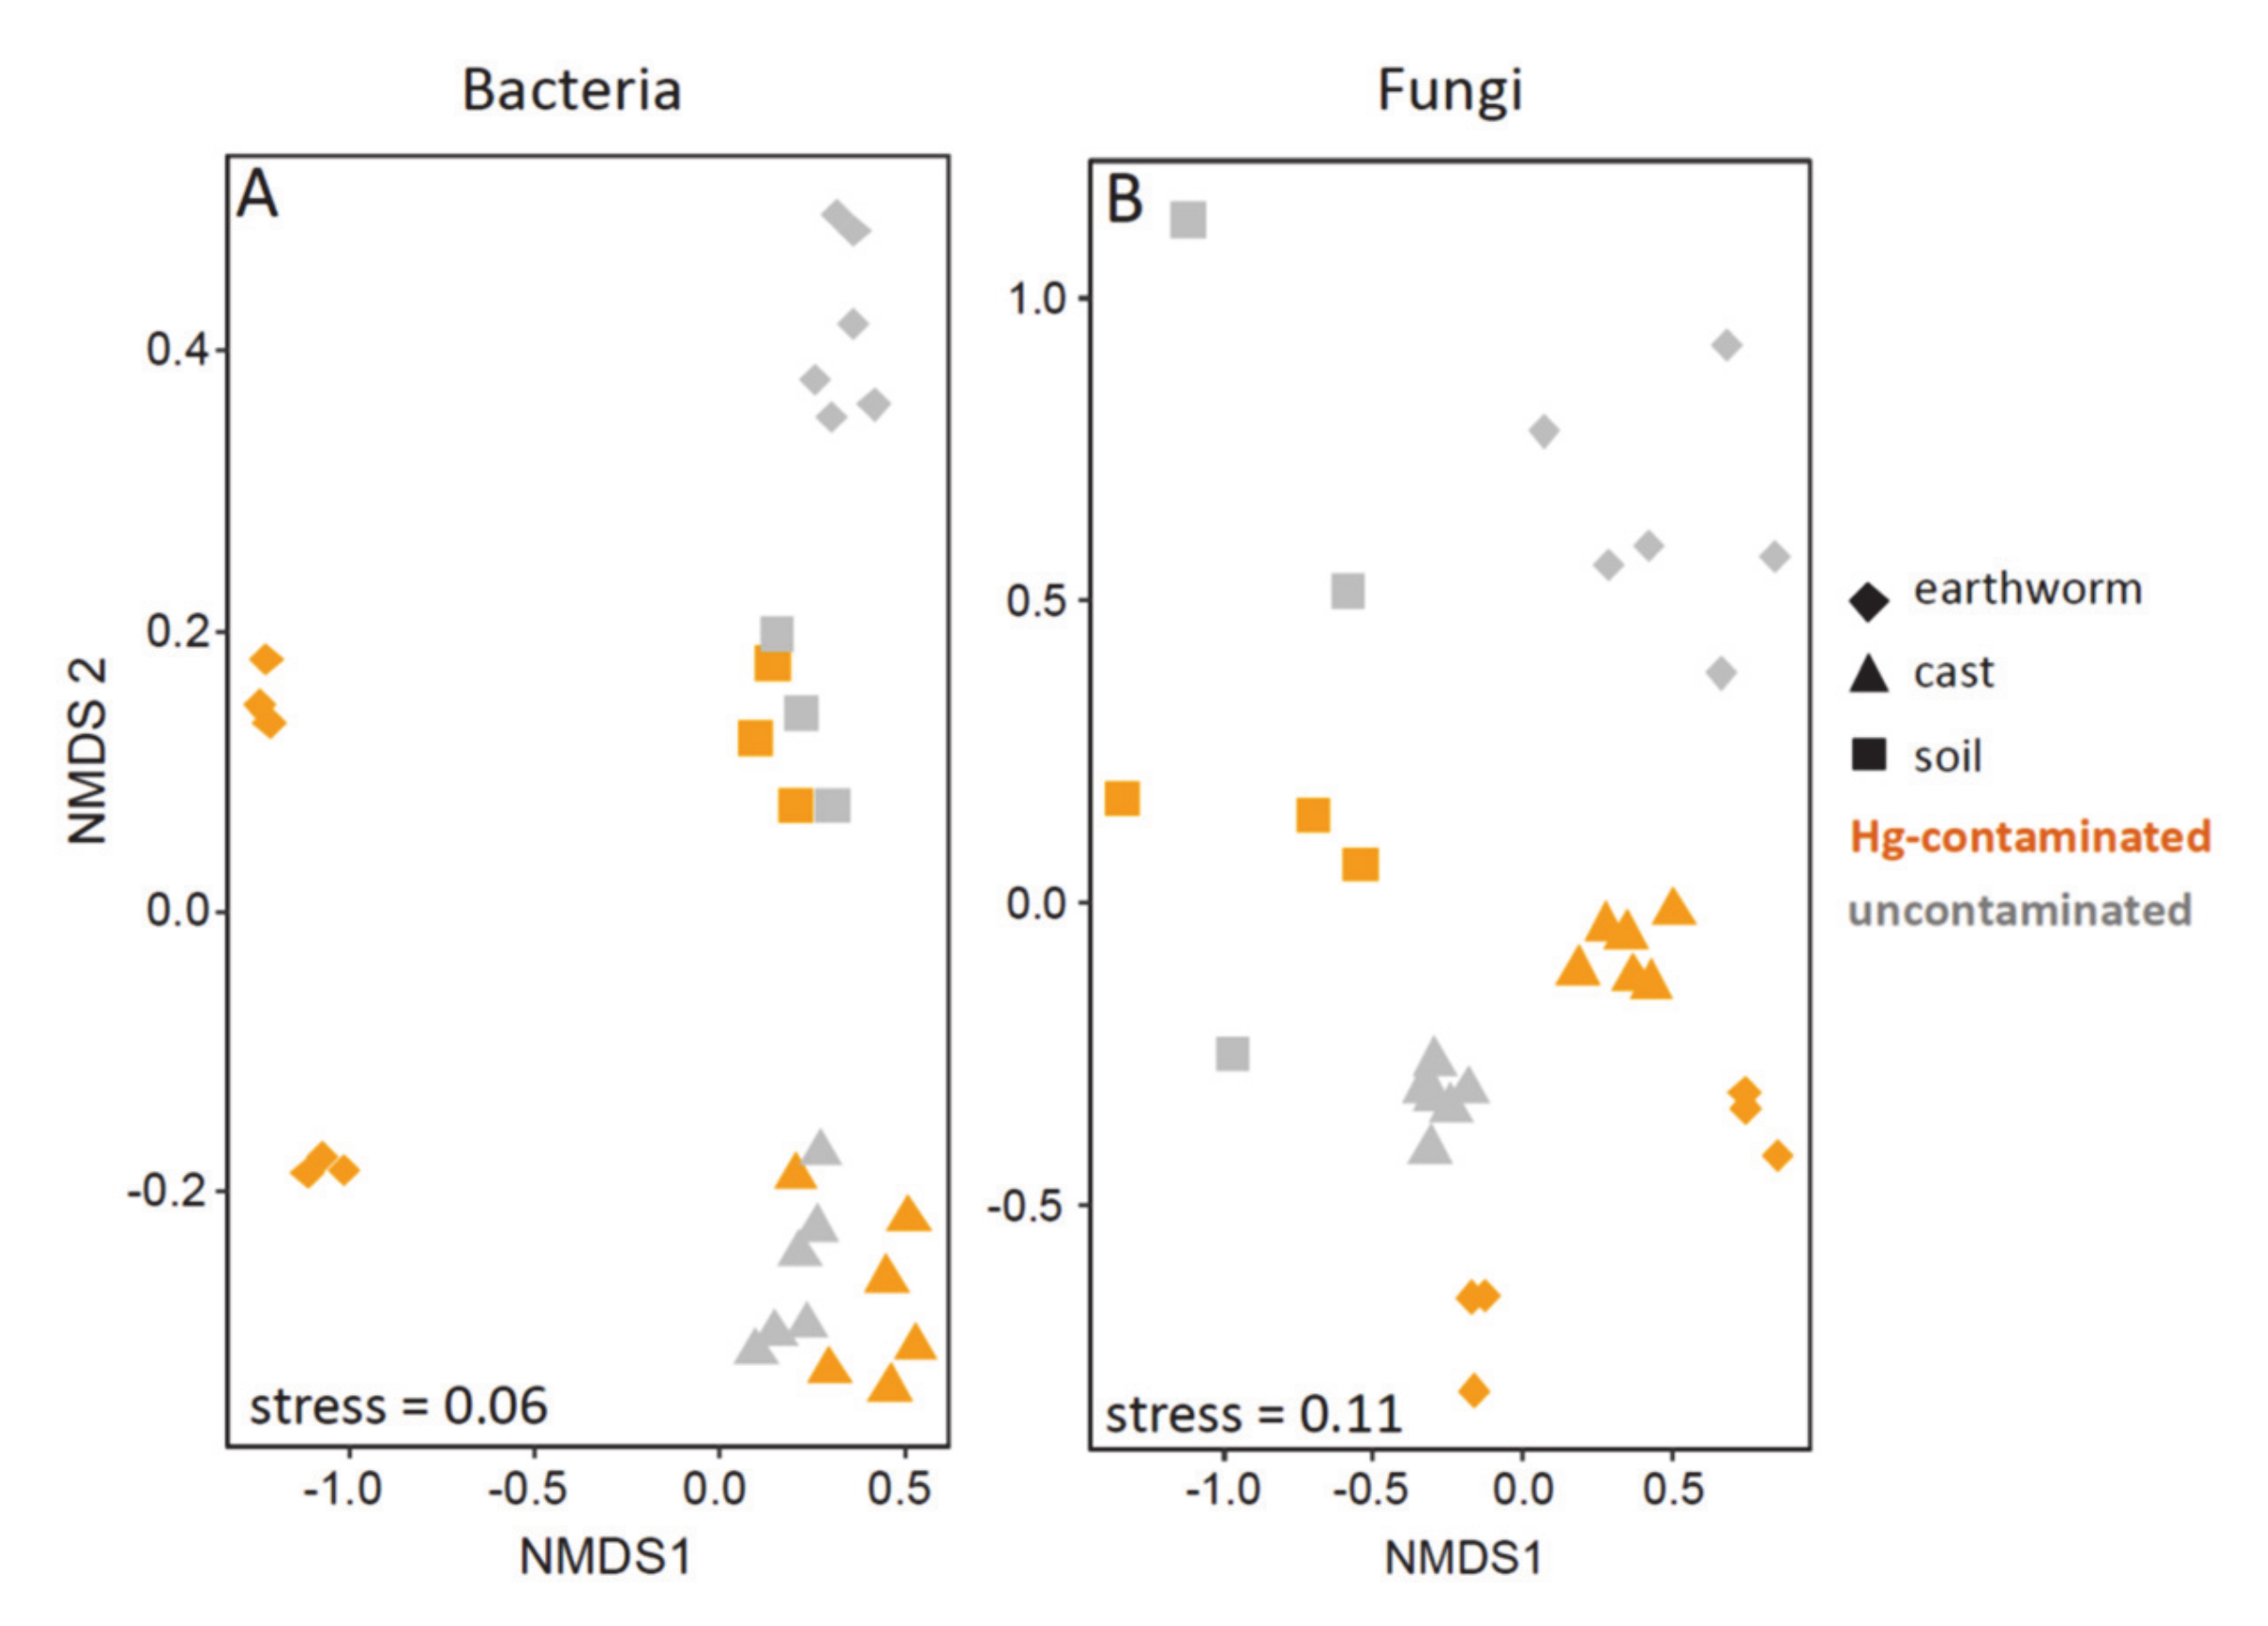
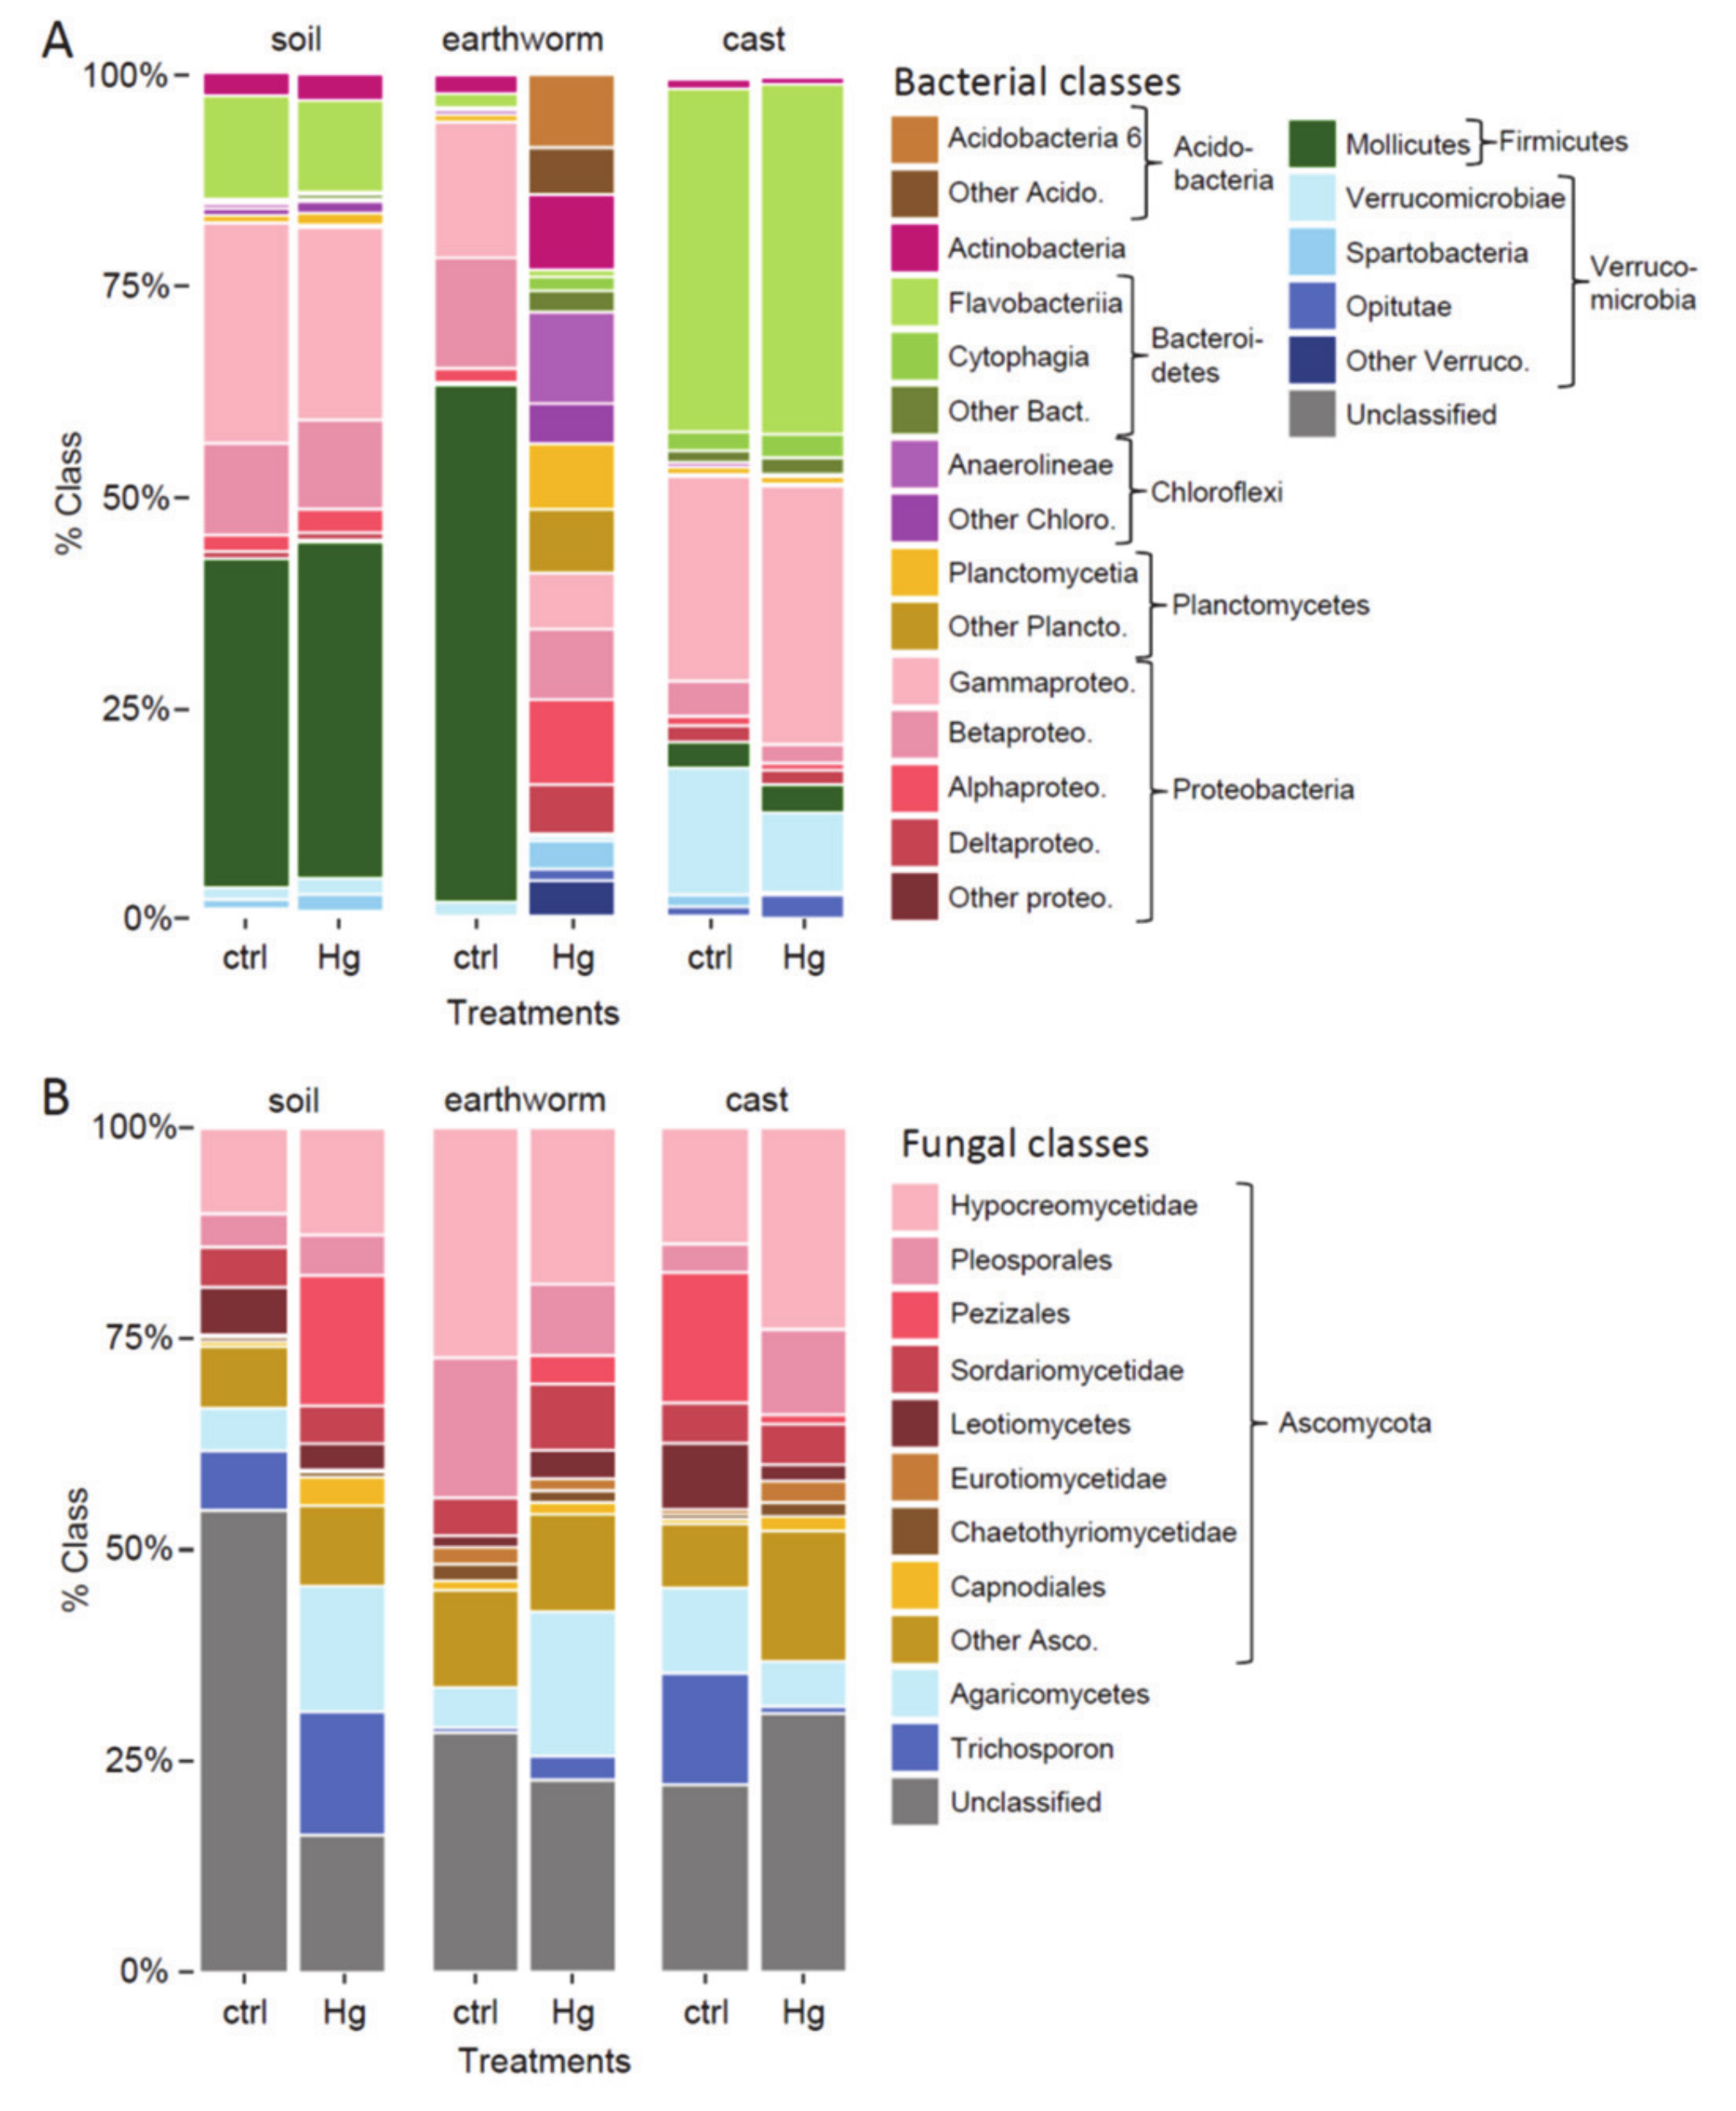
3.4. Beta Diversity in Earthworm, Cast and Soil (Experiment 1)

In experiment 1, both bacterial and fungal community structures differed significantly between earthworm gut, soil and cast samples (Figure 3, Supplementary Table S3). The Hg-contaminated soil layer greatly affected the earthworm and cast bacterial and fungal community structures but not those of the soil (Table 3).
The bacterial community in the Hg-treated earthworm samples was dominated by Anarolineae (Chloroflexi, 9.5%), Alphaprotebacteria (8.7%), Actinobacteria (7.8%), Acidobacteria-6 (7.4%), Betaproteobacteria (7.4%), Planctomycetia (6.8%), Gammaproteobacteria (5.8%), and Deltaproteobacteria (5.2%). The relative abundance of the Mollicutes (phylum Firmicutes), which dominated (60.8%) the bacterial community in the uncontaminated control pots, decreased drastically in the Hg-contaminated treatment (Figure 4). Moreover, OTUs from the Mollicutes class were among the most negatively affected by the Hg-contaminated soil treatment when log2-fold changes in OTU read abundances were assessed (Figure 5). Other relatively abundant OTUs negatively affected by the Hg-contaminated soil layer included Gammaproteobacteria (Aeronadeceae and Shewanella sp.), Flavobacteria (Flavobacterium sp.) and Verrucomicrobiae (Verminebacter sp.). However, these taxonomic classes also included OTUs that significantly increased in the Hg-contaminated treatment compared to the control (Figure 5). Hg-tolerant OTUs (i.e., those with a significantly increased abundance in the Hg-contaminated treatment) were not particularly abundant and were spread over various phyla and classes, with Pedosphaerae, Oputae, Anaerolineae, Acidobacteria-6, Gemm-1, Phycisphaerae, and Nitrospira being the most positively affected (Figure 5).
In the cast samples, the bacterial community of both Hg treatments was dominated by Flavobacteria (phylum Bacteroidetes, 41% of Hg-contaminated samples), Gammaproteobacteria (Proteobacteria, 30%) and Verrucomicrobiae (Verrucomicrobia, 9.3%; Figure 4). Interestingly, abundant Aeromonadaceae (Gammaproteobacteria) and Flavobacterium sp. (Flavobacteria) OTUs, which were negatively affected by the Hg treatment in the earthworm samples, increased significantly in the cast samples. Besides, most of the OTUs from the Bacteroidetes phylum increased significantly in the Hg-treated cast samples, whereas they were negatively impacted by Hg in the earthworm samples (Figure 5). The bacterial community diversity in the soil samples did not vary between Hg treatments and was dominated by Mollicutes, Gammaproteobacteria and Flavobacteria (Figure 4).
The fungal community in the earthworm, cast and soil samples in both Hg treatments was dominated by OTUs from the Hypocreomycetidae, Pleosporales, Pezizales, Leotiomycetes, Agaricomycetes and Trichosporon classes (Figure 4). The biggest change in the relative abundance of the dominant fungal classes between the control and the Hg-contaminated soil treatments were observed for the Agaricomycetes (−12.2%), Hypocreomycetidae (+8.8%) and Pleosporales (+8.0%) in the earthworm samples and for the Pezizales (−14.4%), Trichosporon (−12.5%), Hypocreomycetidae (+10.1%), Pleosporales (+6.9%), and the Leotiomycetes (−6.0%) in the cast samples. In the cast samples, these changes were supported by a significant increase in abundant OTUs such as a Fusarium sp. OTU (Hypocreomycetidae) and a Preussia sp. OTU (Pleosporales) and by a significant decrease in a Scytalidium sp. OTU (Leotiomycetes), a Pseudaleuria sp. OTU (Pezizales) and a Trichosporon sp. OTU (Supplementary Figure S3).

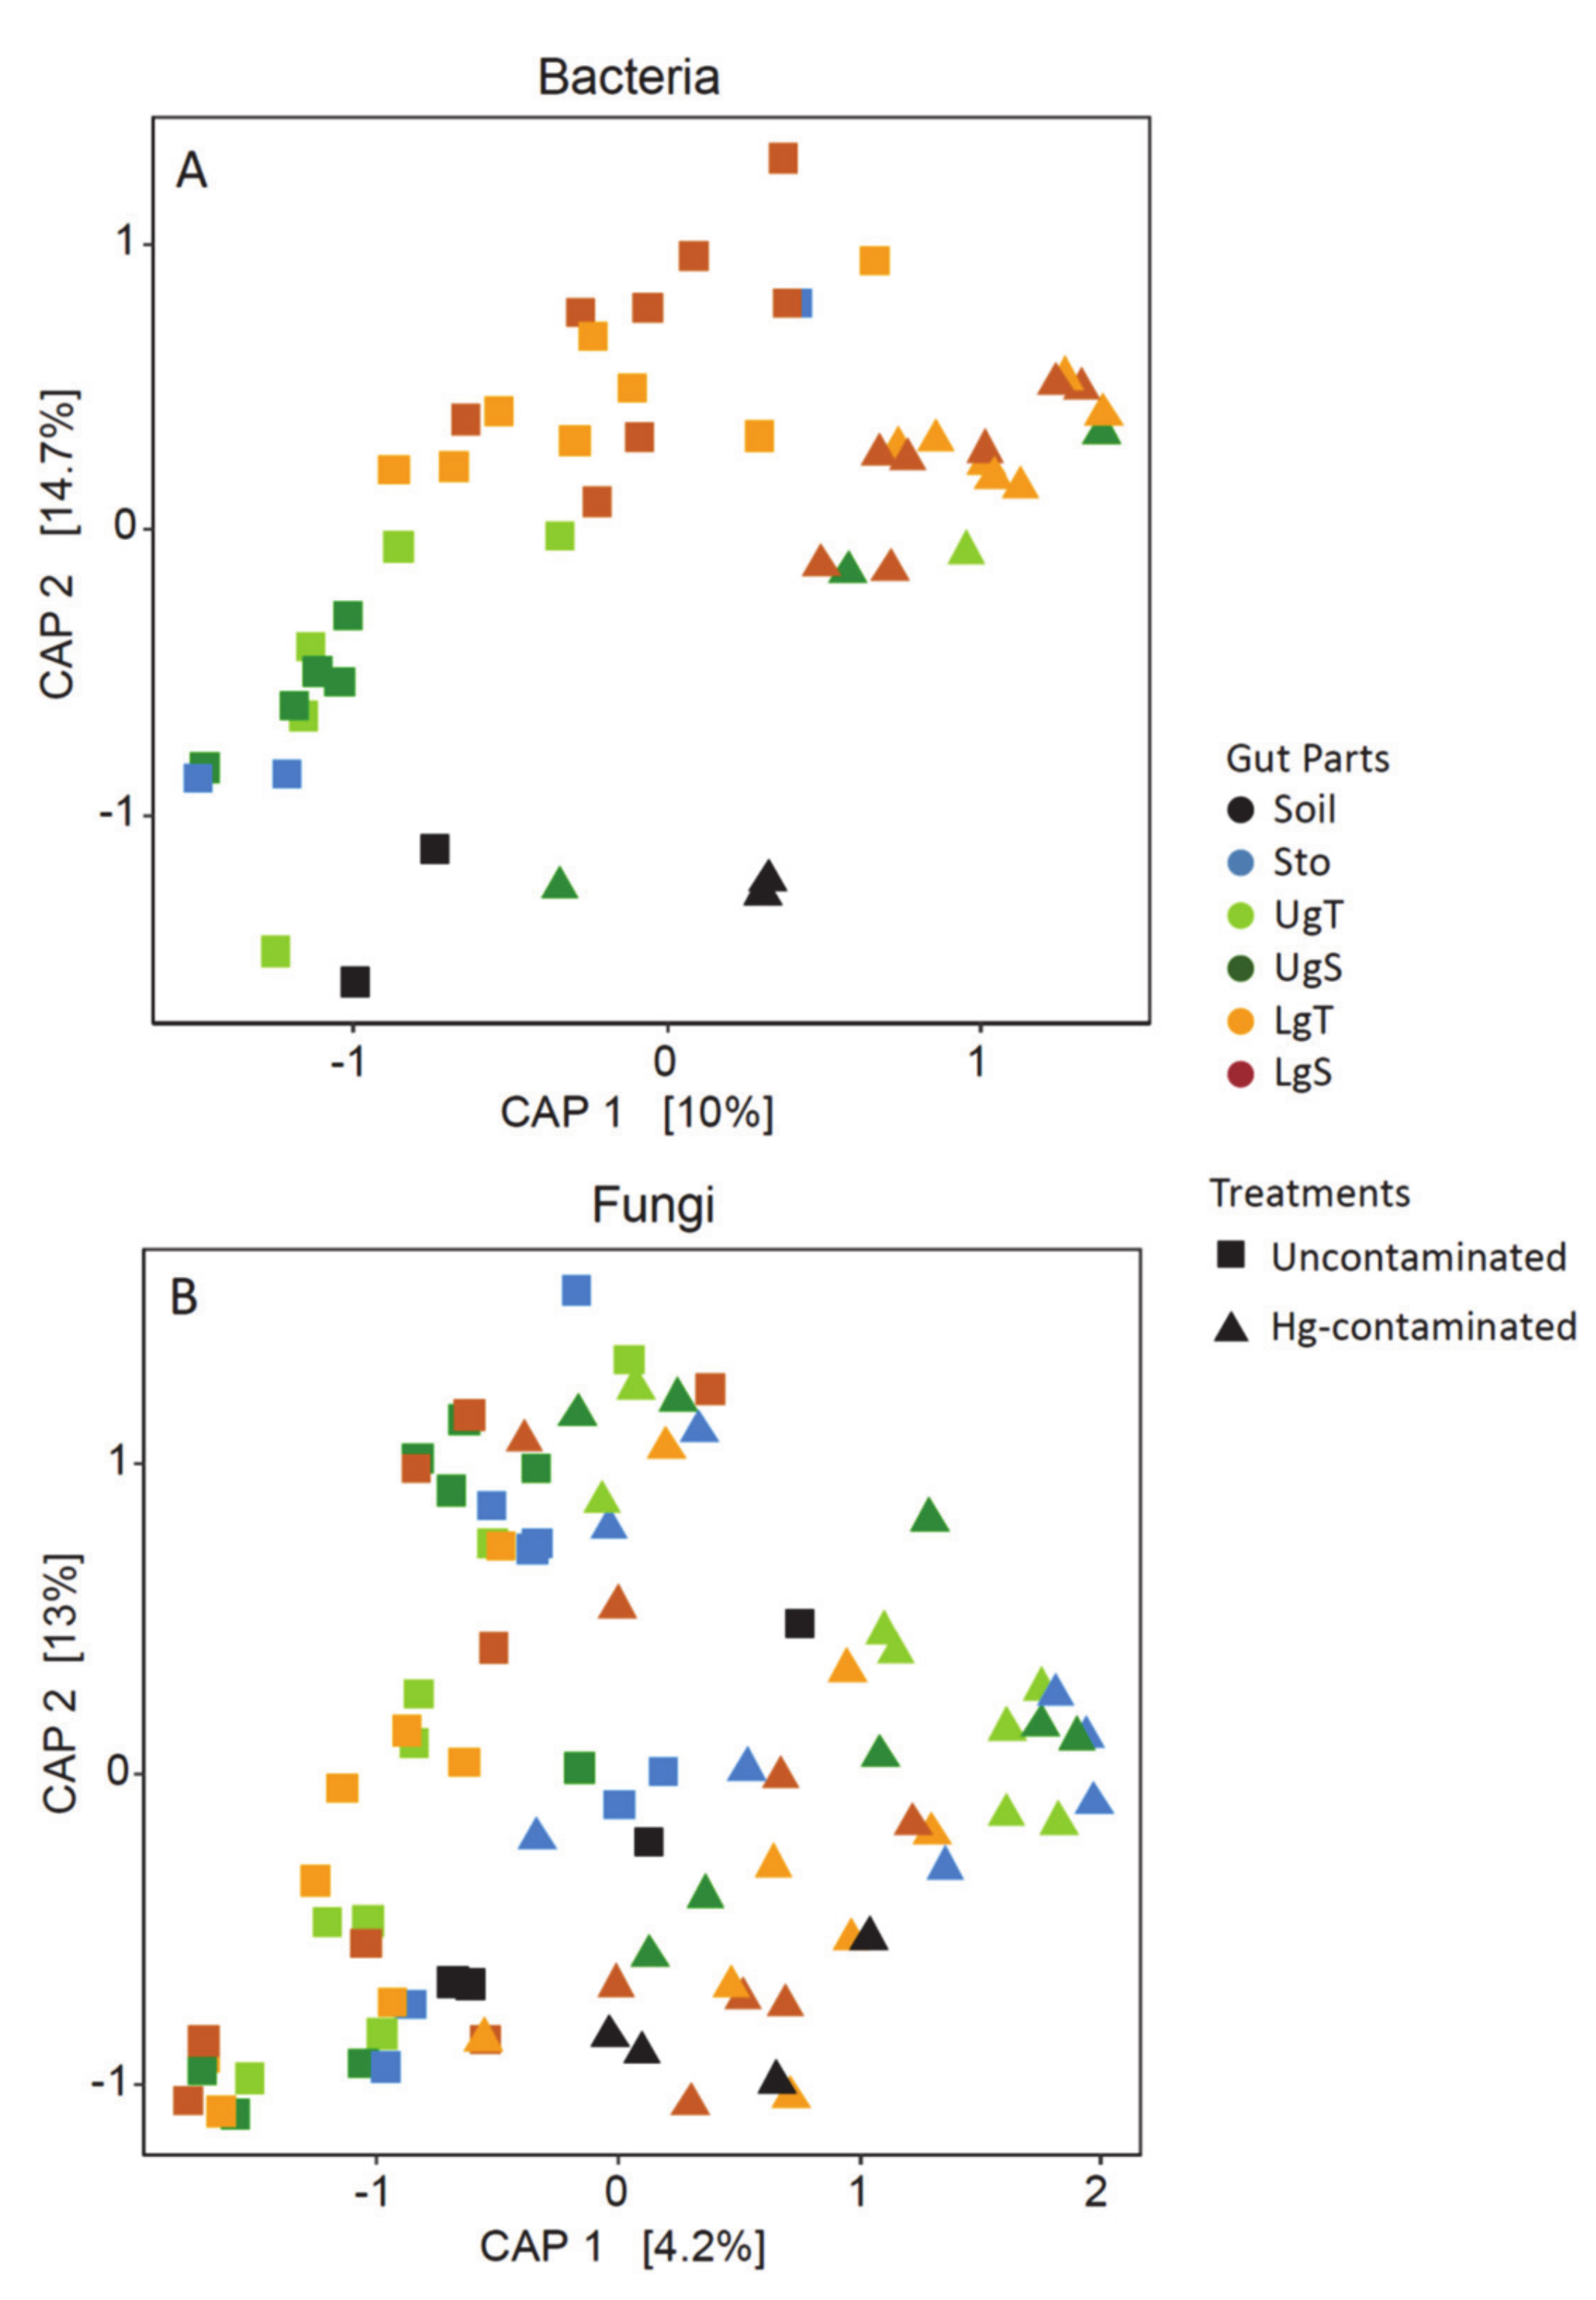
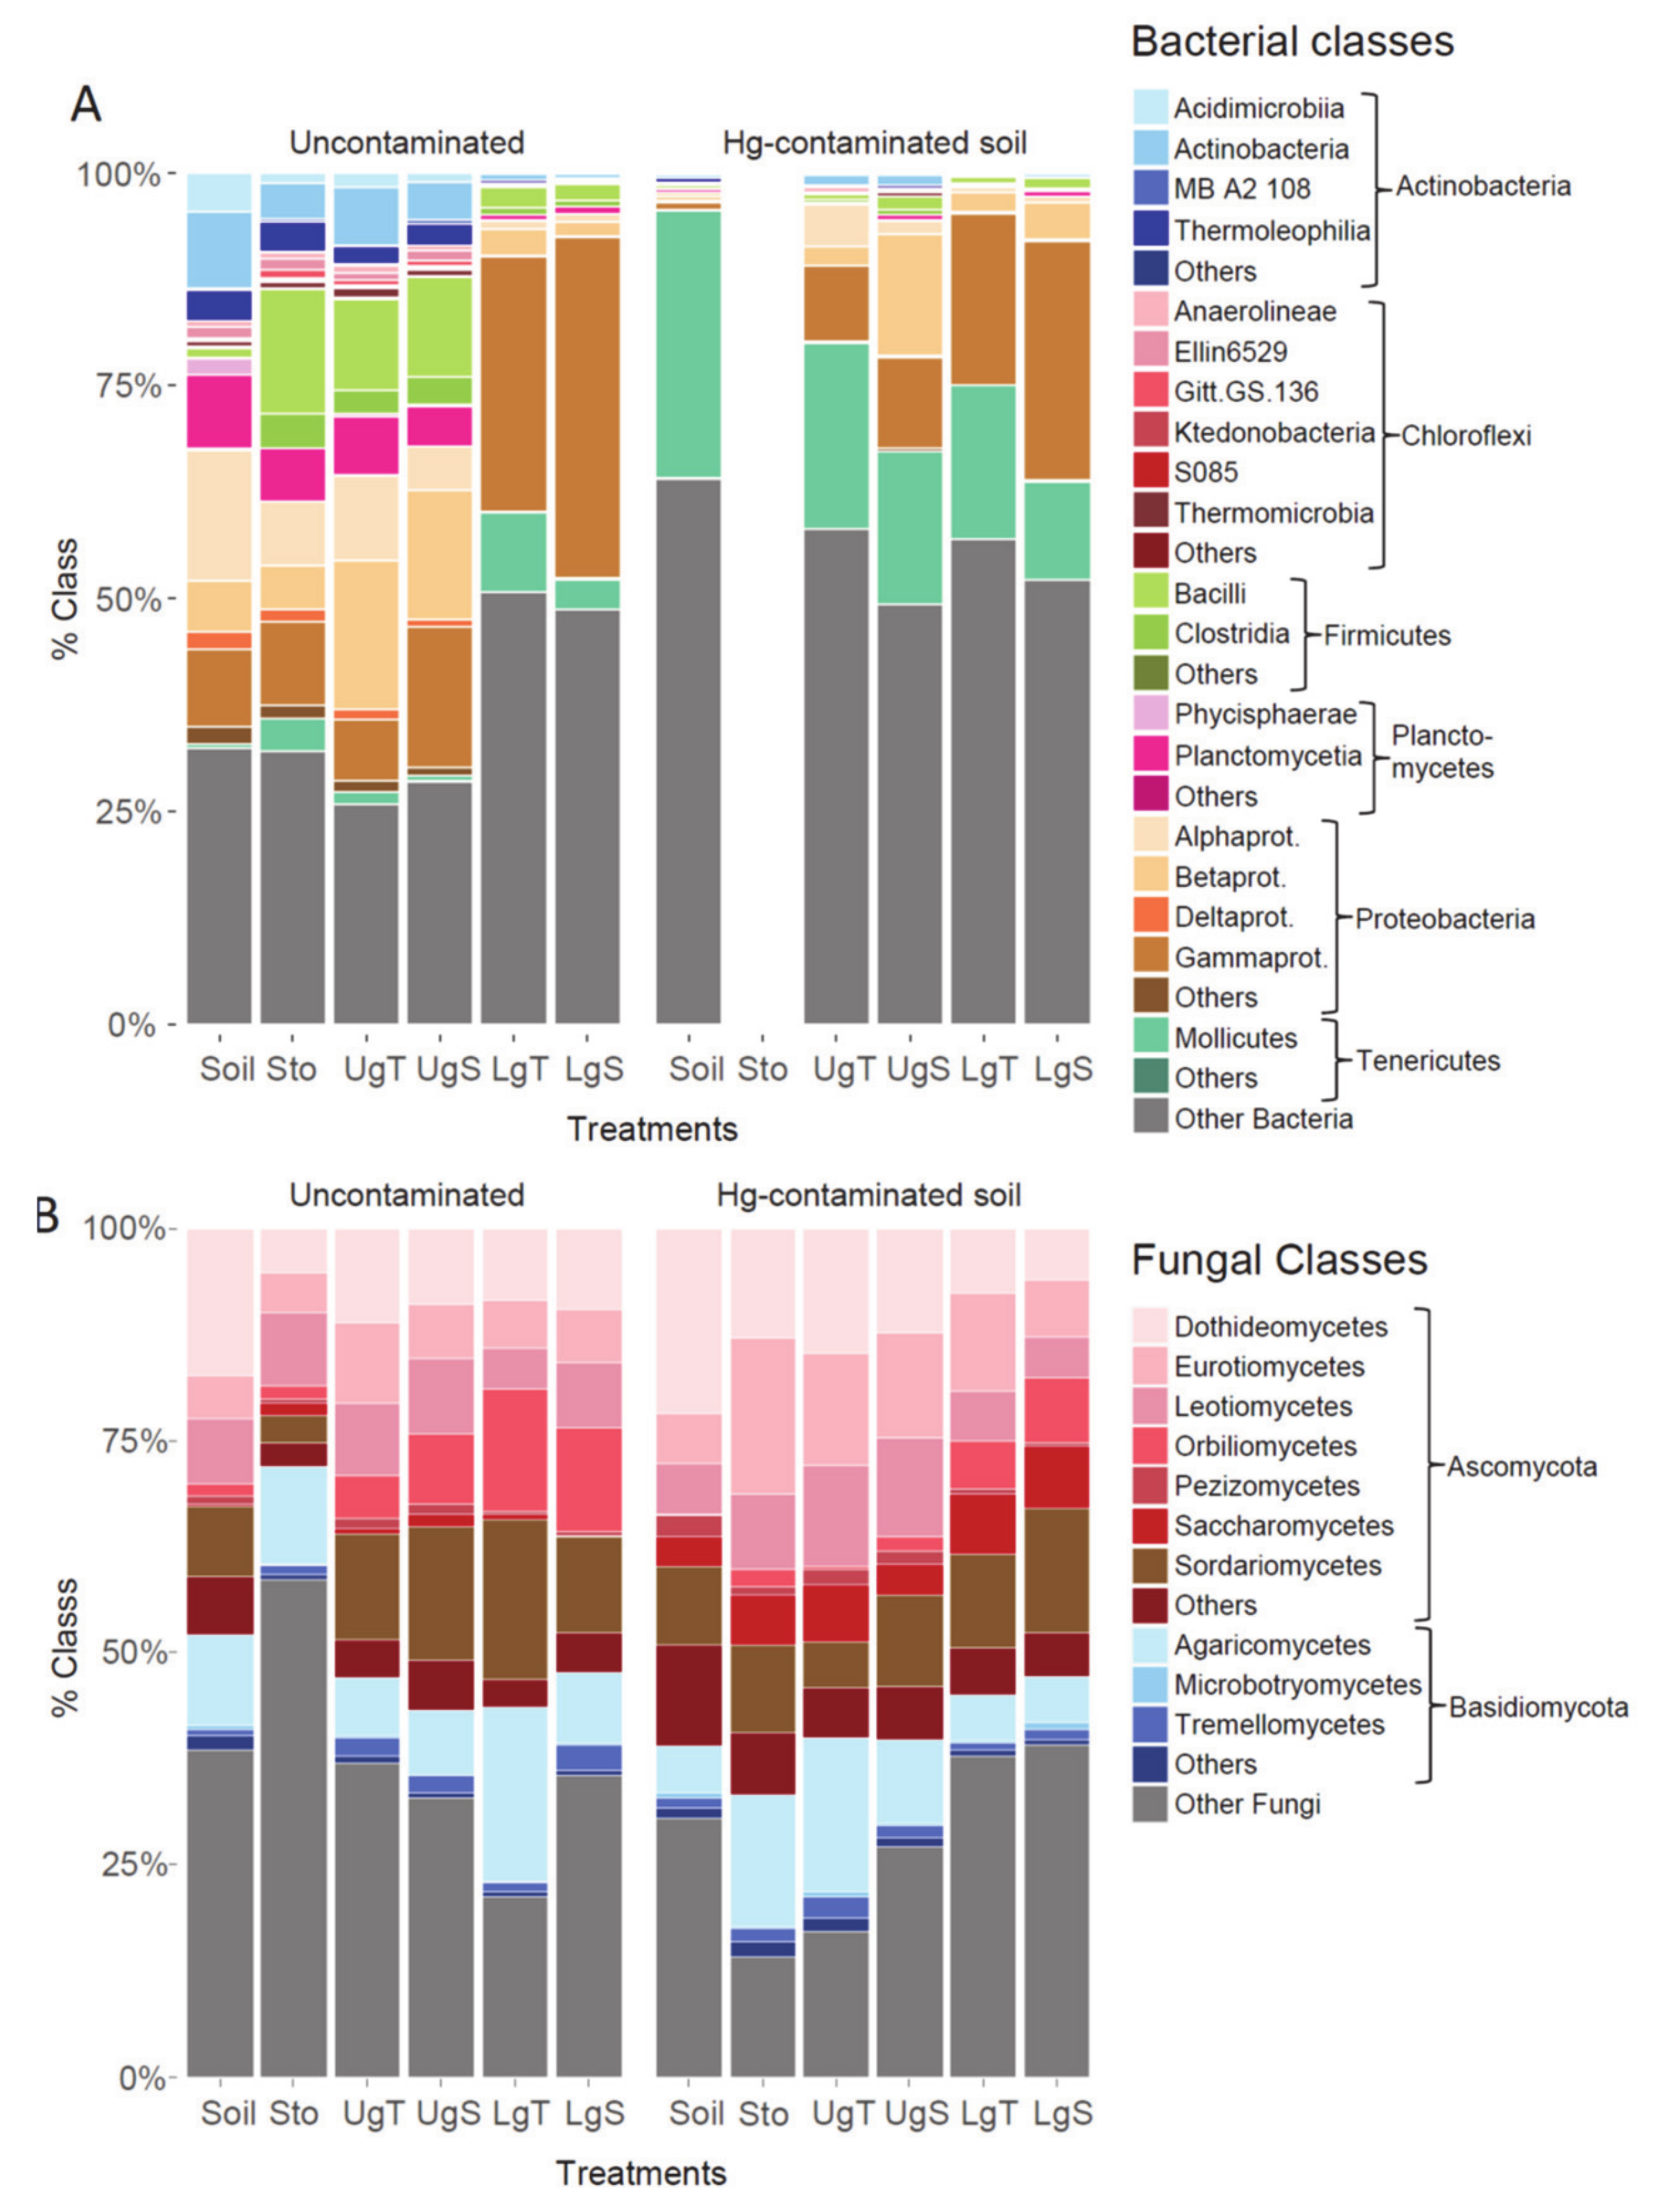
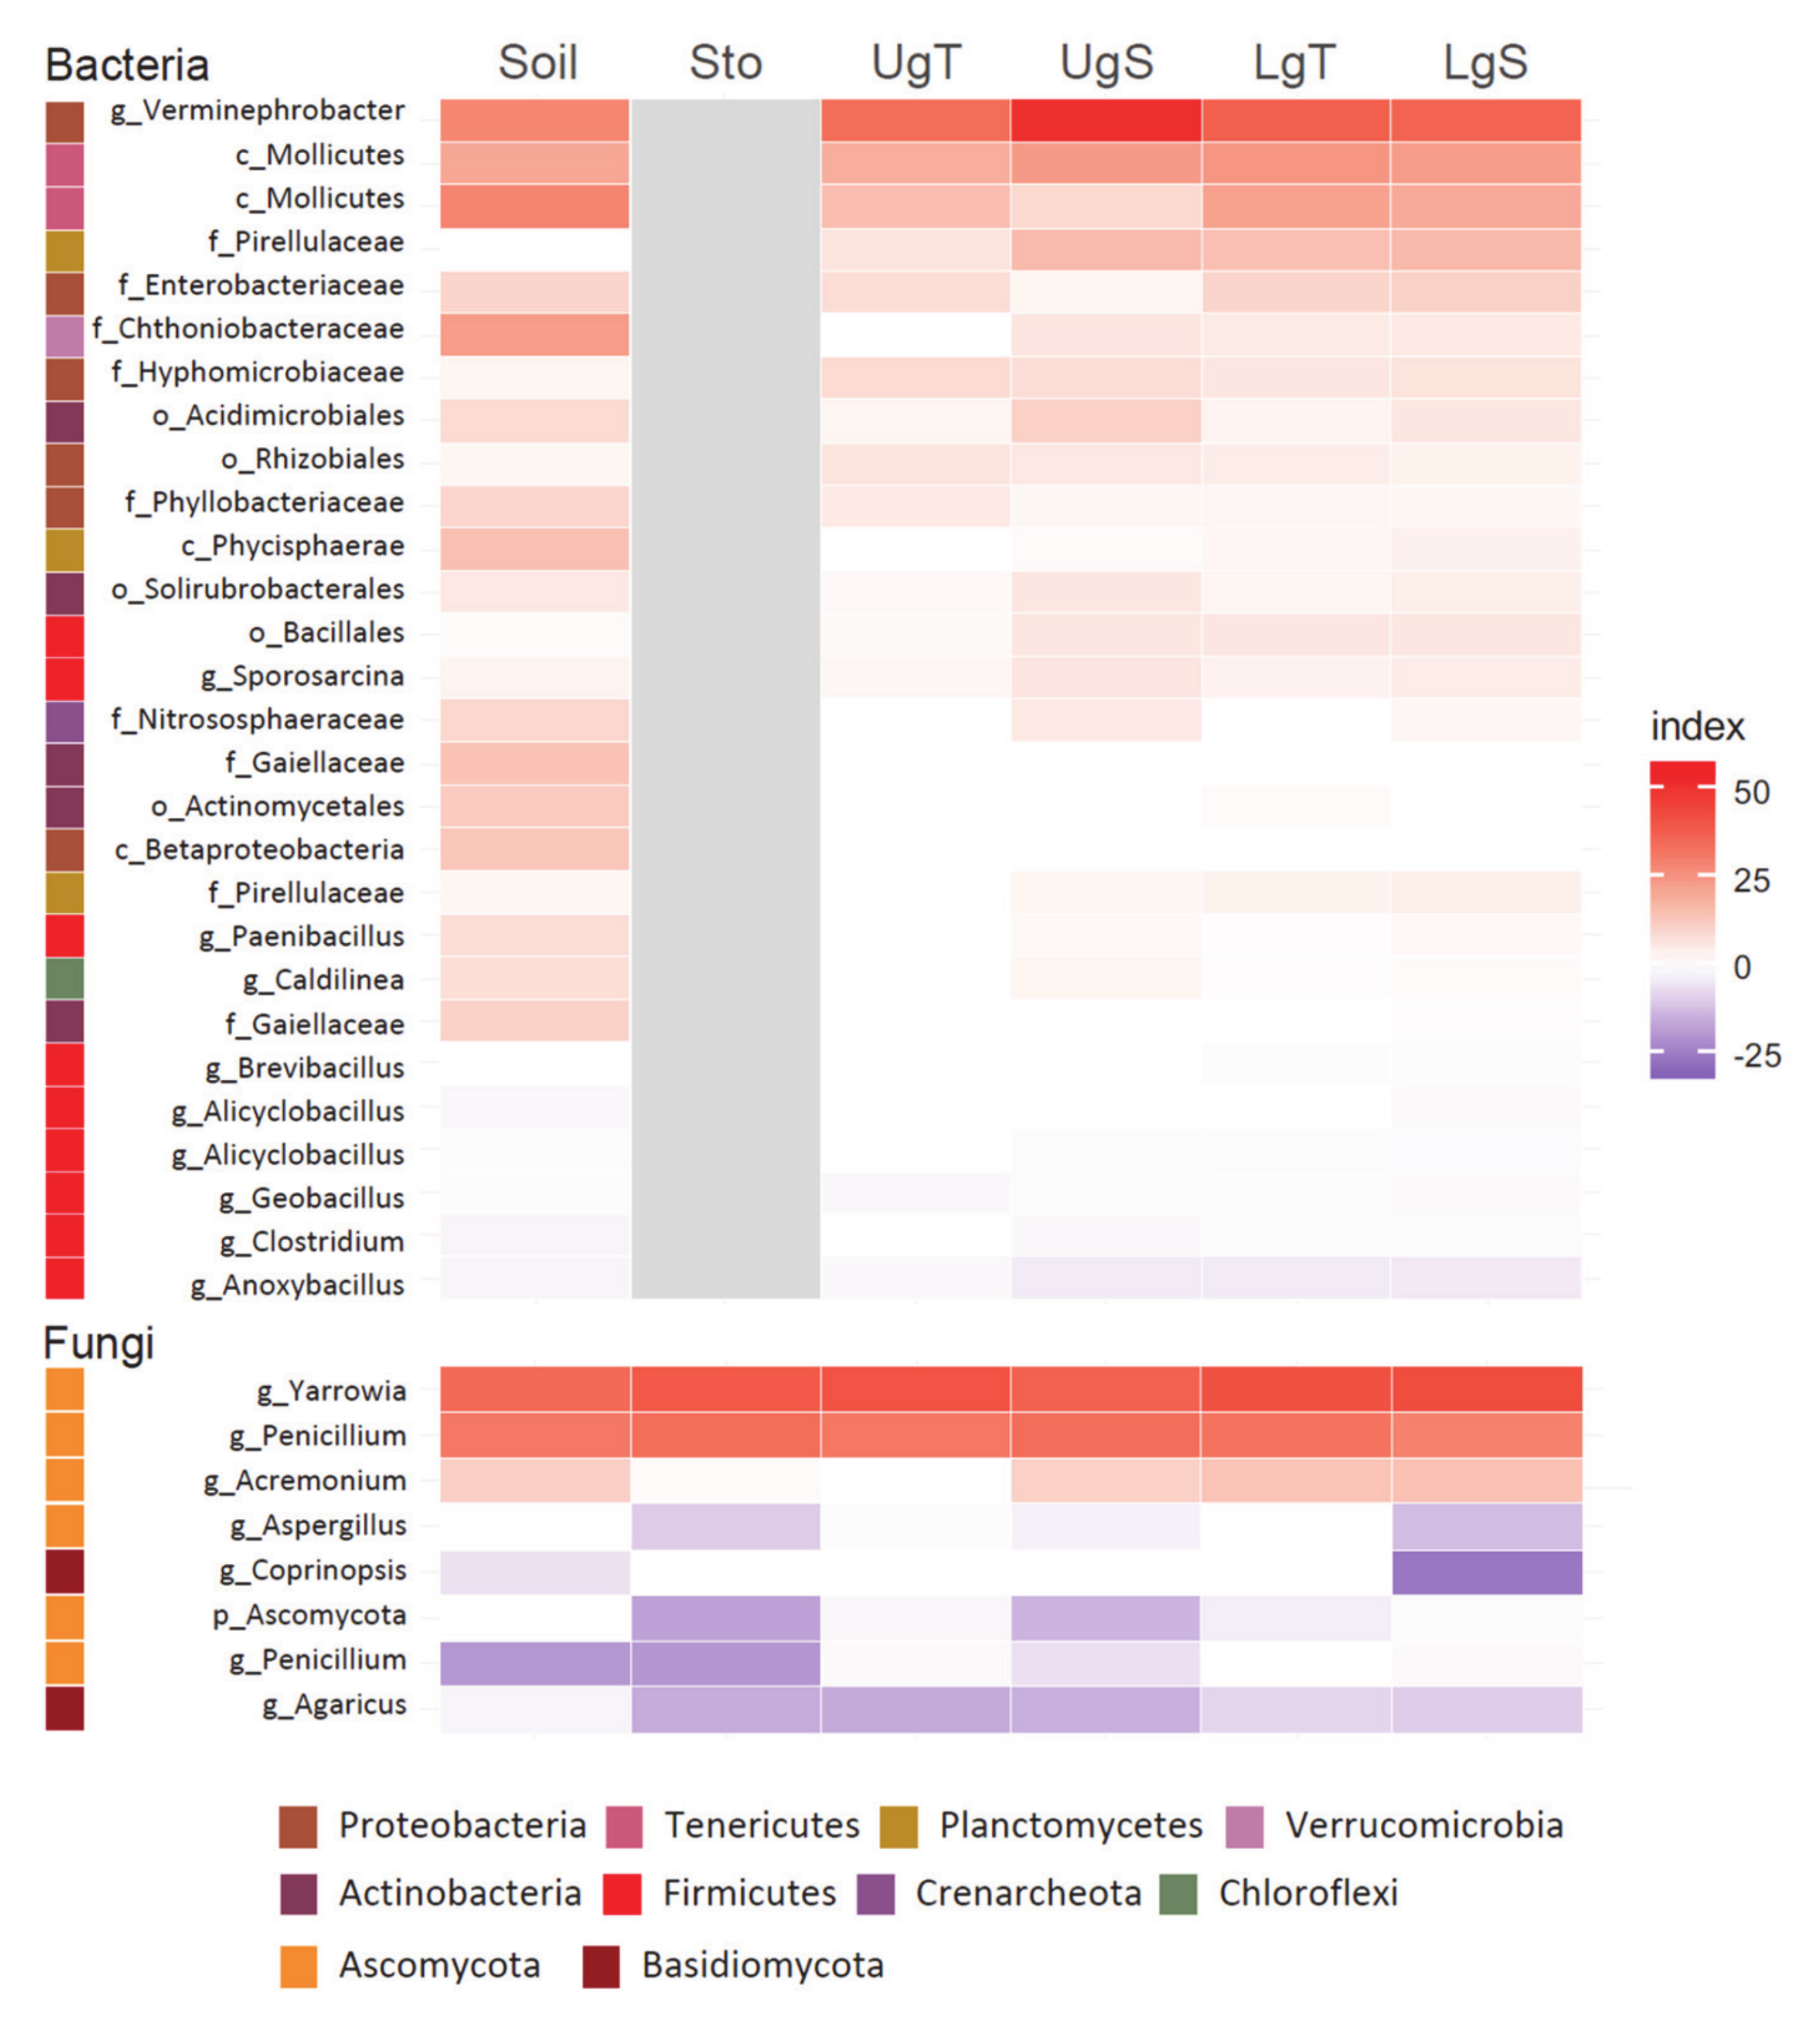
3.5. Beta Diversity in Earthworms Gut Parts (Experiment 2)

In experiment 2, similar to in experiment 1, both bacterial and fungal community structures were impacted by the Hg treatment (Figure 6, Table 3). However, the fungal community was affected by the Hg-contaminated soil in only a few individual gut parts (UgT, UgS and LgT) and the bacterial community was not impacted in any individual gut part. However, the structure of the bacterial community differed between the pot soil and earthworm gut parts. The structure of the lower gut bacterial community (LgT and LgS) was different from that of the soil in the pot, the stomach, and the tissue and soil from the upper gut (UgT and UgS; Supplementary Table S3). Moreover, the relative abundance of the Gammaproteobacteria in the lower gut parts increased drastically in the Hg-contaminated soil (Figure 7). The structure of the fungal community in the earthworm gut parts differed from that in the soil in the pot, but no differences among gut parts were observed (Supplementary Table S3).
The majority of the bacterial OTUs that responded significantly to the Hg treatment had a significantly increased abundance in the Hg-contaminated treatment in comparison to the uncontaminated one, i.e., they were Hg-tolerant (Figure 8). Moreover, a Verminophorbacter sp. OTU and two Mollicutes OTUs were particularly abundant and tolerant to Hg treatment in all gut parts. Only a few fungal taxa responded significantly to the Hg-contaminated treatment. Two fungal OTUs, Yarrowia sp. and Penicillum sp., were observed to be particularly abundant and tolerant to the Hg treatment. Fungal OTUs that were sensitive to the Hg treatment included a Penicillum sp. OTU and an Agaricus sp. OTU, whose abundance in particular decreased in the soil in the pot, stomach and the upper gut parts, and a Coprinopsis sp. OTU, which was mostly affected in the lower gut part (Figure 8).

4. Discussion

4.1. Hg Contamination in Soils and Its Effect on Earthworms

Mercury is a highly toxic heavy metal occurring in soils worldwide due to industrial activity. However, few studies have investigated the impact of Hg on soil fauna and their microbiome, and artificially Hg-spiked soils have typically been used instead of soils from Hg-contaminated sites [46]. In this study, we demonstrated the impact of Hg contamination and accumulation in earthworms using long-term Hg-contaminated soils [24]. Whereas laboratory experiments using Hg-spiked soil often aim for concentrations of up to 500 mg kg−1 [4,47], the total Hg concentrations in our incubated soils (36 mg kg−1) were in the range of total Hg concentrations found in other Hg-polluted sites, such as in a leachate-contaminated soil (THg 1.3 µg g−1 dw, [48]) or a landfill (THg 0.9–97.5 µg g−1, [23]).
Interestingly, the impact of Hg contamination on the earthworms differed between our two experimental setups. In experiment 1, the earthworms gained biomass during the incubation, even when incubated with a 5-cm layer of Hg-contaminated soils in addition to the mixture of garden soil and quartz sand, which is considered highly suitable for earthworms [13]. Contrastingly, in experiment 2, the natural soil collected in the vicinity of a long-term Hg-polluted site did not meet the physiological needs of the incubated earthworms, as their biomass decreased during the incubation in both the Hg-contaminated and uncontaminated treatments. The direct impact of Hg on the earthworms’ biomass might have been outweighed by the rich soil quality in experiment 1 and the poor quality in experiment 2. However, the accumulation of both THg and MeHg in the earthworms compared with in the soil matrix was considerable in both experiments, in line with observations from previous field studies of a correlation between Hg bioaccumulation and soil total Hg, organic matter and clay contents [23,27,48]. Furthermore, the Hg and MeHg bioaccumulation might have affected the earthworms over a longer period than the incubation duration, for example by impacting their burrowing behavior or respiration [49].

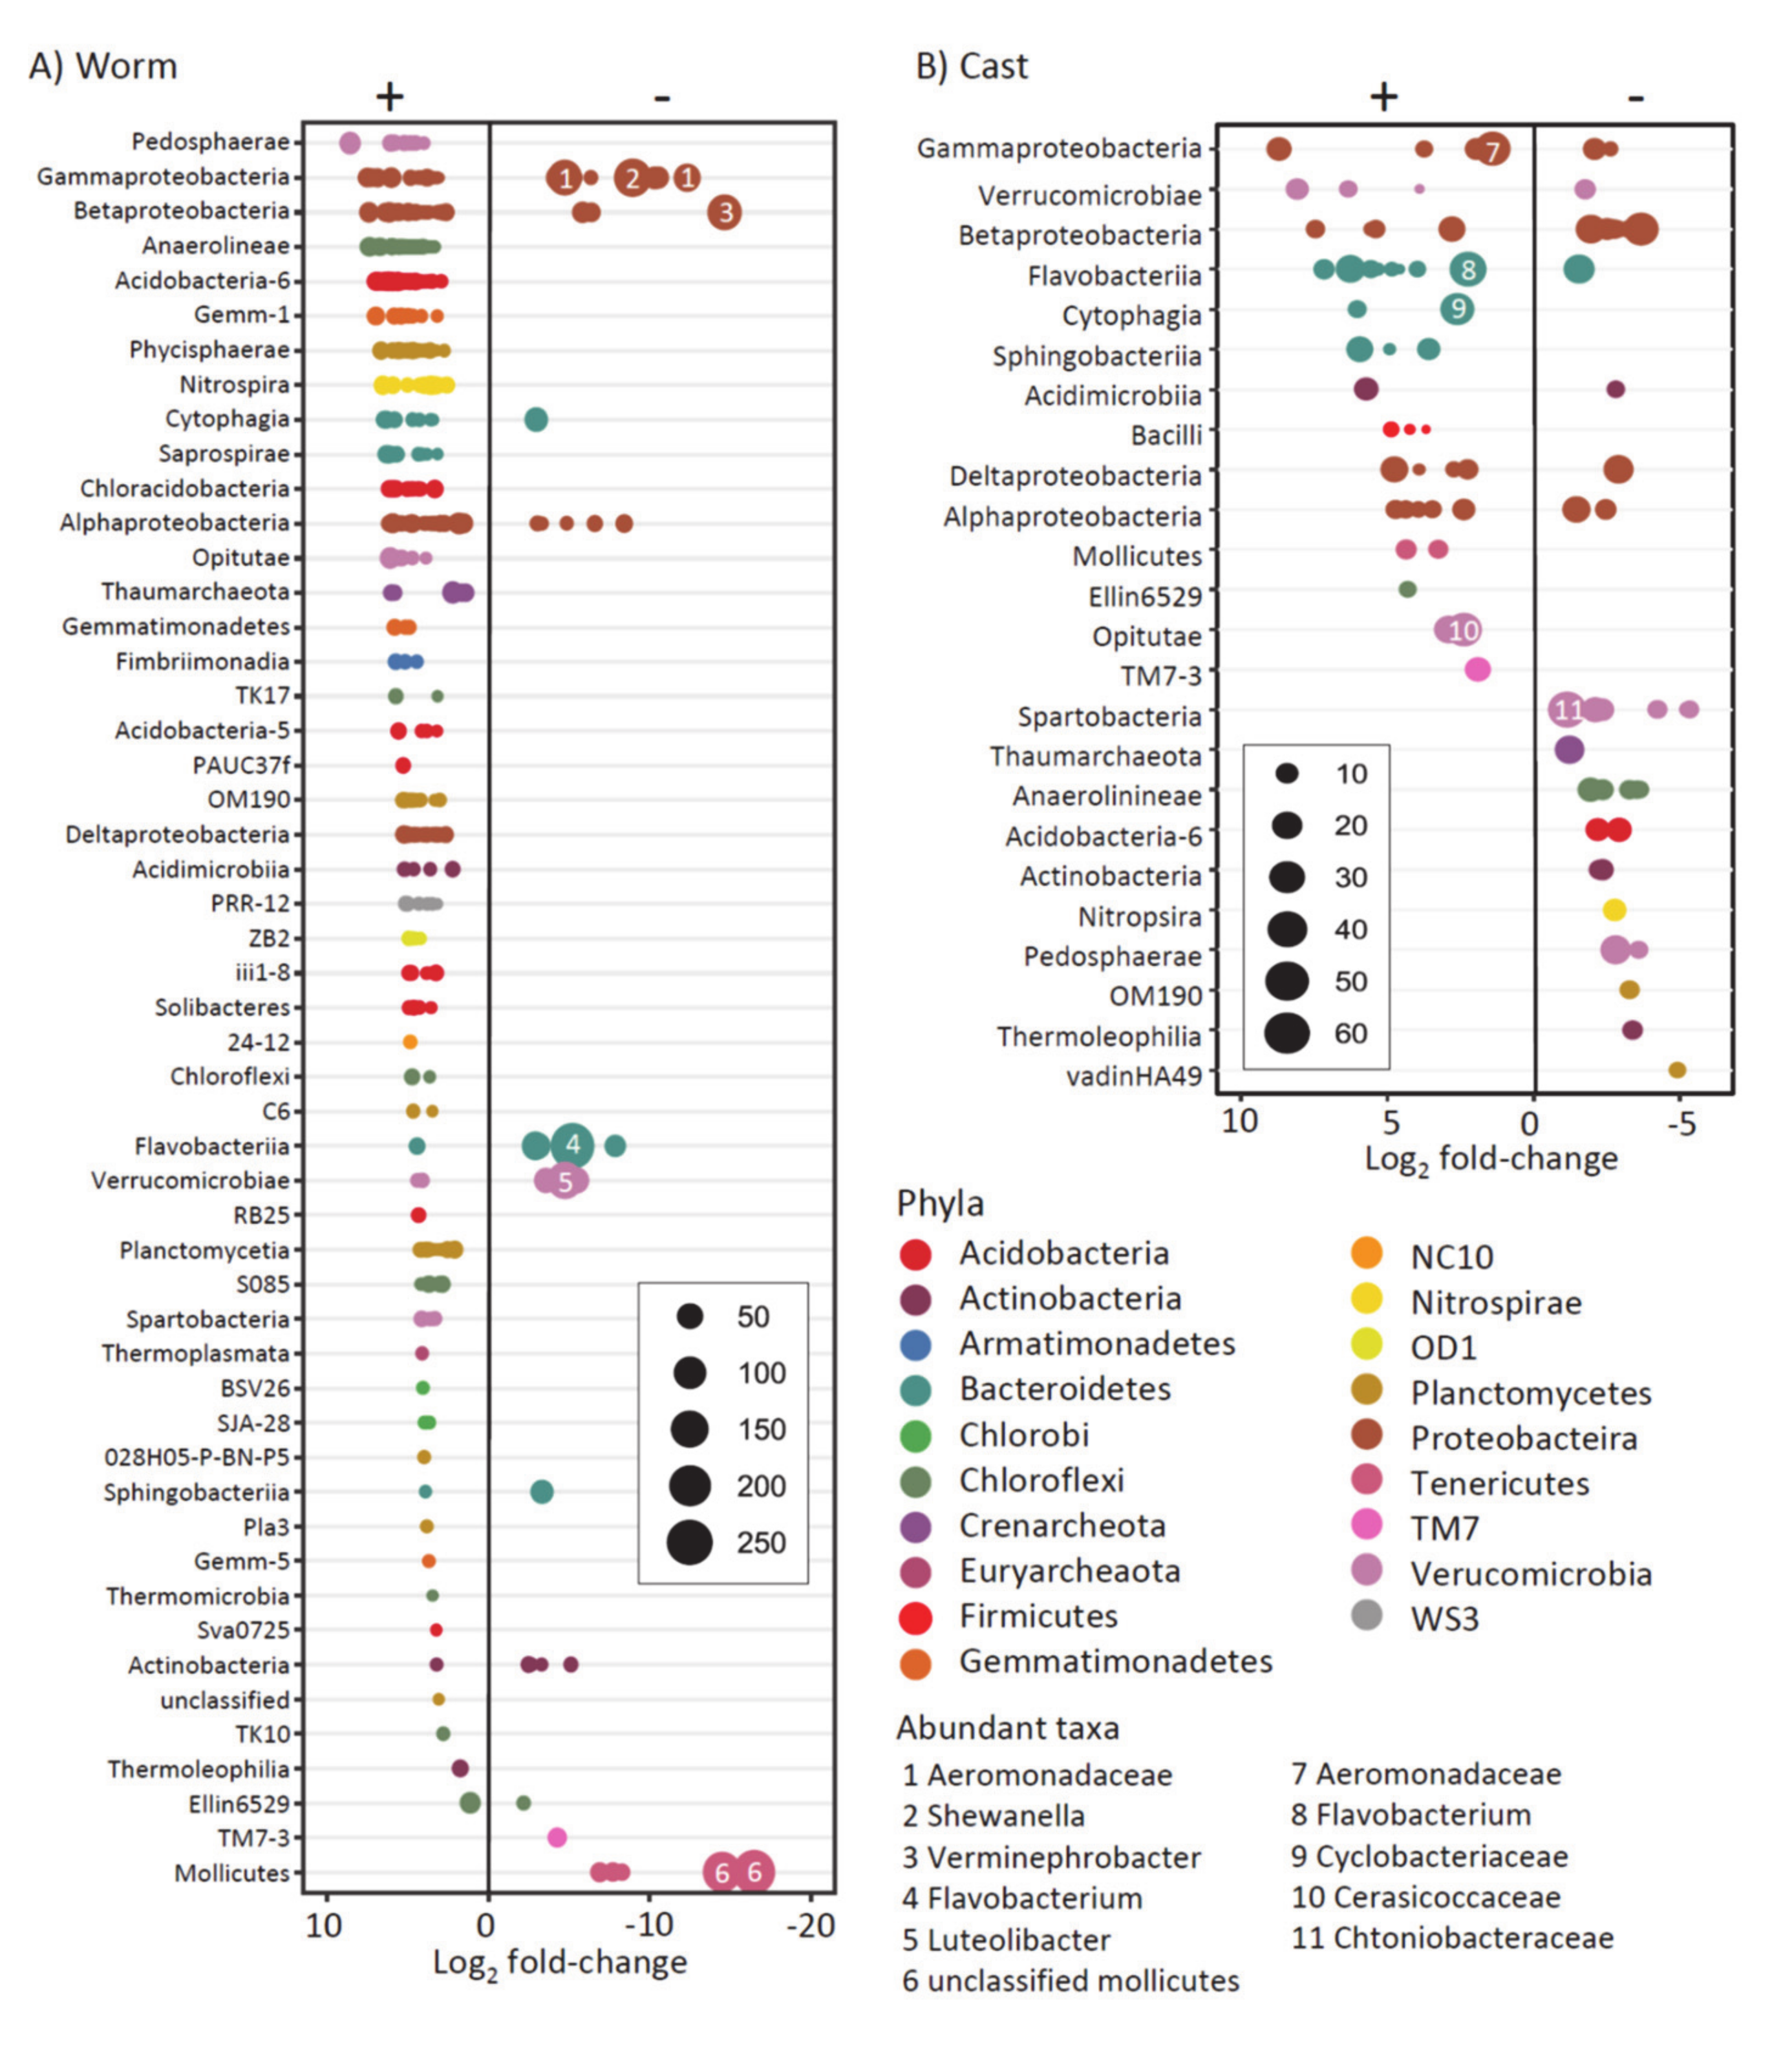
4.2. Effect of Hg in Earthworm, Cast and Soil Microbiomes

We hypothesized that the diversity and community structure of the earthworm gut microbiome, as well as the microbiome of earthworm cast and the surrounding soil, would be affected by Hg-contamination (first hypothesis). This pattern was clearly observed in experiment 2, where the richness and Shannon diversity index of both the soil in the pots and the earthworm gut bacterial communities decreased in the Hg-contaminated treatments. However, in experiment 1, in which the Hg contamination was milder and consisted of only a single Hg-contaminated soil layer, the bacterial and fungal alpha diversity increased in Hg-contaminated earthworm samples. A similar increase in bacterial alpha diversity was previously observed along the soil Hg-contamination gradient at the same site where the soil was collected for our study [24]. Moreover, this increase in diversity might support the rise of rare or weaker competitor OTUs under intermediate stress, as proposed by the disturbance hypothesis in community ecology [50]. Hg-tolerant OTUs might therefore be favored under Hg-contaminated treatments, as their resistance capabilities to Hg boost their competitive abilities over dominant taxa under natural soil conditions. Furthermore, soil bacterial diversity was found to be positively correlated with total Hg and MeHg content [21].
The strong shift of the bacterial and fungal community structure in the Hg-contaminated earthworm samples is potentially a direct consequence of the high proportion of accumulated THg and MeHg in the earthworm tissues. Such a large change within the microbial community structure was not observed between the Hg-contaminated and uncontaminated soil and cast samples. The effect of the Hg-contaminated treatments was also more pronounced for the bacterial than the fungal communities in both experiments, suggesting a higher resistance of fungi to Hg contamination in the earthworm gut, similar to observations made in Hg-contaminated soils [5,13].
The drastic decrease in the relative abundance of the Mollicutes (phylum Firmicutes), largely dominating the uncontaminated earthworm bacterial community, is a direct cause of shift in the bacterial community structure. Interestingly, Firmicutes have been reported to dominate the gut microbiome of earthworms fed with organic compost, but their relative abundance decreased when the earthworms were fed with mineral soil [51]. However, to our knowledge, a sensitivity of the Firmicutes to heavy metal accumulation has not been reported elsewhere.
The dominant bacterial phyla observed in the Hg-contaminated earthworm samples, i.e., Chloroflexi, Acidobacteria, Actinobacteria, Planctomycetes, Proteobacteria, Bacteroidetes and Verrucomicrobia, are phyla that are rather ubiquitous in the soil and have been found previously in Hg-contaminated soils [24,47,52]. In accordance with our second hypothesis, we observed a number of tolerant bacterial and fungal taxa. These Hg-tolerant taxa were phylogenetically very diverse but grouped mostly within the phyla dominating the Hg-treated samples. This notwithstanding, taxonomically related taxa within the same phylum showed very different responses to Hg contamination; some relatively abundant taxa were clearly sensitive to Hg, whereas other taxa from the same classes were positively associated with the Hg-contaminated treatment. This was the case for taxa within the Beta- and Gammaproteobacteria, Flavobacteria and Verrucomicrobia classes. Taxa within the Proteobacteria and Verrucomicrobia were reported to be Hg-tolerant in Hg-contaminated soils [24,52], along with Gemmonatimanedetes [52], Burkholderia [5,47], and Rhodobiaceae and Chtoniobacter [24], which were not identified as Hg-tolerant taxa in earthworm samples in the present study. These differences might stem from the complexity of microbial communities in natural soil systems, as many environmental factors other than Hg also potentially shape the microbial community composition. These outcomes underline the need to perform more studies including earthworm gut microbiome analyses to disentangle the effects of soil properties and pollutants on the earthworm gut microbiome.

4.3. Effect of Hg on Earthworm Gut Parts

By looking closer into the digestive system of the earthworm, we were able to characterize differences in the bacterial community structure along the gut tract; the bacterial composition shifted gradually from soil in the pot to earthworm stomach, upper gut, and lower gut parts. This is in line with previous findings that the majority of bacterial taxa in the earthworm gut are highly similar to those in the soil [53], and that only few taxa are truly endemic to the gut microbiome (e.g., [54]). The ingested soil microbial taxa might therefore still be very abundant in the stomach and upper gut compartments, while taxa more specific to the earthworm microbiome dominate in the lower gut, such as the Gammaproteobacteria, whose relative abundance increased in the lower gut samples in both the uncontaminated and Hg-contaminated treatments.
In contrast to our third hypothesis, we did not find a clear difference in the Hg tolerance of the microbial community among earthworm gut parts. The shift in both bacterial and fungal community structure between upper and lower gut parts was less clear in the Hg-contaminated treatment. Furthermore, bacterial Mollicutes and Verminephrobacter sp., as well as fungal Yarrowia sp. and Penicillum sp., showed a consistently higher abundance in Hg-contaminated soil in all gut parts, suggesting that highly Hg-tolerant taxa are ubiquitous throughout the earthworm gut tract, similar to the persistence of gut-associated bacterial taxa observed in arsenic-contaminated soils [55].
The bacterial merA gene, encoding mercury reductase, is phylogenetically widely dispersed and is thus a good biomarker for Hg tolerance [22]. The merA gene was reported to be present in many bacterial phyla, including the dominant phyla found in the Hg-treated samples (e.g., Actinobacteria and Proteobacteria). This is a potential explanation for the phylogenetically highly widespread Hg-tolerant taxa found in the Hg-contaminated treatment. However, it is possible that external environmental conditions favor Hg reduction via the activation of the Hg reductase enzyme encoded by the merA gene.
The elevated concentration of Hg in the earthworm gut, highest in the gastrodermis [49], might thus favor microbial Hg reduction. Moreover, the microhabitat conditions of the earthworm gut, such as high moisture, sufficient availability of organic nutrients and adequate carbon substrate [55,56], might augment the efficiency of the Hg reduction, similar to what has been described for denitrification in the earthworm gut [57]. However, no clear trend emerged from the present study to help understand the link between the earthworm gut microhabitat and bacterial Hg reduction. Future investigations should be conducted to foster a mechanistic understanding of bacterial Hg reduction within the earthworm gut.

5. Conclusions

Although the high bioaccumulation of THg and MeHg in earthworm tissue evolving in long-term Hg-contaminated soils did not directly affect the physiology of the earthworms, it induced clear changes in their associated microbial community, especially the bacterial one. Overall, soil Hg contamination led to large shifts within the bacterial and fungal community structure in the earthworm gut. Bacterial taxa were observed to be more sensitive to Hg than fungal ones, and Mollicutes taxa in particular were observed to dominate the earthworm gut microbiome and decrease considerably in Hg-impacted soils. Hg-tolerant taxa were widespread phylogenetically, similar to the mercury reductase gene used for detoxification. Changes in the bacterial composition along the earthworm digestive tract were observed; however, highly Hg-tolerant taxa were constant throughout the gut parts. Altogether, the impact of Hg on the earthworm gut microbiome is pronounced, and further research is needed to fully understand the role of the microbial community in Hg methylation, reduction and accumulation and to complete our understanding of Hg transformation mechanisms in the soil that might be relevant opportunities for the bioremediation of Hg-contaminated soils.

Supplementary Materials

The following are available online at https://www.mdpi.com/2076-3417/10/7/2565/s1.

Author Contributions

J.B., S.G. and A.F. designed and conducted both experiments and performed laboratory analyses with the help of A.M. J.B. and A.F. analyzed the data. J.B. and A.F. wrote the manuscript with inputs from SG and AM. All authors have read and agreed to the published version of the manuscript.

Funding

Financial support was provided by the Federal Office for the Environment (13.0002.PJ/N381-1032). AM acknowledge funding from the Swiss National Science Foundation (SNSF, nr. PP00P2_163661).

Acknowledgments

We thank Thomas Koepfli and Markus Ruffener from the Raron (CH) community for allowing us to collect soil samples in the vicinity of the Grossgrundkanal. We thank Beat Stierli (WSL) for laboratory assistance and Lorenz Gfeller (cLab, Institute of Geography, University of Bern). We acknowledge the Genetic Diversity Center (GDC) at ETH Zurich for providing access to high-performance computing facilities. We thank Melissa Dawes for valuable comments during the writing of the article.

Conflicts of Interest

The authors declare no conflict of interest.

References

  1. Clarkson, T.W.; Magos, L.; Myers, G.J. The Toxicology of Mercury—Current Exposures and Clinical Manifestations. N. Engl. J. Med. 2003, 349, 1731–1737. [Google Scholar] [CrossRef] [PubMed] [Green Version]
  2. Organometallic Compounds in the Environment: Principles and Reactions; Craig, P.J. (Ed.) Longman: Harlow, UK, 1986; ISBN 978-0-582-46361-5. [Google Scholar]
  3. Laffont, L.; Maurice, L.; Amouroux, D.; Navarro, P.; Monperrus, M.; Sonke, J.E.; Behra, P. Mercury speciation analysis in human hair by species-specific isotope-dilution using GC–ICP–MS. Anal. Bioanal. Chem. 2013, 405, 3001–3010. [Google Scholar] [CrossRef] [PubMed]
  4. Mahbub, K.R.; Krishnan, K.; Naidu, R.; Megharaj, M. Mercury toxicity to Eisenia fetida in three different soils. Environ. Sci. Pollut. Res. 2017, 24, 1261–1269. [Google Scholar] [CrossRef]
  5. Frossard, A.; Hartmann, M.; Frey, B. Tolerance of the forest soil microbiome to increasing mercury concentrations. Soil Biol. Biochem. 2017, 105, 162–176. [Google Scholar] [CrossRef]
  6. Ravichandran, M. Interactions between mercury and dissolved organic matter––A review. Chemosphere 2004, 55, 319–331. [Google Scholar] [CrossRef] [PubMed]
  7. Le Roux, S.; Baker, P.; Crouch, A. Bioaccumulation of total mercury in the earthworm Eisenia andrei. SpringerPlus 2016, 5, 681. [Google Scholar] [CrossRef] [PubMed] [Green Version]
  8. Gabriel, M.C.; Williamson, D.G. Principal Biogeochemical Factors Affecting the Speciation and Transport of Mercury through the terrestrial environment. Environ. Geochem. Health 2004, 26, 421–434. [Google Scholar] [CrossRef]
  9. Zhang, Z.-S.; Lu, X.-G.; Wang, Q.-C.; Zheng, D.-M. Mercury, Cadmium and Lead Biogeochemistry in the Soil–Plant–Insect System in Huludao City. Bull. Environ. Contam. Toxicol. 2009, 83, 255–259. [Google Scholar] [CrossRef] [Green Version]
  10. Brown, G.G. How do earthworms affect microfloral and faunal community diversity? Plant Soil 1995, 170, 209–231. [Google Scholar] [CrossRef]
  11. Dang, F.; Zhao, J.; Greenfield, B.K.; Zhong, H.; Wang, Y.; Yang, Z.; Zhou, D. Soil geochemistry and digestive solubilization control mercury bioaccumulation in the earthworm Pheretima guillemi. J. Hazard. Mater. 2015, 292, 44–51. [Google Scholar] [CrossRef]
  12. Hinton, J.J.; Veiga, M.M. Using Earthworms to Assess Hg Distribution and Bioavailability in Gold Mining Soils. Soil Sediment Contam. Int. J. 2009, 18, 512–524. [Google Scholar] [CrossRef]
  13. Rieder, S.R.; Brunner, I.; Daniel, O.; Liu, B.; Frey, B. Methylation of Mercury in Earthworms and the Effect of Mercury on the Associated Bacterial Communities. PLoS ONE 2013, 8, e61215. [Google Scholar] [CrossRef] [PubMed]
  14. Gilmour, C.C.; Elias, D.A.; Kucken, A.M.; Brown, S.D.; Palumbo, A.V.; Schadt, C.W.; Wall, J.D. Sulfate-Reducing Bacterium Desulfovibrio desulfuricans ND132 as a Model for Understanding Bacterial Mercury Methylation. Appl. Environ. Microbiol. 2011, 77, 3938–3951. [Google Scholar] [CrossRef] [PubMed] [Green Version]
  15. Álvarez, C.R.; Moreno, M.J.; Bernardo, F.G.; Martín-Doimeadios, R.R.; Nevado, J.B. Mercury methylation, uptake and bioaccumulation by the earthworm Lumbricus terrestris (Oligochaeta). Appl. Soil Ecol. 2014, 84, 45–53. [Google Scholar] [CrossRef]
  16. Martín-Doimeadios, R.C.R.; Mateo, R.; Jiménez-Moreno, M. Is gastrointestinal microbiota relevant for endogenous mercury methylation in terrestrial animals? Environ. Res. 2017, 152, 454–461. [Google Scholar] [CrossRef]
  17. Kaschak, E.; Knopf, B.; Petersen, J.H.; Bings, N.H.; König, H. Biotic methylation of mercury by intestinal and sulfate-reducing bacteria and their potential role in mercury accumulation in the tissue of the soil-living Eisenia foetida. Soil Biol. Biochem. 2014, 69, 202–211. [Google Scholar] [CrossRef]
  18. Parks, J.M.; Johs, A.; Podar, M.; Bridou, R.; Hurt, R.A.; Smith, S.D.; Tomanicek, S.J.; Qian, Y.; Brown, S.D.; Brandt, C.C.; et al. The genetic basis for bacterial mercury methylation. Science 2013, 339, 1332–1335. [Google Scholar] [CrossRef] [Green Version]
  19. Podar, M.; Gilmour, C.C.; Brandt, C.C.; Soren, A.; Brown, S.D.; Crable, B.R.; Palumbo, A.V.; Somenahally, A.C.; Elias, D.A. Global prevalence and distribution of genes and microorganisms involved in mercury methylation. Sci. Adv. 2015, 1, e1500675. [Google Scholar] [CrossRef] [Green Version]
  20. Gilmour, C.C.; Podar, M.; Bullock, A.L.; Graham, A.M.; Brown, S.D.; Somenahally, A.C.; Johs, A.; Hurt, R.A.; Bailey, K.L.; Elias, D.A. Mercury Methylation by Novel Microorganisms from New Environments. Environ. Sci. Technol. 2013, 47, 11810–11820. [Google Scholar] [CrossRef]
  21. Liu, Y.-R.; Delgado-Baquerizo, M.; Bi, L.; Zhu, J.; He, J.-Z. Consistent responses of soil microbial taxonomic and functional attributes to mercury pollution across China. Microbiome 2018, 6, 183. [Google Scholar] [CrossRef]
  22. Boyd, E.S.; Barkay, T. The Mercury Resistance Operon: From an Origin in a Geothermal Environment to an Efficient Detoxification Machine. Front. Microbiol. 2012, 3. [Google Scholar] [CrossRef] [PubMed] [Green Version]
  23. Yang, J.; Takaoka, M.; Sano, A.; Matsuyama, A.; Yanase, R. Vertical Distribution of Total Mercury and Mercury Methylation in a Landfill Site in Japan. Int. J. Environ. Res. Public. Health 2018, 15, 1252. [Google Scholar] [CrossRef] [Green Version]
  24. Frossard, A.; Donhauser, J.; Mestrot, A.; Gygax, S.; Bååth, E.; Frey, B. Long- and short-term effects of mercury pollution on the soil microbiome. Soil Biol. Biochem. 2018, 120, 191–199. [Google Scholar] [CrossRef]
  25. Naguib, M.M.; Khairalla, A.S.; El-Gendy, A.O.; Elkhatib, W.F. Isolation and characterization of mercury-resistant bacteria from wastewater sources in Egypt. Can. J. Microbiol. 2019, 65, 308–321. [Google Scholar] [CrossRef] [PubMed]
  26. Gilli, R.S.; Karlen, C.; Weber, M.; Rüegg, J.; Barmettler, K.; Biester, H.; Boivin, P.; Kretzschmar, R. Speciation and Mobility of Mercury in Soils Contaminated by Legacy Emissions from a Chemical Factory in the Rhône Valley in Canton of Valais, Switzerland. Soil Syst. 2018, 2, 44. [Google Scholar] [CrossRef] [Green Version]
  27. Gygax, S.; Gfeller, L.; Wilcke, W.; Mestrot, A. Emerging investigator series: Mercury mobility and methylmercury formation in a contaminated agricultural flood plain: Influence of flooding and manure addition. Environ. Sci. Process. Impacts 2019, 21, 2008–2019. [Google Scholar] [CrossRef] [PubMed]
  28. Osterwalder, S.; Huang, J.-H.; Shetaya, W.H.; Agnan, Y.; Frossard, A.; Frey, B.; Alewell, C.; Kretzschmar, R.; Biester, H.; Obrist, D. Mercury emission from industrially contaminated soils in relation to chemical, microbial, and meteorological factors. Environ. Pollut. 2019, 250, 944–952. [Google Scholar] [CrossRef]
  29. Gee, G.W.; Bauder, J.W. Particle-size analysis. In Methods of Soil Analysis; American Society of Agronomy: Madison, WI, USA, 1986. [Google Scholar]
  30. Lazzaro, A.; Hartmann, M.; Blaser, P.; Widmer, F.; Schulin, R.; Frey, B. Bacterial community structure and activity in different Cd-treated forest soils: Bacterial structure and activity in Cd-treated forest soils. FEMS Microbiol. Ecol. 2006, 58, 278–292. [Google Scholar] [CrossRef] [Green Version]
  31. Frey, B.; Rime, T.; Phillips, M.; Stierli, B.; Hajdas, I.; Widmer, F.; Hartmann, M. Microbial diversity in European alpine permafrost and active layers. FEMS Microbiol. Ecol. 2016, 92, fiw018. [Google Scholar] [CrossRef] [Green Version]
  32. Larose, C.; Prestat, E.; Cecillon, S.; Berger, S.; Malandain, C.; Lyon, D.; Ferrari, C.; Schneider, D.; Dommergue, A.; Vogel, T.M. Interactions between Snow Chemistry, Mercury Inputs and Microbial Population Dynamics in an Arctic Snowpack. PLoS ONE 2013, 8, e79972. [Google Scholar] [CrossRef] [Green Version]
  33. Frey, B.; Niklaus, P.A.; Kremer, J.; Lüscher, P.; Zimmermann, S. Heavy-machinery traffic impacts methane emissions as well as methanogen abundance and community structure in oxic forest soils. Appl. Environ. Microbiol. 2011, 77, 6060–6068. [Google Scholar] [CrossRef] [Green Version]
  34. Edgar, R.C.; Haas, B.J.; Clemente, J.C.; Quince, C.; Knight, R. UCHIME improves sensitivity and speed of chimera detection. Bioinformatics 2011, 27, 2194–2200. [Google Scholar] [CrossRef] [PubMed] [Green Version]
  35. Edgar, R.C.; Flyvbjerg, H. Error filtering, pair assembly and error correction for next-generation sequencing reads. Bioinformatics 2015, 31, 3476–3482. [Google Scholar] [CrossRef] [PubMed] [Green Version]
  36. Nikolenko, S.I.; Korobeynikov, A.I.; Alekseyev, M.A. BayesHammer: Bayesian clustering for error correction in single-cell sequencing. BMC Genom. 2013, 14, S7. [Google Scholar] [CrossRef] [PubMed] [Green Version]
  37. Martin, M. Cutadapt removes adapter sequences from high-throughput sequencing reads. EMBnet. J. 2011, 17, 10–12. [Google Scholar] [CrossRef]
  38. Edgar, R.C. UPARSE: Highly accurate OTU sequences from microbial amplicon reads. Nat. Methods 2013, 10, 996–998. [Google Scholar] [CrossRef]
  39. Wang, Q.; Garrity, G.M.; Tiedje, J.M.; Cole, J.R. Naïve Bayesian Classifier for Rapid Assignment of rRNA Sequences into the New Bacterial Taxonomy. Appl. Environ. Microbiol. 2007, 73, 5261–5267. [Google Scholar] [CrossRef] [PubMed] [Green Version]
  40. Schloss, P.D.; Westcott, S.L.; Ryabin, T.; Hall, J.R.; Hartmann, M.; Hollister, E.B.; Lesniewski, R.A.; Oakley, B.B.; Parks, D.H.; Robinson, C.J.; et al. Introducing mothur: Open-Source, Platform-Independent, Community-Supported Software for Describing and Comparing Microbial Communities. Appl. Environ. Microbiol. 2009, 75, 7537–7541. [Google Scholar] [CrossRef] [Green Version]
  41. Quast, C.; Pruesse, E.; Yilmaz, P.; Gerken, J.; Schweer, T.; Yarza, P.; Peplies, J.; Glöckner, F.O. The SILVA ribosomal RNA gene database project: Improved data processing and web-based tools. Nucleic Acids Res. 2013, 41, D590–D596. [Google Scholar] [CrossRef]
  42. The UNITE Database for Molecular Identification of Fungi–Recent Updates and Future Perspectives—Abarenkov-2010-New Phytologist-Wiley Online Library. Available online: https://nph.onlinelibrary.wiley.com/doi/10.1111/j.1469-8137.2009.03160.x (accessed on 1 October 2019).
  43. R Development Core Team. R: A Language and Environment for Statistical Computing; R Foundation for Statistical Computing: Vienna, Austria, 2019; Available online: https://www.r-project.org (accessed on 1 October 2019).
  44. Gobet, A.; Quince, C.; Ramette, A. Multivariate Cutoff Level Analysis (MultiCoLA) of large community data sets. Nucleic Acids Res. 2010, 38, e155. [Google Scholar] [CrossRef] [Green Version]
  45. Anders, S.; Huber, W. Differential expression analysis for sequence count data. Nat. Preced. 2010. [Google Scholar] [CrossRef]
  46. Nahmani, J.; Hodson, M.E.; Black, S. A review of studies performed to assess metal uptake by earthworms. Environ. Pollut. 2007, 145, 402–424. [Google Scholar] [CrossRef] [PubMed]
  47. Wang, L.; Wang, L.; Zhan, X.; Huang, Y.; Wang, J.; Wang, X. Response mechanism of microbial community to the environmental stress caused by the different mercury concentration in soils. Ecotoxicol. Environ. Saf. 2020, 188, 109906. [Google Scholar] [CrossRef] [PubMed]
  48. He, C.; Arizono, K.; Ji, H.; Yakushiji, Y.; Zhang, D.; Huang, K.; Ishibashi, Y. Comparison of mercury and methylmercury bioaccumulation in earthworms (Bimastus parvus) native to landfill-leachate-contaminated forest soil. J. Toxicol. Sci. 2018, 43, 459–471. [Google Scholar] [CrossRef] [PubMed]
  49. Tang, H.; Yan, Q.; Wang, X.; Ai, X.; Robin, P.; Matthew, C.; Qiu, J.; Li, X.; Li, Y. Earthworm (Eisenia fetida) behavioral and respiration responses to sublethal mercury concentrations in an artificial soil substrate. Appl. Soil Ecol. 2016, 104, 48–53. [Google Scholar] [CrossRef]
  50. Connell, J.H. Diversity in Tropical Rain Forests and Coral Reefs. Science 1978, 199, 1302–1310. [Google Scholar] [CrossRef] [Green Version]
  51. Liu, D.; Lian, B.; Wu, C.; Guo, P. A comparative study of gut microbiota profiles of earthworms fed in three different substrates. Symbiosis 2018, 74, 21–29. [Google Scholar] [CrossRef]
  52. Hu, H.; Li, M.; Wang, G.; Drosos, M.; Li, Z.; Hu, Z.; Xi, B. Water-soluble mercury induced by organic amendments affected microbial community assemblage in mercury-polluted paddy soil. Chemosphere 2019, 236, 124405. [Google Scholar] [CrossRef]
  53. Egert, M.; Marhan, S.; Wagner, B.; Scheu, S.; Friedrich, M.W. Molecular profiling of 16S rRNA genes reveals diet-related differences of microbial communities in soil, gut, and casts of Lumbricus terrestris L. (Oligochaeta: Lumbricidae). FEMS Microbiol. Ecol. 2004, 48, 187–197. [Google Scholar] [CrossRef] [Green Version]
  54. Schramm, A.; Davidson, S.K.; Dodsworth, J.A.; Drake, H.L.; Stahl, D.A.; Dubilier, N. Acidovorax-like symbionts in the nephridia of earthworms. Environ. Microbiol. 2003, 5, 804–809. [Google Scholar] [CrossRef]
  55. Pass, D.A.; Morgan, A.J.; Read, D.S.; Field, D.; Weightman, A.J.; Kille, P. The effect of anthropogenic arsenic contamination on the earthworm microbiome. Environ. Microbiol. 2015, 176, 1884–1896. [Google Scholar] [CrossRef] [PubMed]
  56. Drake, H.L.; Horn, M.A. As the Worm Turns: The Earthworm Gut as a Transient Habitat for Soil Microbial Biomes. Annu. Rev. Microbiol. 2007, 61, 169–189. [Google Scholar] [CrossRef] [PubMed]
  57. Barois, I.; Lavelle, P. Changes in respiration rate and some physicochemical properties of a tropical soil during transit through Pontoscolex corethrurus (glossoscolecidae, oligochaeta). Soil Biol. Biochem. 1986, 18, 539–541. [Google Scholar] [CrossRef]
Figure 1. Mercury reductase A gene (merA) abundance across the soil and earthworm gut parts for uncontaminated and Hg-contaminated treatments (experiment 2). Sto = stomach, UgT = upper gut tissue, UgS = upper gut soil, LgT = lower gut tissue, LgS = lower gut soil.
Applsci 10 02565 g001
Figure 2. Shannon diversity index for the bacterial (A) and fungal (B) communities in experiment 1 and for the bacterial (C) and fungal (D) communities in experiment 2. Sto = stomach, UgT = upper gut tissue, UgS = upper gut soil, LgT = lower gut tissue, LgS = lower gut soil.
Applsci 10 02565 g002
Figure 3. Beta diversity of the bacterial (A) and fungal (B) communities in experiment 1, presented in a non-metric multidimensional (NMDS) ordination including the three sample types (earthworm, cast and soil) and the two treatments (uncontaminated and Hg-contaminated).
Applsci 10 02565 g003
Figure 4. Relative abundance of bacterial (A) and fungal (B) phyla and classes across the treatments (Hg = Hg-contaminated, ctrl = uncontaminated control) and the sample types (soil, earthworm and cast) in experiment 1.
Applsci 10 02565 g004
Figure 5. Bacterial OTUs that were significantly increased or depleted in the Hg-contaminated treatment in comparison to the uncontaminated control in earthworm (A) and cast (B) samples from experiment 1. The size of the points represents the square root of the read abundance of the OTUs. The OTUs are listed by taxonomic class, and points are color coded according to taxonomic phylum.
Applsci 10 02565 g005
Figure 6. Beta diversity of the bacterial (A) and fungal (B) communities in experiment 2, presented in a canonical analysis of principal coordinates (CAP) ordination with the Hg treatments and the soil in the pot and earthworm gut parts as constrained factors. Sto = stomach, UgT = upper gut tissue, UgS = upper gut soil, LgT = lower gut tissue, LgS = lower gut soil.
Applsci 10 02565 g006
Figure 7. Relative abundance of bacterial (A) and fungal (B) phyla and classes across the treatments (Hg-contaminated, uncontaminated) and the sample types (soil, earthworm and cast) in experiment 2.
Applsci 10 02565 g007
Figure 8. Heatmap of abundant and responsive bacterial and fungal OTUs of each soil and earthworm gut part that was significantly increased or depleted in the Hg-contaminated treatment in experiment 2. The heatmap was computed using the responsive index of each OTU abundance × log2-fold change increase or decrease in the Hg-contaminated treatment in comparison to the uncontaminated one. Sto = stomach, UgT = upper gut tissue, UgS = upper gut soil, LgT = lower gut tissue, LgS = lower gut soil.
Applsci 10 02565 g008
Table 1. Physico-chemical characteristics of the uncontaminated (experiment 2 only) and Hg-contaminated (experiments 1 and 2) soils and the earthworms used for the incubation experiments. The difference between the soils or Hg treatment was tested with an ANOVA. Exp. 1 = Experiment 1, Exp. 2 = Experiment 2, THg = total mercury, MeHg = methyl-mercury. LOD = limit of detection.
Physico-Chemical CharacteristicsUncontaminated SoilHg-Contaminated SoilDiff. between Soils/
Hg Treatments
FP
Soil THg (µg g−1)0.25 ± 0.0936.10 ± 4.80609.8<0.001
Soil water-extractable Hg (µg kg−1)<LOD13.11 ± 4.76NANA
Soil MeHg (µg kg−1)<LOD4.59 ± 0.51NANA
pH8.30 ± 0.207.98 ± 0.089.60.021
Total C (%)2.71 ± 0.323.88 ± 0.945.60.056
Total N (%)0.17 ± 0.040.31 ± 0.088.90.025
Sand (%)44.40 ± 12.4429.35 ± 3.205.50.057
Silt (%)48.73 ± 12.0561.18 ± 1.954.10.088
Clay (%)7.00 ± 1.169.48 ± 1.477.10.037
Exp. 1—earthworm biomass difference (g)+0.67 ± 3.13+0.64 ± 4.560.00.975
Exp. 1—earthworm total Hg (µg g−1)0.39 ± 0.1012.55 ± 5.466.30.030
Exp. 1—earthworm MeHg (µg kg−1)6.41 ± 5.82172.54 ± 42.154.70.055
Exp. 2—earthworm biomass difference (g)−1.45 ± 0.65−1.35 ± 0.820.20.681
Exp. 2—earthworm total Hg (µg g−1) 0.46 ± 0.096.88 ± 2.9124.70.003
Table 2. Statistical differences (ANOVA) in bacterial and fungal richness and Shannon diversity index between Hg treatments and among sample types in experiment 1 and between Hg treatments and among earthworm gut parts in experiment 2. DF = Degrees of freedom.
Variable RichnessShannon Index
sample subset BacteriaFungiBacteriaFungi
DFFPFPFPFP
Experiment 1
Type of sample2, 297.50.00322.24<0.0013.80.0365.20.124
Treatment1, 2913.70.00131.49<0.00115.4<0.0013.80.062
earthworm samples1, 11107<0.001246.9<0.001868.5<0.00141.5<0.001
cast samples1, 114.40.06212.230.0061.00.3390.00.862
soil samples1, 59.70.0363.510.1341.40.3031.30.313
Experiment 2
Hg treatment1, 49/87 *22.1<0.0010.40.53134.0<0.0012.40.127
soil samples1, 3/7 *18.60.0500.10.718259.90.0040.10.743
stomach samples1, NA/15 *NANA0.50.500NANA3.00.103
UgT samples1, 5/15 *0.60.5000.10.7290.90.4010.50.480
UgS samples1, 7/15 *9.50.0220.30.6098.40.0270.20.650
LgT samples1, 14/15 *18.00.0010.00.8289.60.0080.00.896
LgS samples1, 14/15 *1.90.1920.00.8690.30.6180.10.736
Earthworm gut part5, 49/87 *7.4<0.0016.7<0.0018.4<0.0013.30.009
* for bacteria/fungi.
Table 3. Statistical differences (ANOVA) in bacterial and fungal beta-diversity between Hg treatments and among sample types in experiment 1 and between Hg treatments and among earthworm gut parts in experiment 2. DF = Degrees of freedom.
Variable BacteriaFungi
Sample subsetDFFPFP
Experiment 1
Type of sample2, 298.3<0.0014.6<0.001
Hg Treatment1, 295.9<0.0013.60.001
earthworm samples1, 1121.50.0025.00.002
cast samples1, 114.40.00212.30.002
soil samples1, 51.00.4000.90.700
Experiment 2
Hg treatments1, 49/87 *6.5<0.0014.0<0.001
soil samples1, 3/7 *2.50.3331.40.028
stomach samples1, NA/15 *NANA1.20.114
UgT samples1, 5/15 *1.30.3332.50.003
UgS samples1, 7/15 *1.50.1681.70.045
LgT samples1, 14/15 *1.20.3071.80.007
LgS samples1, 14/15 *1.00.4061.00.379
Earthworm gut part5, 49/87 *2.8<0.0012.1<0.001
* for bacteria/fungi.

