Article

Measurement of the Permissible Range of Consistency between Visual and Tactile Presentations of Line Grating Textures

Department of Human Communication, The University of Electro-Communication, 1-5-1 Chofugaoka, Chofu 182-8585, Tokyo, Japan
*
Author to whom correspondence should be addressed.
Appl. Sci. 2020, 10(7), 2494; https://doi.org/10.3390/app10072494
Submission received: 4 March 2020 / Revised: 23 March 2020 / Accepted: 2 April 2020 / Published: 5 April 2020
(This article belongs to the Special Issue Haptics: Technology and Applications)

Abstract

:
The use of real textures is the optimal way to present realistic textures in a VR (Virtual Reality) experience. However, a system may require the presentation of numerous objects in a VR scene, making the use of real objects impractical. One way to address this issue is to present visual and tactile texture information simultaneously such that multiple different visual textures are associated with one tactile sensation. This tactile sensation must differ from the visual information only to the extent that the user still perceives the stimuli as consistent. This study examines the consistency required for the simultaneous presentation of visual and tactile sensations for the purpose of reducing the number of necessary real textures in future VR systems. An experiment was conducted using one-dimensional textures (i.e., line gratings), in which participants were asked whether the presented visual texture was finer or coarser than the tactile texture. The results suggest that the relative size of the “permissible range” (the range over which the difference between the visual and tactile sensation is not recognized) is correlated with the spatial period of the real texture.

1. Introduction

In recent years, thanks to the remarkable development of VR technology, it has become possible to provide VR experiences with visual and auditory qualities comparable to reality. However, although tactile sensation is an important perception for reproducing a realistic environment, an established method of expressing it has not yet been proposed. Even now, many researchers have proposed various tactile expression methods.
Currently proposed methods can be roughly divided into two types. One is a method that simulates tactile sensation by stimulating the tactile receptive field using electrical stimulation [1] or vibration [2], and controlling the force sensation on a pen-shaped device or fingertip like PHANToM [3] or SPIDAR [4]. The other is a method that uses the real object. Specifically, “encounter-type tactile presentation” [5,6] is one of the main methods that provides a tactile sensation that matches the user’s experience by moving the object by machine or human power, or arranging a real object at the same coordinates as the object seen in the visual environment. Here, we focus on the latter type of haptic display.
A method that uses a real object for haptic presentation can present haptics comparable to reality. Furthermore, users do not need to wear the devices, which is otherwise a burden to the user. In contrast, in current studies on tactile presentation using real objects, it is necessary to prepare one tactile object for each type of materials to be visually represented. In other words, the types of materials that can be used for the VR experience are limited by the types of haptic objects that can be prepared.
One way to solve this issue is to express materials with similar tactile sensations using one real tactile texture. For example, if there are some materials that have a texture similar to a “grainy textured wood”, a standard “grained wood” is used in the tactile expression and a variety of visual images are presented. In this way, there is no need to prepare a large number of physical objects. To implement this technique, we need to determine the permissible range of consistency between visual and tactile presentations.
There are several published studies on the sensory characteristics of human senses such as sight and touch, and the characteristics of texture discrimination by vision or touch have been studied at least since the 1960s. For example, Klazkey et al. [7] and Ernst et al. [8] showed that the shape and size of an object are mainly perceived visually. Heller [9], in contrast, showed that tactile sensation rather than vision is used for recognition in texture perception. Tiest et al. [10] exposed participants to 96 textures, by either vision or touch only, and asked them to order the textures according to roughness. As a result, Tiest et al. concluded that tactile sensation is accurate for the perception of textures with a spatial period of less than 0.1 mm, and visual sensation is accurate for the perception for textures with a spatial period of 1 mm. Natsume et al. [11] conducted a discrimination experiment with similar settings, and suggested that texture discrimination may be modulated by skin vibration. Skedung et al. [12] concluded in another experiment that tactile texture discrimination was based on surface roughness and friction. In contrast, in Kuroki et al.’s research [13], they printed a texture sample with a 3D printer based on images of natural objects and performed a discrimination experiment by touch alone, but subjects could not discriminate most of the textures. In light of this result, they pointed out that the tactile discrimination ability of complex spatial structures may be insensitive. As mentioned above, there have been many studies on whether the visual or tactile sense is better at texture discrimination, but most of these are examples comparing visual-only experiences with tactile-only experiences. These differ from the scenario in which the visual and tactile senses are presented simultaneously.
Some studies have investigated the mixed perception of visual and tactile sensation. Focusing on softness, Cellini et al. [14] performed a discrimination experiment in which the user selected the softer of the two samples under visual-only, tactile-only, and combined conditions. As a result, they reported that visual information was integrated with tactile information at a ratio of about 35% in terms of visual and tactile superposition. Kwon et al. [15] and Simeon et al. [16] described the consistency required for the shape and size of a real object when superimposing the image and real object using VR or AR. Kitahara et al. [17] investigated the requirements of real objects in more detail than the research of Kwon et al. and investigated how subjects perceive texture when the materials presented in the video differs from that of the real objects.
This research focuses on the roughness of the texture surface and aims to investigate the degree of match required in the visual and tactile sensation when the tactile sensation of the image and the real object are presented simultaneously. We used line grating textures with different spatial frequencies.
In our previous reports [18], we measured permissible range of visual and tactile inconsistency using one-dimensional grating textures with ridges and grooves from 1.6 to 2.4 mm, which were obviously rough textures. In this paper, after improving the experimental method, experiments were performed on grating textures with ridges and grooves from 0.2 to 3.0 mm.

2. Materials and Methods

In this section, we describe a psychophysical experiment using one-dimensional grating texture to measure visual and tactile consistency.

2.1. Measurement Method

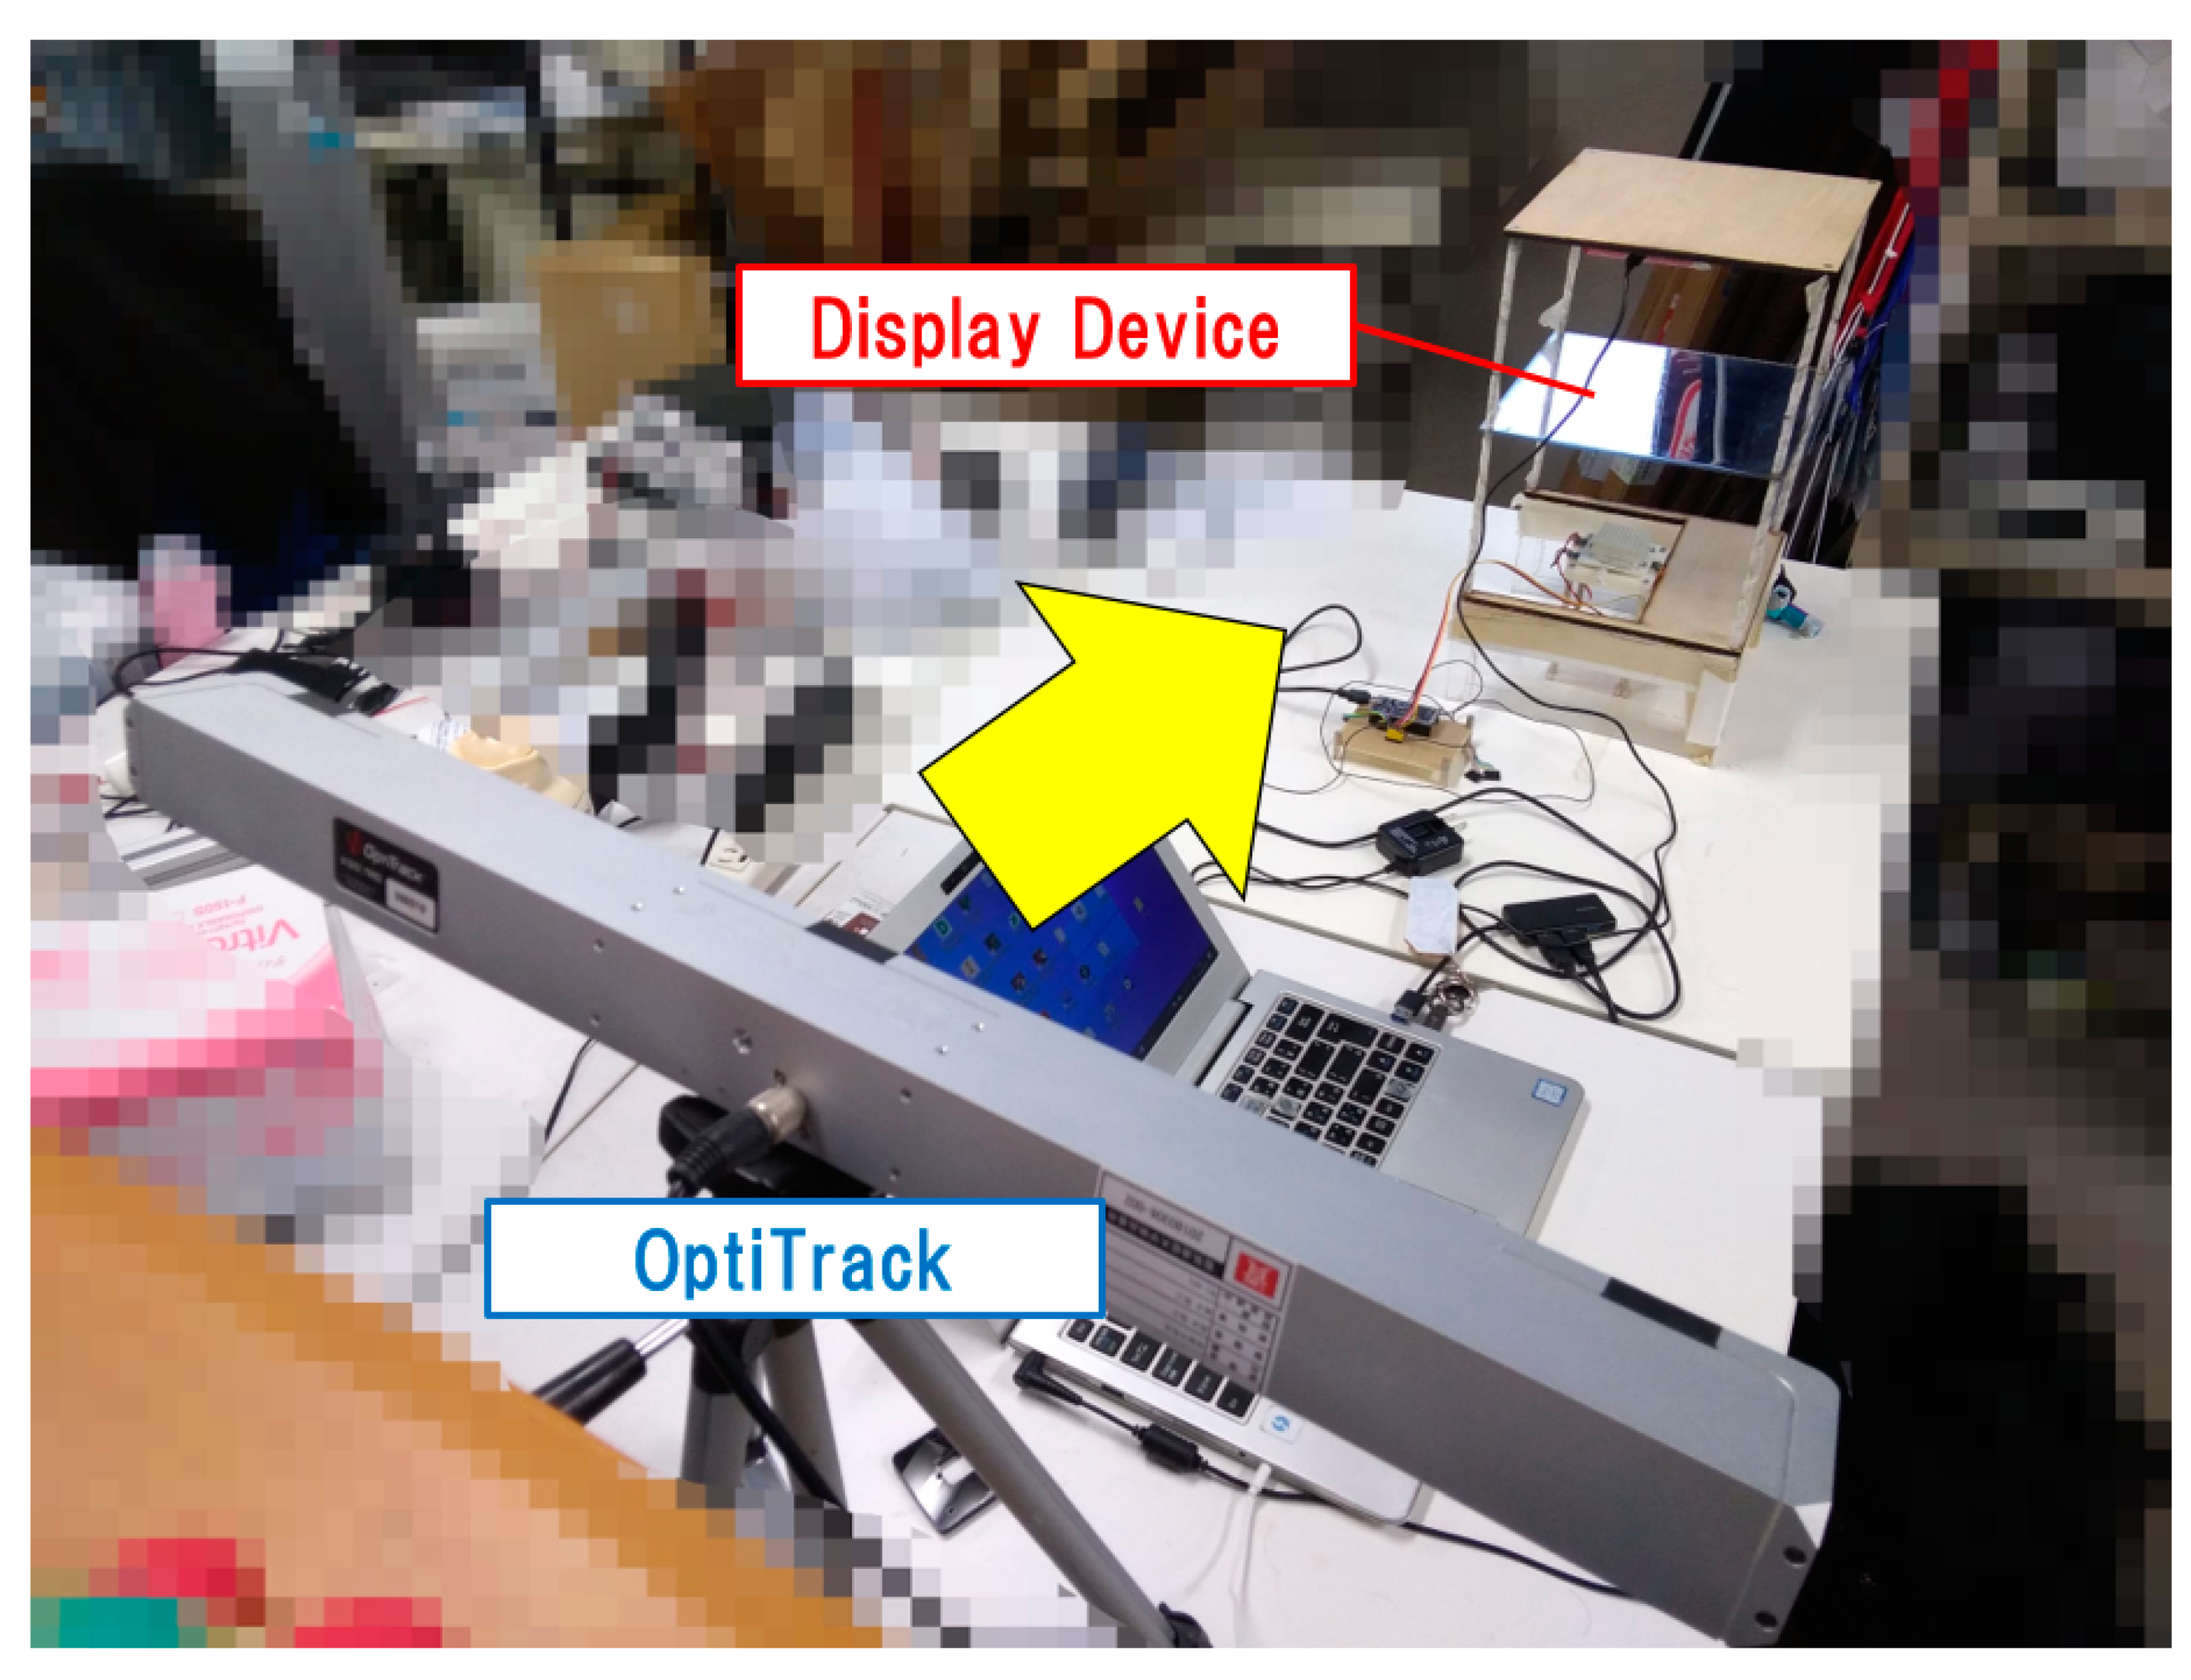
2.1.1. Display Equipment

The purpose of this study is to measure the permissible range of visual–tactile mismatch in the context of presenting visual and tactile modalities simultaneously. Therefore, it is desirable for the visual texture in the image and the real object for tactile presentation be presented at exactly the same position. We manufactured a display device to project an image of a monitor using a mirror, which is a common setup for tactile–visual multimodal studies [14].
The experimental setup is shown in Figure 1a. The top plate, mirror, and bottom plate are at equal distances of 12 cm. The visual display (smartphone) is put at the bottom of the top plate and the real texture is placed on the bottom plate. Therefore, the texture displayed on the smartphone and the real texture are optically in the same position.
We used a smartphone (Sony (Japan), Xperia XZ Premium SO-04J Luminous Chrome) with 4K image quality for visual presentation (Figure 1b). The smartphone was used because of its high resolution (0.0313 mm/px). We used ADB (a development command for Android OS) to change the settings of the smartphone so that the display maintains its resolution at 4K.
The real texture was placed on the pedestal, as shown in Figure 2. Three load cells were installed under the texture to measure the finger pushing force during the experiment. Each load cell could measure a force of up to 2.67 N, so the entire device could measure a force of up to 8.01 N if the finger was near the center of the texture stimulus.

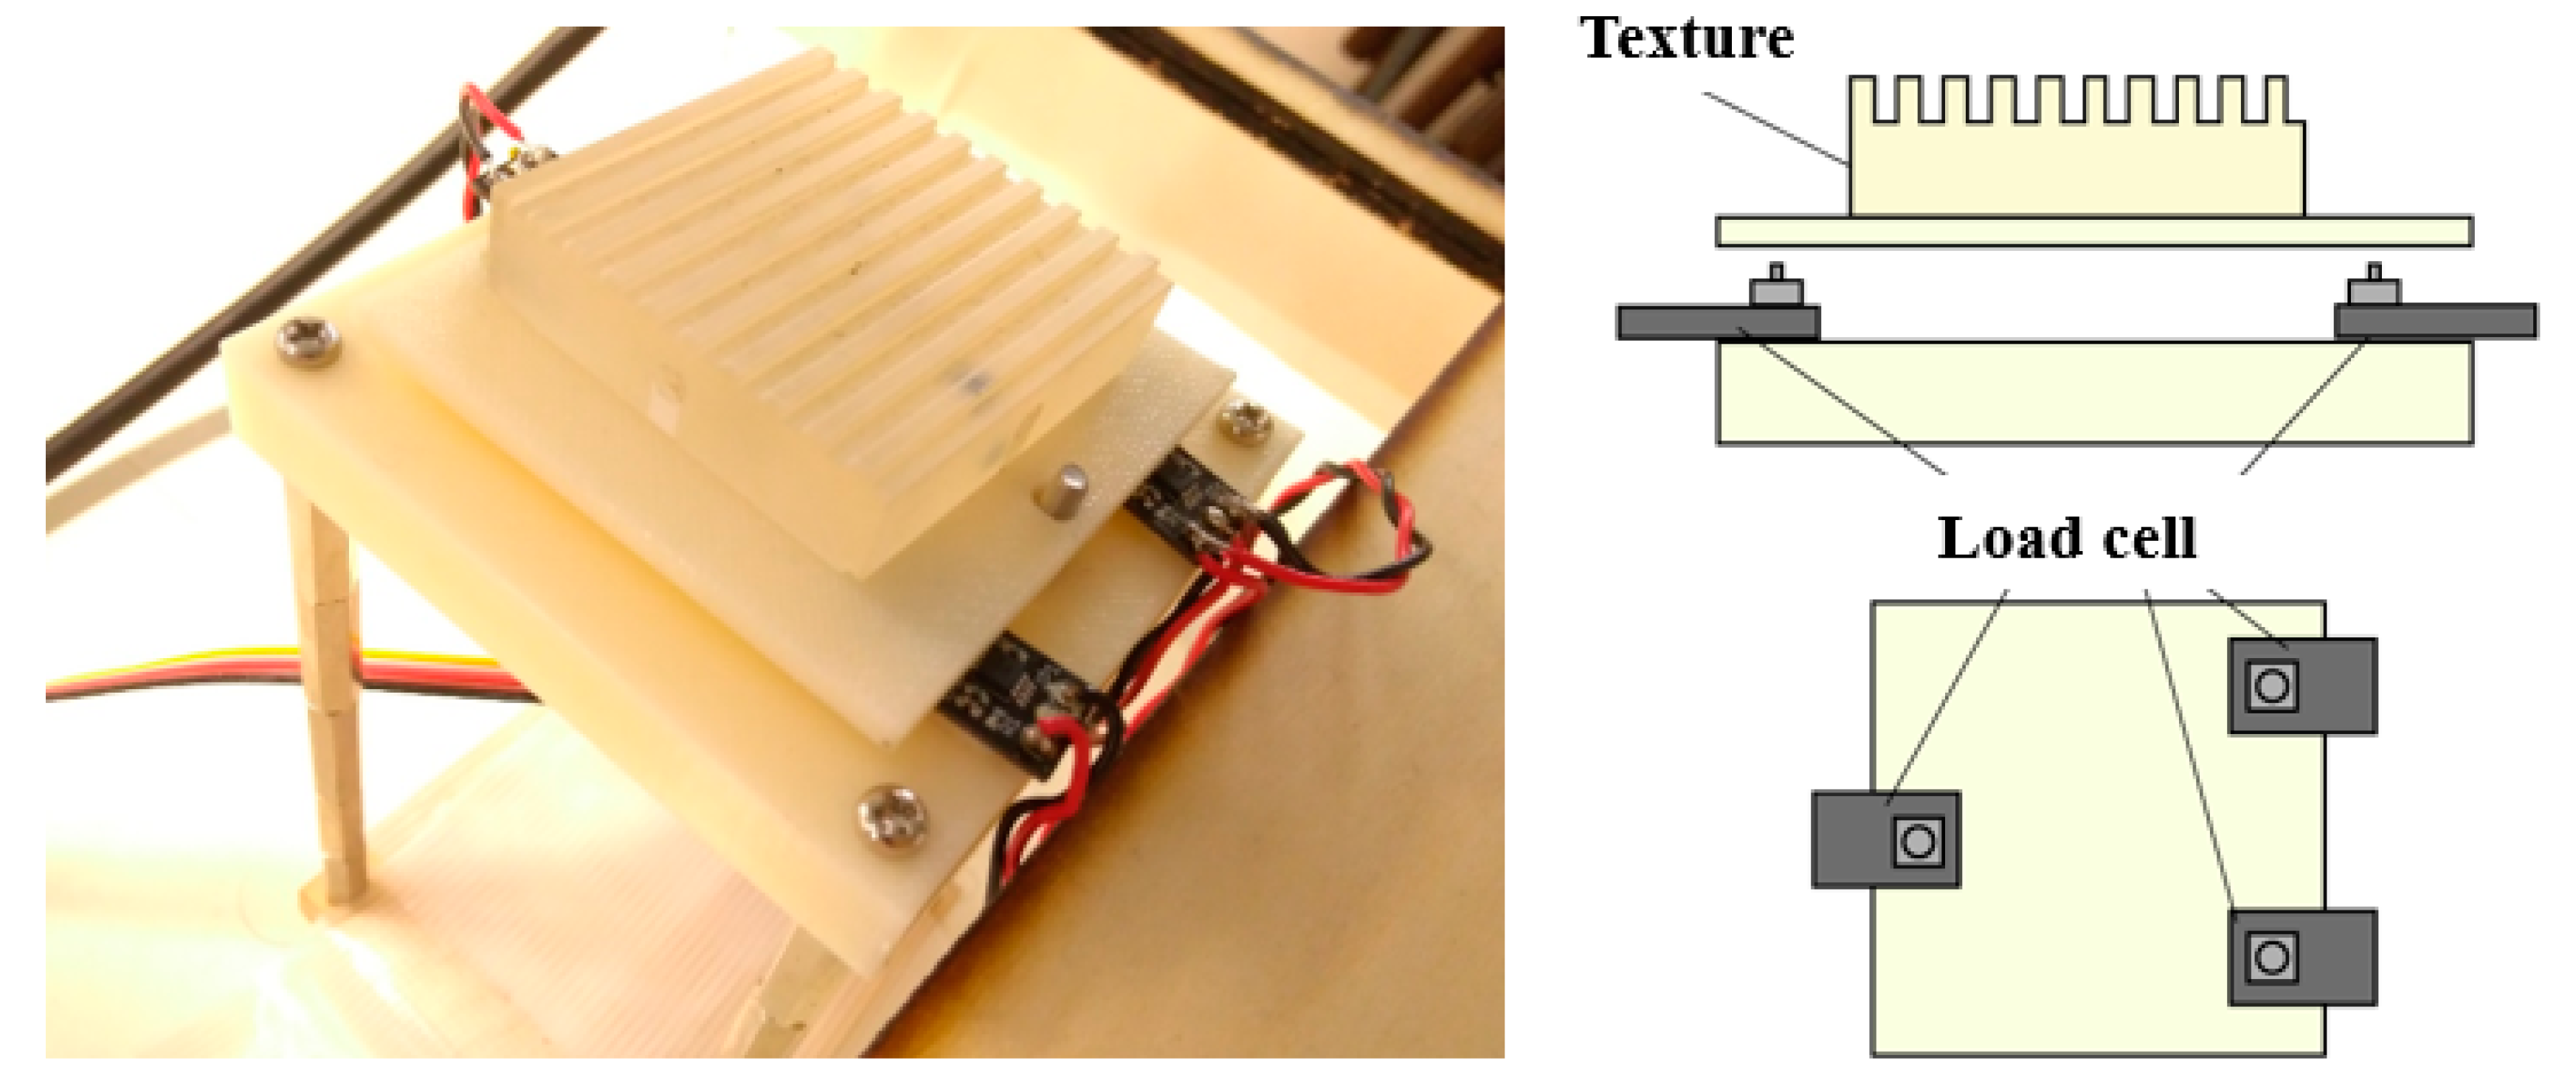
2.1.2. Real Textures

The textures used in this experiment were made of acrylic and printed using a 3D printer (Figure 3). All textures were the same except for the size of ridges and grooves. The texture blocks were 40 mm × 40 mm × 10 mm, and the groove depth was 1 mm. The size of the ridges and grooves on the texture surface are equal, and the sizes of one ridge and groove are 0.2 mm, 0.6 mm, 1.0 mm, 1.4 mm, 1.8 mm, 2.2 mm, 2.6 mm, and 3.0 mm for each texture.
In our previous report, we found that there was a permissible range of 0.4 mm or more for each condition of the reference stimulus, and thus we changed the size of the reference stimulus at 0.4 mm intervals. The lowest size (0.2 mm), which was the practical limit that the 3D printer used for texture creation, could accurately shape the ridges and grooves of square wave. The maximum size (3.0 mm) was provisional, but we considered that more than 3.0 mm ridge and groove might be grasped by “counting” the number of ridges, which is beyond the scope of this research.

2.1.3. Visual Textures

It is desirable for the video used for the experiment be a photographic image. However, in the case of an image that is close to reality, the apparent quality of the texture and the immersion in the experience may change depending on the rendering quality of the image and the arrangement and brightness of the lighting in the image. Therefore, in this study, experiments were performed using simple two-dimensional images with black and white stripes.
The images were drawn using the Processing environment [19]. Specifically, the drawing application created by Processing was installed on the smartphone and communicated with using the Unity program on a PC using OSC (OpenSound Control, a UDP-based communication method). Communication between the PC and smartphone was mediated via wireless LAN in our laboratory.
The texture is represented by white and black stripes, as shown in Figure 1b. The texture was adjusted for display on the smartphone screen in a 40 mm square. In the image, one white stripe represents a ridge, and one black stripe represents a groove. The minimum size at which the black and white stripes could be observed with the naked eye without moiré was two pixels (px). The smartphone used in the experiment required 1276 px to draw a 40 mm × 40 mm texture. Hence, the size of 1 px was 40/1276 = 0.0313 mm, and that of 2 px was 0.0626 mm. In the experiment, the participants were informed in advance that the width of the stripe corresponded to the ridge and groove of the real texture.

2.1.4. Tracking Fingertip and Measuring Pressure

In this experiment, the position of the subject’s fingertip was located in the image using the 3D tracking system OptiTrack (NaturalPoint, V120: Duo) [20] (Figure 4). To measure the position of an object with OptiTrack, we attached three retroreflective markers to the index finger of the participant’s dominant hand with Velcro (Figure 5). The measured finger position information was sent to the image drawing program via the official application Motive and was reflected in the pointer position. The red circle in Figure 1b corresponds to the fingertip of the subject.
OptiTrack tracking data was also used to analyze the behavior of the fingers of the subjects. The xyz coordinates of the fingertips were recorded every 0.2 s, and were output together to a CSV file when the subject finished touching the texture.

2.2. Procedure

The experiments in this report were conducted using the stairway method (1down-3up method) [21,22]. Specifically, we used a fixed standard stimulus in each tactile condition and varied the size of ridges and grooves in the image. Thus, we were able to determine the threshold at which the participants could not discern any difference between the visual and tactile stimuli.
The participants wore a fixture with an attached marker on the index finger of their dominant hand. After that, the experiment proceeded as follows.
  • Each trial started with an image with a size of “real texture + 32 px (0.939 mm)” or size of “real texture − 32 px”. For example, when the size of the real texture was 1.6 mm, the trial started with an image in which the stripes were 2.6 mm or 0.6 mm wide. In the case of real textures 2.6 mm or 3.0 mm in width, preliminary experiments confirmed that “real texture − 32 px” was likely to be near the threshold, so the starting point was set “real texture − 49 px” (1.54 mm). When the actual texture was 0.6 mm or 1.0 mm, the equal width of stripes was 19 px and 31 px, so the starting point was 2 px, which is the minimum stripe width that can be drawn. In addition, when the real texture was 0.2 mm width, it was difficult to make a decision even when compared with 2 px, so trials starting with stripes smaller than the real texture were omitted.
  • Participants touched the real texture (reference stimulus) while watching the image (comparison stimulus) reflected on the mirror surface. The time to experience the texture was not specified. Participants were asked to trace the texture in the front-rear direction (orthogonal to the texture stripes). After evaluating the stimulus, the participants were asked to report whether the spacing of the grating in the image was larger or smaller than that of the real texture they were touching.
  • The grating spacing of the image was gradually changed to approach the spatial period of the real texture. When the participant’s response changed with respect to the previous response (i.e., from “large” to “small” or from “small” to “large”), the spacing was changed in the direction away from the spatial period of the real texture. In the phase in which the direction of change was away from the spatial period of the real texture, when the participants’ response changed, the spacing was changed in the direction towards the spatial period of the real texture.
  • When decreasing the stripe spacing of the visual texture, if the response did not change even when the visual texture was 2 px, we forcibly increased the stripe spacing of the image. However, this event did not occur throughout this experiment.
  • The amount of change in the grating spacing in the image for each step was initially set to 12 px (0.376 mm). When the response changed in step 3, it was reduced to 6 px (0.188 mm), 3 px (0.0941 mm), 2 px (0.0626 mm), and 1 px (0.0313 mm). After the fourth switch, the amount of change was fixed at 1 px (0.0313 mm). Because the 1down-3up method was used, in the phase in which the direction of change was away from the spatial period of the real texture, the amount of change was three times the size of each step. The actual changes were 12 px, 18 px (6 px × 3), 3 px, 6 px (2 px × 3), 1 px, and 3 px (1 px × 3).
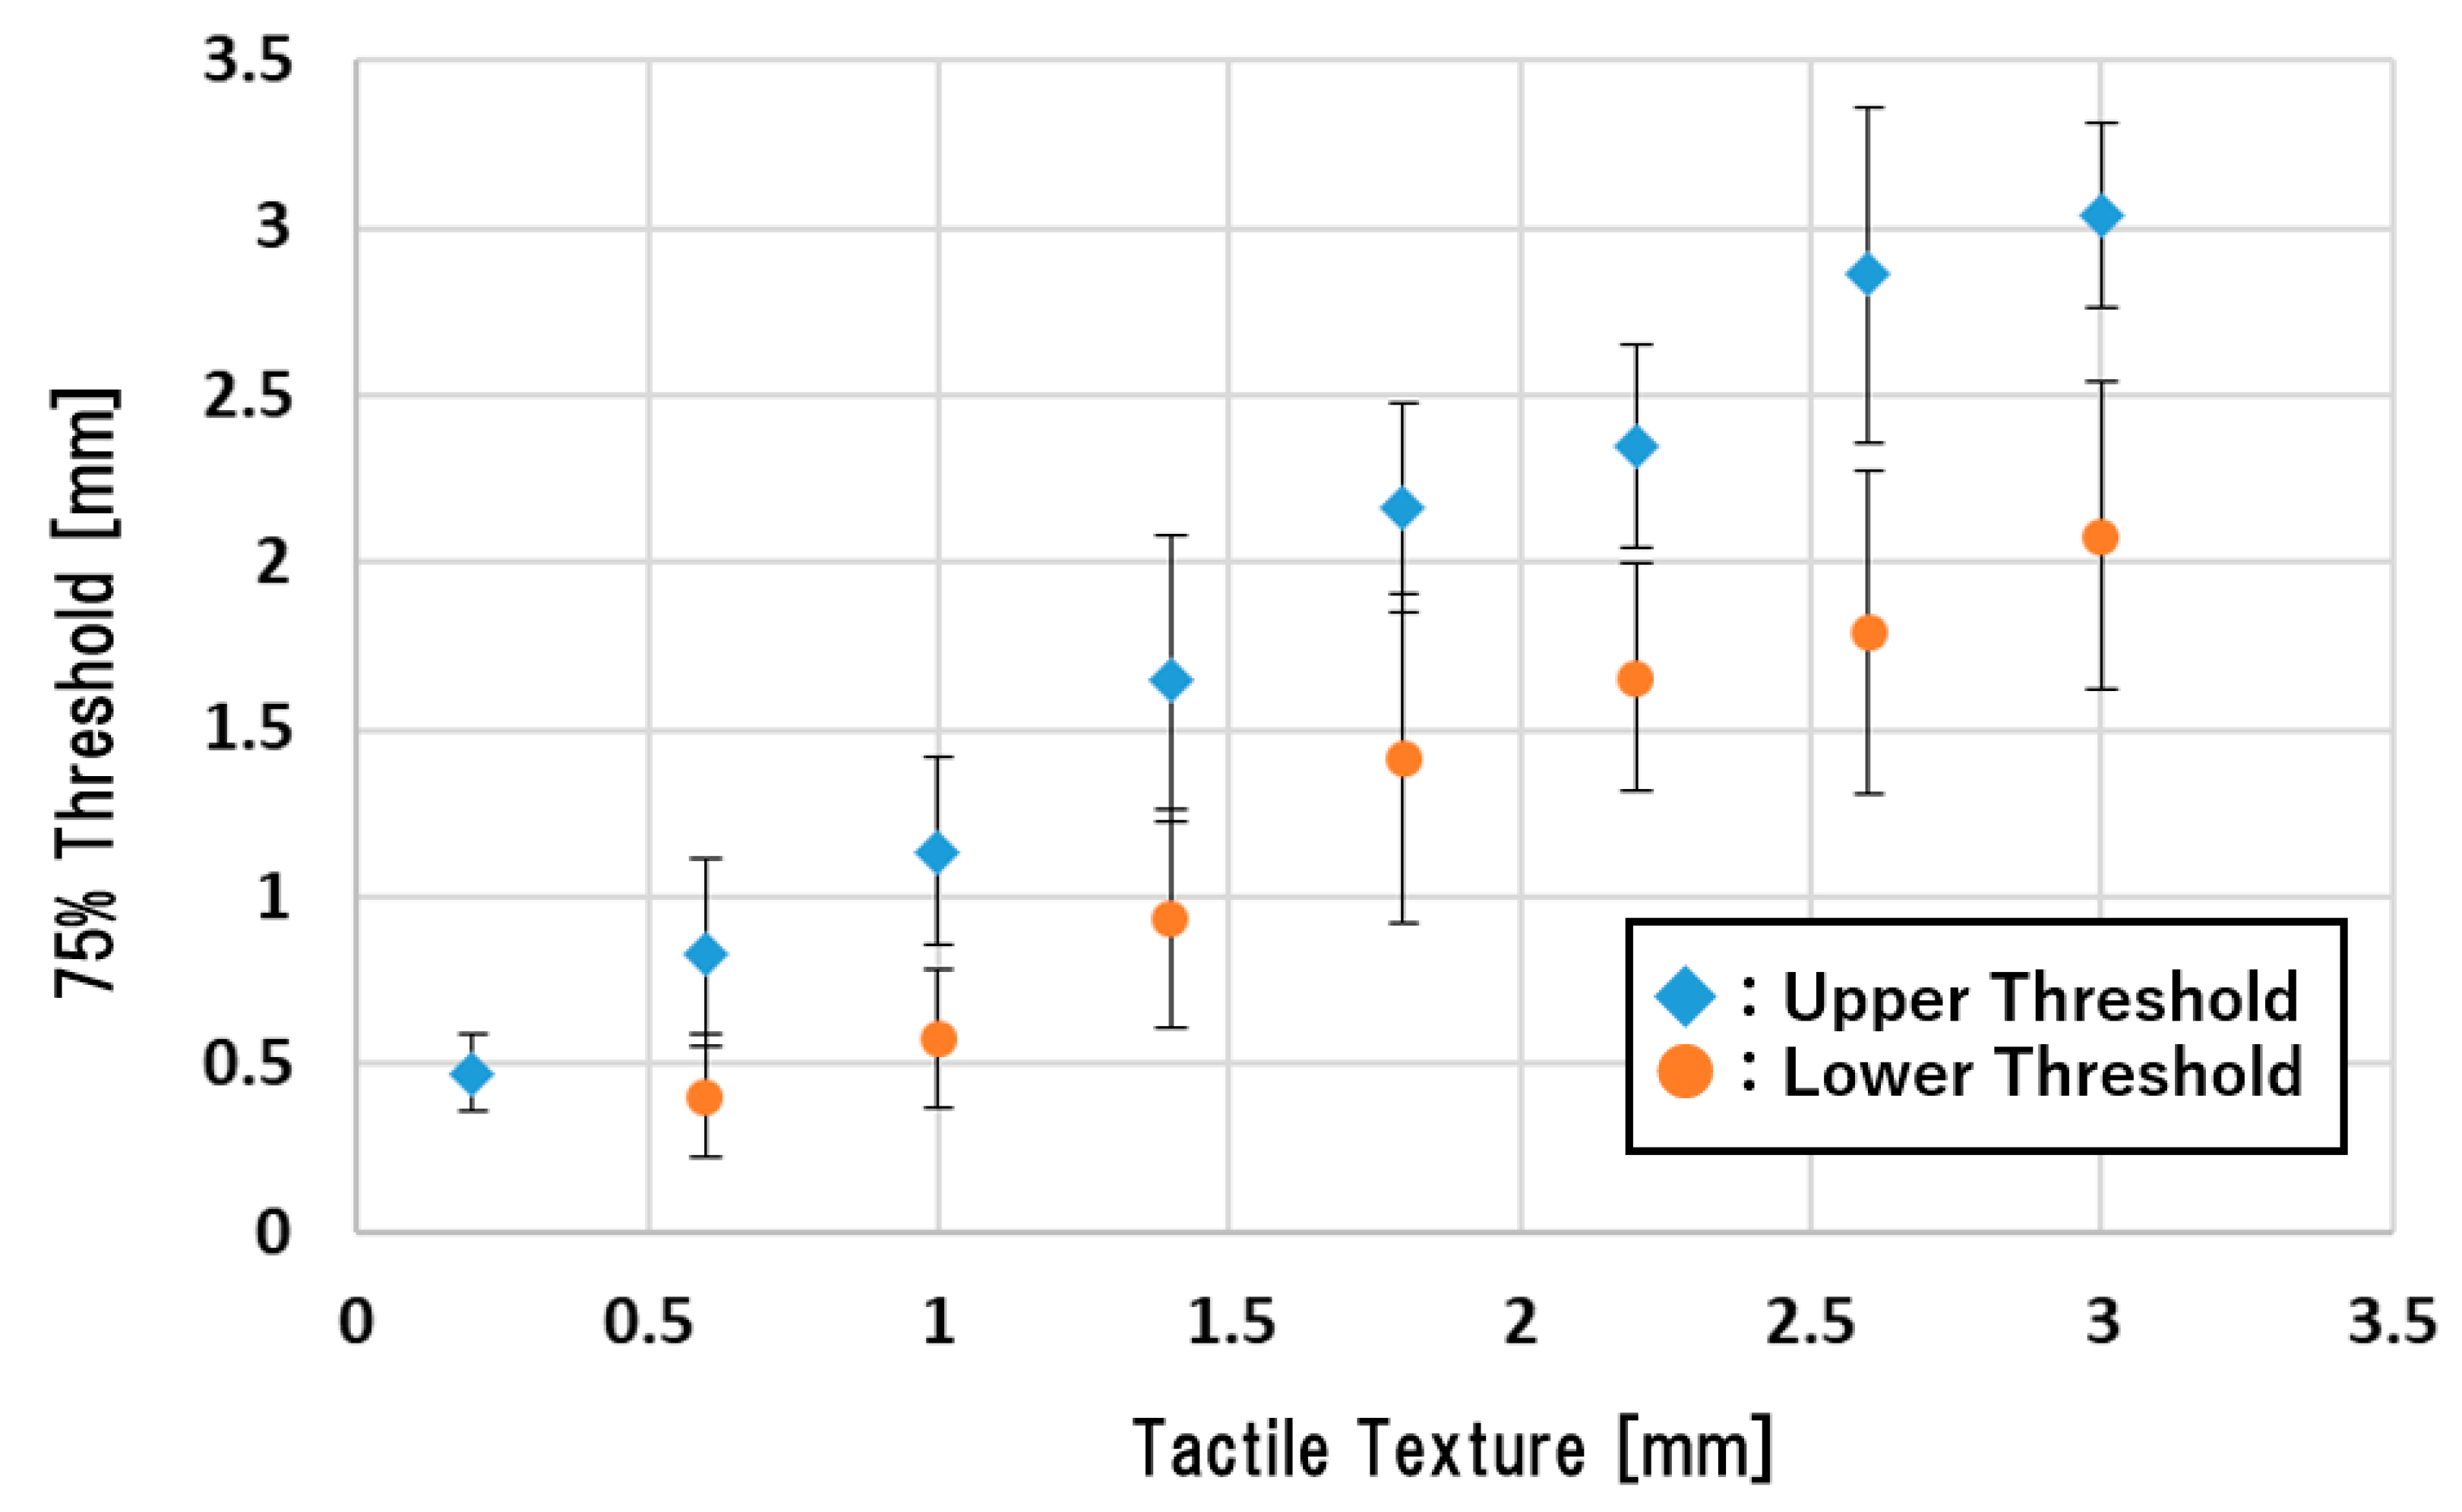
  • At the point at which a change in response had occurred six times since the start of one trial, we regarded this point as the 75% threshold, based on the previous literature [21].
The experiment proceeded, with steps 1 to 5 making up one trial. When one trial was completed, the experimental conditions were changed and the procedure was repeated.

2.3. Experimental Conditions

The experiment included a total of 15 conditions with eight tactile sensations (0.2 mm, 0.6 mm, 1.0 mm, 1.4 mm, 1.8 mm, 2.2 mm, 2.6 mm, and 3.0 mm) and two visual start points. As described in Section 2.2, when the reference stimulus was 0.2 mm, the experiment was performed only at the starting point of +34 px. Each participant performed one trial per condition for a total of 15 trials. The trial order was pseudo-randomized to reduce the effect of order. The participants were 11 laboratory members (ten men, one woman, 22–25 years old). Ten participants used glasses or contact lenses. All were right-handed. The experiments in this paper have been approved by the ethical review of the University of Electro-Communications (Date of approval: 30 November 2018, Management Number: 18040).

3. Results

We averaged the data for ten subjects to derive the mean threshold and standard deviation (Table 1). One participant’s data were excluded because they were not recorded because of an operational error. In Figure 6, the 75% threshold is plotted, where the horizontal axis represents the width of the ridge/groove of the real texture and the vertical axis represents the width of a stripe of the visual texture (threshold). The units of the threshold were converted from px to mm. An upper threshold in the figure indicates a threshold measured in a trial started from an initial value larger than the reference stimulus, and a lower threshold is a threshold measured in a trial performed with an initial value smaller than the reference. The allowable range determined in this study is the range between the upper threshold and the lower threshold.
The width of the permissible range measured in this experiment varies depending on the reference stimulus, and ranges from 0.430 mm (when the reference stimulus is 0.6 mm) to 1.068 mm (when the reference stimulus is 2.6 mm). The range between the upper threshold and the lower threshold tends to increase as the ridge/groove width of the real texture increases.

4. Discussion

4.1. Width of Permissible Range with Respect to the Amount of Stimulation

The permissible range of the difference in visual and tactile sensation increases as the width of the ridge/groove of the actual texture becomes wider. However, when we normalized the data by dividing “the width of the permissible range” (the difference between upper and lower thresholds) by “the ridge/groove width of the real texture”, the result is as shown in Figure 7 (this value is referred to as the “normalized threshold”). We observe that this normalized threshold tends to decrease monotonically as the ridge/groove width increases in the range 0.6–2.2 mm. In other words, the allowable discrepancy between tactile and visual texture is relatively large at small textures and decreases as the texture becomes coarse. We must note that if the result of this experiment follows Weber-Fechner’s law, the normalized threshold should be constant regardless of the amount of tactile stimulation. In addition, it also seems that from 2.2 mm, normalized threshold might become constant, which requires further investigation.
Tiest et al. [10] reported that tactile perception is better than visual perception for textures with a spatial period of less than 0.1 mm, and visual perception is better than tactile perception for textures with a spatial period of 1 mm. Therefore, our experimental setup covers the range over which visual sensation gradually becomes more dominant than tactile sensation, which may explain our finding that the normalized allowable discrepancy between tactile and visual perceptions gradually decreases. In future work, we will check whether the same tendency is observed at textures with intervals larger than 3.0 mm. We will also use textures other than one-dimensional textures.

4.2. Relationship between Finger Behavior and Threshold

In this experiment, we measured the behavior of the participants’ finger and the force with which each participant pressed his/her finger against the texture. We then examined the correlation between these values and the thresholds for each participant.
Table 2 shows the upper threshold value and finger behavior data for each participant when the real texture was 2.6 mm. “Experience time” is the average of all the experience times during one trial of each participant and is time from when the participant placed his/her finger on the texture to when he/she lifted it. The “average force” was obtained by averaging the force over one trial, and the average speed was obtained by calculating the speed every 0.2 s using the OptiTrack and time data and averaging the results.
No relationship with the threshold value was found in the experience time, average power, and average speed data. However, we observed some trends in the behavior of the fingers. First, most subjects moved their fingers at an average speed of 30 to 40 mm/s. This is the speed at which the surface of the texture in these experiments can be traced in about 1 s. Because this experiment did not ask the participants to trace at fixed speed, this value seems to be a general speed used when tracing a 40-mm texture.
In addition, all participants other than one of the authors applied only an average of 1 N or less when touching the texture. When this author tested the experiment, he felt that the ridge/groove information of the texture was easier to understand when touching it with at least 1 N or more of force. In this experiment, we did not ask the participants to set their pressured to a fixed value in order to have them touch the texture with as much natural force as possible. However, the effect of applying force is another important issue that we must focus on in future work.

5. Conclusions

We conducted an experiment to find a permissible range for the discrepancy between tactile and visual perception in the case of one-dimensional grating. As a result, it was confirmed that the permissible range tends to increase for textures larger than 0.6 mm according to the real texture ridge/groove width. However, the ratio between the permissible range and the real texture suggests that coarser texture has a relatively small permissible range.
Our future work will include tests with wider texture ranges and two-dimensional textures. We will further perform tests with natural textures so that we can adopt our findings in VR experiences.

Author Contributions

Conceptualization, S.Y. and H.K.; methodology, S.Y., S.K., and H.K.; software, S.Y.; validation, S.Y. and H.K.; formal analysis, S.Y., S.K., and H.K.; investigation, S.Y., S.K., and H.K.; resources, S.Y. and H.K.; data curation, S.Y.; writing—original draft preparation, S.Y.; writing—review and editing, S.K. and H.K.; visualization, S.Y.; supervision, H.K.; project administration, H.K.; funding acquisition, H.K. All authors have read and agreed to the published version of the manuscript.

Funding

This research was funded by JSPS KAKENHI, Grant Number JP15H05923.

Acknowledgments

We thank Kimberly Moravec, from Edanz Group (www.edanzediting.com/ac), for editing a draft of this manuscript.

Conflicts of Interest

The authors declare no conflict of interest.

References

  1. Kajimoto, K.; Kawakami, N.; Tachi, S.; Inami, M. SmartTouch: Electric skin to touch the untouchable. IEEE Comput. Graph. Appl. 2004, 24, 36–43. [Google Scholar] [CrossRef] [PubMed] [Green Version]
  2. Martínez, J.; García, A.; Oliver, M.; Molina, J.P.; González, P. Identifying 3D geometric shapes with a vibrotactile glove. IEEE Comput. Graph. Appl. 2016, 36, 42–51. [Google Scholar] [CrossRef] [PubMed]
  3. Massie, T.H.; Salisbury, J.K. The PHANTOM haptic interface: A device for probing virtual objects. Dyn. Syst. Contr. 1994, 1, 295–300. [Google Scholar]
  4. Buoguila, L.; Cai, Y.; Sato, M. New haptic device for human scale virtual environment scaleable—SPIDAR. In Proceedings of the ICAT’97, Tokyo, Japan, 3–5 December 1997; pp. 93–98. [Google Scholar]
  5. Tachi, S.; Maeda, T.; Hirata, R.; Hoshino, H. A construction method of virtual haptic space. In Proceedings of the ICAT/VRST 95, Chiba, Japan, 21–22 November 1995; pp. 131–138. [Google Scholar]
  6. Insko, B.E. Passive Haptics Significantly Enhances Virtual Environments. Ph.D. Thesis, University of North Carolina, Chapel Hill, NC, USA, 2001. [Google Scholar]
  7. Klatzky, R.L.; Lederman, S.J.; Reed, C.L. Haptic integration of object properties: Texture, hardness and planar contour. J. Exp. Psychol. Hum. Percept. Perform. 1989, 15, 45–57. [Google Scholar] [CrossRef] [PubMed]
  8. Ernst, M.O.; Banks, M.S. Humans integrate visual and haptic information in a statistically optimal fashion. Nature 2002, 415, 429–433. [Google Scholar] [CrossRef] [PubMed]
  9. Heller, M.A. Texture perception in sighted and blind observers. Percept. Psychophys. 1989, 45, 49–54. [Google Scholar] [CrossRef] [PubMed] [Green Version]
  10. Tiest, B.W.M.; Kappers, A.M.L. Haptic and visual perception of roughness. Acta Psychol. 2007, 124, 177–189. [Google Scholar] [CrossRef] [PubMed]
  11. Natsume, M.; Tanaka, Y.; Tiest, B.W.M.; Kappers, A.M.L. Skin vibration and contact force in active perception for roughness ratings. In Proceedings of the 26th IEEE International Symposium on Robot and Human Interactive Communication (RO-MAN), Lisbon, Portugal, 28 August–1 September 2017; pp. 1479–1484. [Google Scholar]
  12. Skedung, L.; Arvidsson, M.; Chung, J.Y.; Stafford, C.M.; Berglund, B.; Rutland, M.W. Feeling small: Exploring the tactile perception limits. Sci. Rep. 2013, 3, 1–6. [Google Scholar] [CrossRef] [PubMed] [Green Version]
  13. Kuroki, S.; Sawayama, M.; Nishida, S. Haptic texture perception on 3D-printed surfaces transcribed from visual natural textures. In Proceedings of the EuroHaptics 2018, Pisa, Italy, 13–16 June 2018; pp. 102–112. [Google Scholar]
  14. Cellini, C.; Kaim, L.; Drewing, K. Visual and haptic integration in the estimation of softness of deformable objects. i-Perception 2013, 4, 516–531. [Google Scholar] [CrossRef] [PubMed]
  15. Kwon, E.; Kim, G.J.; Lee, S. Effects of sizes and shapes of props in tangible augmented reality. In Proceedings of the IEEE International Symposium on Mixed and Augmented Reality, Orlando, FL, USA, 19–22 October 2009; pp. 201–202. [Google Scholar]
  16. Simeone, A.L.; Velloso, E.; Gellersen, H. Substitutional reality: Using the physical environment to design virtual reality experiences. In Proceedings of the 33rd Annual CHI Conference on Human Factors in Computing Systems, Seoul, Korea, 18–23 April 2015; pp. 3307–3316. [Google Scholar]
  17. Kitahara, I.; Nakahara, M.; Ohta, Y. Sensory properties in fusion of visual/haptic stimuli using mixed reality. Adv. Haptics 2010, 565–581. [Google Scholar]
  18. Yamaguchi, S.; Kaneko, S.; Kajimoto, H. Allowable range of consistency between the visual and tactile presentations of a linear grating texture. In Proceedings of the AsiaHaptics 2018, Songdo, Korea, 14–16 November 2018. [Google Scholar]
  19. Available online: https://processing.org/ (accessed on 27 January 2020).
  20. OptiTrack—Motion Capture System. Available online: https://www.optitrack.com/ (accessed on 27 January 2020).
  21. Kaernbach, C. Simple adaptive testing with the weighted up-down method. Percept. Psychophys. 1991, 49, 227–229. [Google Scholar] [CrossRef] [PubMed] [Green Version]
  22. Hachisu, T.; Kajimoto, H. Vibration feedback latency affects material perception during rod tapping interactions. IEEE Trans. Haptics 2017, 10, 288–295. [Google Scholar] [CrossRef] [PubMed]
Figure 1. (a) Drawing of the experimental setup; (b) a mirror image of the smartphone’s display; (c) display device and participant position.
Applsci 10 02494 g001
Figure 2. Texture pedestal (left). Three load cells were placed under the plate (right).
Applsci 10 02494 g002
Figure 3. Acrylic texture blocks used as stimuli.
Applsci 10 02494 g003
Figure 4. OptiTrack location and display device location.
Applsci 10 02494 g004
Figure 5. Fixture with marker wrapped and fixed around the finger with Velcro.
Applsci 10 02494 g005
Figure 6. Plot of the results in Table 1. The horizontal and vertical axes represent the tactile spatial period and the threshold, respectively. Error bars represent the standard deviation.
Applsci 10 02494 g006
Figure 7. Normalized threshold results for each tactile spatial period.
Applsci 10 02494 g007
Table 1. Results of the experiment. The permissible range is the difference between upper threshold and lower threshold.
Tactile Texture (mm)Visual Condition (px)75% Threshold (mm)Permissible Range (mm)S.D.
0.238 (1.19 mm)0.4730.114
0.62 (0.0626 mm)0.4040.4290.184
51 (1.60 mm)0.8340.278
1.02 (0.0626mm)0.5740.5610.206
63 (1.97 mm)1.1350.280
1.411 (0.344 mm)0.9370.7150.323
76 (2.38 mm)1.6520.430
1.825 (0.783 mm)1.4130.7520.492
89 (2.79 mm)2.1660.311
2.238 (1.19 mm)1.6550.6930.341
102 (3.19 mm)2.3470.302
2.633 (1.03 mm)1.7901.0690.482
114 (3.57 mm)2.8580.498
3.046 (1.44 mm)2.0780.9560.461
127 (3.98 mm)3.0340.277
Table 2. Finger behavior and threshold for each participant. Participant H was omitted because the data were not successfully recorded.
ParticipantThreshold (mm)Experience Time (s)Average Force (N)Average Speed (mm/s)
A (Experimenter)2.6956.3351.07631.33
B2.4764.8030.21736.82
C3.2284.5200.38140.38
D2.1313.6450.38435.07
E2.5703.3090.1887.338
F3.0711.7380.67034.93
G3.0404.7900.67641.77
I3.2591.7290.53734.69
J3.7611.1010.18656.81

