Article

Multi-Criteria Efficiency Analysis of Using Waste-Based Fuel Mixtures in the Power Industries of China, Japan, and Russia

Heat and Mass Transfer Simulation Laboratory, National Research Tomsk Polytechnic University, 30 Lenin Avenue, Tomsk 634050, Russia
*
Author to whom correspondence should be addressed.
Appl. Sci. 2020, 10(7), 2460; https://doi.org/10.3390/app10072460
Submission received: 13 March 2020 / Revised: 29 March 2020 / Accepted: 30 March 2020 / Published: 3 April 2020
(This article belongs to the Special Issue Environmental Friendly Technologies in Power Engineering)

Abstract

:
This paper presents the results of analyzing the efficiency of the following five fuel types: dry coal, wet coal processing waste, coal–water slurry, and two waste-derived slurries. In the calculations, we employed 16 criteria related to the energy industry, economy, social aspects, safety at plants, and environmental protection. We used the experimental data, obtained from the combustion of the fuels under study at three heating temperatures (700 °C, 800 °C, and 900 °C). Three countries were analyzed, where all of them have a high share of using fossil fuels in the energy industry: Japan, China, and Russia. The total performance indicator was calculated using three multiple-criteria decision analysis techniques (weighted sum method, weighted product method, and analytic hierarchy process). The choice of weight coefficients was confirmed for each method. We found that coal and coal–water slurry had the lowest integral efficiency indicators (0.016–0.535 and 0.045–0.566, respectively). The maximum effect was achieved when using waste-derived slurry with used turbine oil (0.190–0.800) and coal processing waste (0.535–0.907). There were, on average, 3%–60% differences in the integral efficiency indicator for the same fuel in different countries. The difference in the efficiency indicator of the same fuel in different countries was on average 3%–60%; with changes in temperature, the difference in efficiency was 5%–20%; and when changing the calculation procedure, the difference was 10%–90%.

Graphical Abstract

1. Introduction

The energy sector worldwide is very slowly restructuring towards biofuel and renewable energy development. This is connected with several factors that have been discussed in many studies (e.g., References [1,2,3]). At the same time, one of the most remarkable trends of recent years is the investigation of different ways of producing energy from waste and biomass [4,5]. This field is developing rapidly since current rates of production and consumption result in large amounts of products suitable for secondary energy generation [6,7]. For instance, Bhatia et al. [8] studied the methods of animal and plant bioresource management to produce energy, and Kuo et al. and Yan et al. focused on the combustion of municipal solid waste [9,10]. These methods are quite poorly implemented in practice on a global industrial scale. However, the high interest of the scientific community in them is an important prerequisite for waste and bioresources to become one of the basic alternative energy sources in many countries in the future.
Coal and oil processing waste are not well studied and, thus, are hardly utilized as resources (especially in exporting countries), though it can become a promising raw material for the production of an abundance of energy. Considering the annual increase in oil and coal consumption volumes [11], the amount of such waste is growing accordingly. Unfortunately, the level of modern technologies does not make it possible to minimize this waste (in terms of the areas occupied by storage sites). Moreover, there are already huge amounts of waste with coal and petroleum origins that have accumulated over the years and that need to be disposed of. Waste can not only be recycled, but it can be used directly as fuel. The direct combustion of coal and oil processing waste is tricky and unsafe. Therefore, it is more rational to prepare wet fuel mixtures based on this waste and derive several positive economic, energy, and environmental benefits [12].
Attempts have already been made to define the energy and environmental parameters of the combustion of waste-based fuel mixtures (e.g., Nyashina and colleagues [12,13]). Nyashina et al. compared the efficiency of such slurries with that of coal by using a certain generalized indicator. The parameters and priorities chosen in Nyashina and colleagues [12,13] are somewhat limited (e.g., in the environment and power sector). It makes sense to perform a more detailed evaluation of the efficiency of different waste-based fuel compositions vs. coal, which is the most widespread boiler fuel. Our study is aimed at achieving this objective. The list of parameters under consideration was extended (several parameters of energy, economic, environmental, and social performance were added); meanwhile, the priorities ranged according to the region where the fuel was potentially used. We considered China, Russia, and Japan as they belong to the largest economies of the world with a high share of fossil fuel use in the energy industry (70%, 66%, and 79%, respectively) [14].
When calculating the integral indicators of fuel efficiency, a combination of environmental, economic, and energy performance criteria need to be taken into account. This calls for a criteria analysis and validation of the choice of the method for calculating the efficiency coefficient of fuel compositions. In current practice, such analysis is commonly performed using multiple-criteria decision analysis (MCDA) methods [15]. The application area of these methods is very wide in the energy sphere. For instance, in Anwar et al. [16], MCDA methods were applied to evaluate six biodiesel feedstocks by using the data about their physical and chemical properties. These methods are also employed when selecting municipal waste recycling equipment [17] or, for example, when choosing a site to build photovoltaic power plants [18]. We also used such approaches in our research to calculate the generalized efficiency indicators of waste-derived fuel slurries and determine the most attractive fuel compositions for different regions of the world. Our research findings make it possible to estimate the prospects of fuels of different compositions when varying the priority of parameters in the energy, economic, environmental, and social categories over wide ranges.

2. MCDA Methods

There is quite a large group of methods that can be used to find an optimal solution by considering several criteria [15,19]. When analyzing modern approaches to multi-criteria analysis, we chose several widely used MCDA methods, taking into account the specific character of the energy sector. These include the weighted sum method (WSM), weighted product method (WPM), and analytic hierarchy process (AHP). They are suitable for the energy sector, their calculations are quite simple, and they work well with the amount of data that was used as initial information in the problem posed in this study.

2.1. Weighted Sum Method

This method determines the weight coefficient for each factor, which affects the final result [20]. The considered criteria can have different units of measurement. Therefore, each criterion is normalized by dividing it by a certain benchmark value. The objective value of the parameter or known value that is suitable for comparison can serve as a benchmark. After normalization, the parameters become dimensionless and have a domain from 0 to 1.
One specific feature of WSM is that the sum of the weight coefficients should equal 1. The weight coefficients are distributed between single constituents based on the problem statement and the end user’s requirements. After defining the weight coefficients, each option under study is characterized by An (weighted sum of criteria), which is calculated using the equation:
An = ∑wj∙xij.
An option is considered to be preferable if the weighted sum of the criteria is the greatest of all the other alternatives under study.

2.2. Weighted Product Method

This method is similar to the WSM. In the WPM, like in the WSM, it is necessary to set the weight coefficients for each criterion and determine their normalized values. The selection of weights is carried out in the same way as in the WSM. The difference is in the way the integral indicator An is calculated. In WPM, the normalized values are raised to a power equivalent to the corresponding weight coefficient and then multiplied:
An = ∏xij wj.
The option with the greatest An is the most preferable, just like in the WSM.

2.3. Analytic Hierarchy Process

This method is one of the most common MCDA techniques [21]. Unlike the WSM and the WPM, this method evaluates the alternatives and weight criteria differently.
The AHP is based on a hierarchic structure. The zero level of the hierarchy is a goal (in our study, we took the fuel cost as the zero level). The first level is represented by categories of criteria (in our case, these were environmental, energy performance, social, economic, and safety). The second level is composed of the criteria themselves (ignition delay times, NOx and SOx concentrations in combustion products, etc.) [22].
The first step of the calculations is to normalize the criteria in each category in such a way that the values obtained add up to 1. Then weight coefficients are determined by comparing the criteria in pairs. Table 1 illustrates examples of pair-wise comparisons. If, for example, criterion b is twice as important as criterion d, this statement is written as a fraction 2/1.
After that, common fractions are converted into decimal ones. Then, the sum of the values in each line and the total sum are calculated. At the next stage, the sums in lines are normalized such that they add up to 1. For that, the sum of the weight coefficients for each line should be divided by the total sum (Table 2).
Equation (3) is used to determine the weighted sum of criteria An by considering the values of the zeroth level of the hierarchy (normalized cost C), weight coefficients obtained for each category of criteria (first level of the hierarchy), and each criterion (second level of the hierarchy):
An = Cwn∑(wjxij).
The best option is the one for which the integral indicator An is the greatest.
The AHP can be employed using specialized software (such as Expert Choice [23]), or Microsoft Office. Specialized software is recommended when there are a lot of levels in the hierarchy. The main advantage of the AHP is that weight coefficients are not set directly, but are obtained using a pairwise comparison of criteria. Undoubtedly, all the MCDA methods are somewhat subjective. This cannot be regarded as a disadvantage, though, since the calculations are made in accordance with the existing interests and priorities. This aspect should be taken into account when analyzing the findings.

3. Evaluation Criteria

Several criteria for evaluation were selected to determine the fuel mixture efficiency using MCDA methods. The criteria were divided into five groups (Figure 1): (i) economic, (ii) environmental, (iii) energy efficiency, (iv) social, and (v) production process safety. The criteria we selected are presented in Figure 1.
The economic criteria reflect the expenses associated with using fuel, as well as a characterization of the fuel availability. They involve:
  • Fuel cost: A comparative cost of 1 kg of fuel. The cost of composite fuel is calculated as the total cost of its components, considering their fractions in the fuel mixture.
  • Fuel transportation costs (CTR) reflect the cost of transporting the fuel to an energy provider.
  • Fuel availability (A) characterizes the opportunity of using fuel or its separate components in the region under study.
The environmental criteria were related to the environmental safety of using the fuel. Sulfur and nitrogen oxide concentrations in flue gases were chosen as environmental criteria. Undoubtedly, the combustion products of fossil fuels contain a lot of harmful substances, such as polycyclic aromatic hydrocarbon, particulate matter (PM), hydrogen chloride, metals, polychlorinated dibenzodioxins, sulfur oxides, nitrogen oxides, etc. Still, many studies (e.g., References [24,25]) choose sulfur and nitrogen oxide emissions as the target parameters since they are the main pollutants in the combustion products of fossil fuels, they cause adverse air and climate change, and negatively affect human health [26].
According to known research findings [27,28], the concentrations of SOx, NOx, and PM are some of the main indicators of the environmental safety of boiler furnaces. Unfortunately, there are currently no conditions for a reliable measurement of PM; this is because it requires a flow of flue gases with a certain consumption and large volumes of the fuel for combustion. Therefore, we only considered the concentrations of SOx and NOx. These parameters were determined experimentally for several fuels at different temperatures. The basis of the experiments was the burning of fuel samples in a model combustion chamber (rotary muffle furnace R 50/250/13 by Nabertherm GmbH, Lilienthal/Bremen, Germany), while simultaneously analyzing the composition of flue gases using a gas analyzer (Testo-340 by Testo SE & Co. KGaA, Titisee-Neustadt, Germany). Using a hole in the combustion chamber, the gas analyzer probe was located in the fuel combustion zone and the flue gas was supplied to the sensors. The supply of flue gases and their analysis was carried out until the fuel was completely combusted. The methods and tools of measurement are described in detail in Nyashina et al. [12].
The category of energy performance criteria contained parameters that characterized the fuel combustion and determined the indicators of the boiler plant operation:
  • Ignition delay time of the gas-phase ignition (τd1): duration of thermal impact, which is required for the gas-phase ignition of the fuel.
  • Ignition delay time of the heterogeneous ignition (τd2): duration of thermal impact, which is required for the heterogeneous ignition of the fuel.
  • Complete combustion duration (τb): interval from the fuel ignition until its complete burnout.
  • Specific heat of combustion (Qas): amount of heat, released from the combustion of 1 kg of the fuel.
  • Minimum ignition temperature (Tgmin): the minimum heating temperature that ensures the gas-phase and heterogeneous ignition of the fuel. It enabled us to predict the heating temperature of the boiler for the stable ignition of the fuel supplied.
  • Ash content (Ad): the content of mineral non-combustible additives in the fuel. This parameter estimated the amount of ash that was left after the combustion of the organic part of the fuel.
Just like the emission characteristics, the ignition and combustion parameters were determined experimentally when the fuel was fired in a model combustion chamber. A detailed description of the setup, procedure, and measurement tools is given in Nyashina et al. [12].
The social criteria were the ones affecting the region’s welfare. For this study, these included:
  • Conservation of land resources (SE): the potential opportunity for reducing the areas allocated for waste storage.
  • Conservation of energy resources (SR): the potential opportunity for reducing the consumption of non-renewable energy resources, such as coal and oil.
The category of safety criteria estimated the potential of the fuel in terms of ensuring a no-failure operation of a station or boiler unit. This group consisted of the following:
  • Fire safety (P): characterizes the ability of the fuel to ignite, which under uncontrolled conditions, can be triggered by solar radiation, unintentional contact with heated surfaces during transportation and storage, etc. P takes into account the time that is necessary for the first flash to appear, the minimum ignition temperature, and maximum temperature in the fuel combustion zone. P was calculated using normalized values:
    P = T g min ¯ · T d max ¯ · τ d 1 ¯ .
  • Dusting (D): the ability of fuel to shed particles. This phenomenon is typical of granular and fine materials; this poses a danger as it can cause explosions at production sites [29] and adversely affect the environment and people’s physical state.
  • Storage and transportation convenience (Bkt): fitness of the fuel for safe long-term storage and the presence or absence of special conditions for these processes.

4. Calculating the Fuel Efficiency Indicator Using the WSM and the WPM

In our study, we determined the weight coefficients of the criteria in the WSM and the WPM for each particular country (China, Japan, and Russia). This was because the criteria may have different priorities in these countries. Furthermore, this approach is of scholarly interest regarding obtaining results in a wider range of source data variation. It was assumed that the weight coefficients for energy performance and the safety criteria were equal for all the countries since these parameters are linked to the energy production process, which is similar for all the regions, irrespective of their development course. Below are some brief notes about the choice of weight coefficients for the parameters from different categories for different countries.
The weight coefficients for the parameters under study regarding the priorities of Russia, Japan, and China are presented in Table 3. China’s biggest problem is the severe pollution of air with coal combustion products [30]. Therefore, environmental indicators were given considerable significance. The choice of weight coefficients for Russia was based on the aspects of the current economic situation and development strategy. Despite the growing concern for environmental problems, the present cost structure in Russia does not allow for big investments in the protection of the environment [31]. However, one of the main trends is to optimize expenditure and strengthen the economy. Following this course of development, we gave the main priority to economic indicators (apart from energy performance). Japan lacks its own resources and depends largely on foreign fuel to provide the energy industry (it is mainly imported from China and Russia) [32]. Therefore, the transportation costs, availability of components, and conservation of energy resources were major priorities when making the calculations. Priority was also given to the criterion “conservation of land resources” because of the limited areas and population density. Due to large areas and availability of fossil fuels in China and Russia, the weight coefficients for SR and SE were lower than those for Japan.
In our research, we compared different fuel slurry compositions and coal dust using the above criteria. The compositions of the fuels under study are presented in Table 4 (mass fractions are indicated). We distinguished between coal–water slurries and coals (compositions 2 and 5), as well as waste-derived slurries (compositions 1, 3, and 4). We chose coal processing waste (filter cake and coal sludge) as the main combustible components for these slurries. In its initial state, this waste is a homogeneous mass consisting of water, solid coal, and mineral particles with a typical size of 100–150 μm. The filter cake in the initial wet state (moisture content of about 43.5%) corresponds to composition 1 from Table 4. The filter cake and coal sludge were dried to produce compositions 3 and 4. Used turbine oil and peat were used as additional combustible components (Table 4, compositions 3 and 4). We used flame coal (for fuels 2 and 5; Table 4) with an average particle size of about 100 μm.
Table 5 shows the results of the proximate and ultimate analysis of the solid fuel components. The properties of the combustible liquid are presented in Table 6.
A detailed analysis of the properties of components and characteristics of the fuel ignition and combustion was not the main task of this research; therefore, the properties of the components were not studied separately. In the MCDA calculations, we took the values that were obtained experimentally using the techniques from Nyashina and colleagues [12,13]. Since many of the fuel ignition and combustion parameters depended on the temperature in the combustion chamber, it was reasonable to compare them at different temperatures (we chose the range from 700 to 900 °C). The choice of the temperature range was due to both the capabilities of the experimental equipment used in the experiments (heating not higher than 1000 °C) and the promise for practical applications. In particular, the combustion of heterogeneous components in the composition of fuel suspensions can be implemented in the specified temperature range using fluidized bed technologies [33]. Fluidized-bed combustors can be adapted to a wide range of components, including high ash components. Furthermore, relatively low temperatures (700–900 °C) create conditions for reducing the emission of harmful oxides [34]. A set of established parameters (absolute values) from the energy and environmental categories, as well as the fuel cost, are presented in Table 7 and Table 8.
Table 9 and Table 10 show a set of normalized criteria for five fuel types at three heating temperatures for different countries. C, SOx, NOx, τd1, τd2, Tgmin and Ad were normalized relative to the smallest typical value of the five fuels at a certain temperature (in case this parameter was dependent on temperature). Qas was normalized relative to the greatest value. The data in Table 9 were obtained using Table 7 and some additional calculations and estimates. Below are comments and necessary explanations of some particular criteria.
Equation (4) was used to estimate the fire and explosion safety (P). The factors in the equation (4) were normalized differentially. Tdmax was normalized relative to the smallest possible Tdmax for all the fuels under study. The maximum combustion temperatures of fuels were determined experimentally and are presented in Table 11. Since the Tdmax values varied only slightly in the temperature range from 700 °C to 900 °C, we took the average values for 700 °C in our calculations. At the same time, τd1 and Tgmin were normalized relative to the greatest values of the corresponding parameters at a particular temperature. The method used for obtaining normalized values when calculating P was based on the fact that one fuel could be considered safer than another (in terms of the risk of unspecified ignition) if it had a higher ignition temperature and ignition delay times, as well as lower combustion temperatures.
Among the criteria under study (Figure 1), some factors were difficult to estimate quantitatively. These parameters included fuel availability (A), transportation costs (CTR), conservation of land resources (SE), conservation of fossil fuel resources (SR), dusting (D), and convenience of storage and transportation (Bkt). In such cases, a normalized value was set individually in the domain from 0 to 1. For slurry fuels, the normalized indicator CTR, just like D, was taken as 1 since slurries are not characterized by dusting and different types of transportation are available, including pipelines. For coal, possible transportation types exclude pipelines, thus the dimensionless CTR was taken to be 0.5. The normalized indicator D for coal was taken to be 0.3, since ground coal tends to form dust masses during storage, loading, and conveyor transportation.
Table 10 presents the normalized values of criteria for different countries. The cost was normalized using absolute values (Table 8). A dimensionless parameter of availability (A) was assigned for each fuel based on the results of analyzing the availability in each of the countries. Thus, in China and Russia, all the components of compositions 1–4 and coal itself were produced or formed within their own territory; therefore, A was assigned the value 1 (except for composition 4 for China since there are no large sources of peat there). The fuel components under study are imported into Japan; thus, the normalized value A was assigned the value 0.5.
The conservation of fossil fuel resources criterion (SR) was normalized by taking into account the nature of the components (Table 9). Thus, for example, SR for filter cake, which is waste, and for composite waste-derived fuels was equal to 1 since no valuable fuels like coal, oil, or gas are consumed when using them. SR for coal dust and slurries based on this was taken to be 0.01. When assigning values in the criterion of the conservation of land resources (SE), we used a similar rationale, by considering the connection between using waste and freeing land resources to store it. In terms of storage and transportation convenience (Bkt), all the fuels under study had specific advantages and disadvantages. For instance, coal dust often requires special storage conditions in silos. Ready-to-use slurries can be stored in land and underground reservoirs, whereas the initial components need to be stored in silos in containers or tanks, depending on the type of component. Slurries based on coal dust tend to laminate quickly, which requires stirring and using a stabilizer. The lamination rate of mixtures, based on waste with oils, is much lower; therefore, no frequent or continuous stirring is necessary. Consequently, coal and waste-derived slurries were assigned a normalized value of 0.8 for the criterion under consideration, whereas coal-water fuel was assigned a value of 0.5 (Table 9).
Thus, using the data from Table 9, Table 10 and Table 11, we determined the integral efficiency indicators of five fuels for three countries using the WSM and the WPM. The calculation results are presented in Table 12 and Table 13.

5. Calculating the Fuel Efficiency Indicator Using the AHP

The weight coefficients in the AHP are determined using pairwise comparisons (see Section 2.3). For this, the criteria within each group and then between the groups were compared. The fuel costs were not compared since the cost was in the zeroth level in the hierarchy. The comparison results are presented in Table 14, Table 15, Table 16, Table 17 and Table 18. The sum of the common fractions is presented as a decimal fraction.
During the next stage, the groups of criteria were compared pairwise for the three countries under study. The results are presented in Table 19, Table 20 and Table 21.
Using the procedure described in Section 2.3, we determined the weight coefficients of the groups of criteria for each country (Table 22).
To calculate the fuel efficiency indicator (An) using the AHP, we used Equation (3). The calculation results are presented in Table 23.

6. Discussion of Results

There are currently a lot of limitations to the creation and development of the technologies of industrial waste recovery as slurries of complex compositions. One of these limitations is a lack of knowledge about the characteristics and threshold conditions of fuel slurry combustion, as well as the absence of a complex evaluation and comparison with more widespread (traditional) fuel types. In this section, we aim to analyze the generalized efficiency indicators for bituminous coal, coal–water slurry, and three waste-derived slurries, using MCDA.
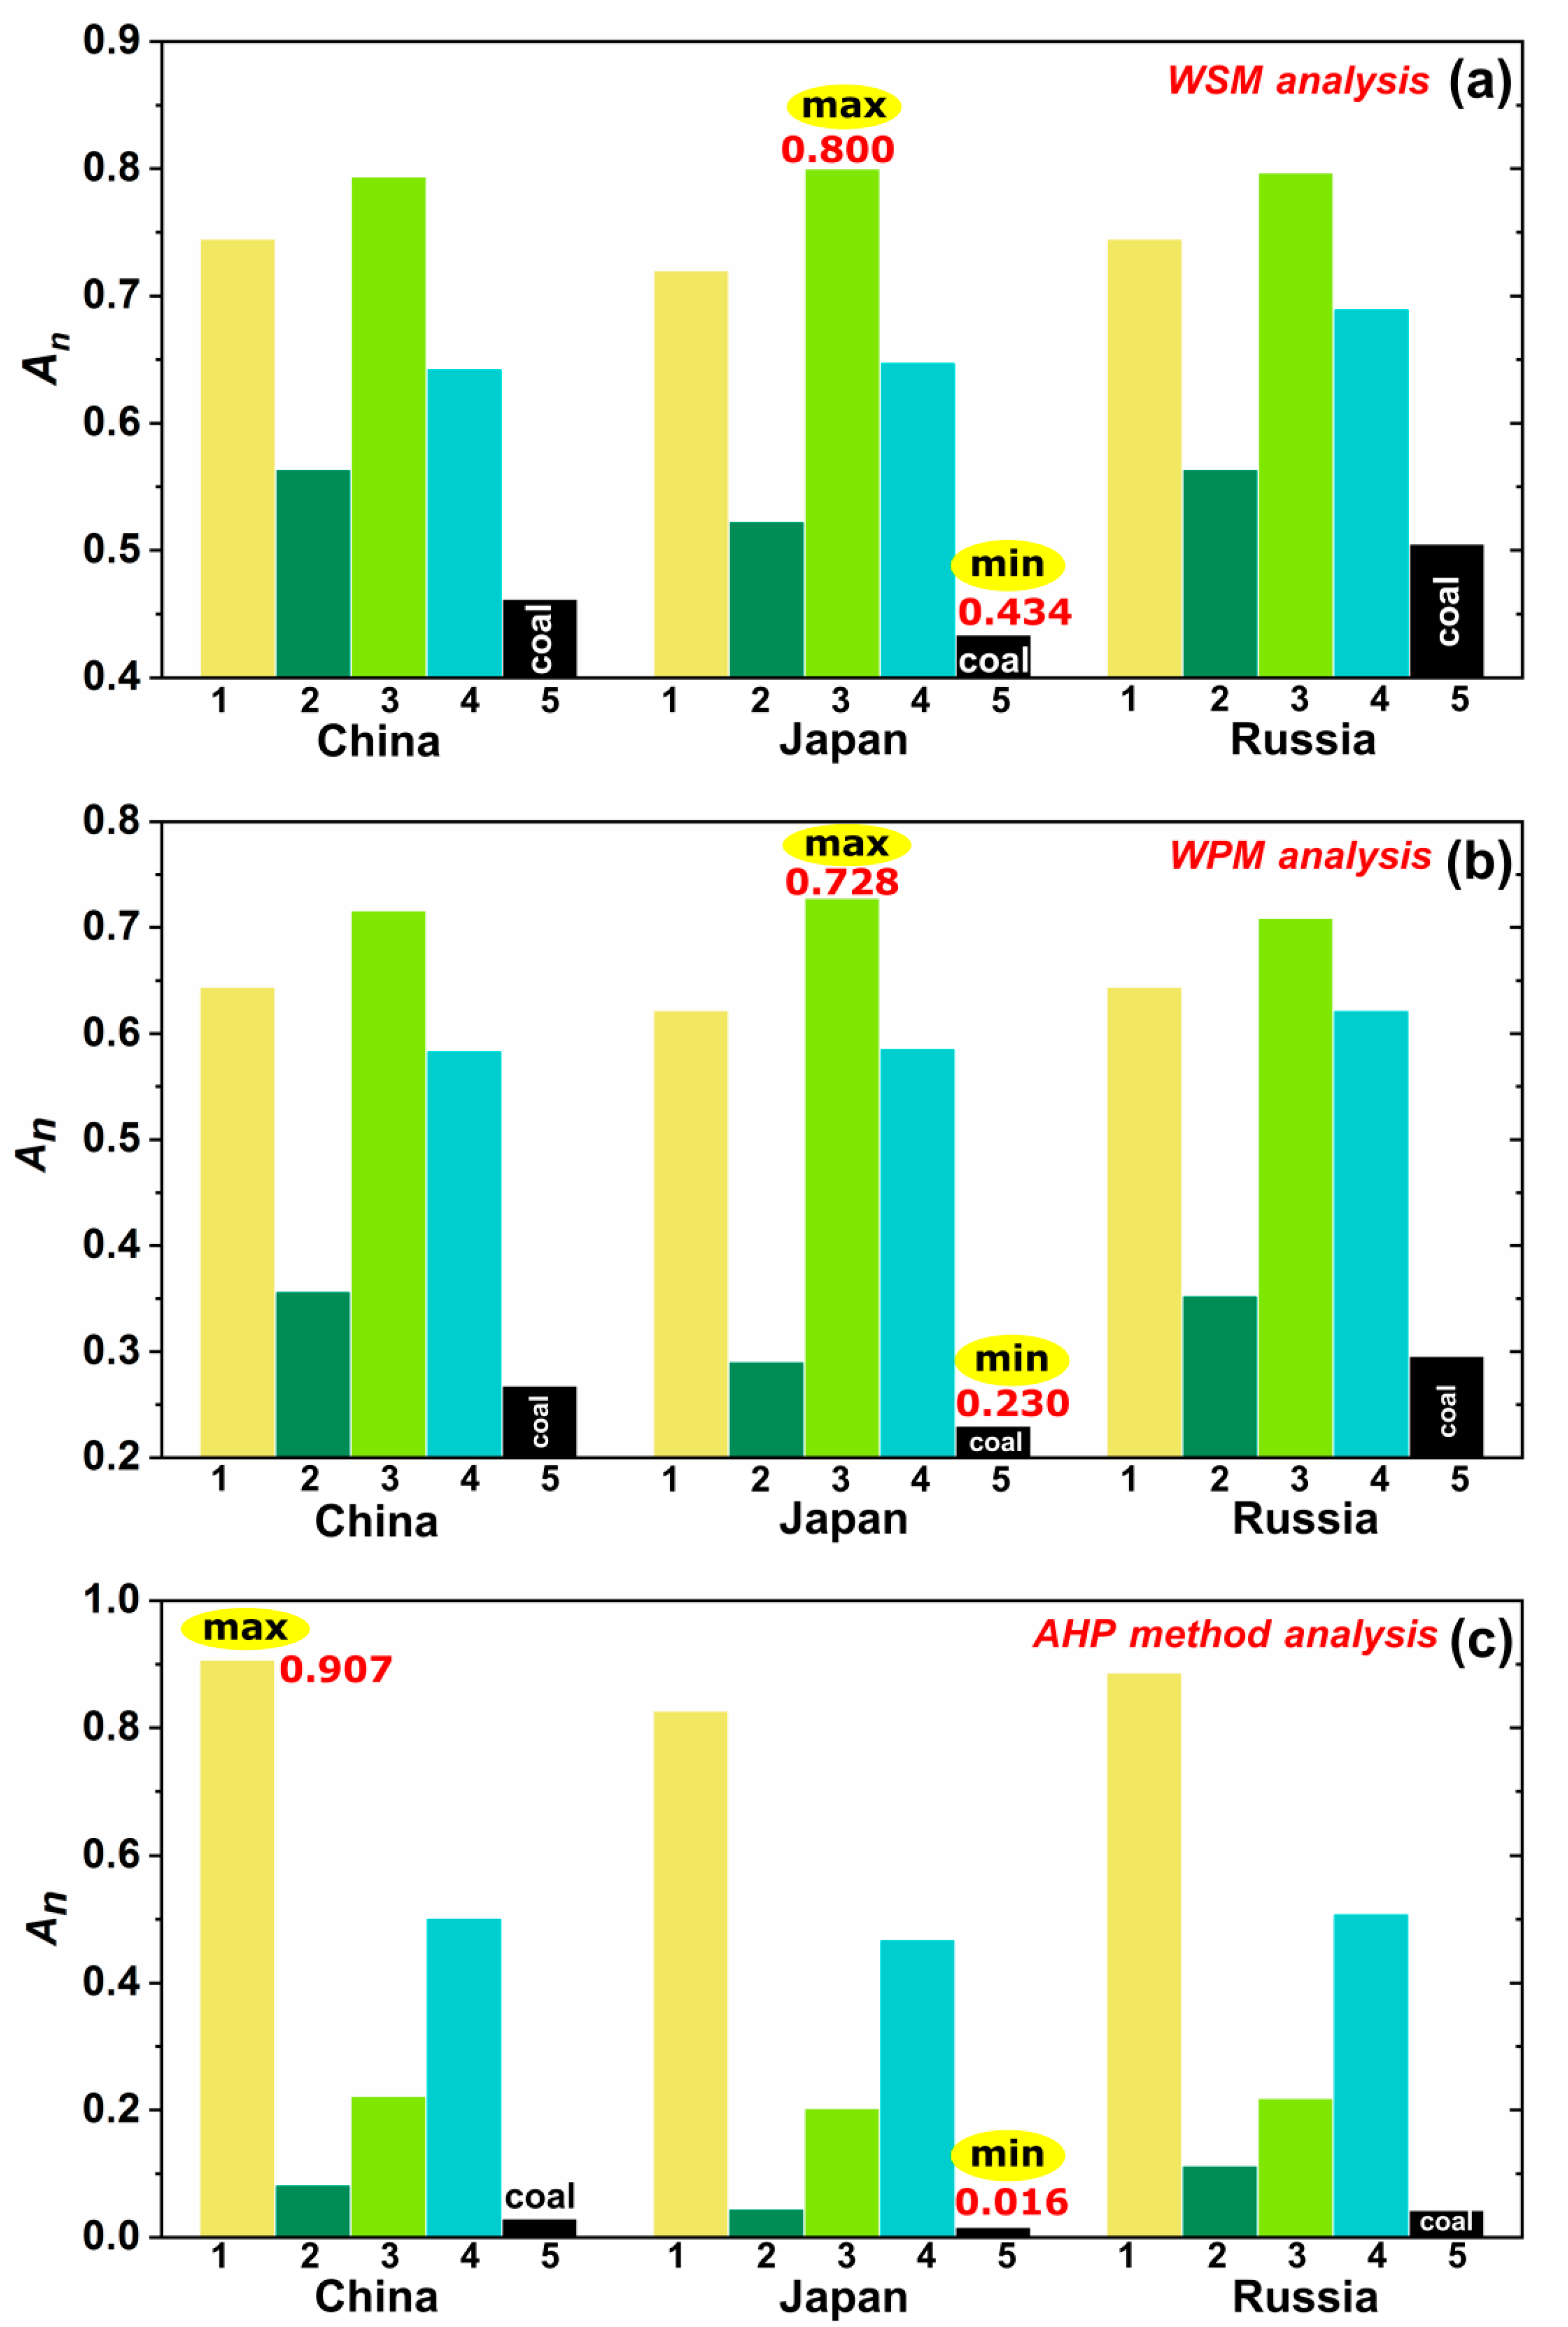
Figure 2 illustrates the values of the integral efficiency indicator for the five fuels under study and the three calculation techniques. Figure 2 also shows the range that the fuel efficiency indicator can vary within, depending on the country that was analyzed. We can see that coal featured as the lowest indicator, and the slurries outrated it to a greater or lesser degree. This conclusion was true for all the countries and calculation methods. Coal differed from the other fuels in the following ranges: 10%–45% using the WSM (Figure 2a), 16%–70% using the WPM (Figure 2b), and 65%–95% using the AHP (Figure 2c). Despite the high priority of the energy parameter category in the WSM and the WPM (the weight of this category exceeded the weights of the other groups of parameters for all three countries), the good energy performance indicators of coal (Table 3) did not allow it to score highly overall. There were several reasons for the big discrepancy in the values of these criteria for coal and slurries. First, coal combustion products contain a higher amount of sulfur and nitrogen oxides than slurries (Table 7). The benefits of slurries in SOx and NOx emissions are explained not only by a lower temperature in the combustion zone, but also by the possibility of some chemical reactions involving water vapors, which prevent (or rather, reduce the rate of) the oxidation of nitrogen and sulfur [37,38,39,40]. Second, coal is fire-hazardous and is characterized by dusting. The third reason is large-scale and long-term: using coal only cuts down its emergency stocks and increases inherent processing waste. The fourth reason is that coal is more valuable, and thus, more expensive than the waste components of slurries. The last two reasons, as well as additional storage difficulties (due to high lamination rate), were responsible for the rather low efficiency indicator of coal–water fuel (Figure 2).
To illustrate the contribution of each indicator to the integral An, in Figure 3, we present a diagram of the relative criteria when using the WSM and the WPM. Here, Russia is used as an example. The typical ignition and combustion indicators were taken from the experiments at a heating temperature of about 700 °C. The results are shown for coal and slurries with the highest and lowest efficiency. It is clear from Figure 3 that there was a significant difference in almost each particular criterion, which was especially distinct for coal and waste-derived slurries.
According to the AHP calculations, coal and coal–water slurry have the lowest integral efficiency indicators (lower than in the WSM and the WPM). Moreover, the category of energy parameters obtained a low weight coefficient (Table 23) in the pairwise comparison of the AHP. This category characterized the overall advantages of coal and coal–water slurry (Table 5). Moreover, we put the fuel cost, which was the definitive factor for the final An, at the zeroth (most important) level of the hierarchy. Therefore, we can see the greatest deviation of An for bituminous coal and coal–water slurry from that of cheaper fuels (Figure 2c). In particular, there was a 32-fold difference between filter cake and coal for China in the calculations using the AHP (Figure 2c). Undoubtedly, this approach can bring a low-cost fuel with poor environmental characteristics and a high fire hazard to the top of the ranking. This point needs to be taken into account at the stage involving the pairwise comparison of criteria. Despite this, the potential of AHP is that we can place a parameter of interest at the zeroth level of the hierarchy and obtain an indicator that shows the fuel efficiency with a focus on the set priority.
It is clear from Figure 3 that An was not the same for all countries. In this case, the dominant reasons were the ones associated with the availability and cost of the fuel or its components in different regions, as well as the difference in the priorities given to certain categories of parameters linked to the specific aspects of the current state of the environment and the economy in the countries under study (Section 4). Notably, in each of the MCDA methods, fuels retained their overall ranking, irrespective of the country, i.e., variations in the role of single factors (cost, availability) and weight coefficients of a group of parameters for different countries did not significantly change An. Depending on the country, An for the same fuel could vary in the following ranges: 3%–15% using the WSM, 3%–25% using the WPM, and 10%–60% using the AHP. The WSM and WPM calculations have a common concept. Therefore, the relative rating we composed for the fuels was identical, despite quantitative differences (Figure 2a,b). The slurry consisting of 40% filter cake (dry), 50% water, and 10% waste turbine oil had the highest coefficient. The rating of the fuels was rearranged when AHP was used. In this case, the leading role belonged to coal processing waste without additives and slurry with peat (Figure 2c, compositions 1 and 4). These fuels have environmental and social significance, as well as the benefit of low cost, which played a crucial role in the calculation of the integral efficiency indicator using AHP.
The influence of heating temperature on the integral efficiency indicator is shown in Figure 4. The curves presented are for waste-derived slurry with peat (calculated for Japan). The analysis of Figure 4 and the results in Table 12, Table 13, and Table 23 indicates that there was no obvious increase or decrease in the fuel efficiency indicator when varying the temperature. This conclusion was also true for the position of the extremum of An at various temperatures with different fuels and calculation techniques. The obtained result was explained by the fact that the parameters that depend on temperature (e.g., SOx and NOx emissions, ignition delay time) were normalized separately at each temperature value. Thus, even if the absolute values of a parameter did change with an increase of temperature, there was no guarantee that a normalized parameter would retain the same pattern of changes (Table 7 and Table 9). Consequently, it was reasonable to perform a detailed analysis of the fuel efficiency that involved taking into account the absolute values of the constituents whose values depend on temperature. The relative change of An with a temperature increase (700–900 °C) had the following maximum values for different estimation methods: 15% for filter cake, ≈7% for coal–water slurry and waste-derived slurry with turbine oil, 10% for waste-derived slurry with peat, and 20% for coal.
Figure 5 shows a change in the efficiency indicator that was dependant on a set of conditions and factors (fuel composition, heating temperature, method of calculation), as illustrated by China. The An values corresponded to the range of 0.03–0.907. The maximum efficiency of most fuels was achieved when the combustion chamber temperature was about 800 °C. The highest An belonged to coal processing waste (fuel 1) and waste-derived slurry with turbine oil (fuel 3) when calculated using AHP. When making the transition from the WSM and the WPM to the AHP, the integral efficiency indicator changed substantially (the difference reached 90% with some types of fuels; see Figure 5a). Coal had the lowest efficiency indicator of all the fuels under study. Coal–water slurry (fuel 2) was closest to coal in terms of the integral efficiency indicator. Thus, we can conclude that the country under consideration could be interested in using the combustion technologies of coal processing waste (filter cake in a wet state) and slurries with a combustible liquid to achieve the maximum effect in the environment, energy performance, economy, social life, and enterprise safety.
By generalizing the research findings, we can conclude that it makes sense to use MCDA methods to evaluate and compare several fuel alternatives. Without them, it seems impossible to identify the best options when the number of contributing factors increases. The final MCDA result does not give the full picture to understand the specific advantages and disadvantages of fuel alternatives. It is necessary to apply the comparison matrices of absolute and normalized parameter values. Nevertheless, multi-criteria analysis methods can be exploited as a tool for the planning, designing, and use of combustible waste disposal technologies to produce thermal and electrical energy. Thus, for example, it was found that the waste-derived slurries under study had the lowest efficiency indicators in Japan. However, on the whole, such fuels have great potential in different spheres, since their generalized efficiency indicator exceeds that of coal 20–50 times.
In earlier works (for example, Vershinina and colleagues [35,36]) that dealt with atypical fuel mixtures from wastes, specific multi-criteria analysis methods were not used. The dimensionless ratios of several parameters when compared with coal or fuel oil were used in these studies. However, the fact of interest is that despite the difference in the calculation procedures in the present work and previous studies, the total efficiency indicator for fuel waste-derived slurries was still higher than for coal or close to it. Of course, the methods used in Vershinina and colleagues [35,36] were more limited since they did not explicitly present the variability of priorities and all the assessments were performed without any reference to the region or enterprises. In contrast, this study aimed to apply the MCDA tools to the assessment of waste-based fuels for different countries by taking into account different economic, social, and environmental priorities.
The modern energy sector needs diversification, which is due to several economic and environmental problems (high energy rates, environmental degradation, fuel deficit, and others). This need can be satisfied by developing alternative energy sources. Renewable power generation can be viable and efficient under certain conditions, but its development is limited by the lack of investment, geographical, and climate opportunities of particular regions. On the other hand, waste, considered as a fuel slurry component, is available even where it is difficult or impossible to put in place the production of energy from renewable energy sources. When taken critically, each of the fuels under consideration has both benefits and disadvantages. With waste-derived slurries, there are problems of integration into the existing energy production cycles, as well as pending issues of the viability of designing new systems for their combustion. Another important factor is the need to comply with all formal, legislative requirements to obtain permits for operating a plant for the incineration of unconventional raw materials. The cause of such problems is the lack of experience, fundamental data, and general assessment of the efficiency of new fuels. The results obtained in this study make it clear that waste-based fuel slurries, despite some of their disadvantages, can compete with coal. Evaluations similar to the one performed in this study can be used for practical purposes in engineering investigations and for informing the representatives of industrial enterprises and other parties concerned.

7. Conclusions

(i) Multi-criteria analysis methods can be used for an objective comparative analysis of the efficiency of traditional and promising fuels. In this research, waste-derived slurries were found to have a greater efficiency than coal and coal–water slurry (the difference being 1.5–50 times). According to the WSM and WPM calculations, the composition based on coal processing waste and used turbine oil turned out to be the most promising (An = 0.662–0.800). The calculation results using the AHP showed that coal processing waste without additives had the maximum efficiency indicator (An = 0.790–0.887).
(ii) The results of calculating the integral efficiency parameters of the fuels using the AHP had the greatest deviations from the results obtained using the WSM and the WPM, from 20% to 90%. Such a difference was explained using the specific aspects of the algorithm of weight coefficient choice, as well as the presence of the zeroth hierarchy level, which was a crucial contribution to the integral indicator. To develop the model of the fuel evaluation using the AHP method, it was necessary to vary the parameter of the zeroth hierarchy level of the analysis with a focus on the set priority.
(iii) More detailed efficiency analysis of different composite fuels requires using dimensional and dimensionless values of characteristics, taking into account the key indicators in the energy, environmental, social, and other spheres. The efficiency indicator depends on several parameters. In this study, these parameters changed by 5%–20%, when varying the temperature from 700 to 900 °C. The extremum of An is defined by the specific aspects of normalizing the parameters at different temperatures.

Author Contributions

Conceptualization, K.V.; data curation, V.D.; formal analysis, D.R.; investigation, V.D., D.R., and G.N.; methodology, G.N. and G.K.; project administration, K.V.; software, D.R.; writing—original draft, K.V. and G.N.; Writing—review and editing, G.K. All authors have read and agree to the published version of the manuscript.

Funding

The reported research was funded by the Russian Foundation for Basic Research and the Government of the Tomsk region of the Russian Federation (grant number 18-43-700001).

Conflicts of Interest

The authors declare no conflict of interest.

Nomenclature

Abbreviations
AHPanalytic hierarchy process
MCDAmultiple-criteria decision analysis
WSMweighted sum method
WPMweighted product method
Symbols
Aparameter characterizing fuel availability
Adash content of fuel (%)
Anintegral efficiency indicator of fuel
Bktparameter characterizing fuel storage and transportation conditions
Cnormalized fuel cost
Cdaf, Hdaf, Ndaf, Odaffraction of carbon, hydrogen, nitrogen, and oxygen a the fuel sample converted to a dry ash-free state (%)
CTRtransportation costs
Dparameter characterizing fuel dusting
Pfire and explosion safety indicator of fuel
Qashigh heat of combustion (MJ/kg)
SEparameter characterizing conservation of land resources when using fuel
SRparameter characterizing conservation of energy resources when using fuel
Tdmaxmaximum combustion temperature of fuel (°C)
T d max ¯ normalized maximum combustion temperature of fuel
Tgtemperature in combustion chamber (°C)
Tgminminimum ignition temperature (°C)
T g min ¯ normalized minimum ignition temperature of fuel
Vdafyield of volatiles in fuel sample converted to a dry ash-free state (%)
Wawater content of the original fuel sample (%)
wjweight coefficient of criterion
wnweight coefficient of a group of criteria
xijnormalized value of criterion
Greek symbols
τbduration of fuel combustion (s)
τd1gas-phase ignition delay time of fuel (s)
τ d 1 ¯ normalized gas-phase ignition delay time of fuel
τd2heterogeneous ignition delay time of fuel (s)

References

  1. Asif, M.; Muneer, T. Energy supply, its demand and security issues for developed and emerging economies. Renew. Sustain. Energy Rev. 2007, 11, 1388–1413. [Google Scholar] [CrossRef]
  2. Zhang, D.; Wang, J.; Lin, Y.; Si, Y.; Huang, C.; Yang, J.; Huang, B.; Li, W. Present situation and future prospect of renewable energy in China. Renew. Sustain. Energy Rev. 2017, 76, 865–871. [Google Scholar] [CrossRef]
  3. Mathiesen, B.V.; Lund, H.; Karlsson, K. 100% Renewable energy systems, climate mitigation and economic growth. Appl. Energy 2011, 88, 488–501. [Google Scholar] [CrossRef]
  4. Kang, K.; Qiu, L.; Sun, G.; Zhu, M.; Yang, X.; Yao, Y.; Sun, R. Codensification technology as a critical strategy for energy recovery from biomass and other resources - A review. Renew. Sustain. Energy Rev. 2019, 116, 109414. [Google Scholar] [CrossRef]
  5. Chyou, Y.-P.; Chang, D.-M.; Chen, P.-C.; Chien, H.-Y.; Wu, K.-T.; Chein, R.-Y. Development of biomass gasification technology with fluidized-bed reactors for enhancing hydrogen generation: Part I, hydrodynamic characterization of dual fluidized-bed Gasifiers. Appl. Sci. 2019, 10, 2. [Google Scholar] [CrossRef] [Green Version]
  6. Bhada-Tata, P.; Hoornweg, D.A. What a Waste? A Global Review of Solid Waste Management; World Bank: Washington, DC, USA, 2012; pp. 1–116. [Google Scholar]
  7. Yeh, C.K.; Lin, C.; Shen, H.C.; Cheruiyot, N.K.; Camarillo, M.E.; Wang, C.L. Optimizing food waste composting parameters and evaluating heat generation. Appl. Sci. 2020, 10, 2284. [Google Scholar] [CrossRef] [Green Version]
  8. Bhatia, S.K.; Joo, H.S.; Yang, Y.H. Biowaste-to-bioenergy using biological methods—A mini-review. Energy Convers. Manag. 2018, 177, 640–660. [Google Scholar] [CrossRef]
  9. Kuo, W.C.; Lasek, J.; Słowik, K.; Głód, K.; Jagustyn, B.; Li, Y.H.; Cygan, A. Low-temperature pre-treatment of municipal solid waste for efficient application in combustion systems. Energy Convers. Manag. 2019, 196, 525–535. [Google Scholar] [CrossRef]
  10. Yan, W.; Lou, C.; Cheng, Q.; Zhao, P.; Zhang, X. In Situ measurement of Alkali metals in an MSW incinerator using a spontaneous emission spectrum. Appl. Sci. 2017, 7, 263. [Google Scholar] [CrossRef] [Green Version]
  11. World Energy Balances 2019: Overview, International Energy Agency. Available online: https://webstore.iea.org/world-energy-balances-2019-overview (accessed on 2 April 2020).
  12. Nyashina, G.S.; Vershinina, K.Y.; Shlegel, N.E.; Strizhak, P.A. Effective incineration of fuel-waste slurries from several related industries. Environ. Res. 2019, 176, 108559. [Google Scholar] [CrossRef] [PubMed]
  13. Nyashina, G.S.; Kurgankina, M.A.; Strizhak, P.A. Environmental, economic and energetic benefits of using coal and oil processing waste instead of coal to produce the same amount of energy. Energy Convers. Manag. 2018, 174, 175–187. [Google Scholar] [CrossRef]
  14. International Energy Agency. Key World Energy Statistics. Available online: https://webstore.iea.org/key-world-energy-statistics-2019 (accessed on 2 April 2020).
  15. Kumar, A.; Sah, B.; Singh, A.R.; Deng, Y.; He, X.; Kumar, P.; Bansal, R.C. A review of multi criteria decision making (MCDM) towards sustainable renewable energy development. Renew. Sustain. Energy Rev. 2017, 69, 596–609. [Google Scholar] [CrossRef]
  16. Anwar, M.; Rasul, M.G.; Ashwath, N. The efficacy of multiple-criteria design matrix for biodiesel feedstock selection. Energy Convers. Manag. 2019, 198, 111790. [Google Scholar] [CrossRef]
  17. Njuguna Matheri, A.; Mbohwa, C.; Ntuli, F.; Belaid, M.; Seodigeng, T.; Catherine Ngila, J.; Kinuthia Njenga, C. Waste to energy bio-digester selection and design model for the organic fraction of municipal solid waste. Renew. Sustain. Energy Rev. 2018, 82, 1113–1121. [Google Scholar] [CrossRef]
  18. Fang, H.; Li, J.; Song, W. Sustainable site selection for photovoltaic power plant: An integrated approach based on prospect theory. Energy Convers. Manag. 2018, 174, 755–768. [Google Scholar] [CrossRef]
  19. Oldenbroek, V.; Smink, G.; Salet, T.; van Wijk, A.J.M. Fuel cell electric vehicle as a power plant: Techno-economic scenario analysis of a renewable integrated transportation and energy system for smart cities in two climates. Appl. Sci. 2019, 10, 143. [Google Scholar] [CrossRef] [Green Version]
  20. Wimmler, C.; Hejazi, G.; de Fernandes, E.O.; Moreira, C.; Connors, S. Multi-criteria decision support methods for renewable energy systems on Islands. J. Clean Energy Technol. 2015, 3, 185–195. [Google Scholar] [CrossRef] [Green Version]
  21. Ilbahar, E.; Cebi, S.; Kahraman, C. A state-of-the-art review on multi-attribute renewable energy decision making. Energy Strateg. Rev. 2019, 25, 18–33. [Google Scholar] [CrossRef]
  22. Taylan, O.; Kaya, D.; Demirbas, A. An integrated multi attribute decision model for energy efficiency processes in petrochemical industry applying fuzzy set theory. Energy Convers. Manag. 2016, 117, 501–512. [Google Scholar] [CrossRef]
  23. Saracoglu, B.O. Selecting industrial investment locations in master plans of countries. Eur. J. Ind. Eng. 2013, 7, 416–441. [Google Scholar] [CrossRef]
  24. Liu, J.; Jiang, X.; Zhou, L.; Wang, H.; Han, X. Co-firing of oil sludge with coal-water slurry in an industrial internal circulating fluidized bed boiler. J. Hazard. Mater. 2009, 167, 817–823. [Google Scholar] [CrossRef] [PubMed]
  25. Chakraborty, N.; Mukherjee, I.; Santra, A.K.; Chowdhury, S.; Chakraborty, S.; Bhattacharya, S.; Mitra, A.P.; Sharma, C. Measurement of CO2, CO, SO2, and NO emissions from coal-based thermal power plants in India. Atmos. Environ. 2008, 42, 1073–1082. [Google Scholar] [CrossRef]
  26. Munawer, M.E. Human health and environmental impacts of coal combustion and post-combustion wastes. J. Sustain. Min. 2018, 17, 87–96. [Google Scholar] [CrossRef]
  27. Nakomcic-Smaragdakis, B.; Cepic, Z.; Cepic, M.; Stajic, T. Data analysis of the flue gas emissions in the thermal-power plant firing fuel oil and natural gas. Int. J. Environ. Sci. Technol. 2014, 11, 269–280. [Google Scholar] [CrossRef] [Green Version]
  28. Wang, L.; Li, P.; Yu, S.; Mehmood, K.; Li, Z.; Chang, S.; Liu, W.; Rosenfeld, D.; Flagan, R.C.; Seinfeld, J.H. Predicted impact of thermal power generation emission control measures in the Beijing-Tianjin-Hebei region on air pollution over Beijing, China. Sci. Rep. 2018, 8, 934. [Google Scholar] [CrossRef]
  29. Huéscar Medina, C.; Maccoitir, B.; Sattar, H.; Slatter, D.J.F.; Phylaktou, H.N.; Andrews, G.E.; Gibbs, B.M. Comparison of the explosion characteristics and flame speeds of pulverised coals and biomass in the ISO standard 1 m3 dust explosion equipment. Fuel 2015, 151, 91–101. [Google Scholar] [CrossRef]
  30. Lu, H.; Xu, F.Y.; Liu, H.; Wang, J.; Campbell, D.E.; Ren, H. Emergy-based analysis of the energy security of China. Energy 2019, 181, 123–135. [Google Scholar] [CrossRef]
  31. Ministry of Finance of the Russian Federation. Available online: https://www.minfin.ru (accessed on 10 February 2020).
  32. Organisation for Economic Co-operation and Development; International Energy Agency. Energy Policies of IEA Countries. Japan 2016 Review; International Energy Agency: Paris, France, 2016; ISBN 9789264265868. [Google Scholar]
  33. Qian, X.; Lee, S.; Chandrasekaran, R.; Yang, Y.; Caballes, M.; Alamu, O.; Chen, G. Electricity evaluation and emission characteristics of poultry litter co-combustion process. Appl. Sci. 2019, 9, 4116. [Google Scholar] [CrossRef] [Green Version]
  34. Kopczyński, M.; Lasek, J.A.; Iluk, A.; Zuwała, J. The co-combustion of hard coal with raw and torrefied biomasses (willow (Salix viminalis), olive oil residue and waste wood from furniture manufacturing). Energy 2017, 140, 1316–1325. [Google Scholar] [CrossRef]
  35. Vershinina, K.Y.; Shlegel, N.E.; Strizhak, P.A. A comparison of ignition characteristics of slurry fuels prepared using coal processing waste and finely divided coal. J. Energy Inst. 2019, 92, 1167–1177. [Google Scholar] [CrossRef]
  36. Vershinina, K.Y.; Shlegel, N.E.; Strizhak, P.A. Recovery of waste-derived and low-grade components within fuel slurries. Energy 2019, 183, 1266–1277. [Google Scholar] [CrossRef]
  37. Xu, H.; Smoot, L.D.; Hill, S.C. Computational model for NOx reduction by advanced reburning. Energy & Fuels 1999, 13, 411–420. [Google Scholar]
  38. Zhou, H.; Li, Y.; Li, N.; Qiu, R.; Cen, K. Conversions of fuel-N to NO and N2O during devolatilization and char combustion stages of a single coal particle under oxy-fuel fluidized bed conditions. J. Energy Inst. 2019, 92, 351–363. [Google Scholar] [CrossRef]
  39. Tu, Y.; Liu, H.; Su, K.; Chen, S.; Liu, Z.; Zheng, C.; Li, W. Numerical study of H2O addition effects on pulverized coal oxy-MILD combustion. Fuel Process. Technol. 2015, 138, 252–262. [Google Scholar] [CrossRef]
  40. Olympiou, G.G.; Efstathiou, A.M. Industrial NOx control via H2-SCR on a novel supported-Pt nanocatalyst. Chem. Eng. J. 2011, 170, 424–432. [Google Scholar] [CrossRef]
Figure 1. Fuel efficiency criteria regarding key indicators, which were divided into several groups.
Applsci 10 02460 g001
Figure 2. Integral efficiency indicators of fuels for China, Japan, and Russia that were calculated using the weighted sum method (WSM) (a), the weighted product method (WPM) (b) and the analytic hierarchy process (AHP) (c) (the numbers of columns in the diagrams correspond to fuels from Table 4; Tg ≈ 800 °C).
Applsci 10 02460 g002
Figure 3. Relative criteria (economic, environmental, social, energy, and safety) for coal, coal–water fuel, and waste-derived slurry. Criteria typical of Russia are shown at Tg ≈ 700 °C.
Applsci 10 02460 g003
Figure 4. Influence of the temperature on the integral efficiency indicator of waste-derived slurry (the indicator was calculated for Japan using the WSM, the WPM, and the AHP).
Applsci 10 02460 g004
Figure 5. The integral efficiency indicator calculated using three multi-criteria decision analysis (MCDA) methods at 700 °C, 800 °C, and 900 °C (results for China).
Applsci 10 02460 g005
Table 1. Results of pairwise comparisons of criteria.
def
a4/11/12/1
b2/13/11/1
c1/31/41/1
Table 2. Normalized weight coefficients.
defSumNormalized Sum
a41270.480
b23160.412
c0.330.2511.580.108
Total14.581
Table 3. Weight coefficients of parameters, used in the weighted sum method (WSM) and the weighted product method (WPM) calculations.
IndicatorsChinaJapanRussia
Energy indicatorsWeight coefficients
Gas-phase ignition delay time0.06650.06650.0665
Heterogeneous ignition delay time0.06650.06650.0665
Combustion duration0.06650.06650.0665
Calorific value0.06750.06750.0675
Minimum ignition temperature0.06650.06650.0665
Ash content0.06650.06650.0665
Environmental indicators
Sulfur oxide emissions0.120.1000.05
Nitrogen oxide emissions0.120.1000.05
Economic indicators
Fuel cost0.060.0300.1
Transportation costs0.050.0700.1
Availability of fuel (its components)0.050.0500.1
Safety indicators
Fire and explosion safety0.050.050.05
Dusting0.0250.0250.025
Convenience of storage and transportation0.0250.0250.025
Social indicators
Conservation of energy resources0.050.0750.05
Conservation of land resources0.050.0750.05
Table 4. Fuels under study.
NumberComposition
1100% filter cake (wet)
255% coal, 45% water
340% filter cake (dry), 50% water, 10% waste turbine oil
420% coal sludge, 30% filter cake, 10% peat, 40% water
5100% coal
Table 5. Properties of the solid fuel components.
ComponentWa (%)Ad (%)Vdaf (%)Qas (MJ/kg)Cdaf (%)Hdaf (%)Ndaf (%)Std (%)Odaf (%)
Coal sludge18.816.420.8021.6188.274.352.180.574.63
Filter cake43.537.041.4719.2473.274.901.020.2220.59
Coal10.18.540.1924.8277.466.252.270.3513.67
Peat9.922.874.8011.7952.066.313.580.2037.85
Table 6. Waste turbine oil properties.
Density at 20 °C (kg/m3)Ash (%)Flash Point (°C)Ignition Temperature (°C)High Calorific Value (MJ/kg)
8690.0321724545.1
Table 7. Absolute values of parameters characterizing the fuel ignition and combustion [35,36].
Tg (°C)FuelSOx (ppm)NOx (ppm)τd1 (s)τd2 (s)τb (s)Qas (MJ/kg)Tgmin (°C)Ad (%)
700115.0050.007.8511.7032.7613.66475.0019.67
212.00100.008.9510.1325.3016.37400.008.06
315.00141.001.603.606.6412.21550.005.86
448.0060.002.957.9421.9013.09430.0017.71
550.0050.003.905.9512.1425.79350.0013.90
800125.0085.006.977.5026.8013.66475.0019.67
225.00150.005.778.7022.7016.37400.008.06
325.00157.001.253.254.8512.21550.005.86
450.00120.002.764.4023.8013.09430.0017.71
5200.00200.002.093.7913.9625.79350.0013.90
900160.00140.005.384.5064.0413.66475.0019.67
245.00250.005.156.4715.1016.37400.008.06
363.00180.001.251.753.1512.21550.005.86
453.00175.002.503.3620.3013.09430.0017.71
5250.00275.000.751.4514.6825.79350.0013.90
Table 8. Estimation of the comparative fuel cost for different countries (€/kg).
NumberFuelRussiaChinaJapan
1100% filter cake (wet)0.0050.0050.005
255% coal, 45% water0.02750.03960.055
340% filter cake (dry), 50% water, 10% waste turbine oil0.01850.01850.0185
420% coal sludge, 30% filter cake, 10% peat, 40% water0.00720.00720.0072
5100% coal0.0500.0720.100
Table 9. Normalized values of the evaluation criteria.
Tg (°C)Fuel No.CTRSOxNOxSRSEτd1τd2τbQasTgminAdPDBkt
70011.00.801.001.001.000.200.310.200.530.740.300.761.000.8
21.01.000.500.010.010.180.360.260.630.880.730.641.000.5
31.00.800.351.001.001.001.001.000.470.641.000.151.000.8
41.00.250.831.001.000.540.450.300.510.810.330.221.000.8
50.50.241.000.010.010.410.610.551.001.000.420.180.300.8
80011.01.001.001.001.000.180.430.180.530.740.300.861.000.8
21.01.000.570.010.010.220.370.210.630.880.730.531.000.5
31.01.000.541.001.001.001.001.000.470.641.000.151.000.8
41.00.500.711.001.000.450.740.200.510.810.330.271.000.8
50.50.130.430.010.010.600.860.351.001.000.420.120.300.8
90011.00.751.001.001.000.140.320.050.530.740.300.861.000.8
21.01.000.560.010.010.150.220.210.630.880.730.611.000.5
31.00.710.781.001.000.600.831.000.470.641.000.191.000.8
41.00.850.801.001.000.300.430.160.510.810.330.301.000.8
50.50.180.510.010.011.001.000.211.001.000.420.060.300.8
Table 10. Normalized values of the fuel cost and availability for different countries.
Fuel No.CompositionChinaJapanRussia
CACACA
1100% filter cake (wet)1.001.01.000.51.001.0
255% coal, 45% water0.131.00.090.50.181.0
340% filter cake (dry), 50% water, 10% waste turbine oil0.271.00.270.50.271.0
420% coal sludge, 30% filter cake, 10% peat, 40% water0.690.90.690.50.691.0
5100% coal0.071.00.050.50.101.0
Table 11. Maximum combustion temperatures of the fuels under study (at 700 °C).
FuelTdmax (°C)
100% filter cake (wet)880
55% coal, 45% water1035
40% filter cake (dry), 50% water, 10% waste turbine oil1050
20% coal sludge, 30% filter cake, 10% peat, 40% water1023
100% coal1350
Table 12. Integral efficiency indicators of the fuels using the WSM.
No. of FuelCompositionRussiaJapanChina
700 °C800 °C900 °C700 °C800 °C900 °C700 °C800 °C900 °C
1100% filter cake (wet)0.7250.7450.7140.6900.7200.6770.7110.7450.697
255% coal, 45% water0.5660.5640.5530.5210.5230.5110.5610.5640.552
340% filter cake (dry), 50% water, 10% waste turbine oil0.7770.7970.7580.7610.8000.7590.7470.7940.752
420% coal sludge, 30% filter cake, 10% peat, 40% water0.6750.6900.6810.6260.6480.6600.6180.6430.664
5100% coal0.5260.5050.5350.4900.4340.4710.5320.4620.502
Table 13. Integral efficiency indicators of the fuels using the WPM.
No. of FuelCompositionRussiaJapanChina
700 °C800 °C900 °C700 °C800 °C900 °C700 °C800 °C900 °C
1100% filter cake (wet)0.6280.6440.5620.6000.6220.5350.6180.6440.551
255% coal, 45% water0.3540.3530.3350.2900.2910.2750.3540.3570.337
340% filter cake (dry), 50% water, 10% waste turbine oil0.6860.7090.6860.6820.7280.7050.6620.7160.694
420% coal sludge, 30% filter cake, 10% peat, 40% water0.6040.6220.5990.5530.5860.5820.5460.5840.589
5100% coal 0.3190.2960.2960.2680.2300.2360.3210.2680.278
Table 14. Comparison matrix of economic indicators.
CTRASumNormalized Sum (Weight Coefficient wj)
CTR1/11/21.50.33
A2/11/130.67
Total4.51
Table 15. Comparison matrix of environmental indicators.
SOxNOxSumNormalized Sum (Weight Coefficient wj)
SOx1/11/120.50
NOx1/11/120.50
Total41
Table 16. Comparison matrix of social indicators.
SRSESumNormalized Sum (Weight Coefficient wj)
SR1/11/120.50
SE1/11/120.50
Total41
Table 17. Comparison matrix of energy performance indicators.
τd1τd2τbQasTgminAdSumNormalized Sum (Weight Coefficient wj)
τd11/11/11/11/21/11/250.125
τd21/11/11/11/21/11/250.125
τb1/11/11/11/21/11/250.125
Qas2/12/12/11/12/11/1100.25
Tgmin1/11/11/11/21/11/250.125
Ad2/12/12/11/12/11/1100.250
Total 401
Table 18. Comparison matrix of safety indicators.
PDBktSumNormalized Sum (Weight Coefficient wj)
P1/13/13/170.575
D1/31/11/21.8330.151
Bkt1/32/11/13.3330.274
Total 12.1661
Table 19. Results of the pairwise comparison of the groups of criteria for Russia.
EconomicEnvironmentalSocialEnergy PerformanceSafety
Economic1/11/12/12/11/1
Environmental1/11/12/12/11/1
Social1/21/21/12/11/1
Energy performance1/21/21/21/11/1
Safety1/11/11/11/11/1
Table 20. Results of the pairwise comparison of the groups of criteria for Japan.
EconomicEnvironmentalSocialEnergy PerformanceSafety
Economic1/11/21/22/11/1
Environmental2/11/11/12/11/1
Social2/11/11/12/11/1
Energy performance1/21/21/21/11/1
Safety1/11/11/11/11/1
Table 21. Results of the pairwise comparison of the groups of criteria for China.
EconomicEnvironmentalSocialEnergy PerformanceSafety
Economic1/11/22/12/11/1
Environmental2/11/12/12/11/1
Social1/21/21/12/11/1
Energy performance1/21/21/21/11/1
Safety1/11/11/11/11/1
Table 22. Weight coefficients for each group of criteria.
Criteria GroupRussiaJapanChina
Economic0.250.180.23
Environmental0.250.250.29
Social0.180.250.18
Energy performance0.130.130.13
Safety0.180.180.18
Table 23. Integral efficiency indicator, which was determined by the analytic hierarchy process (AHP) (fuel numbers correspond to the compositions indicated in Table 4).
Fuel No.RussiaJapanChina
700 °C800 °C900 °C700 °C800 °C900 °C700 °C800 °C900 °C
10.8510.8870.8520.7900.8270.7910.8670.9070.867
20.1130.1130.1130.0450.0450.0450.0830.0830.083
30.2060.2190.2160.1900.2030.2000.2070.2220.219
40.4940.5090.5450.4520.4680.5030.4840.5020.543
50.0520.0430.0450.0200.0160.0170.0370.0300.031

