Article

Evaluation of the Functional Performance of Paving Materials Based on the Driving Wheel Pavement Analyzer

1
School of Civil Engineering, Guangzhou University, Guangzhou 510006, China
2
School of Civil Engineering and Transportation, South China University of Technology, Guangzhou 510640, China
*
Authors to whom correspondence should be addressed.
Appl. Sci. 2020, 10(7), 2410; https://doi.org/10.3390/app10072410
Submission received: 26 February 2020 / Revised: 23 March 2020 / Accepted: 24 March 2020 / Published: 1 April 2020
(This article belongs to the Special Issue Asphalt Materials II)

Abstract

:

Featured Application

This study presented a new pavement surface function evaluation method that effectively evaluated the functional performance of different pavement materials, which could be used to optimize pavement surface functional performance and improve the performance of surface treatment materials.

Abstract

There is still a lack of suitable methods for evaluating pavement functional performance according to the characteristics of real-world environment and traffic. This study developed an acceleration test method based on the Driving Wheel Pavement Analyser (DWPA) to evaluate the anti-sliding properties, anti-stripping properties, and tire–pavement noise of AC-13, SMA-13, and OGFC-13 asphalt mixtures, and MS-1, MS-2, and MS-3 micro-surfacing materials. The results indicate that the OGFC-13 mixture exhibited the largest texture depth, and the SMA-13 mixture exhibited the largest British pendulum number (BPN) at the end of the test. The MS-3 material had the best anti-sliding performance among the micro-surfacing materials. Coarse gradation improved the anti-stripping performance of the micro-surfacing materials. The tire–pavement noise for all materials increased with the increase of wheel repetitions. The OGFC-13 mixture and MS-3 micro-surfacing material exhibited the best and worse noise reduction performance, respectively. The new measurement method for evaluating the pavement surface functional performance was proved to be efficient.

Graphical Abstract

1. Introduction

Transportation is a fundamental and evolving national industry, which provides important support for economic and social development. By the end of 2018, China’s total highway mileage had exceeded 4.856 million km [1,2]. With the continuous growth of highway mileage and service time, the new concept of “equal emphasis on construction and maintenance” has gradually been accepted for highway development. Pavement maintenance has become a key task for the Department of Transportation in China. Although there have been many studies performed on pavement maintenance and preservation [3,4], new types of maintenance measures and materials are still needed to cope with new demands, such as rapid maintenance under heavy traffic conditions.
Traditionally, engineering research focused on the bearing capacity of pavement structures [5,6,7,8]. However, the functional damage of the road surface is receiving more attention than before. The functional performance of pavement refers to the performance not related to the road structure, such as the anti-sliding, anti-stripping, noise reduction, and water permeability performance provided by the functional layer of the pavement surface. Although there are methodologies used to evaluate the functional performance of pavements [9,10,11], such as the sideways force coefficient routine investigation machine (SCRIM) test, the grip tester, and on-board sound intensity (OBSI). These methods are used on the constructed pavement surface. Therefore, it is difficult to obtain data in a controlled environment through these on-site methods. Due to limitations related to the test conditions (e.g., environment, materials, and technology), it is necessary to find an indoor test method that could control and quantitatively evaluate the factors influencing a pavement’s functional performance. Some contractors have proposed control indicators from the perspective of commercial interests [12,13]. However, these indicators are not enough for guiding actual construction or for quality evaluation purposes.
Pavement surfaces with good functional performance offer safer driving conditions for vehicles, provide good anti-sliding performance, anti-stripping performance, and reduce the tire–pavement noise. These functional performances directly determine the economic benefits of pavement maintenance measures. At present, tests for pavement functional performance include indoor simulation tests and full-scale track tests [14,15,16,17,18,19,20]. Full-scale track tests could directly reflect pavement performance but require a huge amount of investment and a long test cycle. Therefore, such tests are not suitable for routine use. Furthermore, as the wheels of a circular track testing machine moved in a circle, the road surface was subjected to centrifugal forces. However, in addition to the vertical force and shearing force of the wheel, the road surface was also subjected to radial shear forces [21], which was not entirely consistent with the actual tire–pavement interaction mechanism. Therefore, the variation of pavement function performance under complex environmental conditions should be simulated by an indoor pavement accelerating test to overcome this problem. Various experts and engineers have promoted pavement acceleration devices for pavement surface function tests (Table 1), such as the Michigan Indoor Wear Track developed by the Michigan Department of Transportation (MDOT) [22], which uses a circular pavement track and simulates the rolling process of a car with two wheels. By applying a vertical load on the wheel, the wheel was towed to achieve rapid wear on the road surface. The three-wheel accelerated wear tester (ASTM E660-1990 2015) was developed by the American Asphalt Technology Centre [23]. The friction coefficients of specimens were then measured using a friction coefficient tester. North Carolina State developed its own NCSU Wear and Polish Machine [24], which had a circular test track that contains four tires (three are loaded to achieve rapid wear and the other is used for data collection). Khasawneh [25,26] developed a new type of pavement surface functional accelerated wear instrument, which used either plate-type or cylindrical specimens and adopted a specially designed “rubber boot” for surface acceleration tests. Yang [27] from Tongji University developed a small accelerated wear tester, where the wear effect was achieved through the combined movement of the specimen and the fixed friction wheel. Zhao [28] from Chang’an University developed an anti-sliding simulation test machine based on the principle of miniature circular track tests. This machine is driven through the central axis to tow the test wheel to achieve road surface wearing. Finally, Tan [29] from Chongqing Jiaotong University developed the “aggregate/asphalt mixture friction characteristic tester,” which was a miniature straight track test system that simulated the effect of friction on dynamic driving under the condition of a 100% slip rate and automatically measured the dynamic friction coefficient.
Based on these acceleration test devices, researchers had also developed several test specifications, such as ASTM D3319, ASTM E1393, ASTM E660, and AASHTO T327-05/Tex-461-A [22,23,24]. However, most of the mentioned pavement surface functional acceleration tests used towed test wheels, which are not able to simulate the horizontal shear force on the pavement surface. Because the horizontal shear force has a significant impact on the deterioration of the pavement surface, there are some inconsistencies between the test results and the damage state of real-world pavement.
Given the complexity of actual pavement, it was necessary to develop an acceleration test method for the pavement function performance according to the characteristics of environmental and traffic loads. The DWPA was then designed and developed by the South China University of Technology [30,31] in 2012. This system applied actual tires to drive the specimen wheel, which could simulate the horizontal shear stress on the pavement surface. The wheel load, tire pressure, speed, and environmental conditions could be set and controlled according to the specific test purpose [32,33,34]. Based on the DWPA test system, this study evaluated the anti-sliding performance, anti-stripping performance, and pavement/tire noise of different types of asphalt mixture (AC-13, SMA-13, and OGFC-13) and micro-surfacing material (MS-1, MS-2, and MS-3). This study aimed to facilitate a feasible measurement method for evaluating pavement surface functional performance and provide better tools for surface treatment materials design. This method could be used to obtain the degradation model of a functional index for each material, and provide a basis for the decision of pavement maintenance measures.

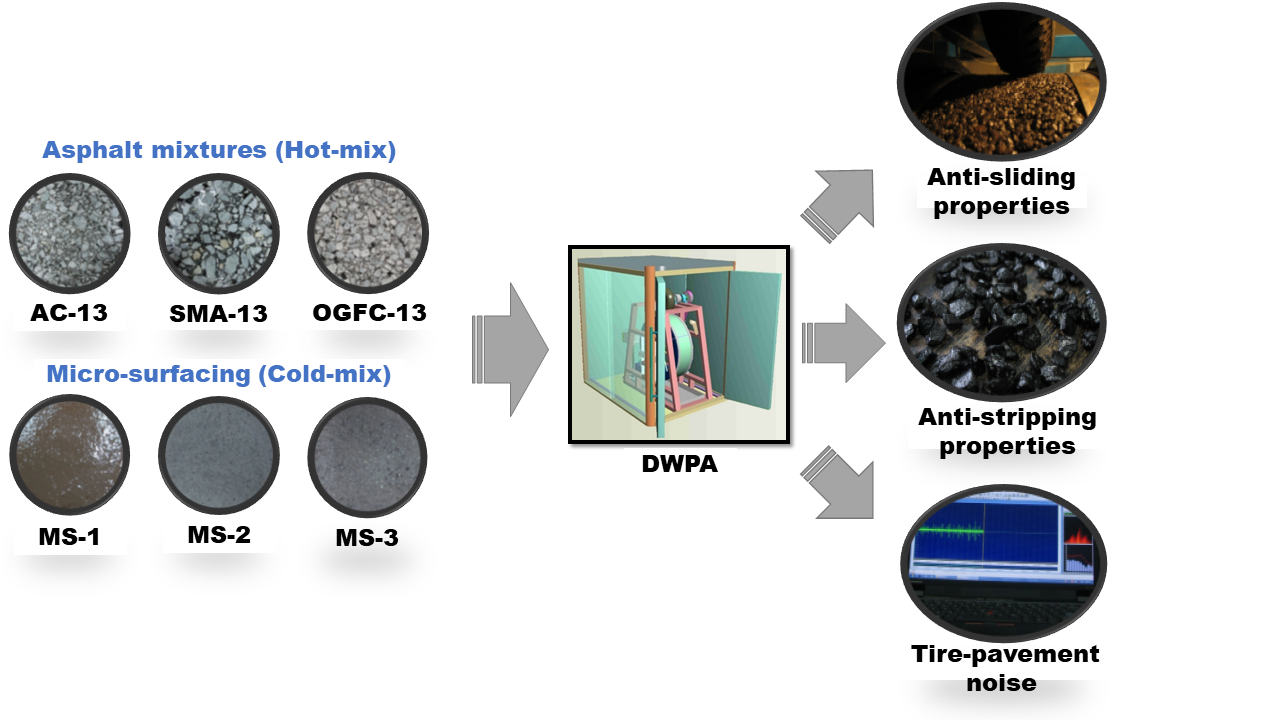
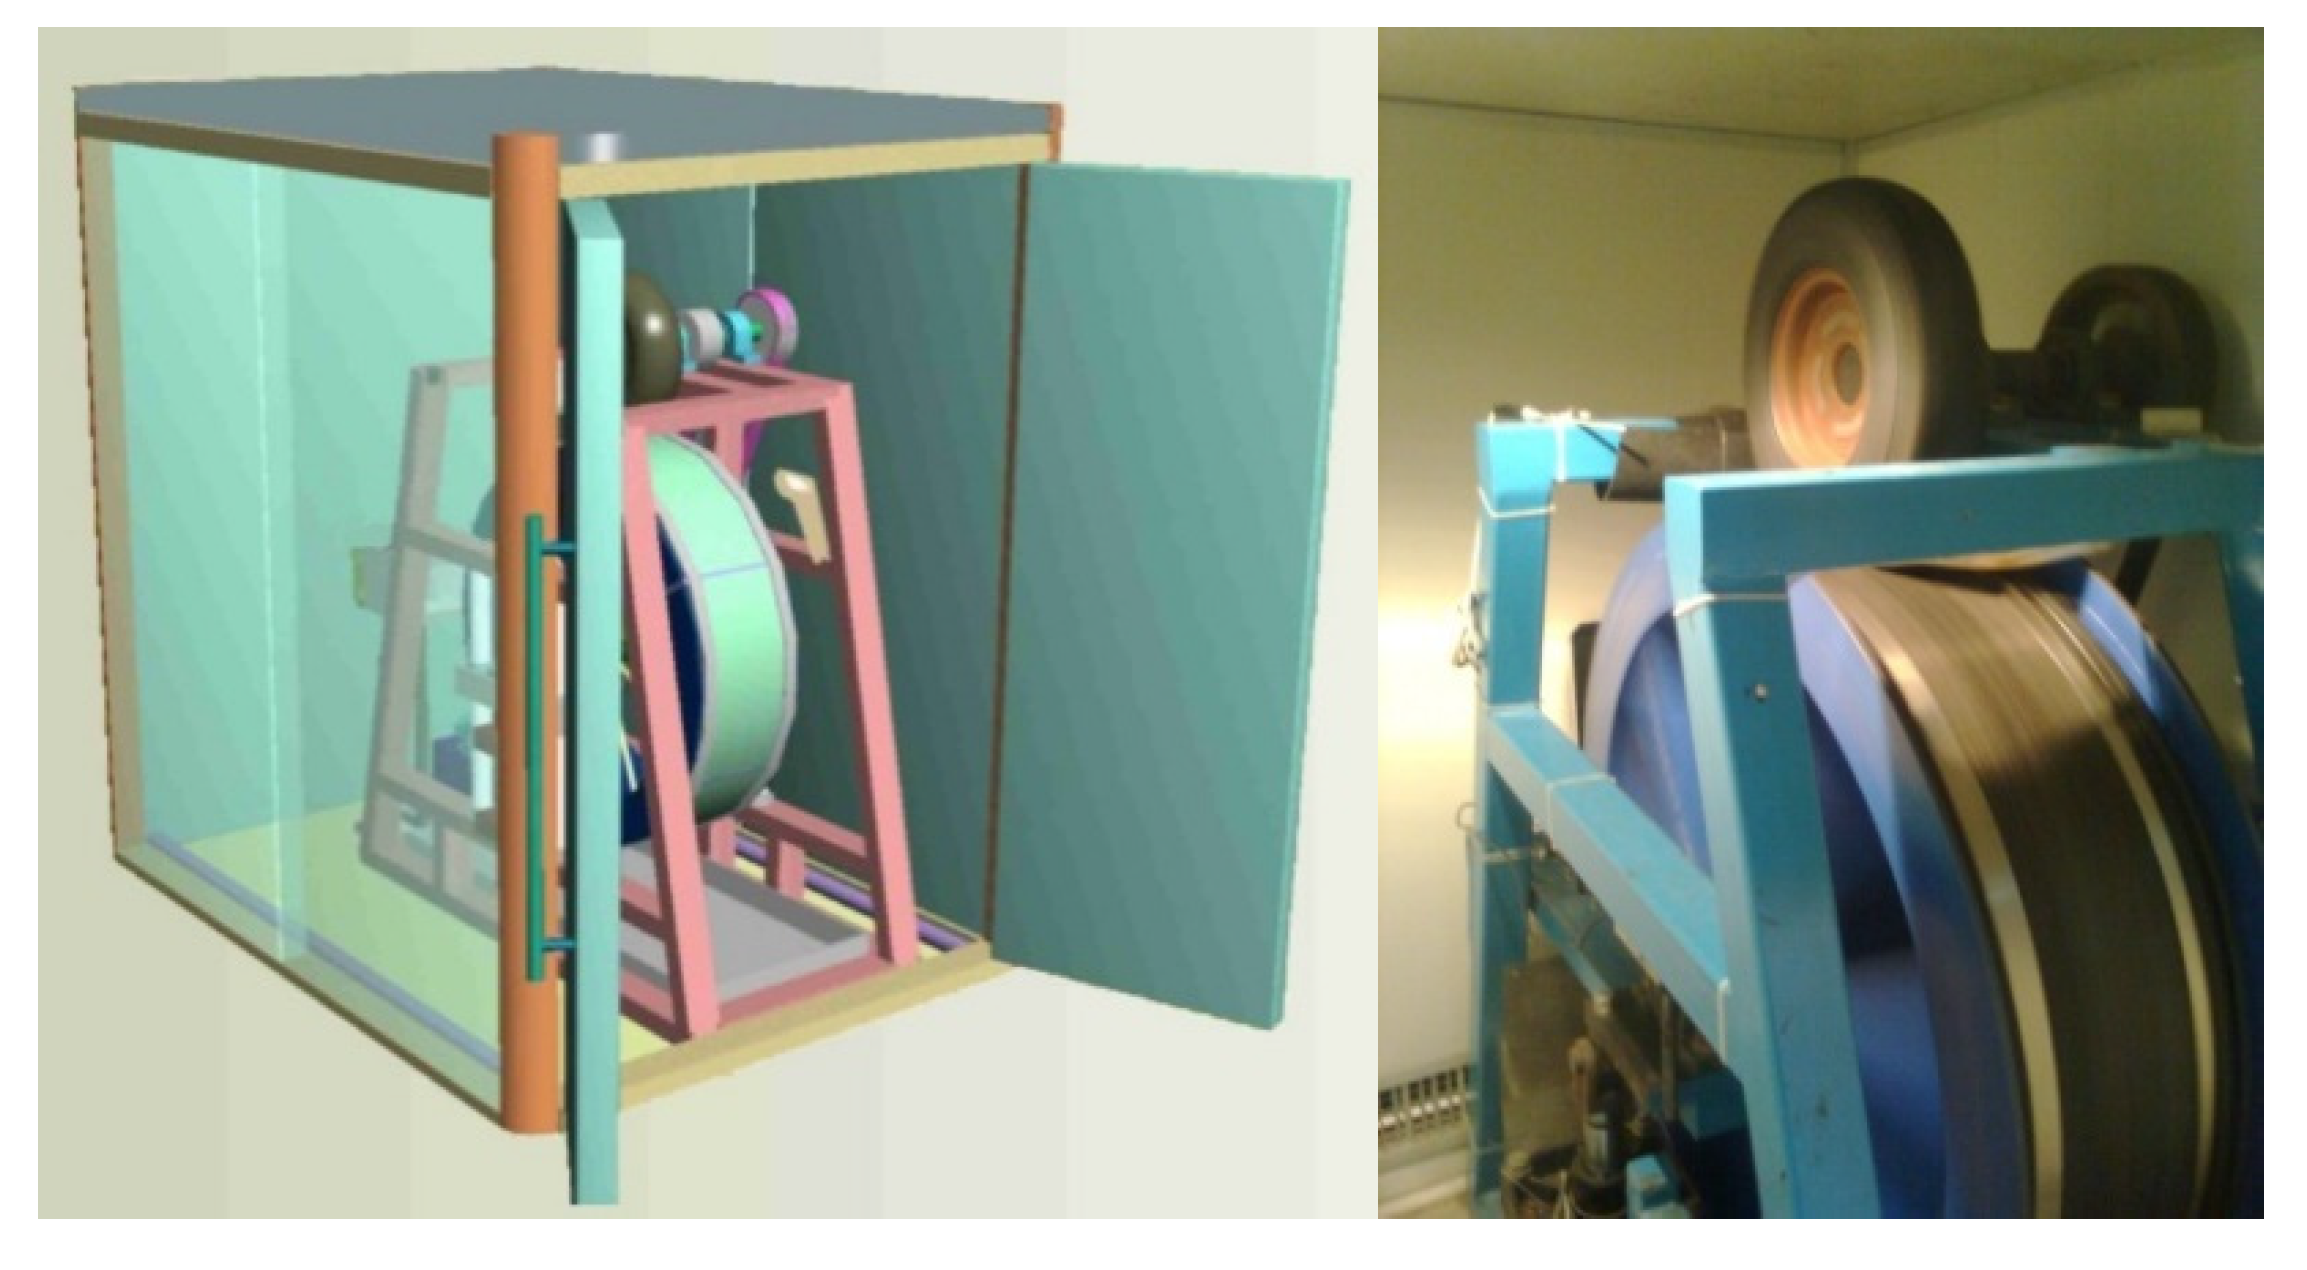
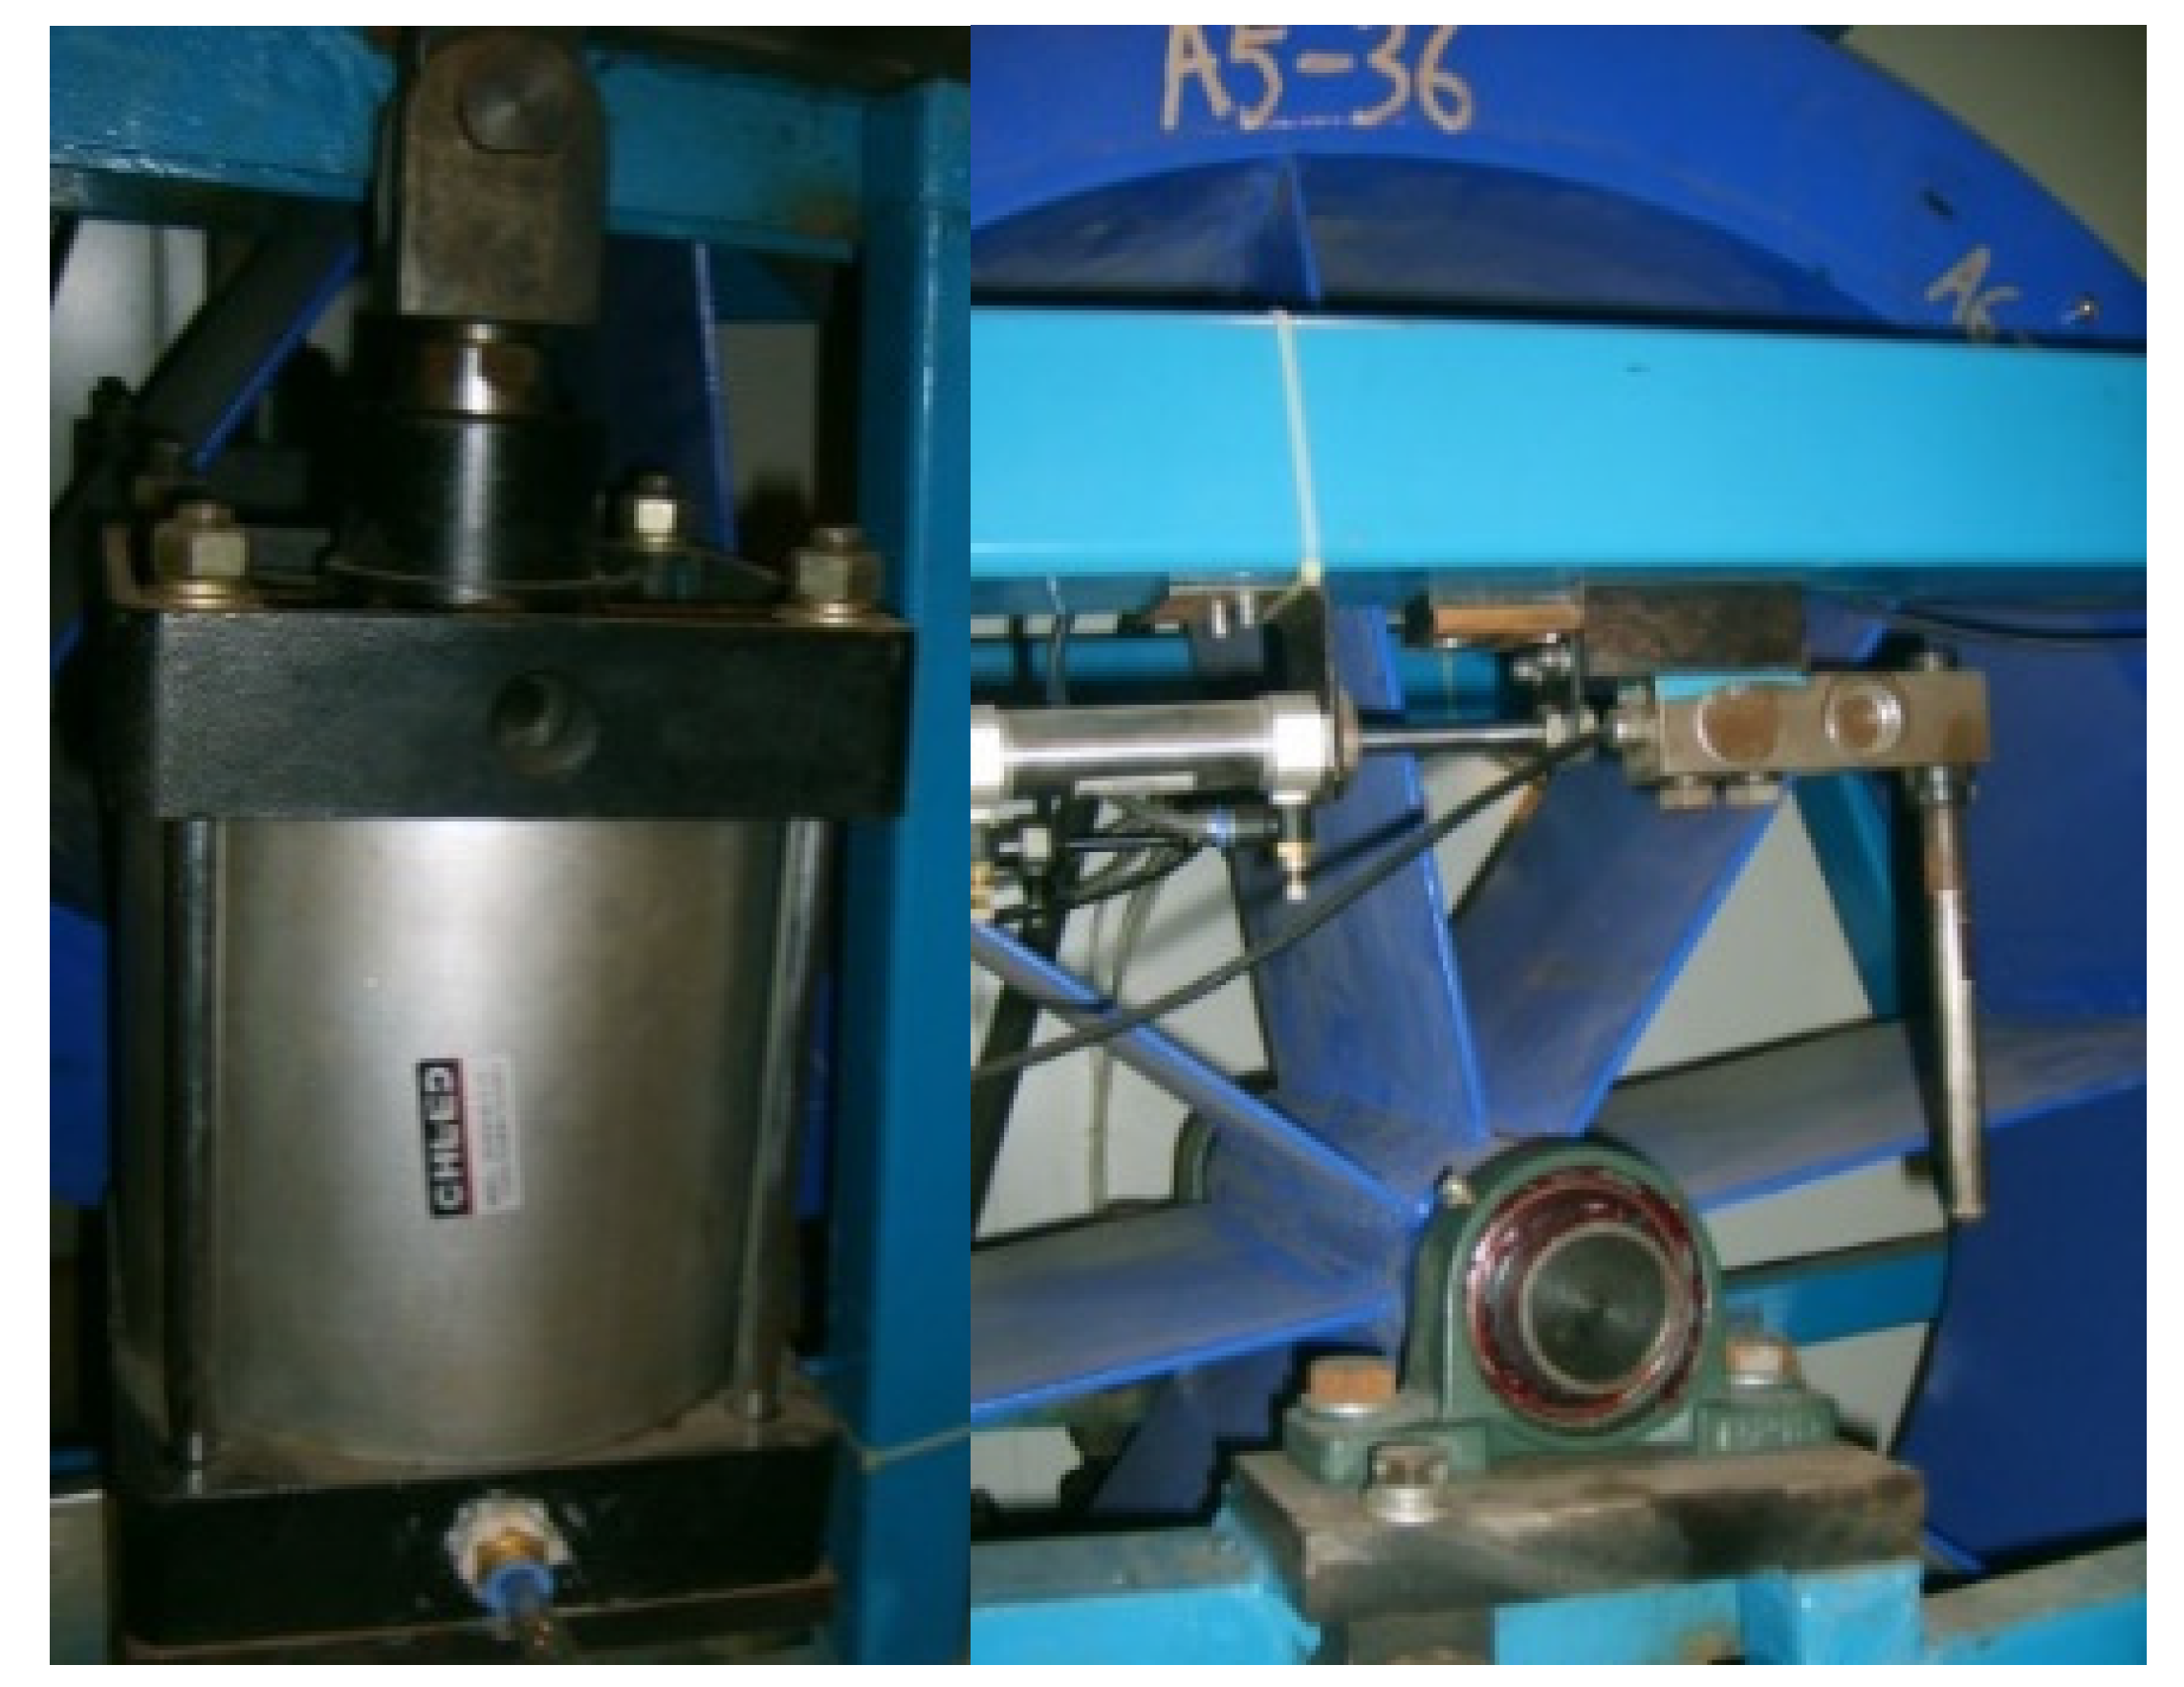
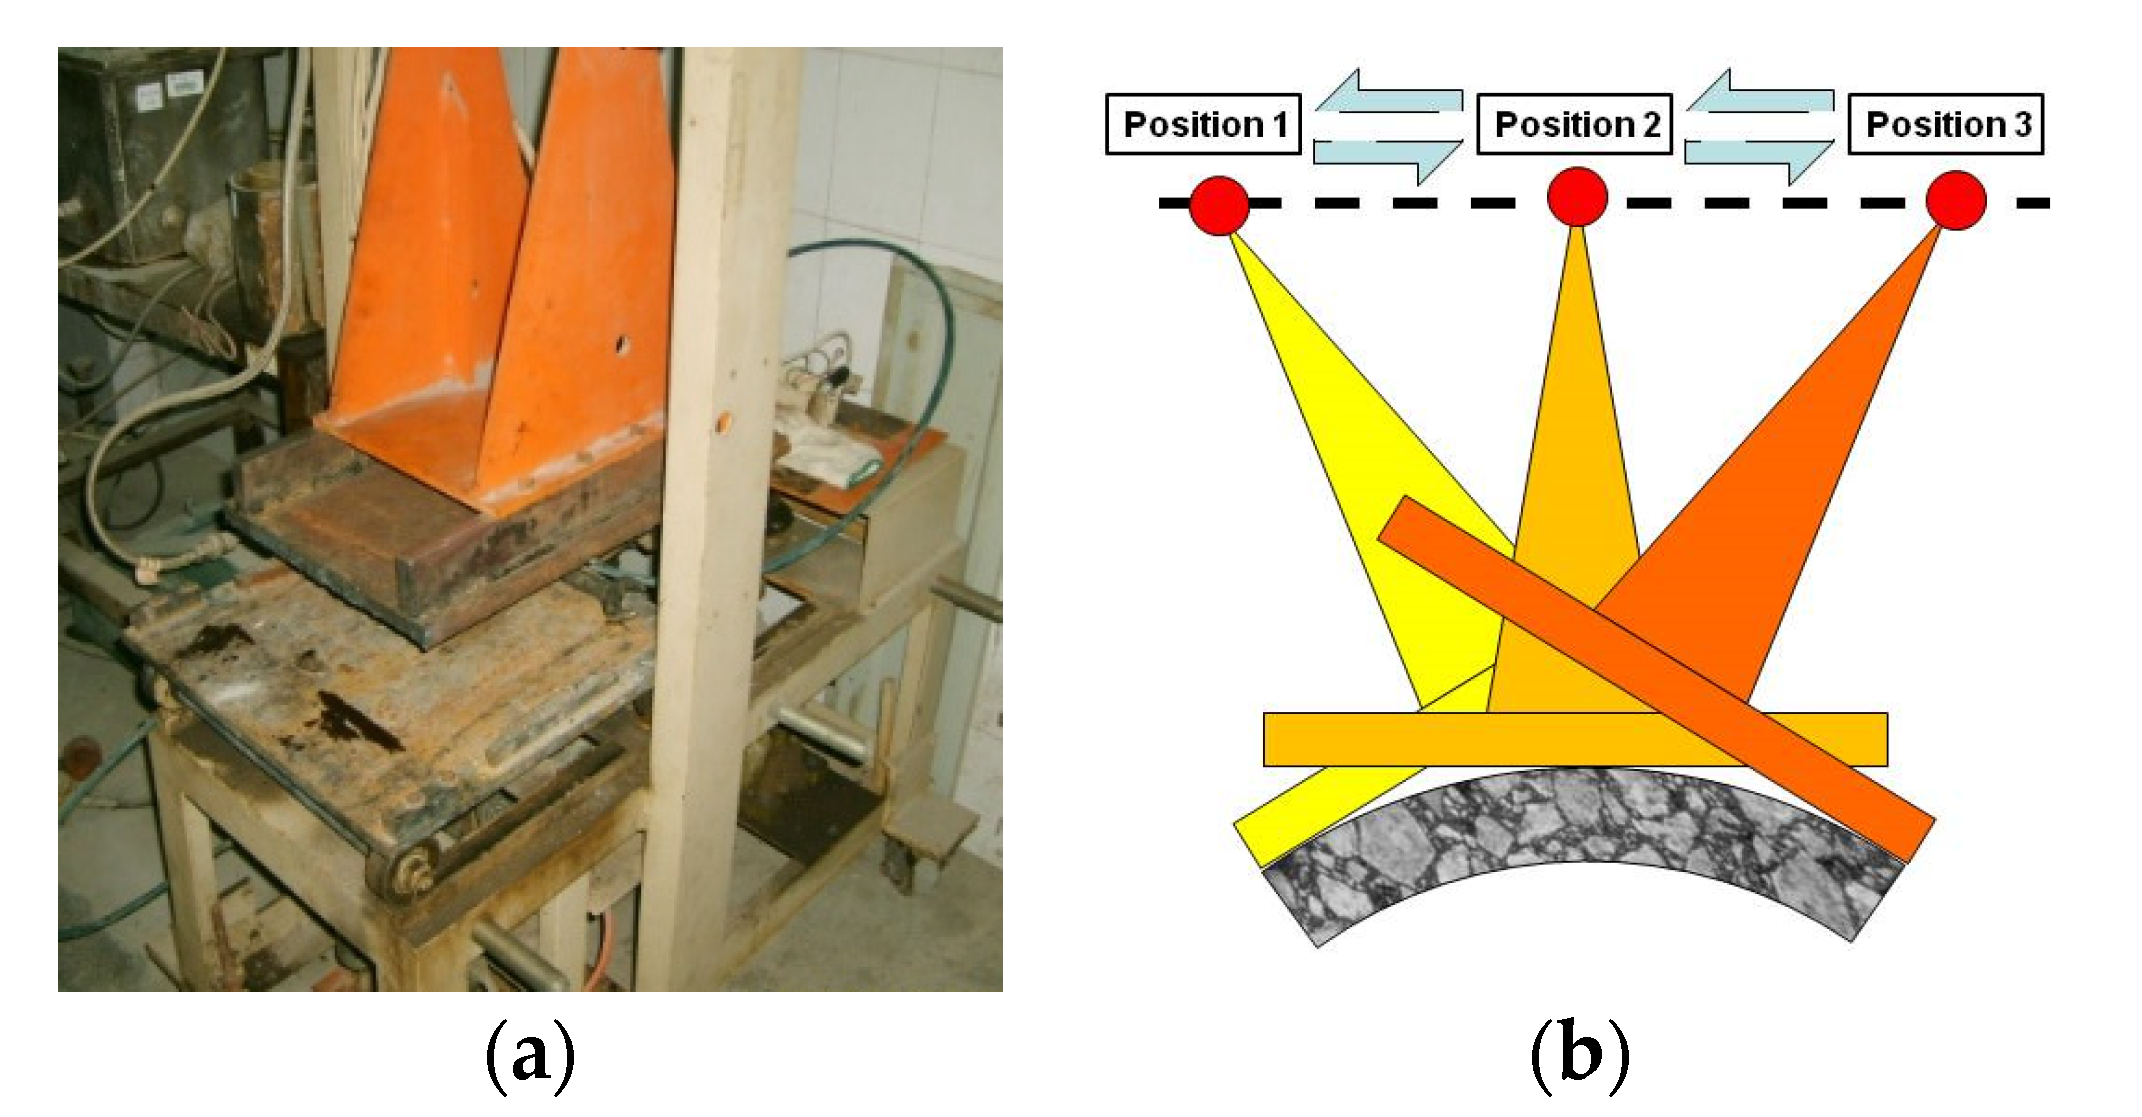
2. Driving Wheel Pavement Analyzer

The pavement surface functional performance acceleration test was performed using the DWPA [32,33,34]. The core part of the DWPA included the main driving wheel and the specimen wheel. The specimen wheel could hold up to eight specimens, which would combine to form a circular pavement, as shown in Figure 1.
The driving wheel was a full-size vehicle tire. The tire width was 80 mm and the maximum inflation pressure was 720 kPa. The axle load could be set between 1.5 kN and 4.5 kN using a precise control system. The axle load was adjusted using two air jacks and two pressure sensors installed below the axis of the specimen wheel, as shown in Figure 2. The air jacks were controlled using a programmable logic controller (PLC). According to the tire–pavement contact area and axle road, when the inflation pressure of the tire was 700 kPa and the axle load was 2.5 kN, the contact pressure between the tire and the specimen was 0.7 MPa.
The design of the continuously variable power unit allowed for the wheel speed to be adjusted from 5–40 km/h. The system was equipped with a 1500 mm × 2000 mm × 2000 mm temperature chamber. The test temperature was adjustable in the range of 20–80 °C. To ensure the uniform internal and external temperatures of the specimen, the heating time of the system should not be less than 5.5 h.

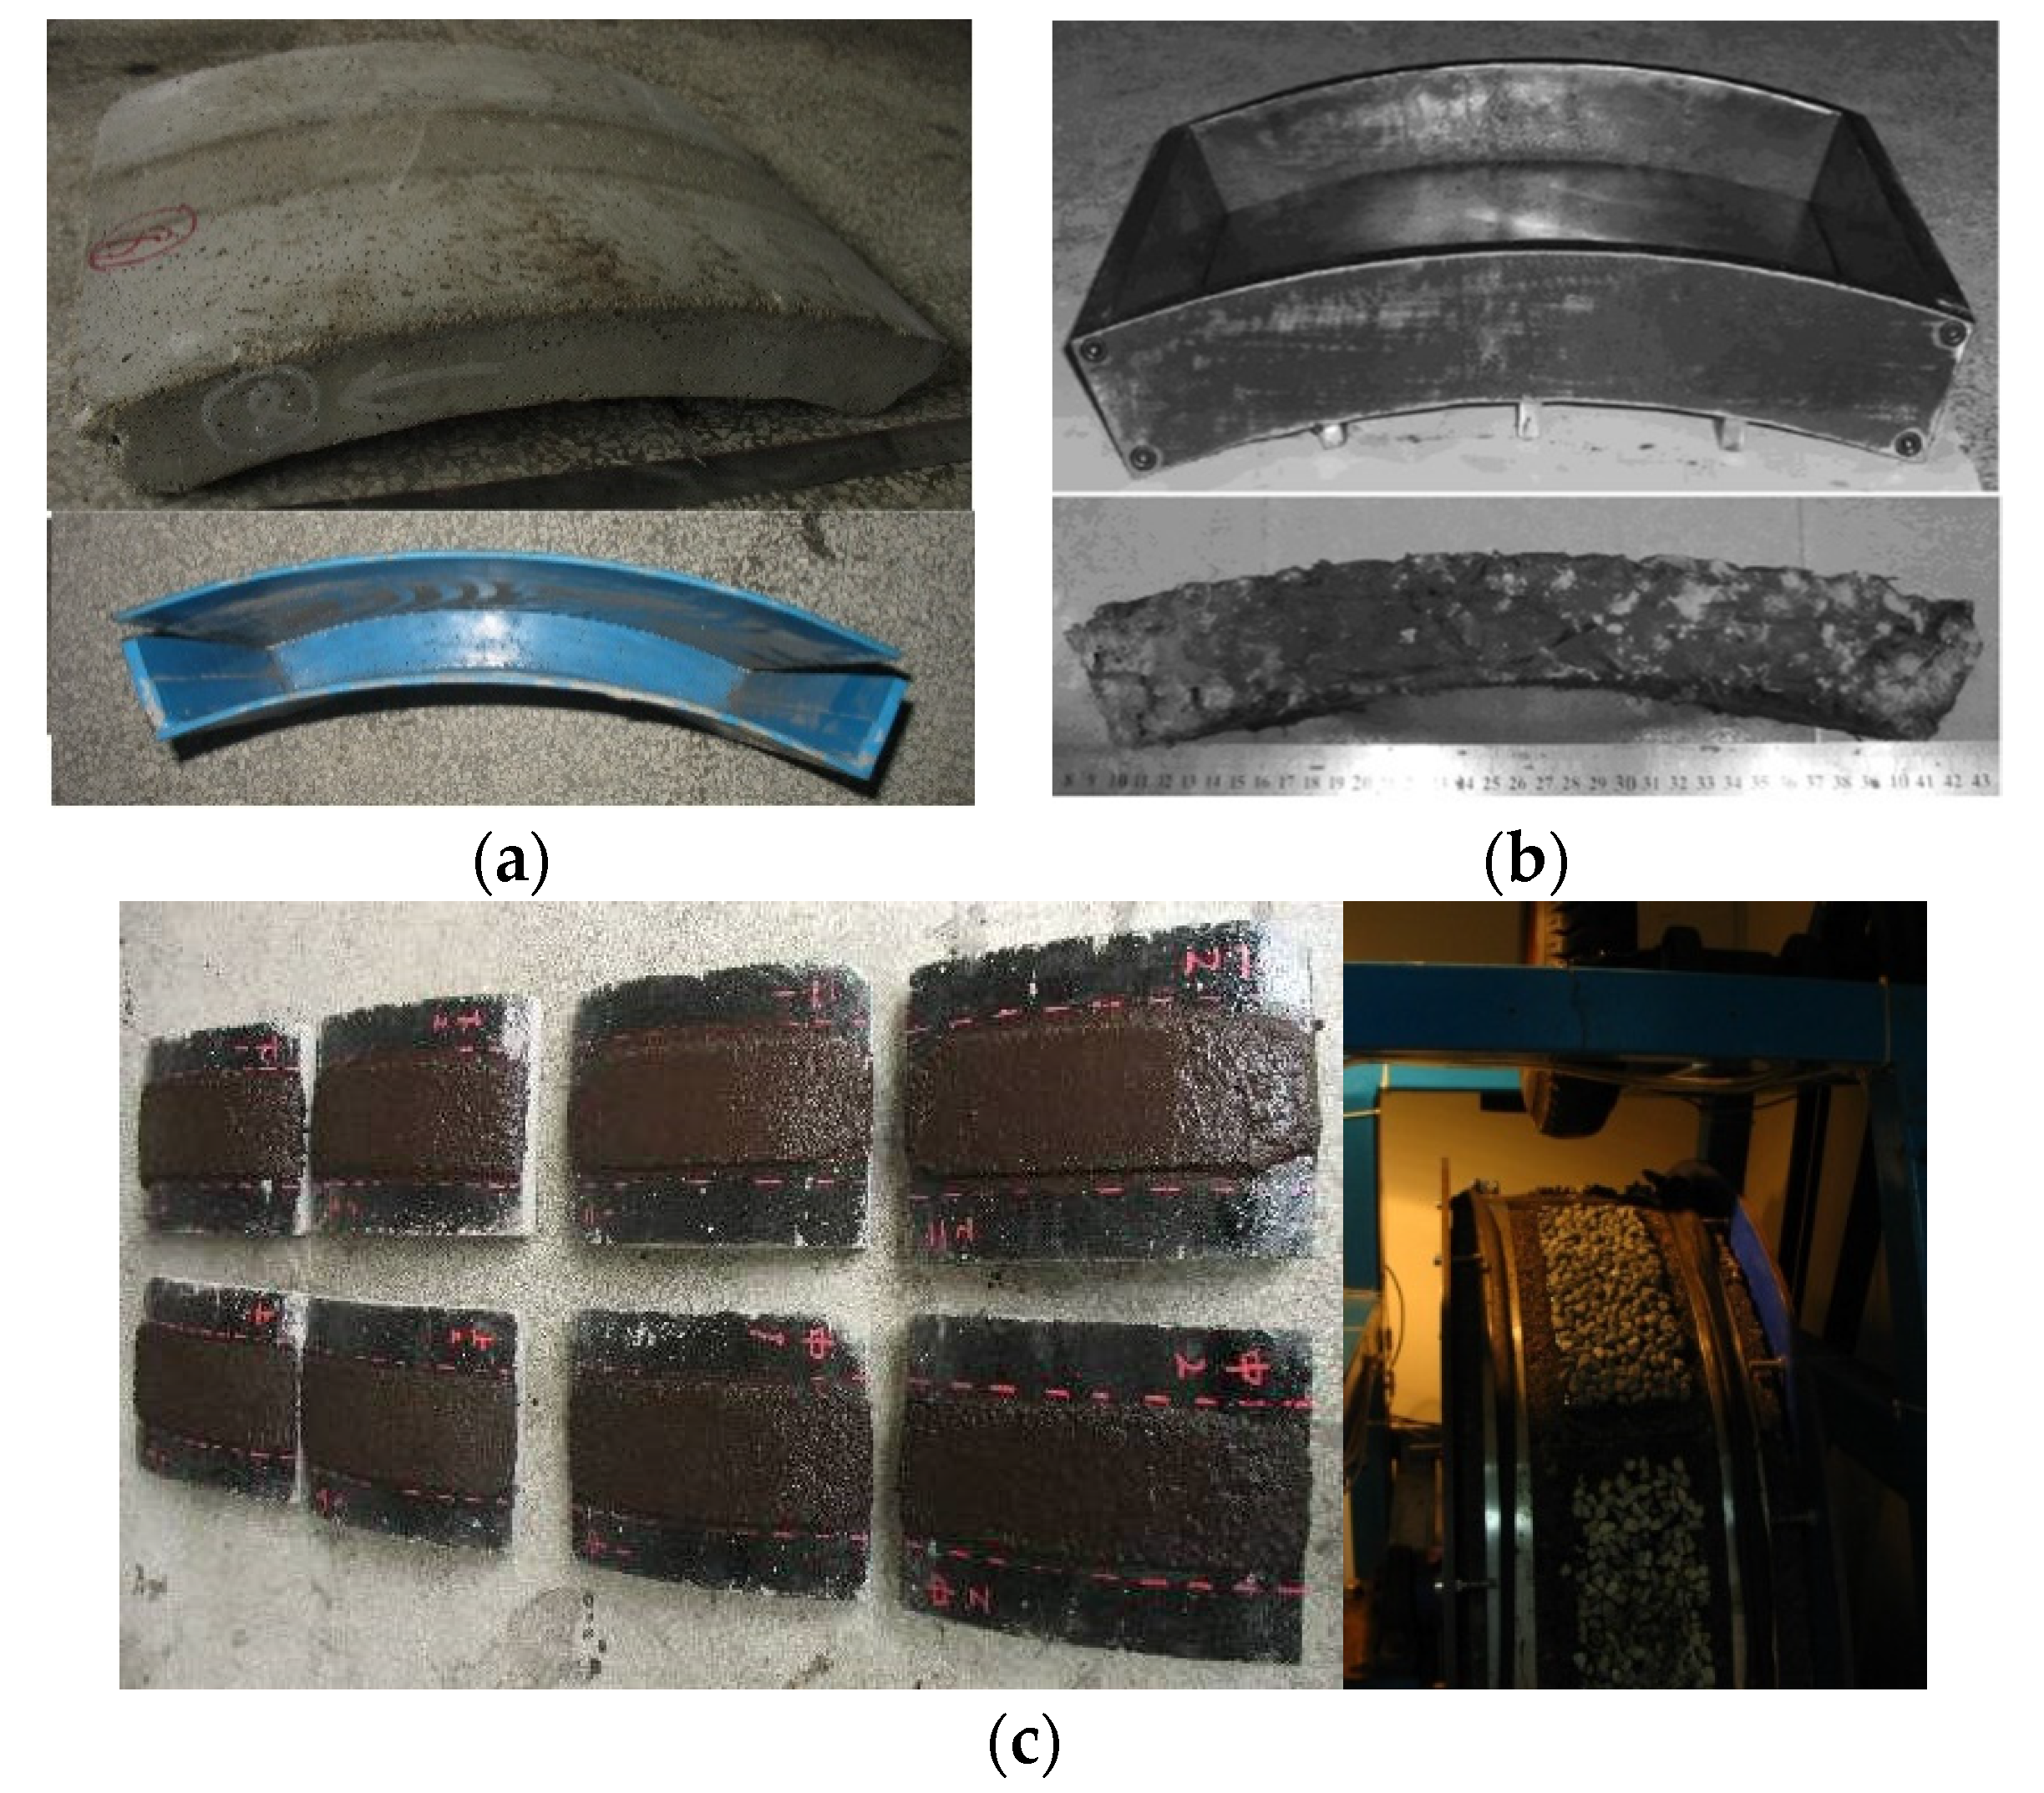
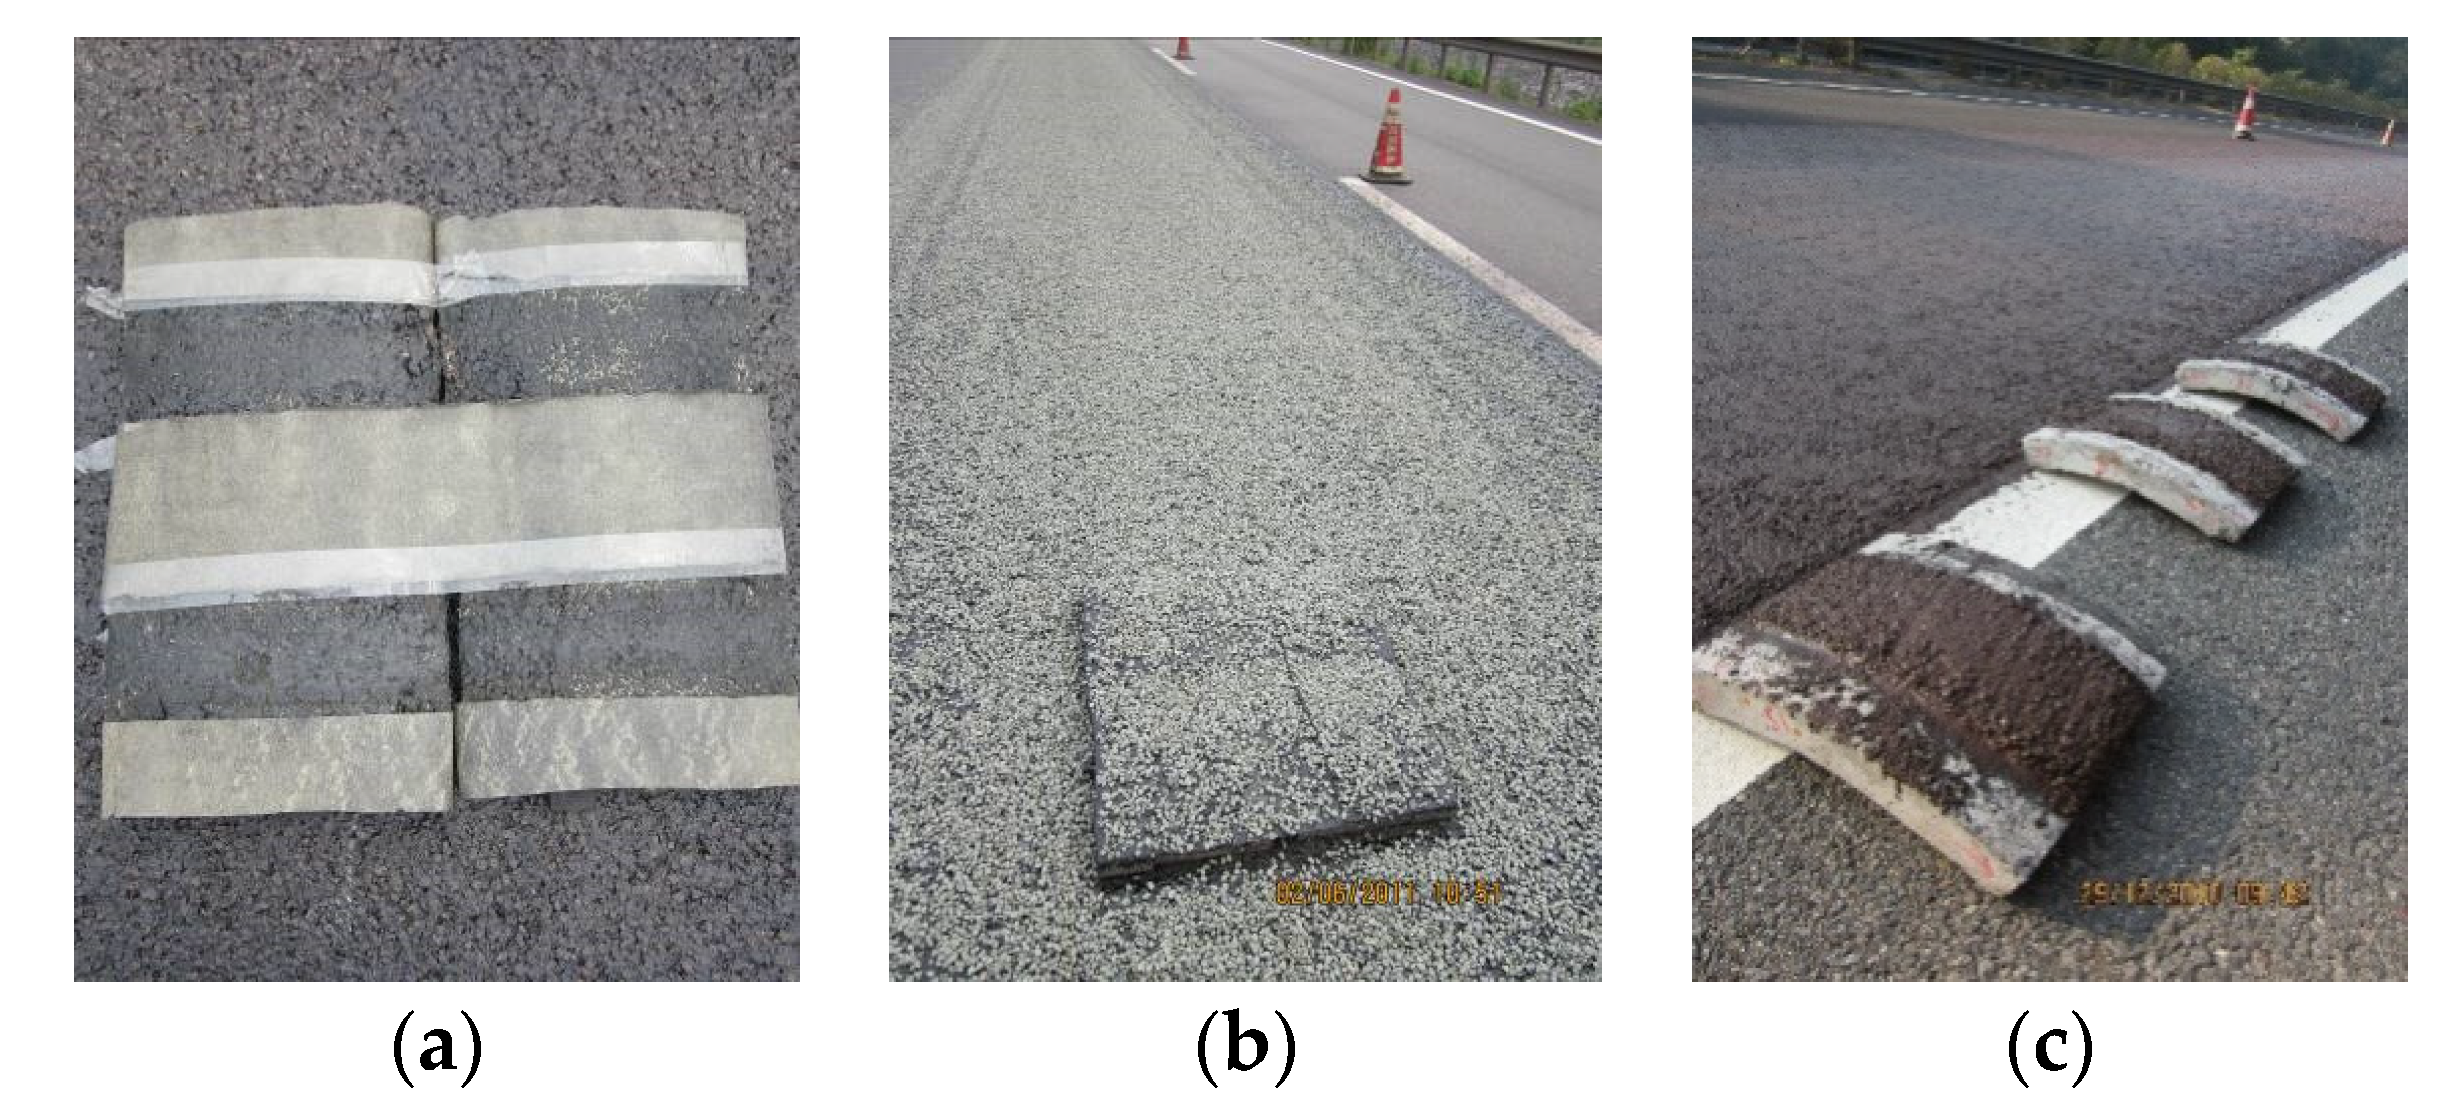
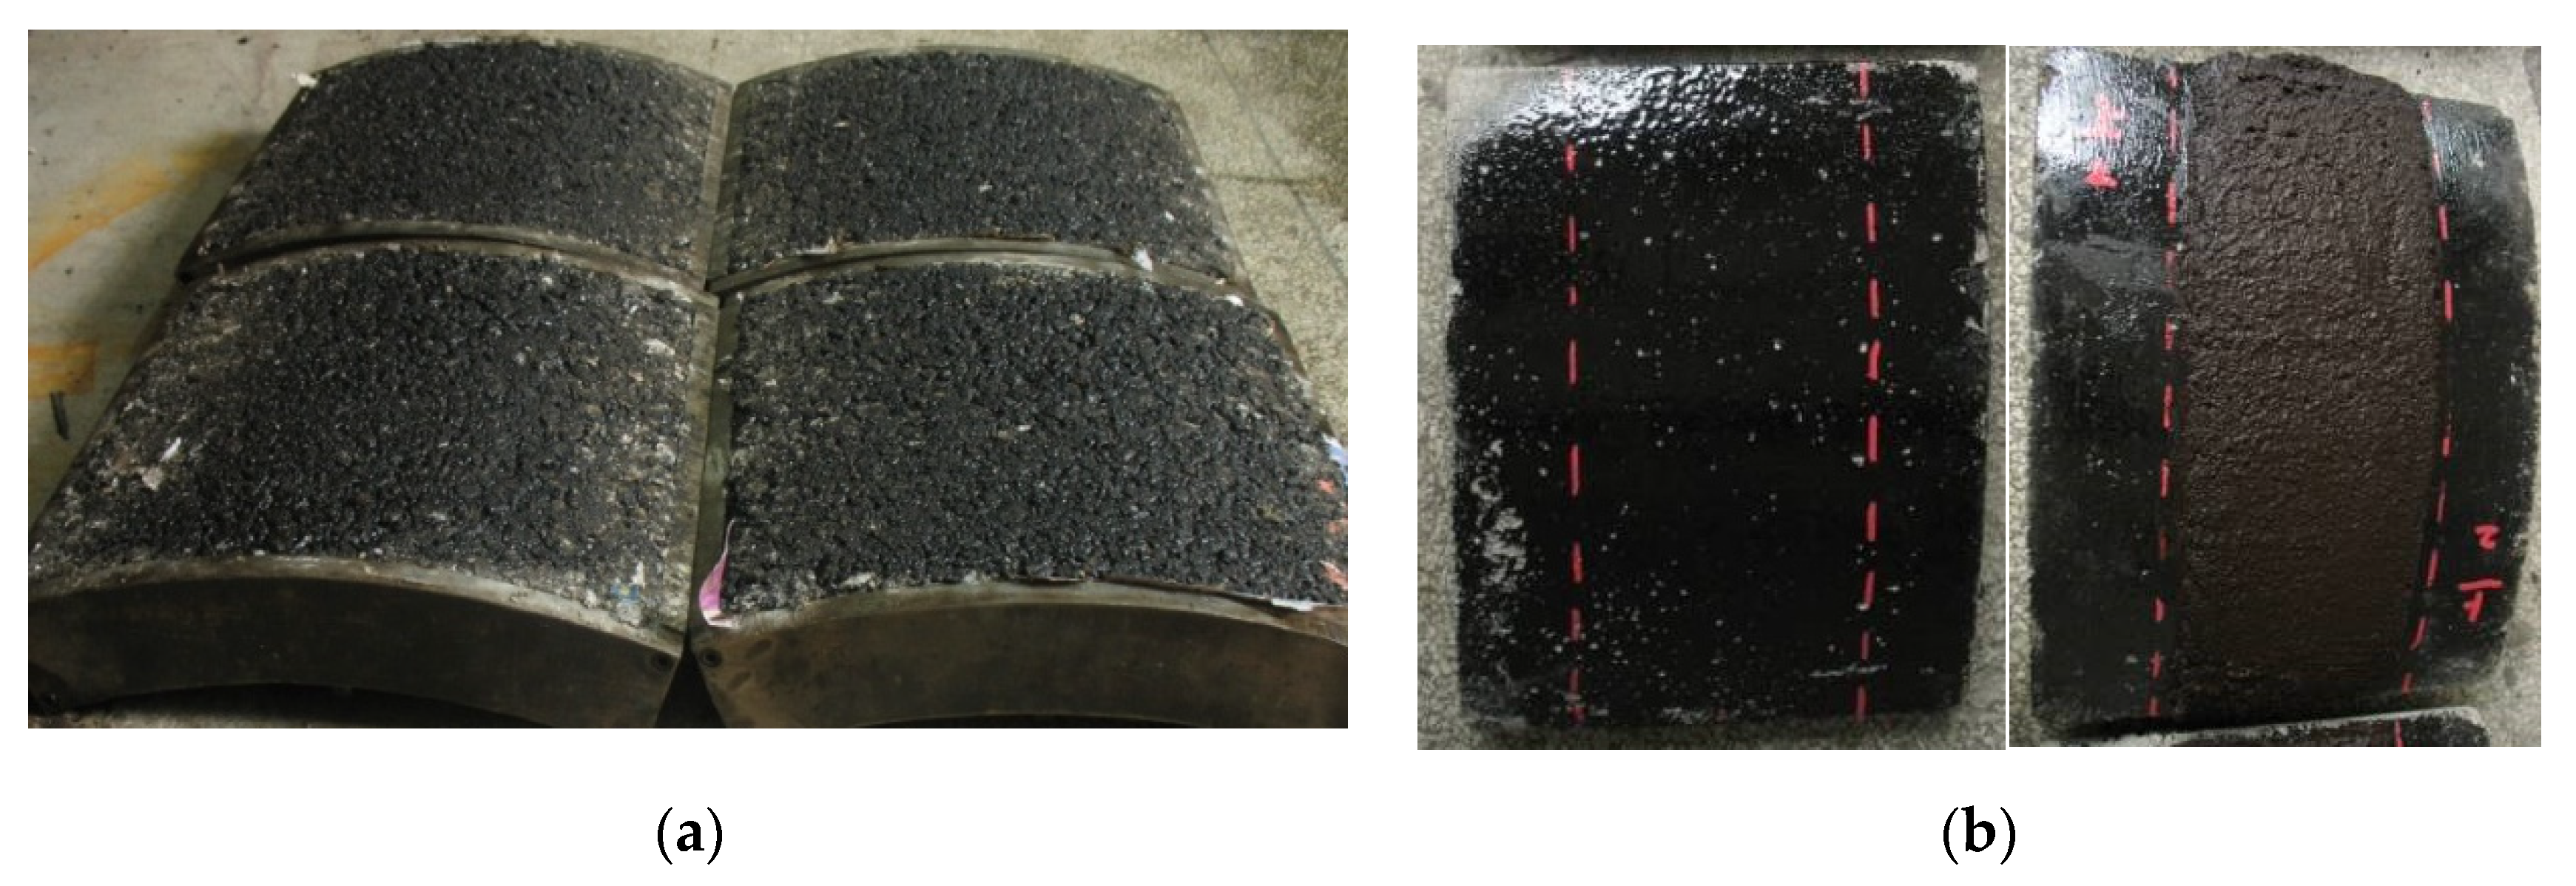
2.1. Specimen and Preparation

The system adopted arc-shaped molds to form the arc-shaped specimens. The outer diameter of the specimen was 1000 mm, and the inner diameter was 900 mm (therefore, the thickness of the specimen was 50 mm). The inner arc length of the specimen was 306 mm and the width was 300 mm. Three types of specimens could be used, including cement concrete specimens, asphalt concrete specimens, and functional layer specimens (Figure 3).
The cement concrete specimens were made of C40 concrete and provided with reinforcing bars to enhance its crack resistance. The cement specimen could be used to study the effect of grooving on the functional performance of the pavement surface. Meanwhile, such a specimen was also an ideal baseboard for the functional surface materials, such as micro-surfacing and chip seal. In this study, the cement specimens were used as the baseboard of the micro-surfacing materials.
Asphalt concrete specimens were molded using a specially designed roller-forming machine with 35 × 2 roll repetitions, as shown in Figure 4. The arc-shaped specimen-forming machine was modified from the existing rutting specimen-forming equipment. According to the radius of the arc specimen, we modified the shape of the rolling head and adjusted the operating distance of the equipment to ensure that every position of the specimen was fully compacted. During the forming process, the mixing and compaction temperatures of the asphalt mixture were determined according to the Standard Test Methods of Bitumen and Bituminous Mixtures for Highway Engineering (JTG E20-2011) [35].
The functional layer specimens were prepared either according to the construction process of the functional layer or directly on the construction site to evaluate the construction quality via indoor acceleration tests, as shown in Figure 5.

2.2. Data Collection

DWAP is an open-test system, which provides an excellent pavement surface functional acceleration loading platform. Its unique design makes it suitable for the most commonly used pavement surface functional test methods. At present, the available pavement surface functional test methods include the sand-laying method for measuring surface texture depth, the British pendulum number (BPN) test, the water permeability test according to the Field Test Methods of Highway Subgrade and Pavement (JTG 3450-2019) [30], the anti-stripping test [30,32], the rutting test [34], and the close-proximity method (CPX) noise test [36].

3. Materials and Methods

3.1. Materials

In this study, three kinds of hot-mix asphalt mixtures, including AC-13, SMA-13, and OGFC-13 asphalt mixtures, and three kinds of cold-mix micro-surfacing mixtures, including MS-1, MS-2, and MS-3 materials, were selected for the pavement surface functional performance acceleration tests. Styrene-butadiene-styrene (SBS)-modified asphalt was used for the hot-mix asphalt mixture and modified emulsified asphalt was used for the micro-surfacing materials. The technical indexes of the asphalt are shown in Table 2 and Table 3. The gradation of each material is shown in Table 4.

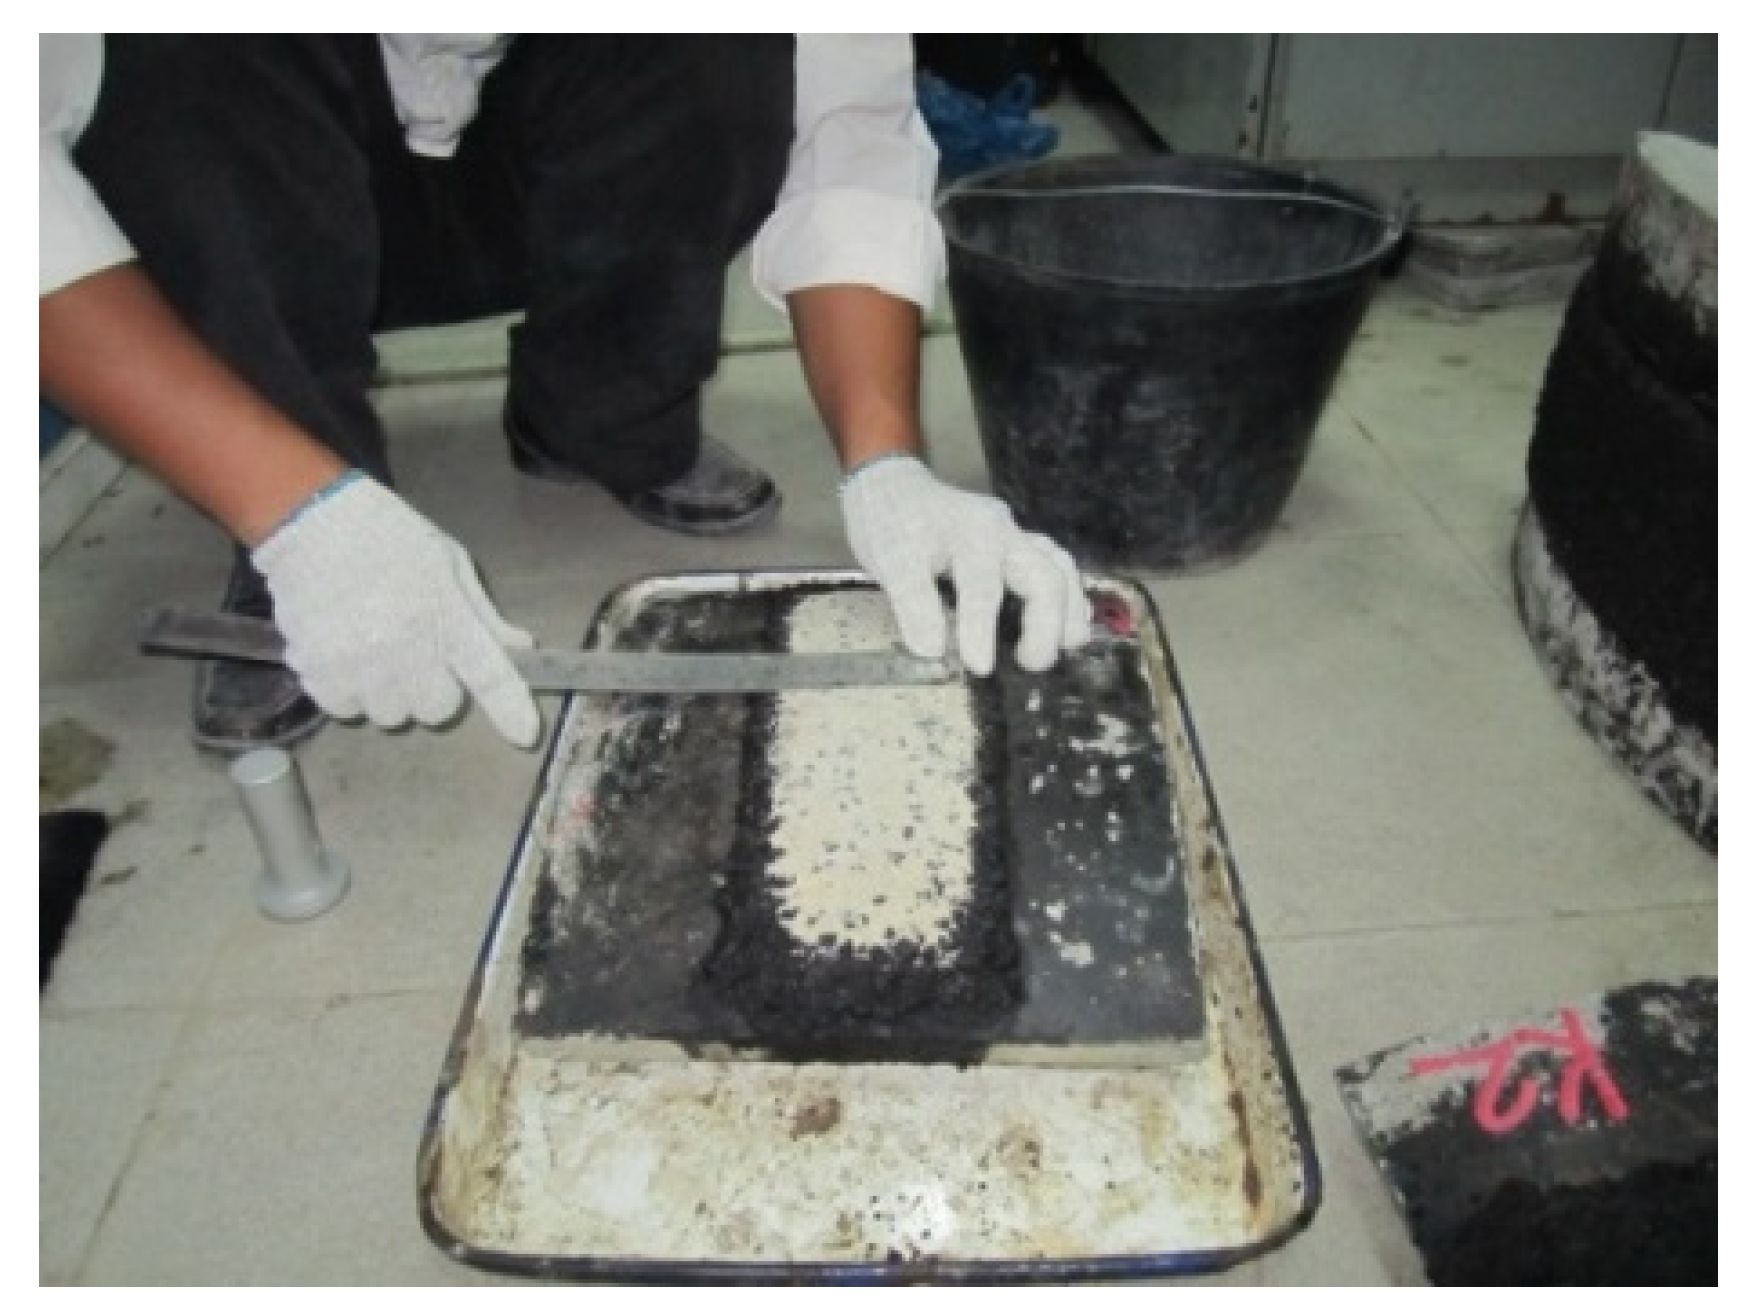
3.2. Specimen Preparation

The arc-shaped specimen of AC-13, SMA-13, and OGFC-13 asphalt mixtures were formed with the arc-shaped specimen-forming machine mentioned above, where two specimens for each gradation were fabricated. The cement concrete arc-shaped specimens were taken as the baseboards for the micro-surfacing materials. The MS-1, MS-2, and MS-3 micro-surfacing materials were applied on the surface of the cement baseboards to form micro-surfacing arc-shaped specimens. For each gradation, two micro-surfacing specimens were fabricated. According to the construction process requirements of micro-surfacing, the emulsified asphalt was applied on the specimen surface as a tack coat before the micro-surfacing mixture was applied. The formed specimens are shown in Figure 6. For all materials, two parallel samples were used in this study.

3.3. Acceleration Tests

The temperature of the acceleration test for the pavement surface functional performance was selected according to the average summer temperature of the most recent 5 years in southern China, which was set at 25 °C. The tire inflation pressure was 0.7 MPa and the tire load was 2.5 kN to make sure that the tire–pavement contact pressure was 0.7 MPa. Furthermore, the driving wheel speed was set at 10 km/h to ensure the system was running stably. The weight of each specimen, texture depth, BPN, and tire–pavement noise were measured at 5000, 10,000, 30,000, 50,000, and 70,000 repetitions.

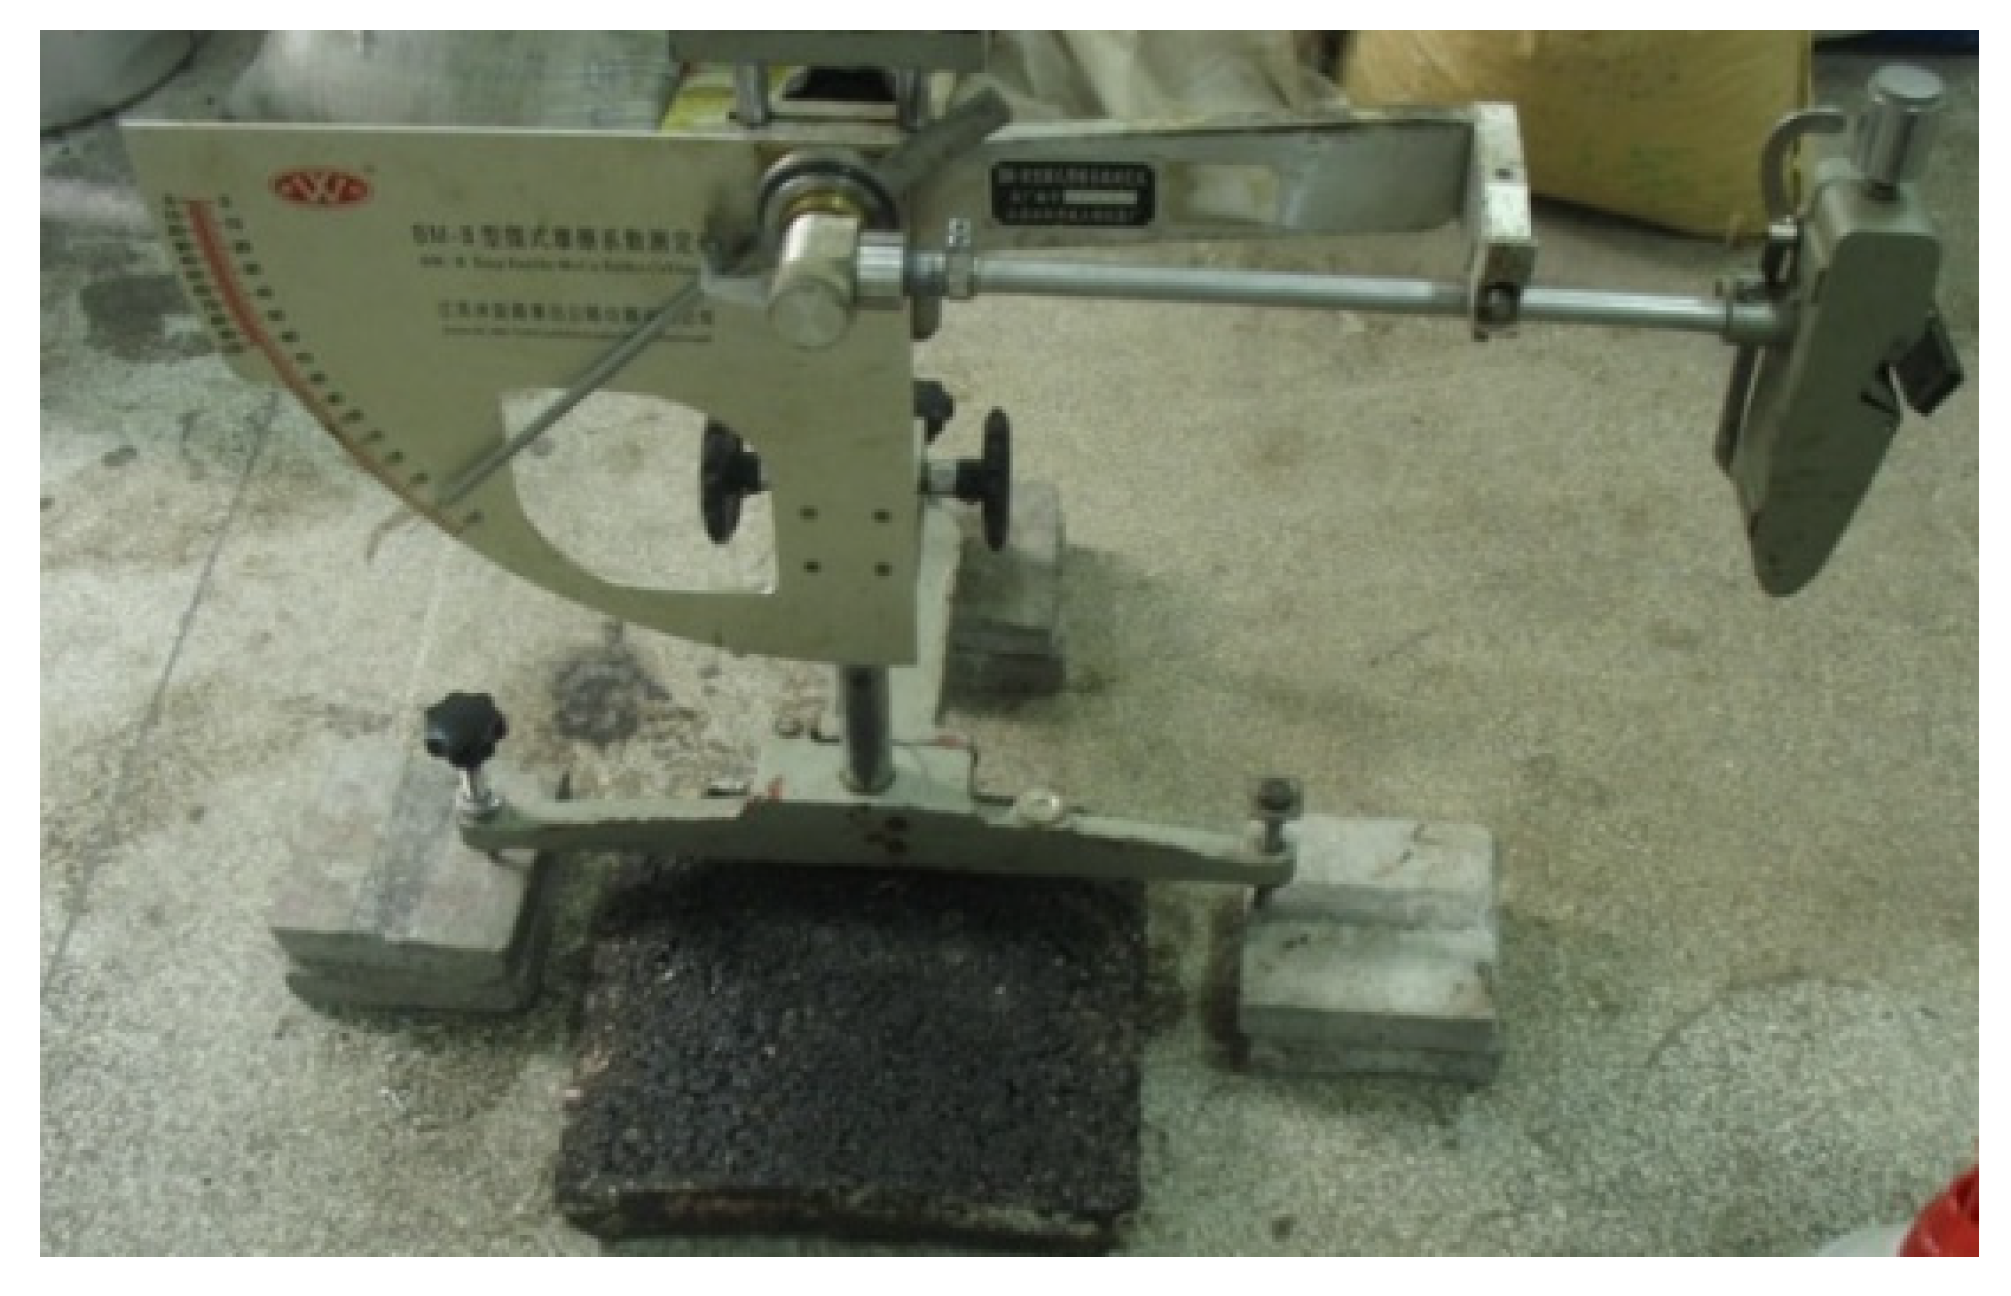
3.3.1. Anti-Sliding Performance Test

The sand-laying method for measuring the texture depth and the BPN test were used to evaluate the anti-sliding performance of the specimens under different repetitions. The texture depth refers to the average depth of the surface irregularities in the macrotexture range on the pavement surface. In the texture depth test, 25 cm3 of standard sand was first spread out on the pavement surface, and then the ratio of the volume of sand to the average covered area was calculated as the pavement texture depth. The sand-laying method [37] for measuring the texture depth of arc-shaped specimens is shown in Figure 7, and three parallel tests were carried out for each specimen.
The BPN test was performed to measure the frictional resistance of the pavement surface under wet conditions with a standard portable pendulum friction coefficient tester. The BPN test for arc-shaped specimens is shown in Figure 8, and five parallel tests were carried out for each specimen.
Considering the influence of the specimen shape on the test results, we determined a friction length of 76 mm by referring to the test method using the polishing value of coarse aggregate recommended by the Test Methods of Aggregate for Highway Engineering (JTG E42-2005) [38]. However, it is important to note that even though the results obtained from these arc specimens could be used to reflect the degradation of performance only, they cannot be taken as the BPN obtained from the same mixtures tested through a regular flat surface.

3.3.2. Anti-Stripping Test

The anti-stripping test is not a standard test, and this test was developed for the functional layer specimen [30,32]. The mass loss of each specimen after different wheel-load repetitions was measured to calculate the mass-loss rate. The mass-loss rate is expressed as the ratio of the mass loss to the initial mass of the micro-surfacing material, and the average loss rate of the two specimens with the same mixtures was taken as the result. This test was used to evaluate the anti-stripping performance of materials, such as fog seal, micro-surface, chip seal, and other ultra-thin layer materials.

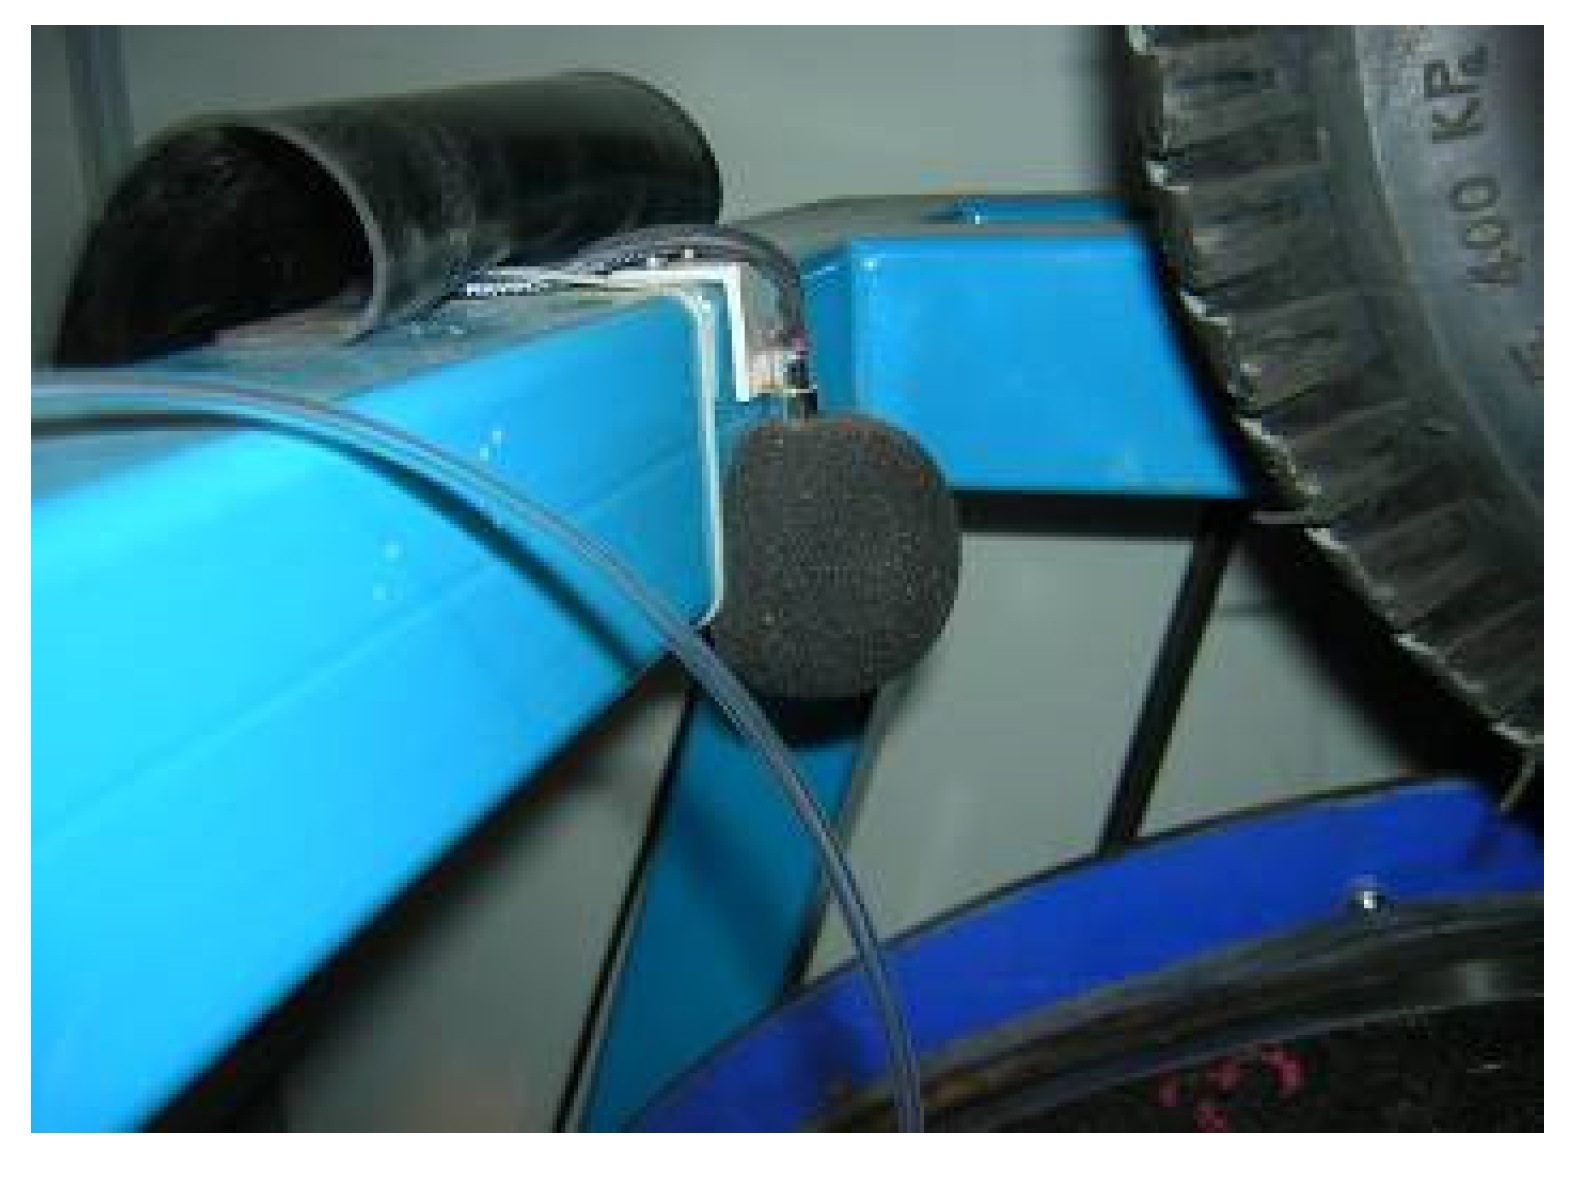
3.3.3. Tire–Pavement Noise Test

Tire–pavement noise is a complex acoustic process involving multiple factors, including noise generation and amplification that predominantly depends on the tire and pavement characteristics [39,40,41]. To use the DWPA to measure the tire–pavement noise, the operating speed of the driving wheel was set to a maximum of 60 km/h. Two microphones were used to collect noise; one was connected to a noise meter, which was used to obtain the real-time sound pressure, and the other was connected to a PC through a signal amplifier, which was used for the spectrum analysis of noise signals. Both microphones were located 10 cm vertically and 20 cm horizontally away from the contact point between the driving wheel and the specimen surface (Figure 9). Data collected in three parallel tests were used for each specimen. Furthermore, it is important to know that the noise measured with this equipment is not the same as that measured on the road, but it can be used as a reference for the tire–pavement noise level of materials under the same indoor conditions.

4. Results and Discussion
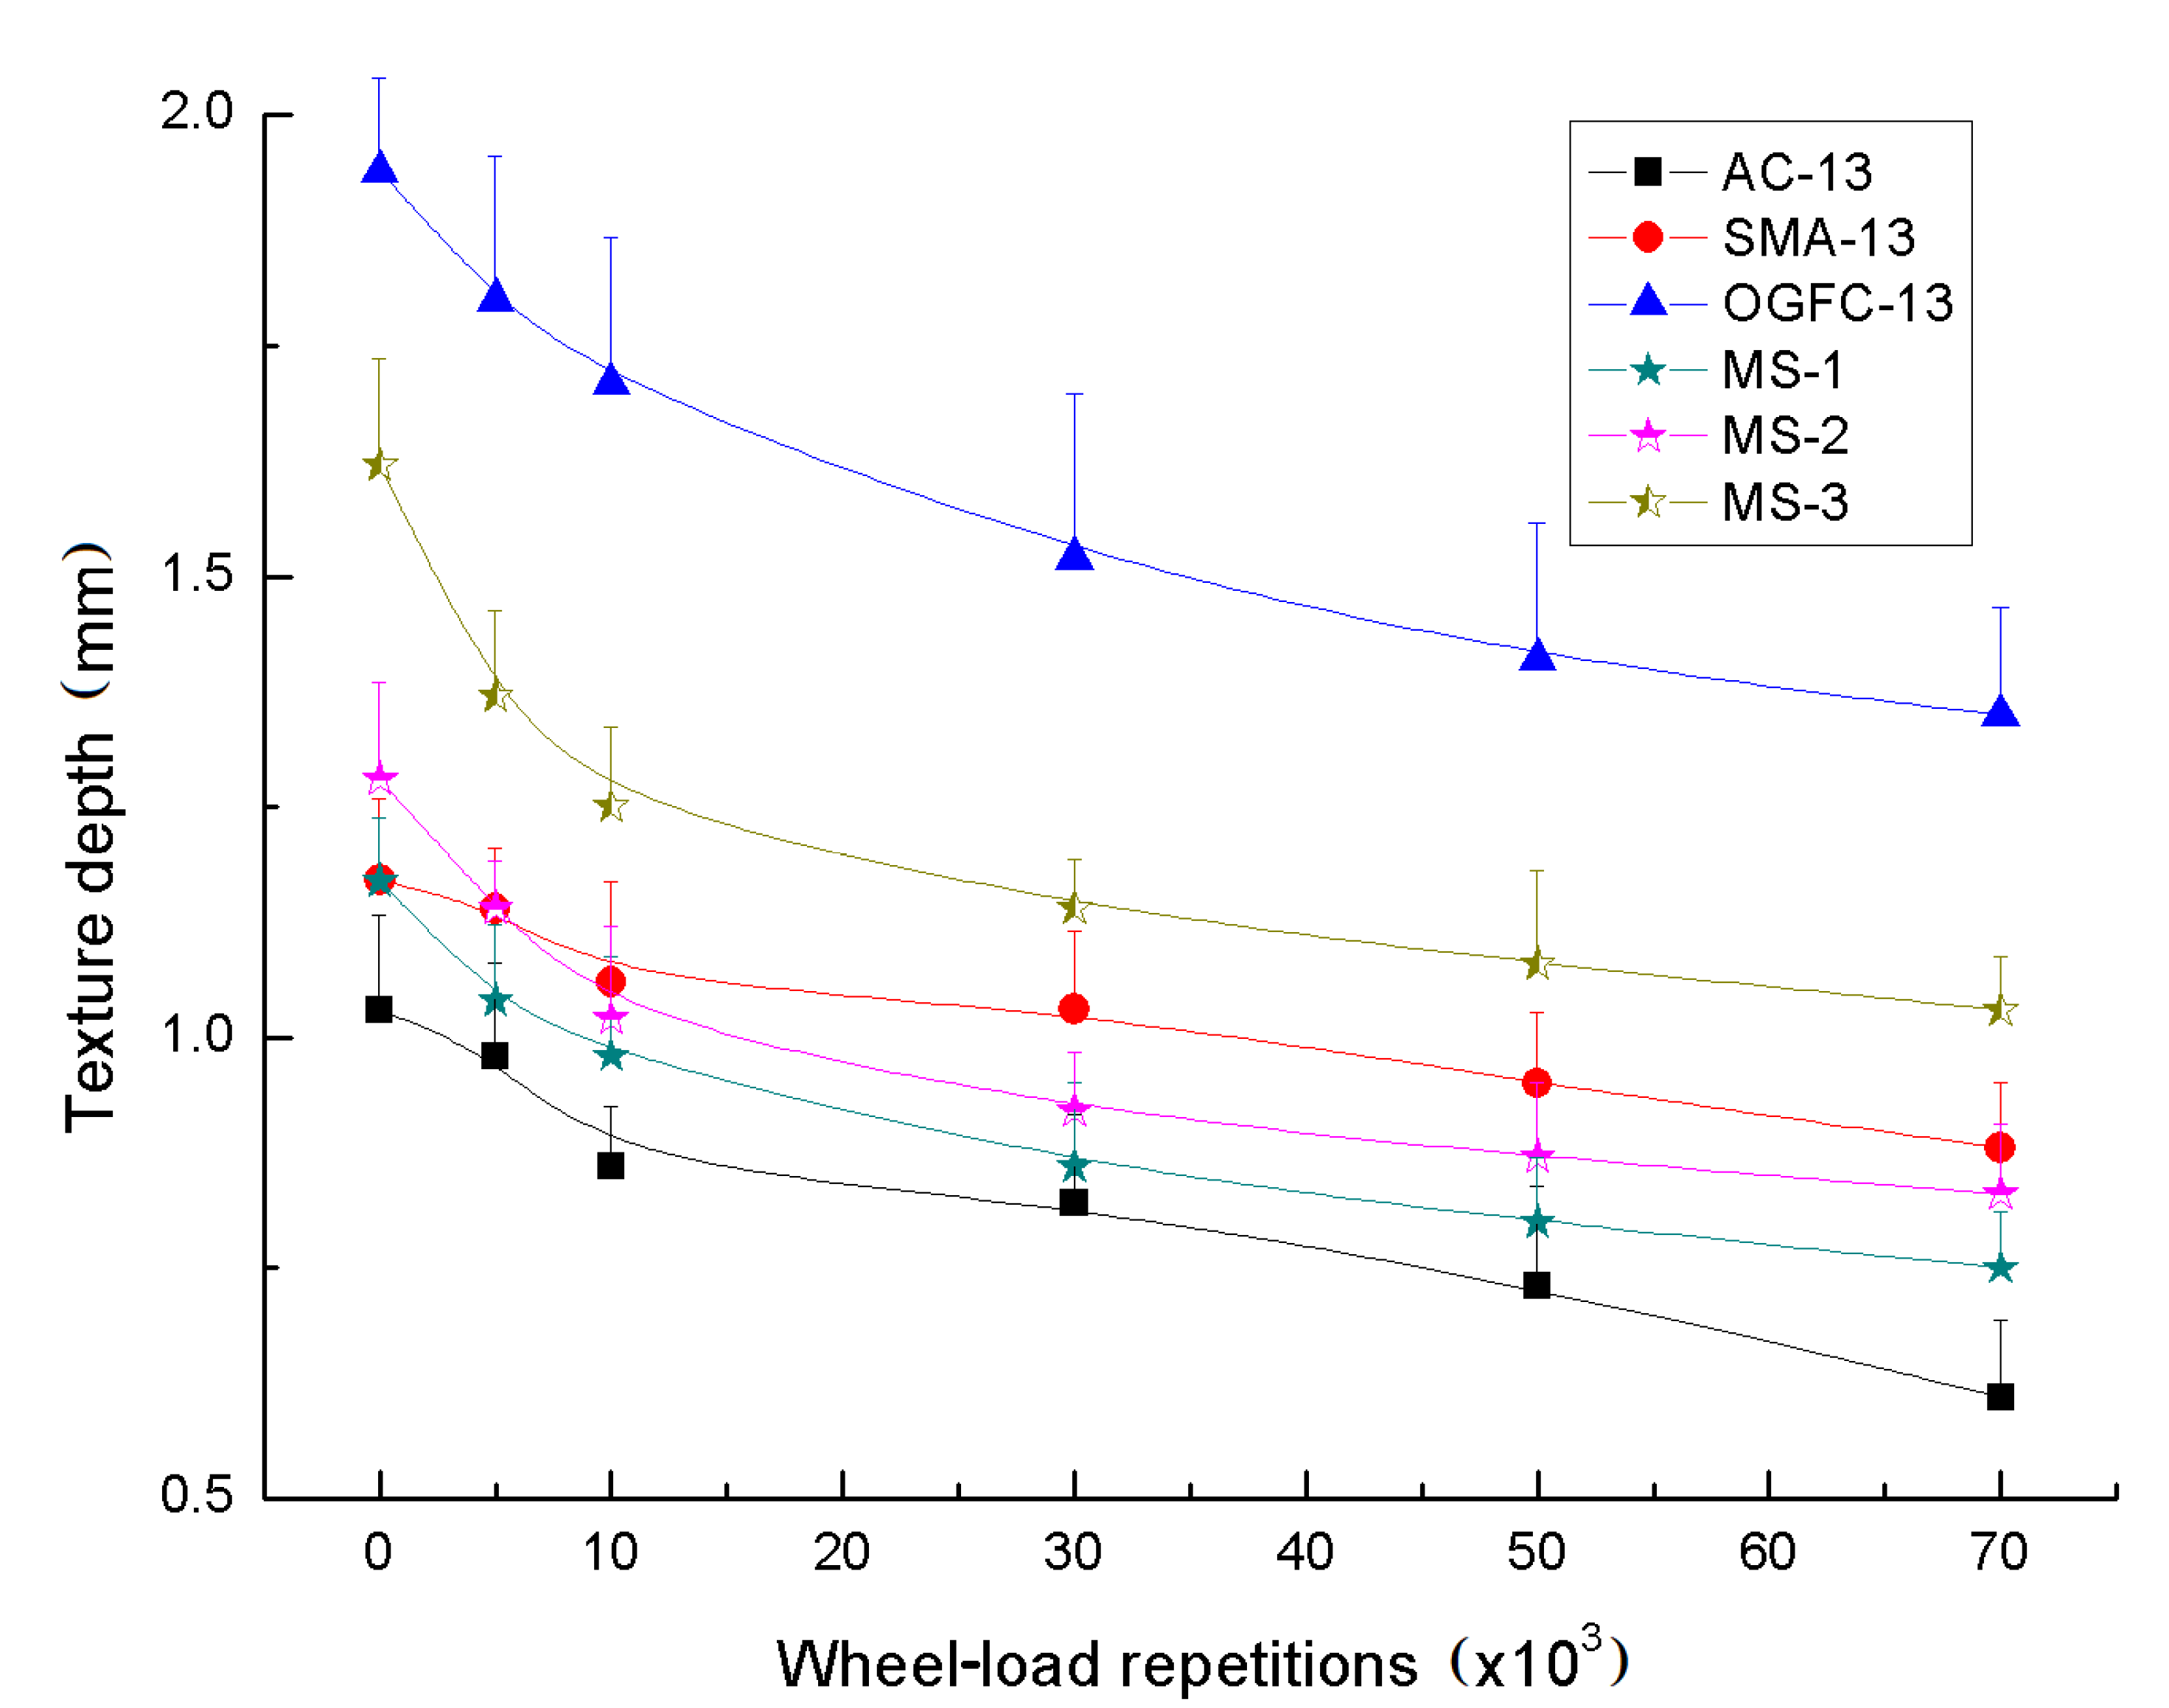
4.1. Texture Depth

At different wheel-load repetitions, the sand-laying method was used to measure the texture depth of the specimen. The wheel track of the specimen was selected as the measurement position. The test results of all six materials are shown in Figure 10.
According to Figure 10, the texture depths of all materials decreased with increasing wheel-load repetitions. In the first 10,000 wheel-load repetitions, the texture depth of the micro-surfacing materials decreased faster than the hot-mix asphalt mixtures. After 10,000 repetitions, the trend of decreasing texture depth became slower. Furthermore, the type of material directly affected the basic characteristics and deterioration of the pavement anti-sliding performance. The OGFC-13 mixture exhibited the largest texture depth, followed by the MS-3 micro-surfacing material, with the AC-13 mixture exhibiting the smallest texture depth. According to the Field Test Methods of Highway Subgrade and Pavement (JTG 3450-2019) [40], when the texture depth was larger than 0.6 mm, the surface was considered to have a good anti-sliding performance. It can be concluded that the micro-surfacing material could better improve the pavement functional performance than the hot-mix asphalt mixtures tested in this study, which boasted a good anti-sliding performance and was able to maintain good texture depth over a long period. Furthermore, the OGFC material performed the best among the three hot-mix asphalt mixtures.

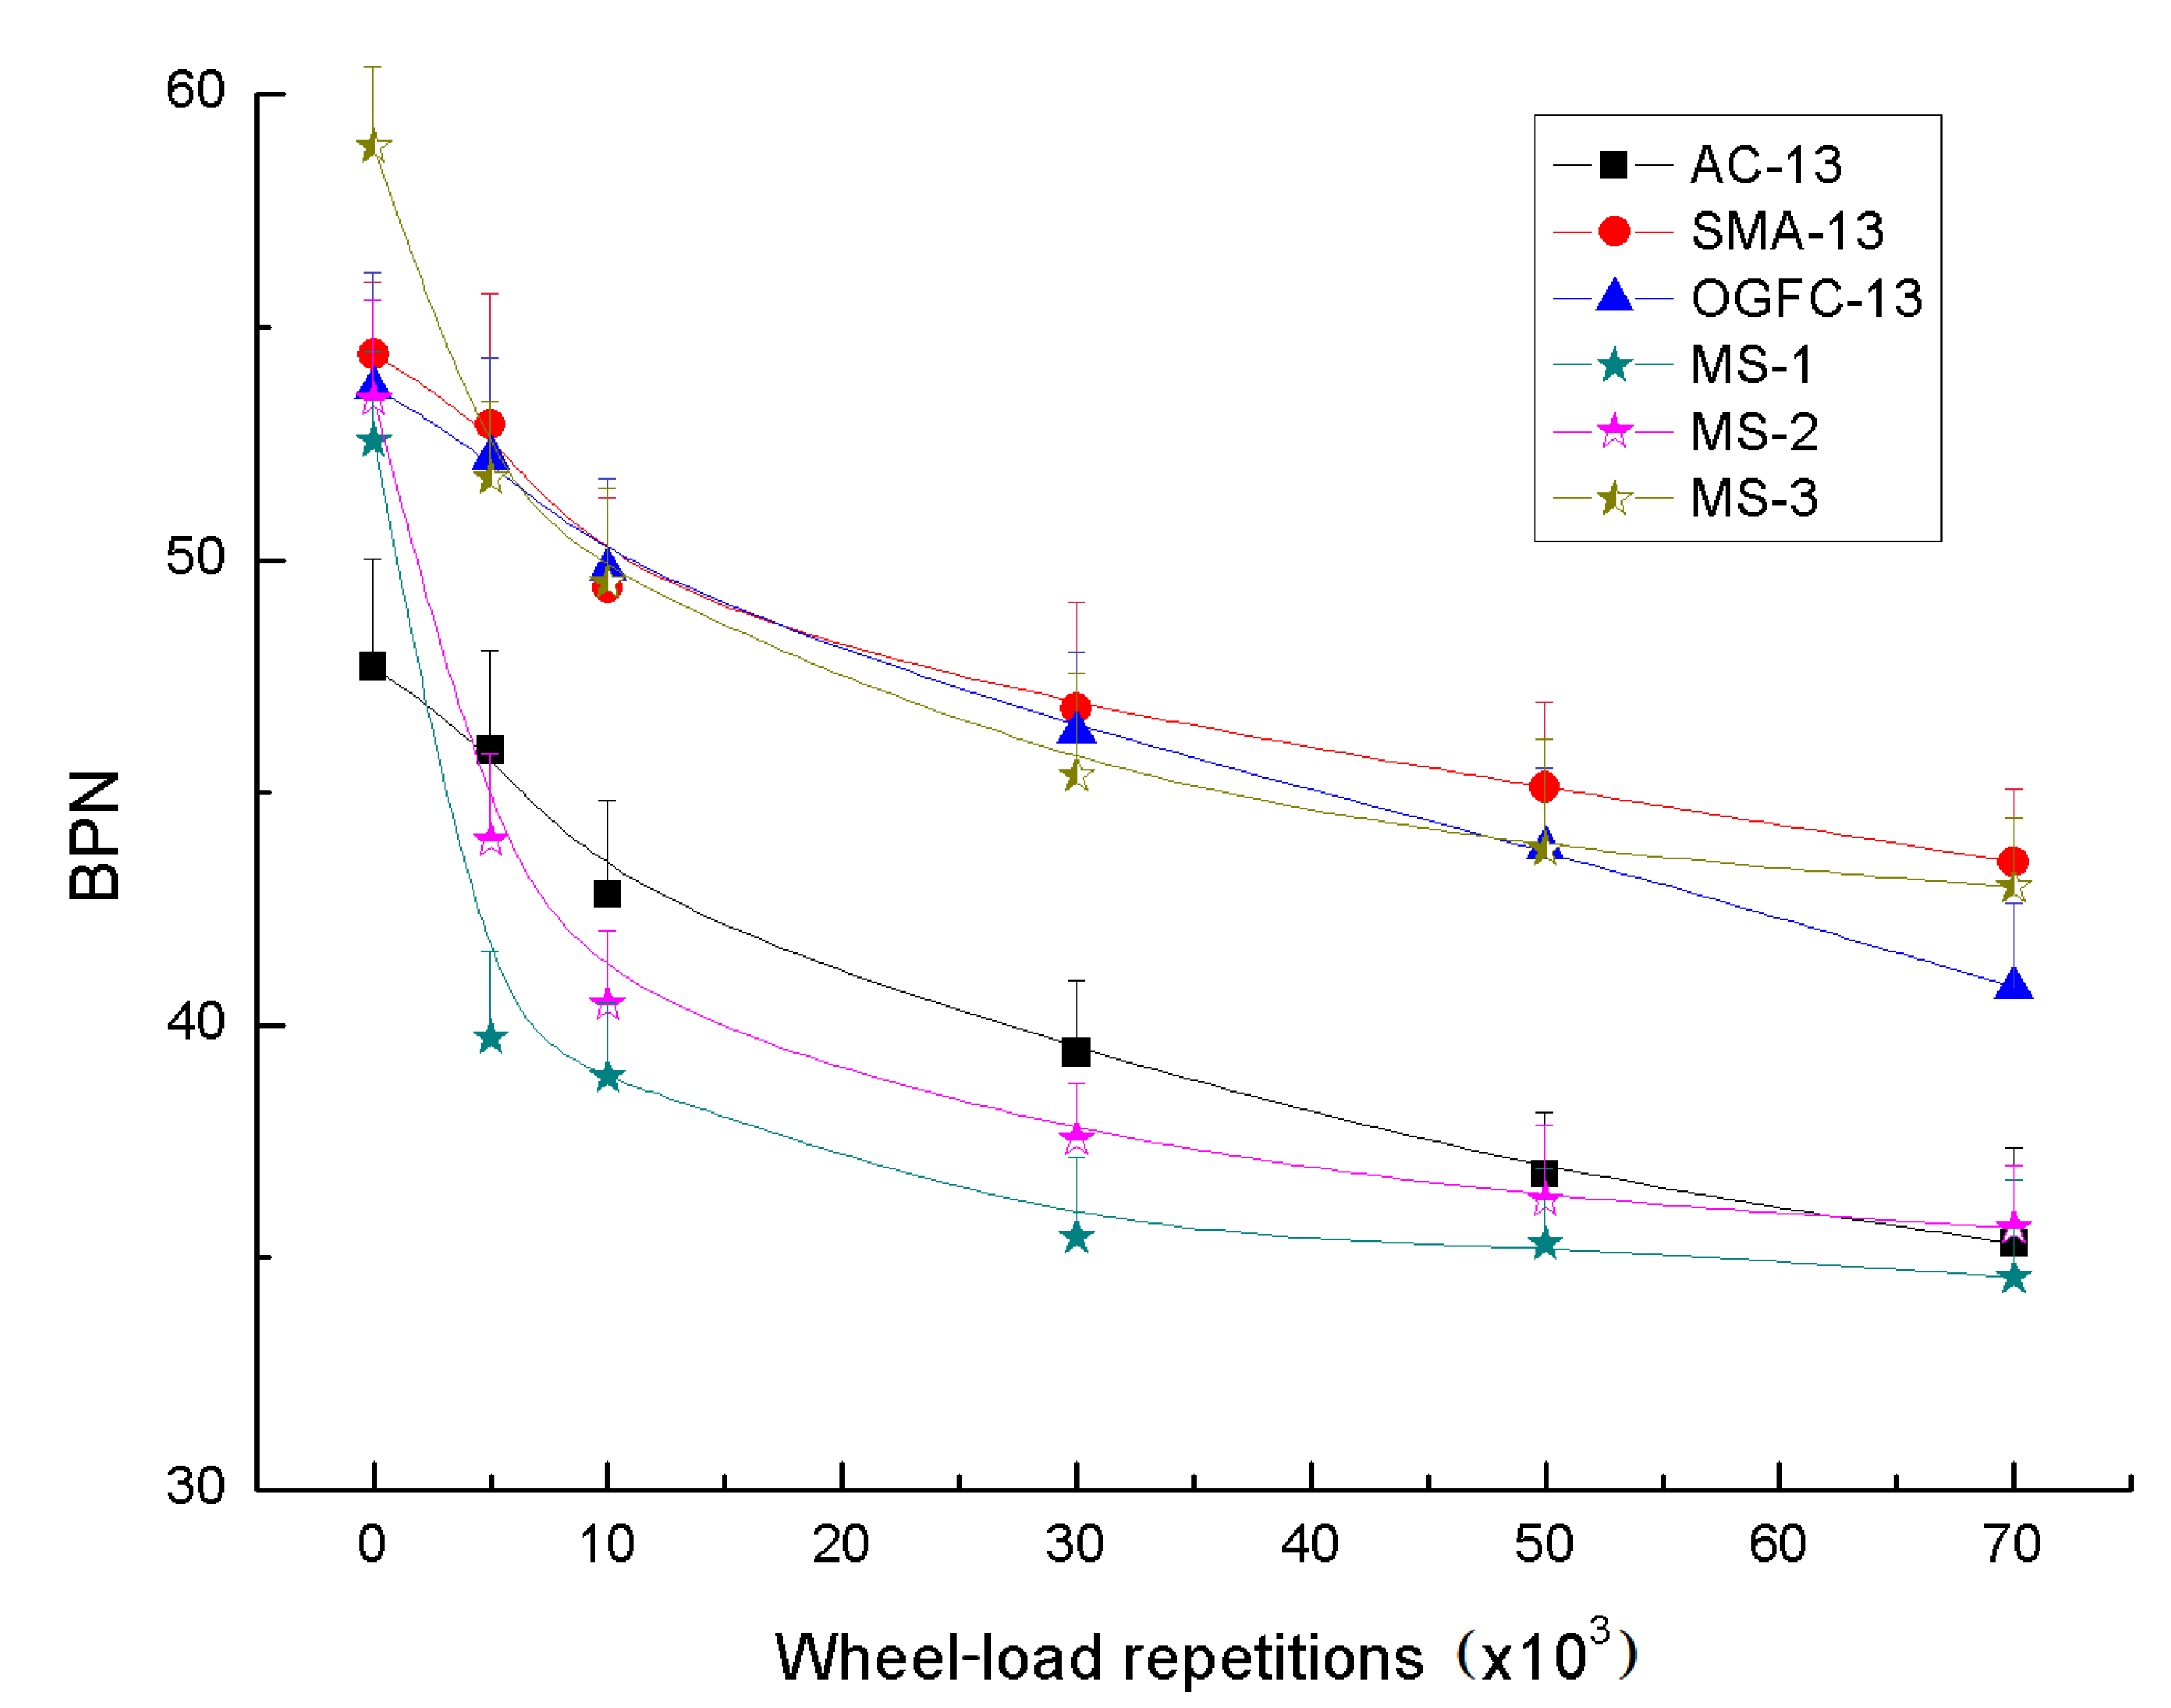
4.2. British Pendulum Number Test

At different wheel-load repetitions, the standard portable pendulum friction coefficient tester was used to measure the BPN of the specimen. The measurement position was the wheel track belt of the specimen. The test results are shown in Figure 11.
According to Figure 11, the BPN of all materials decreased with increasing wheel-load repetitions. In the first 10,000 wheel-load repetitions, the BPN of the micro-surfacing materials decreased faster than the hot-mix asphalt mixtures. After 10,000 repetitions, the decreasing trend became slower, which was consistent with the results of the texture depth. However, the BPN of the hot-mix asphalt mixtures did not show a significant reduction stage, the decreasing trend before and after 10,000 repetitions were nearly the same. Furthermore, at the end of the test, the BPN values of SMA-13 and MS-3 were greater than the OGFC-13 mixture, which was contrary to the result of the texture depth, indicating no direct correlation between texture depth and BPN. According to the Field Test Methods of Highway Subgrade and Pavement (JTG 3450-2019) [40], when the BPN was larger than 37, the surface was evaluated at the fine level, and larger than 42, at the good level. The test results showed that the SMA-13 mixture provided good anti-sliding performance and could be an optimal material for an anti-sliding performance pavement as a structural layer. The BPN results confirmed the good pavement functional performance exhibited by MS-3 micro-surface materials as a thin layer.

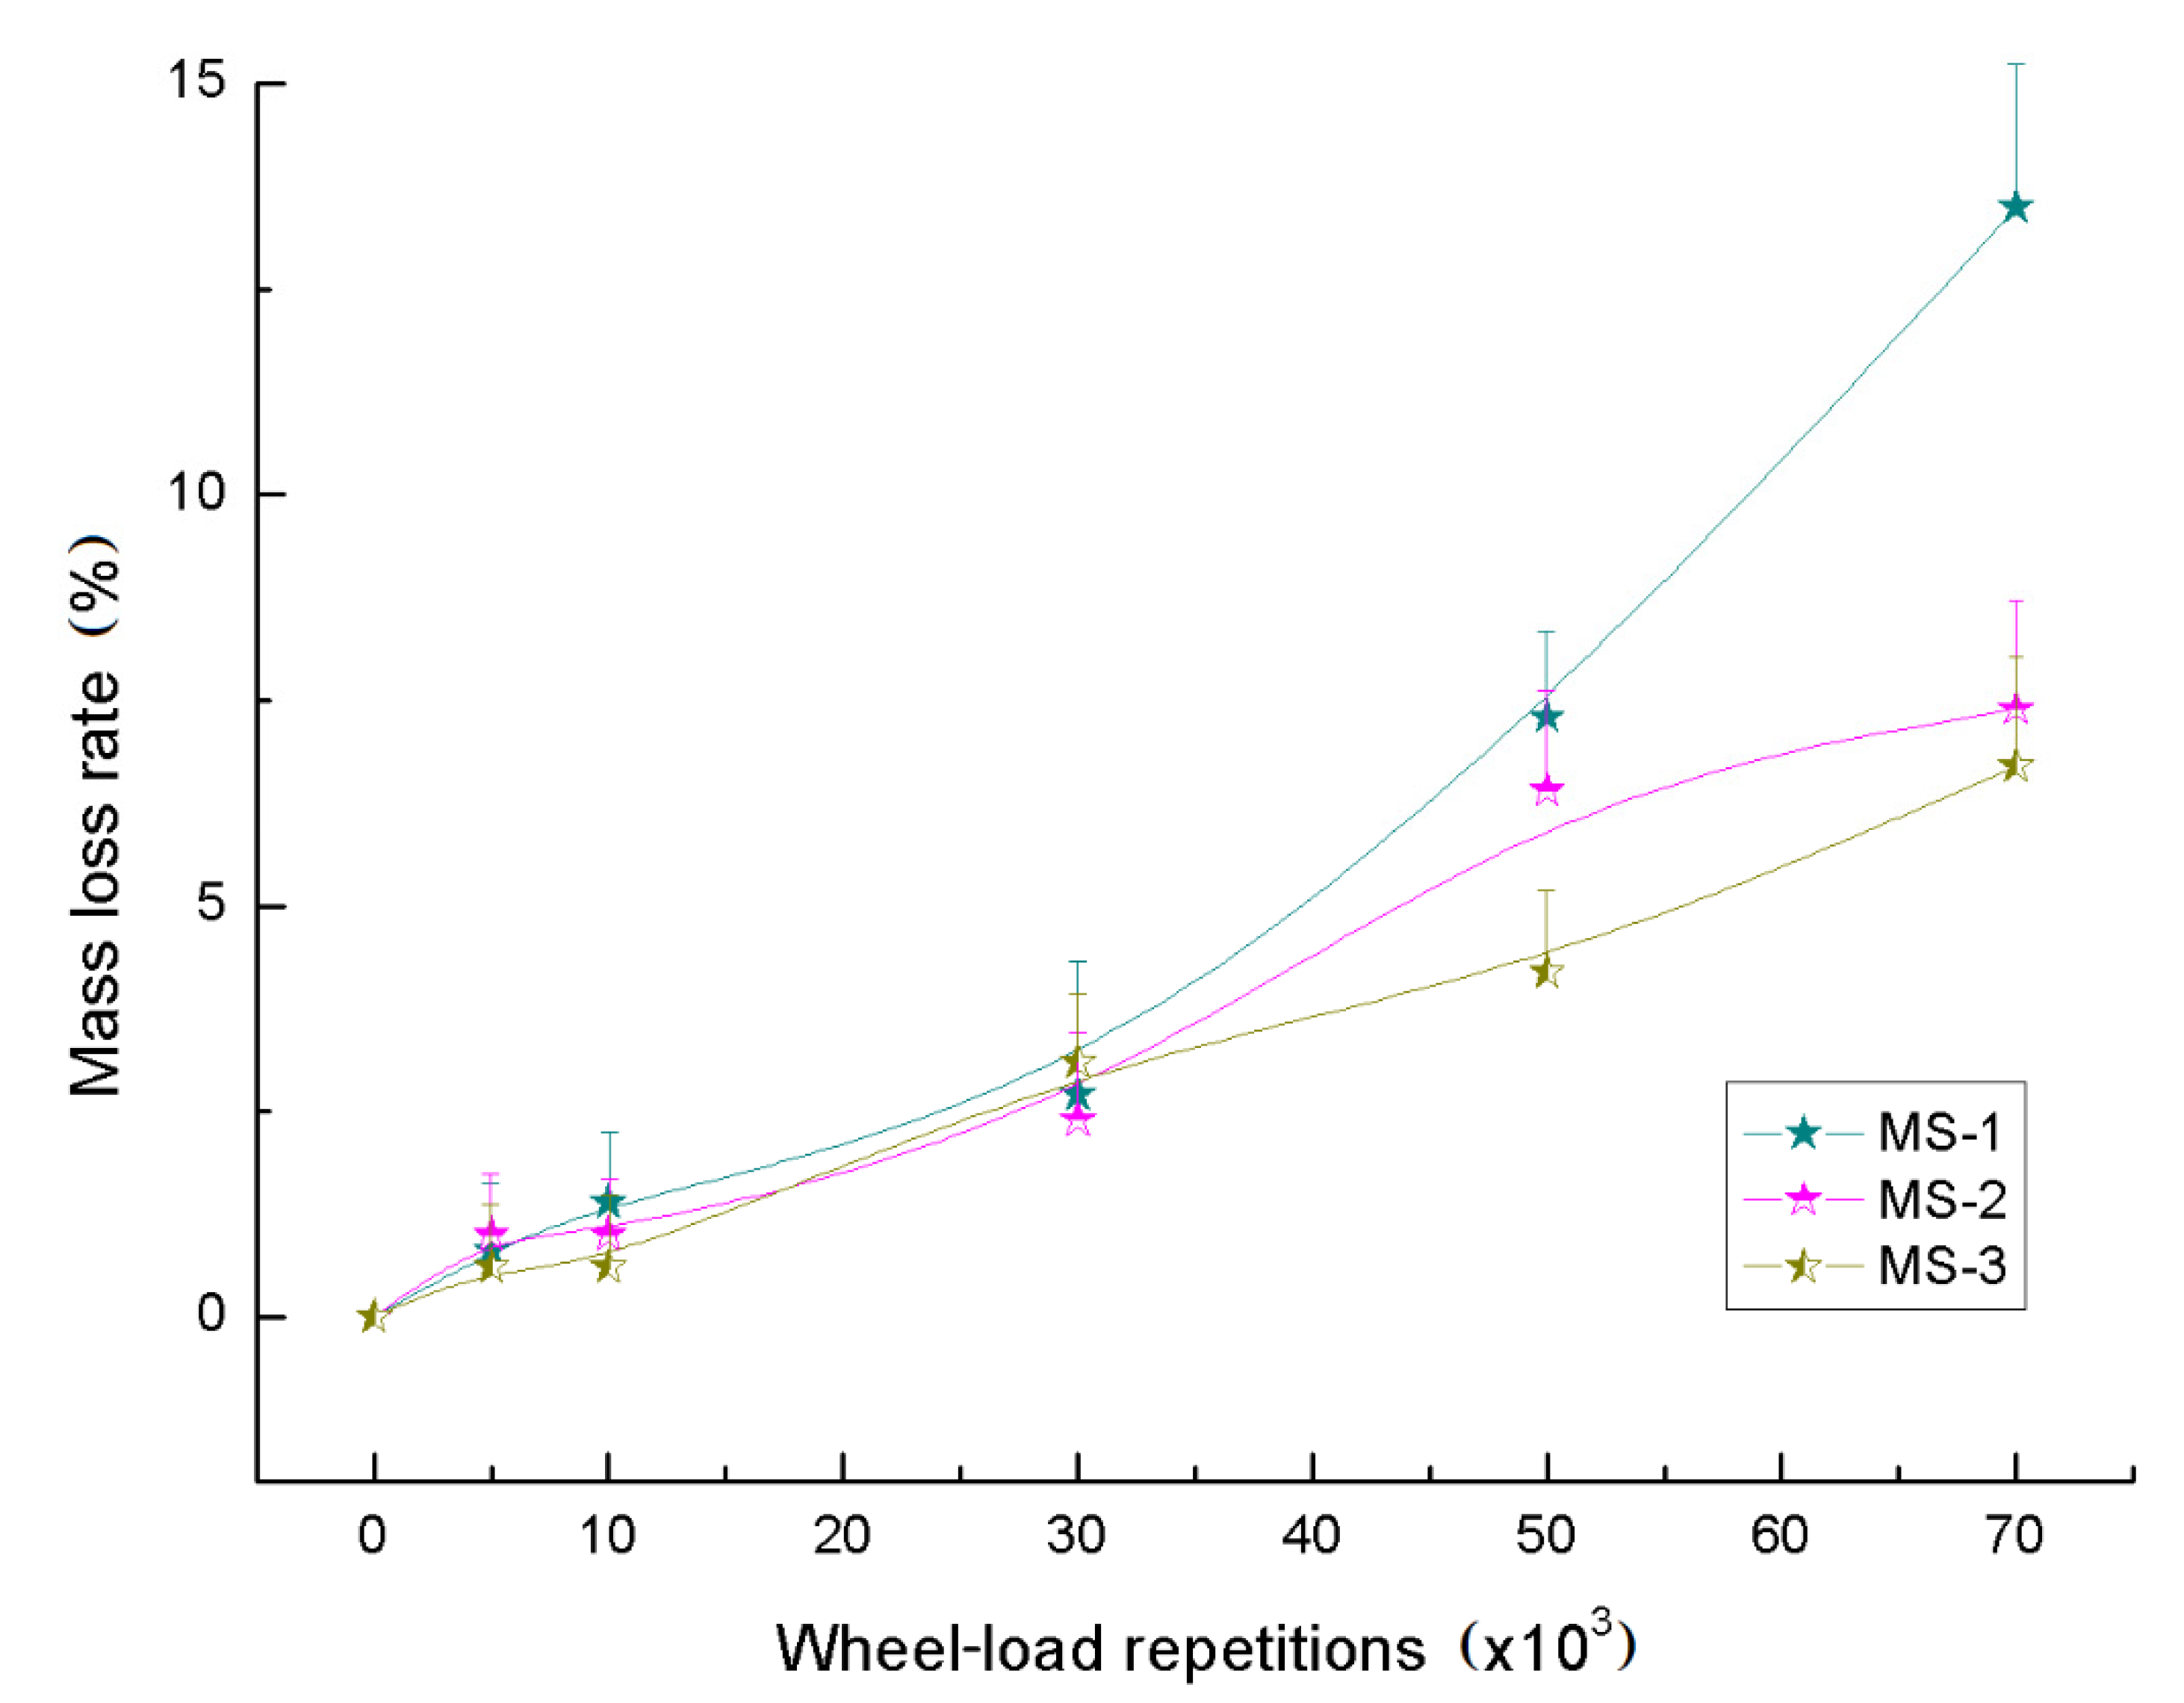
4.3. Anti-Stripping Test

After completing the set number of wheel-load repetitions, the micro-surfacing specimens were weighed and the mass of the micro-surfacing materials was obtained after removing the mass of the baseboards. The test results are shown in Figure 12.
With increasing load repetitions, the micro-surfacing materials were gradually worn down and the spalling mass-loss rate gradually increased. The mass-loss rates for the three micro-surfacing materials were approximately the same (about 2.5%) at 30,000 wheel-load repetitions. When the wheel-load repetitions exceeded 30,000, the gradation determined the mass-loss rate of the micro-surfacing materials. The coarser the gradation, the smaller the mass loss. The mass loss of the MS-1 micro-surfacing material, which had the finest gradation, was the largest, reaching up to 13.5% at 70,000 wheel-load repetitions, whereas that of the MS-3 mixture, which had the coarsest gradation, was only 6.7%. The results show that the gradation had a direct effect on the durability of the micro-surfacing materials and a coarse gradation could improve the anti-stripping properties.

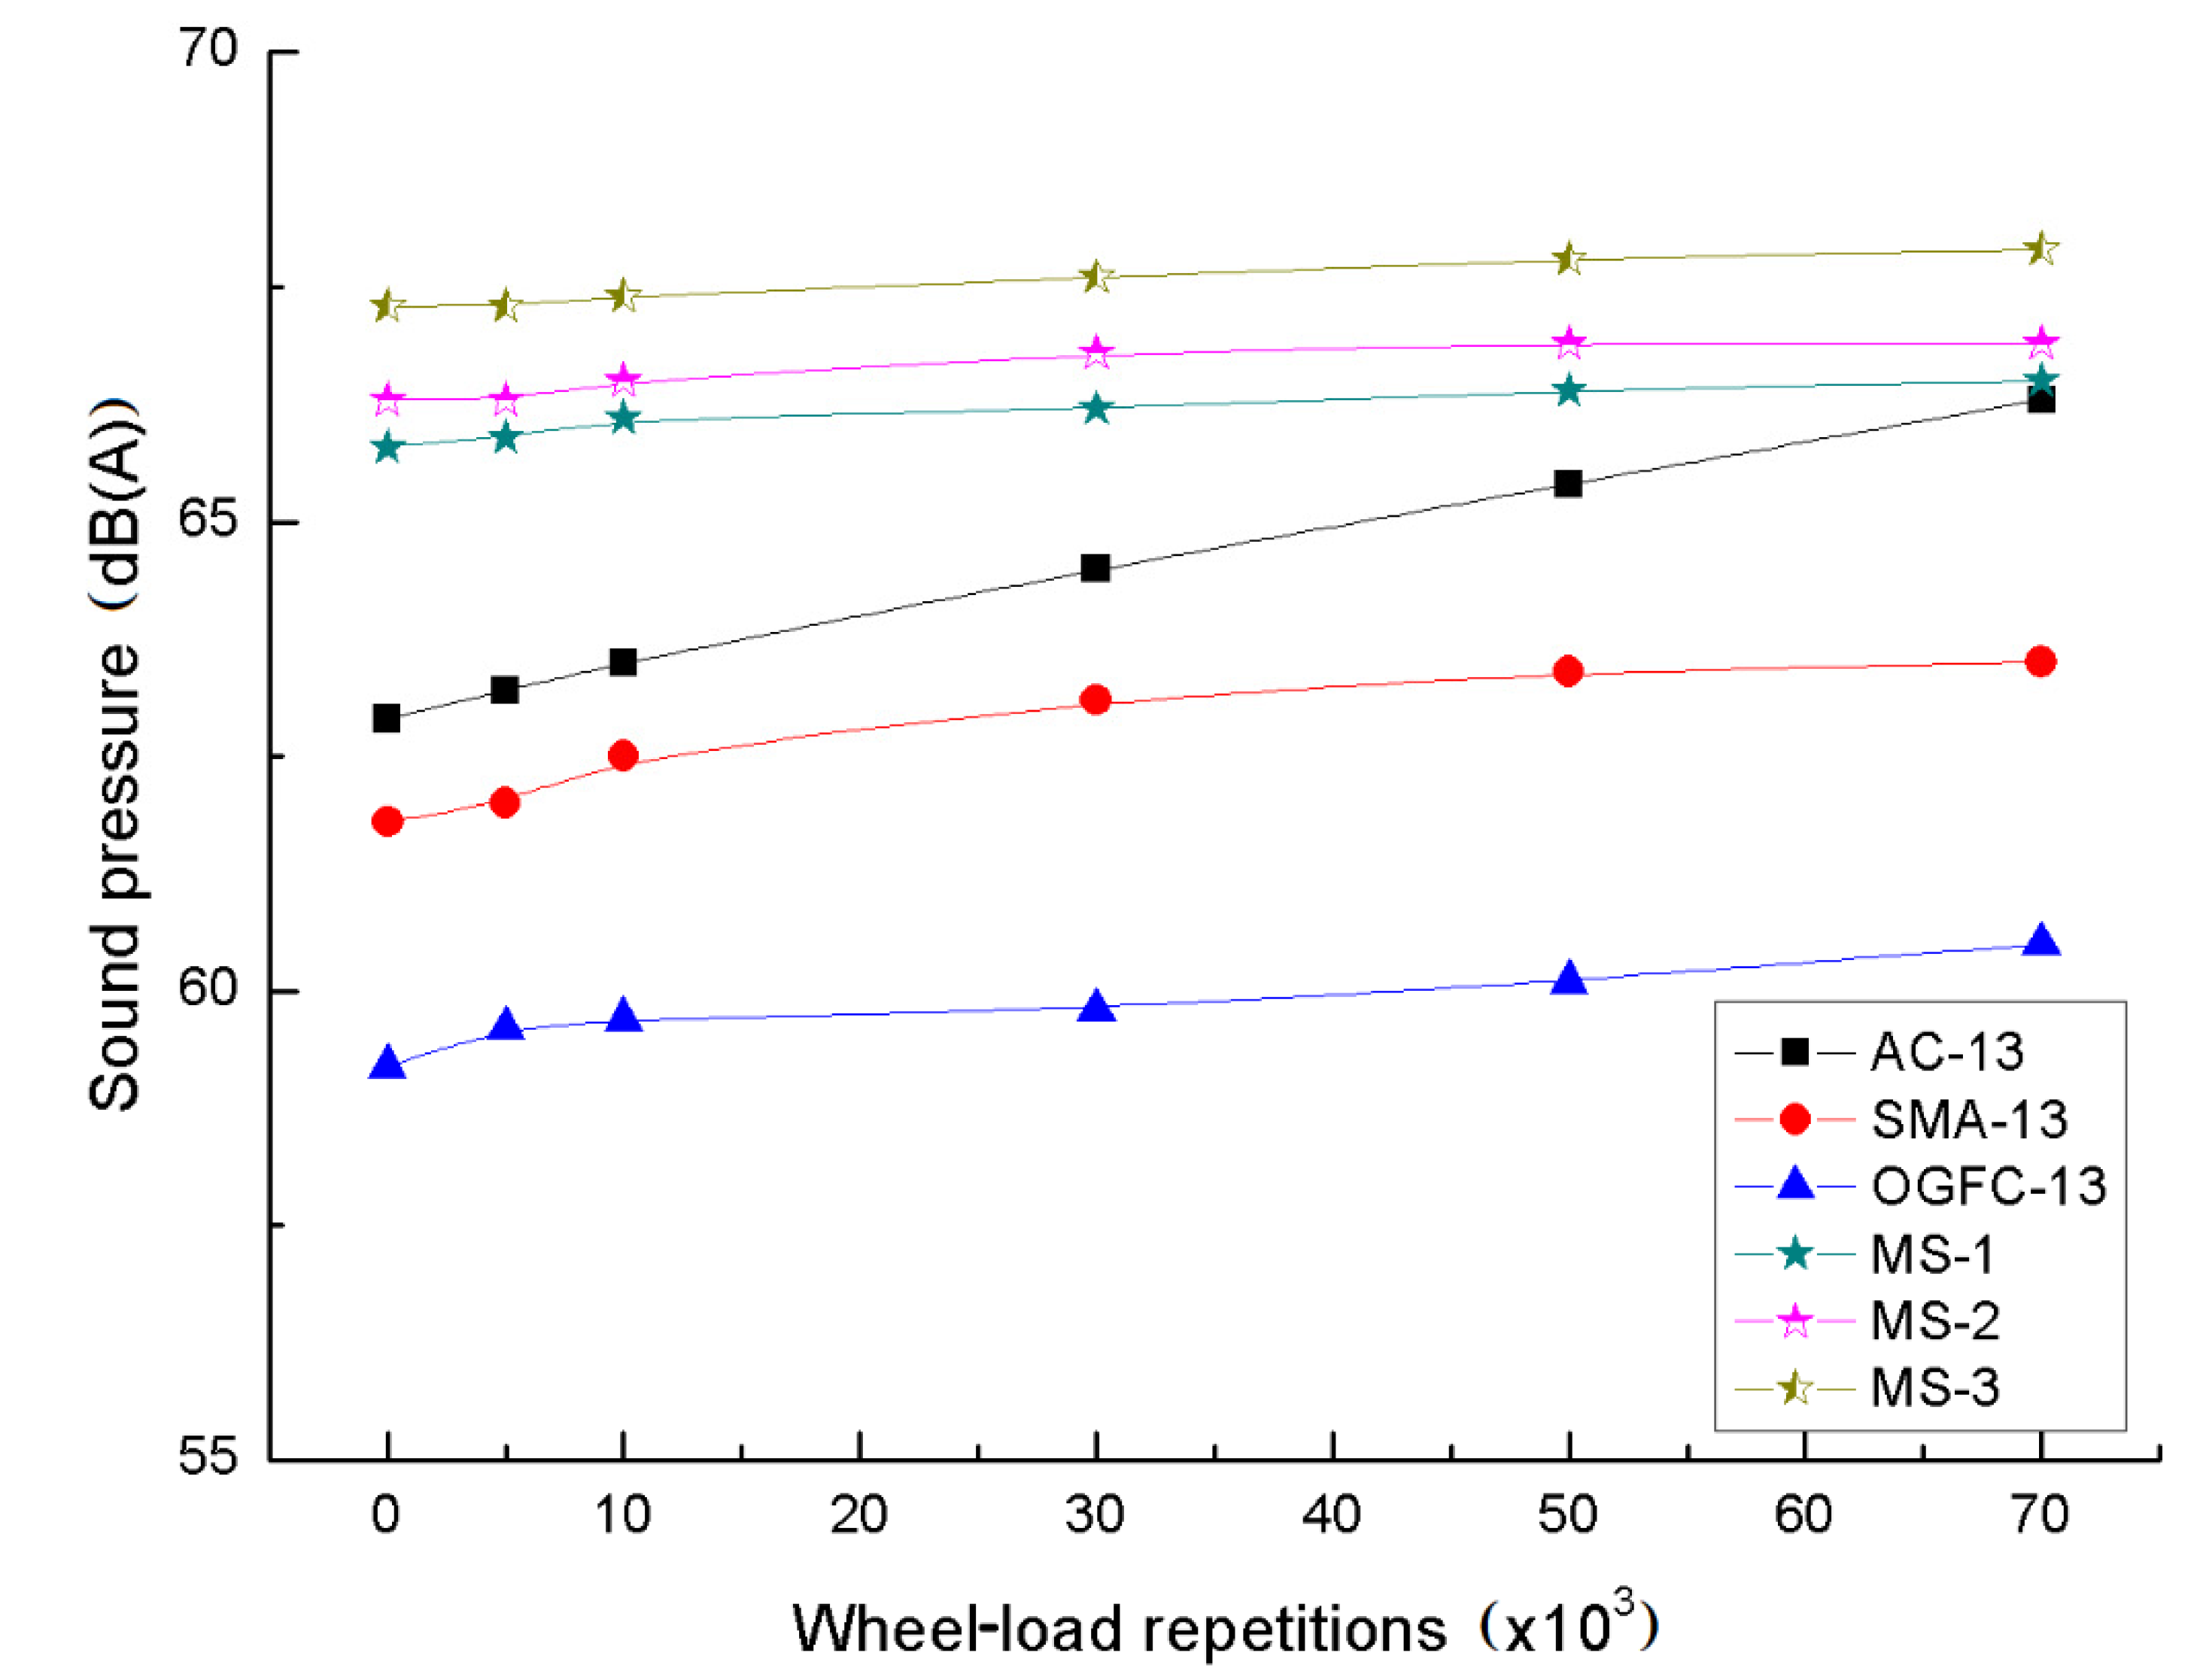
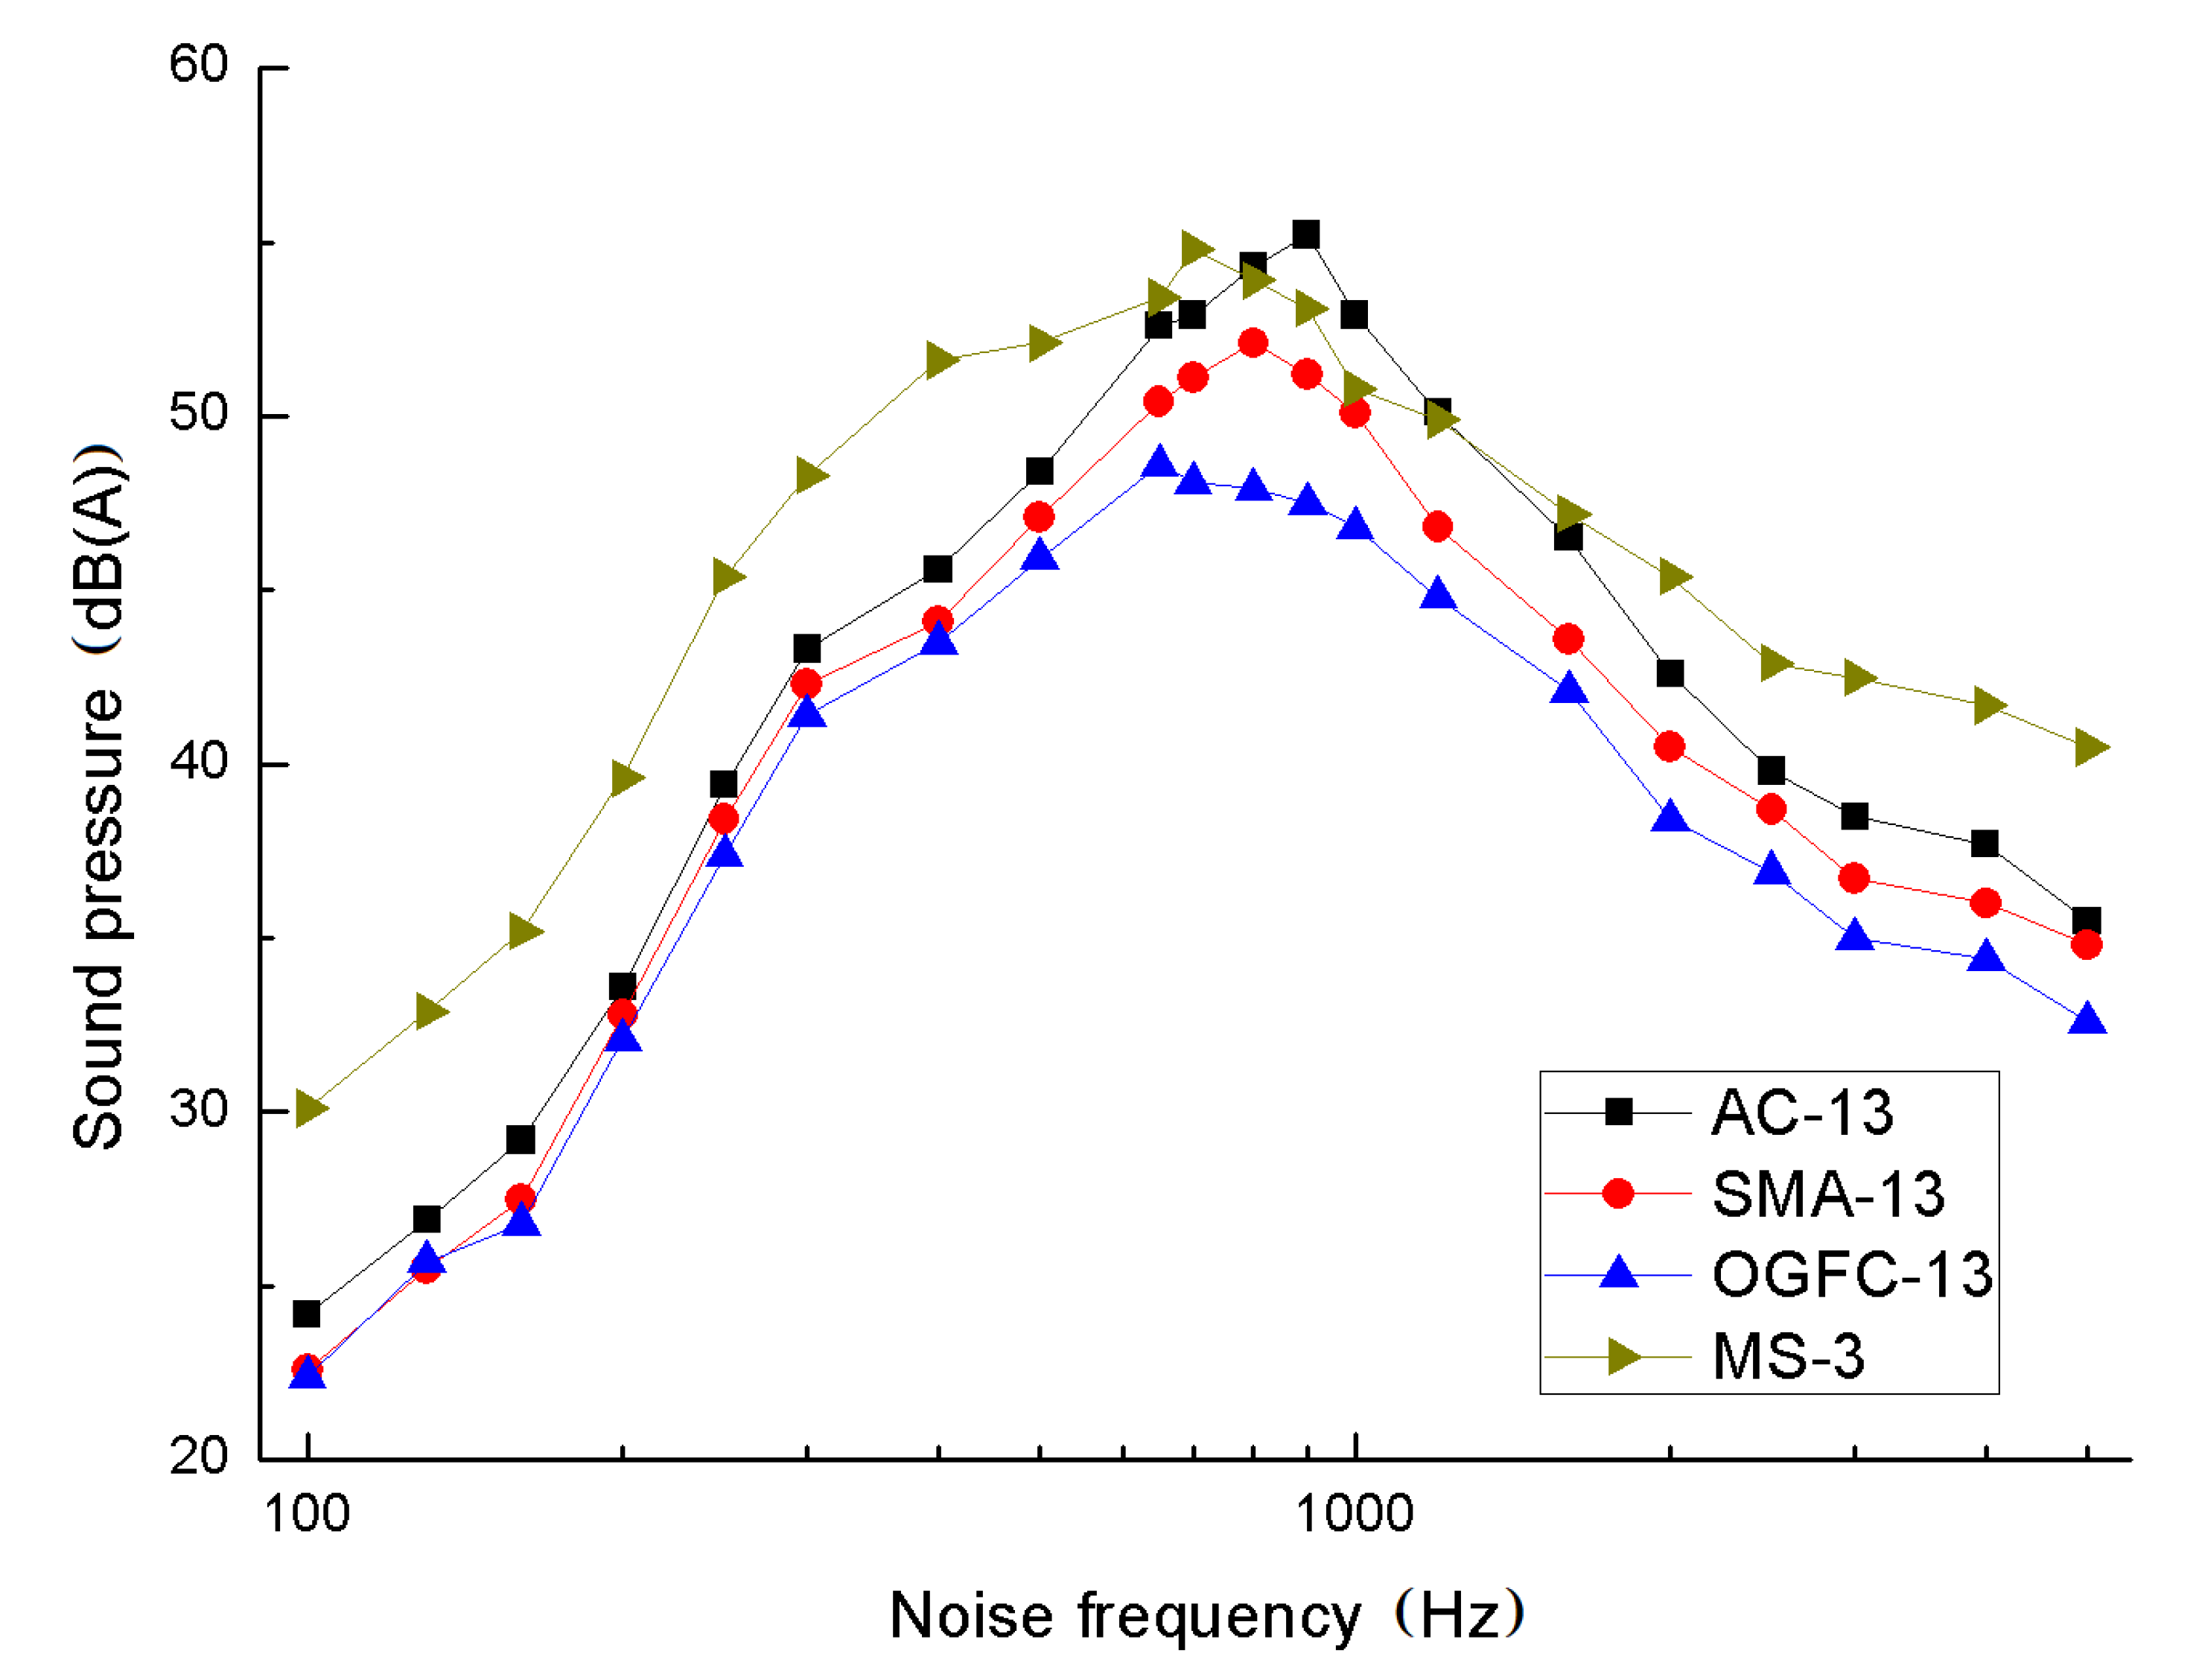
4.4. Tire–Pavement Noise

Two microphones were used to collect the tire–pavement noise of the specimens under the set number of loading repetitions, and the variation of the tire–pavement noise for different mixtures was obtained through calculation and analysis using MATLAB software (7.0, MathWorks, Natick, MA, USA). The A-weighting filter was adopted to mimic the noise response of the human hearing system. The test results are shown in Figure 13.
The tire–pavement noise increased with increasing wheel-load repetitions for all materials. The growth rates of the noise sound pressure for OGFC-13 and SMA-13 were lower than those for AC-13. At 70,000 wheel-load repetitions, the tire–pavement noise for the OGFC-13 mixture and AC-13 mixtures increased by 1.7 dB(A) and 3.5 dB(A), respectively, compared to the initial. The tire–pavement noise of the micro-surfacing materials increased slowly; the noise sound pressure of all three micro-surfacing materials had increased by only 0.6–0.7 dB(A) by the end of the test.
According to the absolute value of the noise, OGFC-13 produced the lowest tire–pavement noise, followed by SMA-13. The AC-13 mixture produced the lower noise in the early stages of the test, but by the end of the test, the noise level was close to that of the micro-surfacing material. Furthermore, for the cold-mix mixtures, the micro-surfacing materials exhibited a worse tire–pavement noise performance. The coarser the gradation of the micro-surfacing material, the higher the tire–pavement noise. Therefore, tire–pavement noise reduction should be one of the main research directions for the optimization of micro-surfacing materials. According to the Environmental Quality Standard for Noise (GB3096-2008), there are five categories of acoustic environment functional areas [42]. Among them, the daytime noise limits of category ii (residential and commercial areas), category iii (industrial area), and category iv (arterial roadside area) are 60 dB(A), 65 dB(A), and 70 dB(A), respectively. Therefore, micro-surfacing was recommended to be applied on the arterial road only. The OGFC-13 mixture was the best material for pavement in residential and commercial areas. AC-13 and SMA-13 mixtures could be used in the industrial area.
The noise frequency spectrum of various pavement materials was extracted using MATLAB software. Considering that the MS-3 material is the most widely used micro-surfacing in China, the noise frequency characteristics of AC-13, SMA-13, OGFC-13, and MS-3 were analyzed (Figure 14). The frequency of tire–pavement noise for AC-13, SMA-13, OGFC-13, and MS-3 exhibited distinct characteristics. The noise frequency of the four materials was a wide continuous spectrum, the main frequency range was 200–5000 Hz, and the spectrum peak value was between 600 Hz and 1000 Hz. The spectrum peak value of AC-13 was the largest, followed by SMA-13, MS-3, and OGFC-13. Considering that human hearing is sensitive to noise in the frequency range of 500–2000 Hz, the noise frequency curves of the four materials in this frequency range can be subdivided into the frequency range of 700–1600 Hz, which is the region where the air pump effect occurs. The OGFC-13 produced the lowest tire–pavement noise in this frequency range, followed by SMA-13.
Because the OGFC-13 material had a higher connected porosity, it dissipated more noise energy to greatly reduce the pump noise between the tires and the pavement. SMA-13 had fewer voids than OGFC-13, but the texture depth of SMA-13 was better than that of AC-13 and MS-3. Therefore, the tire–pavement noise of SMA-13 was also reduced in the low-frequency band compared to AC-13. The sound pressure of the MS-3 micro-surfacing material was substantially higher than that of the other hot-mix materials over the entire frequency range.

5. Conclusions

This study developed an acceleration test method for pavement function performance according to the characteristics of environmental and traffic loads based on the Driving Wheel Pavement Analyser (DWPA). The anti-sliding performance, anti-stripping performance, and tire–pavement noise of hot-mix asphalt mixtures—including AC-13, SMA-13, and OGFC-13—and cold-mix mixtures—including MS-1, MS-2, and MS-3 micro-surfacing materials—were evaluated. The following conclusions were drawn.
The type of material directly affected the basic characteristics and deterioration of the pavement anti-sliding performance. The OGFC-13 mixture exhibited the largest texture depth, which was larger than 1.3 mm at the end of the test. The SMA-13 mixture exhibited the largest BPN, which was larger than 45 at the end of the test. The hot-mix mixtures provided good anti-sliding performances. For the cold-mix mixtures for a thin layer, the texture depth and BPN results indicated that the MS-3 material was the best for providing and maintaining a good anti-sliding performance over a long period.
The gradation had a direct effect on the anti-stripping performance of the micro-surfacing material; the coarser the gradation, the smaller the mass loss. The mass loss of the MS-1 and MS-3 micro-surfacing materials were 13.5% and 6.7%, respectively, at 70,000 wheel-load repetitions. This may have been because the full-size wheel and heavy axle load would result in a greater shear stress in the material. Therefore, mixtures with fine gradation were easier to deform and strip. The DWPA could effectively evaluate the anti-stripping performance of micro-surfacing mixtures on pavement surfaces.
OGFC-13 produced the lowest tire–pavement noise, which was less than 60 dB(A), followed by SMA-13. The micro-surfacing mixtures did not help to reduce the tire–pavement noise. The tire–pavement noise of all micro-surfacing materials was larger than that for the hot-mix asphalt mixtures and increased to more than 66 dB(A) by the end of the test. However, for all materials used in this study, the tire–pavement noise increased with increasing wheel repetitions.
The proposed pavement surface functional performance evaluation method based on the DWPA was able to evaluate the anti-sliding performance, anti-stripping performance, tire–pavement noise, and other pavement surface functional indexes for different types of materials. However, this method still needs to be verified using in situ test data. Furthermore, this method could be used to obtain the degradation model of a functional performance index for each material, and provide a basis for decisions regarding pavement maintenance measures in the future.

Author Contributions

Methodology, formal analysis, and writing—original draft preparation: X.C.; supervision and project administration: D.W.; investigation: J.Y. All authors have read and agreed to the published version of the manuscript.

Funding

This work was financially supported by the National Natural Science Foundation of China (grant nos. 51708144).

Conflicts of Interest

The authors declare no conflict of interest.

References

  1. Jiang, H.; Dong, N.Y.; Huang, Y.G.; Ni, F.J. Evaluation of asphalt pavement maintenance benefit based on life cycle cost analysis. Highway Eng. 2015, 6, 181–184. [Google Scholar]
  2. Tang, H.; Kuai, H.D.; Huang, X.M. Energy consumption model for highway maintenance based on life cycle analysis. J. Southeast Univ. 2016, 3, 624–629. [Google Scholar]
  3. Donev, V.; Hoffmann, M.; Blab, R. Benefit maximisation based on aggregated condition indices: Drawbacks for selection of pavement treatments. Int. J. Pavement Eng. 2020. [Google Scholar] [CrossRef]
  4. Chen, A.Q.; Zhao, Y.L.; Li, P.B.; Li, Y.Y.; Mohammed, M.; Guo, P. Crack propagation prediction of asphalt pavement after maintenance as a function of initial cracks distribution. Constr. Build. Mater. 2020, 231, 117157. [Google Scholar] [CrossRef]
  5. Wang, L.B.; Gong, H.R.; Hou, Y.; Shu, X.; Huang, B.S. Advances in pavement materials, design, characterization, and simulation. Road Mater. Pavement 2017, 18, 1–11. [Google Scholar] [CrossRef]
  6. Ma, T.; Wang, H.; Zhang, D.Y.; Zhang, Y. Heterogeneity effect of mechanical property on creep behavior of asphalt mixture based on micromechanical modeling and virtual creep test. Mech. Mater. 2017, 104, 49–59. [Google Scholar] [CrossRef]
  7. Wang, H.; Wang, J.; Chen, J.Q. Fracture simulation of asphalt concrete with randomly generated aggregate microstructure. Road Mater. Pavement. 2018, 19, 1674–1691. [Google Scholar] [CrossRef]
  8. Vaitkus, A.; Žalimienė, L.; Židanavičiūtė, J.; Žilionienė, D. Influence of temperature and moisture content on pavement bearing capacity with improved subgrade. Material 2019, 12, 3826. [Google Scholar] [CrossRef] [Green Version]
  9. Ren, W.Y.; Han, S.; Fwa, T.F.; Zhang, J.H.; He, Z.H. A new laboratory test method for tire-pavement noise. Measurement 2019, 145, 137–143. [Google Scholar] [CrossRef]
  10. Gao, J.F.; Wang, H.N.; Chen, J.K.; Meng, X.W.; You, Z.P. Laboratory evaluation on comprehensive performance of polyurethane rubber particle mixture. Constr. Build. Mater. 2019, 224, 29–39. [Google Scholar] [CrossRef]
  11. Miao, Y.H.; Wu, J.Q.; Hou, Y.; Wang, L.B.; Yu, W.X.; Wang, S.D. Study on Asphalt pavement surface texture degradation using 3-D image processing techniques and entropy theory. Entropy 2019, 21, 208. [Google Scholar] [CrossRef] [Green Version]
  12. Zhang, R.; You, Z.P.; Wang, H.N.; Ye, M.X.; Yap, Y.K.; Si, C.D. The impact of bio-oil as rejuvenator for aged asphalt binder. Constr. Build. Mater. 2019, 196, 134–143. [Google Scholar] [CrossRef]
  13. Qu, X.; Wang, D.W.; Hou, Y.; Liu, Q.; Oeser, M.; Wang, L.B. Investigation on self-healing behavior of asphalt binder using a six-fraction molecular model. J. Mater. Civ. Eng. 2019, 31, 04019046. [Google Scholar] [CrossRef]
  14. Ahmad, J.; Rahman, M.Y.A.; Hainin, M.R. Rutting evaluation of dense graded hot mix asphalt mixture. Int. J. Eng. Technol. 2011, 11, 56–60. [Google Scholar]
  15. Sirin, O.; Kim, H.J.; Tia, M. Comparison of rutting resistance of unmodified and SBS-modified superpave mixtures by accelerated pavement testing. Constr. Build. Mater. 2006, 8, 1–9. [Google Scholar] [CrossRef]
  16. Khoslaa, N.P.; Ayyala, D. A performance-based evaluation of superpave design gyrations for high traffic surface mixes. Procedia Soc. Behav. Sci. 2013, 104, 109–118. [Google Scholar] [CrossRef] [Green Version]
  17. JTG F40 Technical Specifications for Construction of Highway Asphalt Pavement; China Communication Press: Beijing, China, 2004.
  18. Javilla, B.; Mo, L.; Hao, F. Multi-stress loading effect on rutting performance of asphalt mixtures based on wheel tracking testing. Constr. Build. Mater. 2017, 148, 1–9. [Google Scholar] [CrossRef]
  19. Vaitkus, A.; Šernas, O.; Vorobjovas, V.; Gražulytė, J. Selection of constituent materials for asphalt mixtures of noise-reducing asphalt pavements. Balt. J. Road Bridge Eng. 2019, 14, 178–207. [Google Scholar] [CrossRef] [Green Version]
  20. Kleizienė, R.; Šernas, O.; Vaitkus, A.; Simanavičienė, R. Asphalt pavement acoustic performance model. Sustainability 2019, 11, 2938. [Google Scholar] [CrossRef] [Green Version]
  21. Wang, C.T.; Yao, Z.Q.; Chen, M. Automotive Tribology; Shanghai Jiaotong University Press: Shanghai, China, 2002. [Google Scholar]
  22. Motamedi, M.; Taheri, S.; Sandu, C.; Legrand, P. Characterization of road profiles based on fractal properties and contact mechanics. Rubber Chem. Technol. 2017, 90, 405–427. [Google Scholar] [CrossRef]
  23. ASTM. ASTM E660-1990 Standard Practice for Accelerated Polishing of Aggregate or Pavement Surfaces Using a Small-Wheel, Circular Track Polishing Machine; American Society for Testing and Materials: West Conshohocken, PA, USA, 2015. [Google Scholar]
  24. Vollor, T.W.; Hanson, D.I. Development of Laboratory Procedure for Measuring Friction of HMA Mixtures—Phase I; NCAT Report 06-06; American Society for Testing and Materials: West Conshohocken, PA, USA, 2006. [Google Scholar]
  25. Khasawneh, M. Laboratory study on the frictional properties of HMA specimens using a newly developed asphalt polisher. Int. J. Civ. Eng. 2017, 15, 1007–1017. [Google Scholar] [CrossRef]
  26. Khasawneh, M. The Development and Verification of a New Accelerated Polishing Machine; Graduate Faculty of The University of Akron: Akron, OH, USA, 2008. [Google Scholar]
  27. Yang, Z.; Guo, Z.Y.; Hou, Y. Research on acceleration test method of anti-skid performance of asphalt concrete anti-skid wear layer. East Chin. Highway 2002, 2, 50–53. [Google Scholar]
  28. Zhao, Z.L. Study on Skid Resistant Surface of Asphalt Pavement; Graduate Faculty of Chang’an University: Xi’an, China, 2002. [Google Scholar]
  29. Tan, W. Study on Experimental System Development and Key Technology of Limestone Optimization Based on Anti-Sliding Characteristics of Asphalt Pavement; Graduate Faculty of Chongqing Jiaotong University: Chongqing, China, 2017. [Google Scholar]
  30. Lei, C.X. Study on Pavement Surface Function Accelerated Loading System; Graduate Faculty of South China University of Technology: Guangzhou, China, 2010. [Google Scholar]
  31. Wang, D.Y.; Lei, C.X.; Cai, X.; Ou, S.Q. Reverse design and corresponding experimental investigation of asphalt pavement. J. South Chin. Univ. Technol. 2010, 38, 84–88. [Google Scholar]
  32. Cai, X.; Wang, D.Y.; Zhang, J.Q.; Zhang, S.X. Indoor accelerated loading test on micro-surfacing coating. J. Zhejiang Univ. Eng. Sci. 2012, 46, 791–797. [Google Scholar]
  33. Sun, X.L.; Zhang, X.N.; Cai, X. Accelerated test-based study of long-term pavement performance of micro-surfacing. J. Tongji Univ. Nat. Sci. 2012, 40, 691–695. [Google Scholar]
  34. Cai, X.; Wang, D.Y.; Huang, W.K.; Yu, J.M.; Wan, C. Evaluation of rutting performance of asphalt mixture with driving wheel pavement analyzer. Adv. Mater. Sci. Eng. 2017, 6301914. [Google Scholar] [CrossRef] [Green Version]
  35. JTG E20 Standard Test Methods of Bitumen and Bituminous Mixtures for Highway Engineering; China Communication Press: Beijing, China, 2011.
  36. ISO. ISO 11819-2 Acoustics—Measurement of the Influence of Road Surfaces on Traffic Noise—Part 2: The Close-Proximity Method; International Organization for Standardization: Geneva, Switzerland, 2017. [Google Scholar]
  37. JTG 3450 Field Test Methods of Highway Subgrade and Pavement; China Communication Press: Beijing, China, 2019.
  38. JTG E42 Test Methods of Aggregate for Highway Engineering; China Communication Press: Beijing, China, 2005.
  39. Campbell, J.A.; Isles, S. Environmental Noise Management Manual; Roads and Traffic Authority of New South Wales: Sydney, Australia, 2001. [Google Scholar]
  40. Golebiewski, R.; Makarewicz, R.; Nowak, M. Traffic noise reduction due to the porous road surface. Appl. Acoust. 2003, 64, 481–494. [Google Scholar] [CrossRef]
  41. Hanson, D.I.; James, R.S. Colorado DOT Tyre/Pavement Noise Study; National Center for Asphalt Technology, Auburn University: Auburn, AL, USA, 2004. [Google Scholar]
  42. GB 3096 Environmental Quality Standard for Noise; China Environmental Science Press: Beijing China, 2008.
Figure 1. The Driving Wheel Pavement Analyzer (DWPA) test system.
Applsci 10 02410 g001
Figure 2. The air jacks and pressure sensors.
Applsci 10 02410 g002
Figure 3. The three types of accelerating test specimens: (a) cement concrete specimen, (b) asphalt concrete specimen, and (c) functional layer specimen.
Applsci 10 02410 g003
Figure 4. The forming machine for an arc-shaped specimen: (a) machine after updating and (b) specimen molding process diagram.
Applsci 10 02410 g004
Figure 5. Functional layer specimens prepared on site: (a) fog seal specimen, (b) chip seal specimen, and (c) micro-surfacing specimen.
Applsci 10 02410 g005
Figure 6. Arc-shaped specimens used in the test: (a) arc-shaped specimens of asphalt mixture and (b) tack coat and arc-shaped micro-surfacing specimen.
Applsci 10 02410 g006
Figure 7. Texture depth test.
Applsci 10 02410 g007
Figure 8. British pendulum number (BPN) test for the arc-shaped specimens.
Applsci 10 02410 g008
Figure 9. Microphone setting and noise signal analysis.
Applsci 10 02410 g009
Figure 10. Texture depth of the mixture under different wheel-load repetitions.
Applsci 10 02410 g010
Figure 11. BPN of the mixture under different wheel-load repetitions.
Applsci 10 02410 g011
Figure 12. Spalling mass-loss rate under different wheel-load repetitions.
Applsci 10 02410 g012
Figure 13. Tire–pavement noise of mixtures under different wheel-load repetitions.
Applsci 10 02410 g013
Figure 14. Tire–pavement noise frequency curves of different materials.
Applsci 10 02410 g014
Table 1. List of instruments for pavement surface function tests.
HeadingInstrumentYearSourceObtained Results
1Tongji small accelerated wear tester2002Yang [27]An anti-sliding degradation model was established
2Anti-sliding simulation test machine2002Zhao [28]Micro and macro structures were the main factors affecting the anti-skid performance
3NCSU Wear and Polish Machine2006Vollor et al. [24]Pneumatic tires appeared better than the solid tires
4Pavement surface functional accelerated wear instrument2008, 2017Khasawneh [25,26]Decrease of polish number dropped in the first hour of test, then stabilized
5The three-wheel accelerated wear tester2015American Asphalt Technology Centre [23]Effective skid resistance evaluation methods for aggregates and mixtures
6Aggregate/asphalt mixture friction characteristic tester2017Tan [29]The equivalent relation between the acceleration test and the actual traffic was obtained
7Michigan Indoor Wear Track2017Motamedi et al. [22]Pavement profiles displayed strong fractal behavior and the pointwise Holder exponent could be used to discriminate different frictional properties
Table 2. Technical indexes of the styrene-butadiene-styrene (SBS)-modified asphalt.
TestsTechnical RequirementTest Result
Penetration 25 °C, 100 g, 5 s (0.1 mm)40–6058.5
Penetration index (PI) +0.0+0.76
Ductility 5 °C, 5 cm/min (cm)≥2034.2
Softening point (°C)≥6071.4
Flashing point (°C)≥230327
Solubility (%)≥9999.9
Elastic recovery at 25 °C, (%)≥7590
Dynamic viscosity (Pa·s)≤32.24
Rolling thin-film oven test (RTFOT) (163 °C, 85 min)Mass change (%)±1.00.6
Prolongation 5 °C, 5 cm/min (cm)≥1528
Penetration ratio (%)≥6584.9
Table 3. Technical indexes of modified emulsified asphalt.
Pilot ProjectTechnical IndexTest Result
Sieve excess, 1.18 mm sieve size (%)≤0.10.01
Charge cationic
Engler viscosity E253–3011.2
Evaporation residue content (%)≥6063.2
Evaporative residue propertyPenetration 5 °C, 100 g, 5 s (0.1 mm)40–10074
Softening point (°C)≥5757.5
Ductility 5 °C, 5 cm/min (cm)≥2028
Storage stability1d %≤11
Table 4. Mixture gradations.
Mixture TypeAC-13SMA-13OGFC-13MS-1MS-2MS-3
Asphalt aggregate ratio (%)4.36.14.47.46.96.6
16100100100---
13.2908995---
9.5686356-100100
4.753825151009070
2.36241912906545
1.18151510654528
0.610148403019
0.37137251812
0.15512515107
0.07541041055

