Abstract
This paper presents an experimental study on the seismic performance of a novel composite joint between reinforced concrete columns and steel beams (RCSs) for frame structures. In the proposed RCS joint, an H steel profile totally embedded inside an RC column is directly welded to the steel beam. The H steel profile was covered by two supplementary plates to avoid the stirrups resisting the shear in the connection region. Two full-scale joints were built and tested under reversed-cyclic loading at the University of Transport and Communications of Vietnam. Seismic performance in terms of load-bearing capacity, story drift capacity, energy dissipation, and stiffness degradation were evaluated. The test specimen showed a good response to cyclic load reversals.
1. Introduction
The reinforced concrete column and steel beam (RCS) frames consist of reinforced concrete (RC) columns and steel (S) beams. This type of structure has several advantages over traditional RC frames or steel frames, including lower cost and structure weight reduction. RC columns offer superior damping properties to a structure, especially in tall buildings. Indeed, using RC instead of structural steel as columns can result in substantial savings in material cost and an increase in the structural damping and lateral stiffness of the building. The energy dissipation capacity can accordingly be provided through steel beams. In addition, steel floor systems are significantly lighter compared to RC floor systems, leading to substantial reductions in the weight of the building, foundation costs, and inertial forces. To effectively apply RCS frames in a real structure, it is necessary to study the composite connection between steel beams and reinforced concrete columns. Extensive studies have been conducted to study the basic force transfer mechanisms in connection regions and the performance of various joint configurations that enhance the connection performance under seismic excitations [1,2,3,4,5]. The American Society of Civil Engineers [6] published design guidelines for composite RCS joints in low to moderate seismic regions. Recent studies have focused on the development of design guidelines for composite connections in RCS frame structures located in highly seismic regions. Nishiyama et al. [7] have developed the guidelines for “Steel-Concrete Composite Structures for Seismic Design” for ordinary reinforced concrete columns–steel beam buildings. As illustrated in Figure 1, there are two main categories in RCS connections, which are the through-beam and through-column types [8]. In the through-beam type, the steel beam is extended continuously through concrete columns. In the through-column type, the beam flanges are interrupted at the column faces to increase longitudinal reinforcements and to facilitate the placement of concrete in the RCS joints.
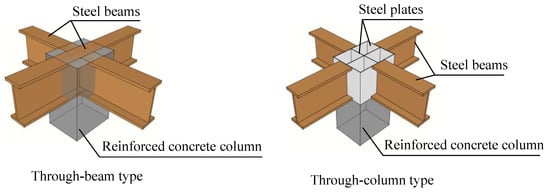
Figure 1.
Two types of beam–column joint.
According to the literature, the through-beam type displays more ductile behavior. The beam continuously passing through the column panel zones behave in a ductile manner under seismic loading; however, an orthogonal moment connection in the panel zone may be labor-intensive. Meanwhile, the through-column type, which often consists of cover plates or diaphragm plates for connecting steel beams to concrete columns, requires less workmanship and control during construction to assure a high ductility and strength. Using the through-column type may facilitate field construction; however, additional effort is needed in the connection details to ensure a better seismic capacity in terms of strength and ductility.
Li et al. [9] has summarized different studies on the seismic performance of RCS beam-to-column joints among other composite RC and steel moment frame structures. Their study found that when the force transfer between the beam and column is ensured, RCS connections are capable of providing a reliable amount of strength and ductility under seismic loading. There has been a significant amount of recent investigations on the behavior and design of RCS connections for seismic loading, especially regarding the through-column type. Tao et al. [10] presented an investigation on cyclic loading tests of four hybrid joints between steel-reinforced concrete columns and steel truss beams. As a result, the joints with flexural failure at the end of beams showed a higher stiffness and strength and a better ductility and energy dissipation capacity than those with shear failure at their core. The composite behaviors can be achieved through the natural cohesion between the steel and concrete for the steel-reinforced concrete column in the hybrid subassembly no matter whether the shear studs are arranged or not. Zibasokhan et al. [11] proposed six new types of composite steel–concrete connections between continuous concrete columns and steel beam segments. In their proposed configuration, a steel sleeve was used to transfer loads from the steel beam to the concrete column. Connection components are either steel studs or U-channels used in two different types of joints to connect the sleeve to the concrete column. Based on the experimental results, appropriate ranges for the thickness and height of the steel sleeves were determined. Eghbali et al. [12] carried out experiments to investigate the seismic performance for another through-column-type joint. In this type of connection, the beams, one of I-section and the other of channel section, were connected to a vertical plate passing through the concrete column (namely through the plate). The rigid shear connectors were employed to limit the movement between the steel beams and concrete columns. The experimental results showed that the through plate combined with the concrete provided a strong panel with elastic behavior, and the suggested connection was categorized as a fully restrained connection. The European project Smartcoco [13] proposed a type of exterior RCS connection in which a steel profile totally encased inside an RC column is directly welded to the steel beam. This connection design allowed for better force transmission from steel beams to columns compared with the classical RCS joints. An experimental study on the cyclic behavior of this RCS joint type conducted by Nguyen et al. [14] showed that it could be used as a dissipative element in ductility class medium structures. However, this joint design required a complex set of stirrups in the connection zone because the stirrups had to go through the steel beam.
To overcome this inconvenience, a novel RCS beam–column joint, in which an H steel profile covered by two supplementary plates embedded inside an RC column is directly welded to the steel beam, was proposed (Figure 2). The two supplementary plates are included in this design to avoid the stirrups resisting the shear in the connection region. A numerical study based on 3D finite element (FE) modeling recently performed by Nguyen et al. [15] indicated that the static behavior of this novel joint depended strongly on the length of the encased steel profiles. It has been observed that the presence of supplementary plates in joint regions allowed for the removal of the stirrups in this region. Furthermore, the parametric study performed with various lengths of supplementary plates pointed out that supplementary plates were useful only at the beam–column connection. However, the cyclic behavior of this type of connection has not been studied yet.
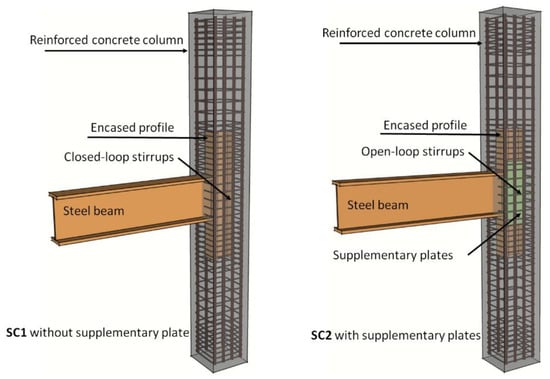
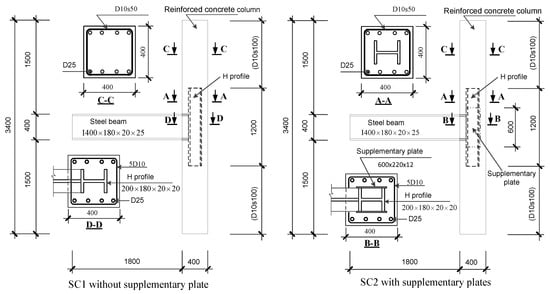
Figure 2.
Description of the test specimens.
This paper describes an experimental study on the seismic performance of the above-mentioned novel joint. Two full-scale composite joints with and without supplementary plates were tested under reversed-cyclic loading. The seismic performance in terms of load-bearing capacity, story drift capacity, ductility, energy dissipation, and stiffness was monitored and evaluated, and the results are presented herein.
2. Details of Specimens
2.1. Geometry
This kind of joint detail is not covered by the existing design guidelines. Eurocode 4 gives some provisions that can partly be used for the design of such a joint. The specimens (namely SC1 and SC2) were designed according to the provisions of Eurocode 4 [16] and existing research works in the literature. Both specimens consisted of a 3.4 m height RC column with 40 cm × 40 cm square cross-section reinforced by 8 Φ 25 longitudinal steel bars, as shown in Figure 2. The stirrup reinforcements were 38 Φ 10 bars with a constant spacing of 50 mm. The steel beam was 2 m in length with the cross-section dimension shown in Figure 3. The steel beam was welded to an H profile, which was fully encased into the RC column. The difference between specimens SC1 and SC2 was the presence of two supplementary plates welded to the flanges of the H profile. The dimension of the H profile and the supplementary plates is indicated in Figure 2. It is noted that the stirrups inside of the connection region of the specimen SC1 were passed through 12-mm holes in the steel beam web to play the role of shear reinforcement, while in specimen SC2, they were not. The stirrups were present in the connection zone of the specimen SC2 just for the structural reinforcement.
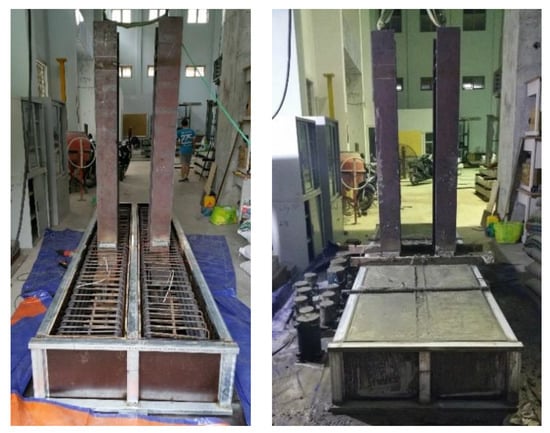
Figure 3.
Casting of the specimens.
2.2. The Materials’ Properties
The specimens were constructed using normal-weight, ready-mixed concrete with a targeted 28-day concrete compressive strength of 44.5 MPa. The actual concrete compressive strength was determined based on the average value of compressive test carried out on standard cylinders. On the day of testing of the specimens, the obtained strength of the concrete was 45.2 MPa. The material properties of the reinforcement and structural steel were determined using a standard tensile test. The yield stress and ultimate stress are reported in Table 1.

Table 1.
Structural and reinforcing steel properties.
2.3. Specimen Preparation
Two specimens were constructed and cast together at the Construction Materials Laboratory of the University of Transport and Communications, Vietnam. In the beginning, the steel beam was welded to an H profile. Then, two supplementary plates welded to the flanges of the H profile for specimen SC2. Afterward, they were placed in the mold along the reinforcement cage. Finally, the normal concrete was poured into the column. In this experimental investigation, concrete was designed to be self-compacting. However, the mechanical vibrator was also used to ensure that the concrete filled the specimen well, especially in the joint region.
3. Test Setup, Loading Protocol, and Instrumentation
The experimental test setup is shown in Figure 4. A hydraulic actuator APD-1000 (Anco Engineering, USA) with a 1000 kN capacity and a stroke length of 250 mm was used to apply the cyclic lateral displacements at the top of the beam. This actuator was operated in displacement control and horizontally held to the strong wall of the laboratory. A steel plate was used in the space between the specimen and the actuator for a smooth transfer of the actuator load at the beam level. Pinned boundary conditions at each end of the columns were simulated using two supports. No restraint was provided against rotation along any axis.
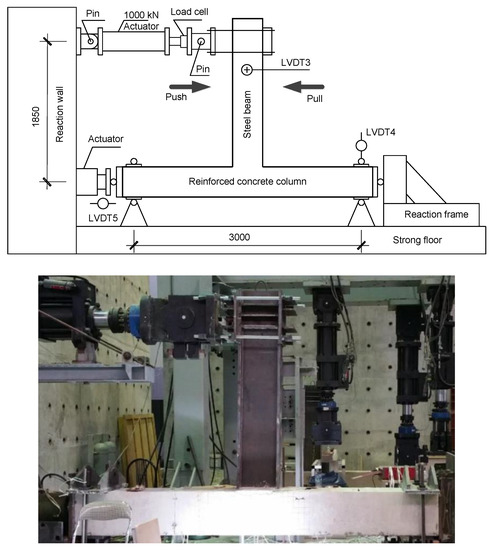
Figure 4.
Test setup.
A constant axial load of 800 kN was applied and maintained throughout the test at the end of the column by a hydraulic actuator (CGS250P250, Europress, Italy). Then, the lateral displacement was imposed cyclically, in a quasi-static way, at the end of the beam. The loading cycle consisted of a series of reversed-displacement cycles of increasing amplitude (Figure 5). The first steps were at a 0.25% drift story, followed by steps at 0.5%, 0.75%, 1%, 1.25%, 1.5%, 1.75%, 2%, 2.25%, 2.5%, 3%, 3.5%, 4%, 4.5%, 5%, and 5.5%. Each drift step consisted of two cycles of push and pull. Note that the drift of the specimen was calculated as the ratio of the total relative horizontal displacement of the steel beam at the loading point to the distance between this point and the axis of the column.
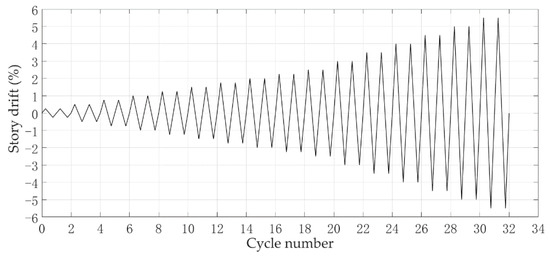
Figure 5.
Lateral loading protocol.
To collect the information regarding the joint distortion and the yielding of the components, several different instruments were used when testing the specimens. The arrangement of the strain gauges and rosettes is presented in Figure 6. During the loading, the test results were recorded every second. At the joint region, six strain gauges (KFGS-5-120-C1, Kyowa, Japan) were placed on both transverse and longitudinal reinforcements of the column. There were also four strain gauge rosettes (KFGS-10-120-D17-11, Kyowa, Japan) arranged in the embedded steel profile.
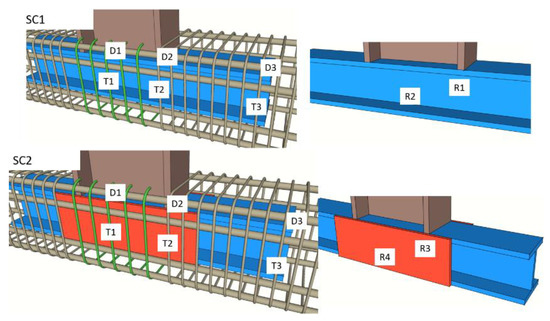
Figure 6.
Strain gauge (D and T) and rosette (R) locations.
4. Experimental Results and Analysis
4.1. Cracking Pattern
During the test, the cracks on the specimens were identified and hand-marked. Three types of cracks were observed in this experimental study, which include:
- Diagonal cracks on two lateral faces at the center of the joint region (type 1).
- Diagonal (inclined) cracks outside of the joint region (type 2).
- Horizontal cracks located at the column faces (type 3).
Figure 7 shows the crack patterns of specimen SC1 from the 0.5% drift to the 5.5% drift. From the 0.5% drift in the pull direction of loading, the first diagonal crack appeared at the center of the joint region. In the pull direction of loading (compression), some microcracks were also detected. They were due to the local compression force resulting from the transmission of the shear force of the beam on the column. The cracks were propagated due to the 0.75% drift but they were particularly concentrated in the joint region. From the 1% drift, the microcracks formed in the pull direction had propagated. The diagonal crack appeared in two directions of loading but that damage did not take place outside of the joint region. The 1.5% drift provided the first damage that was observed outside of the joint region, including diagonal cracks (type 2) that extended from previous steps and some new horizontal cracks (type 3). The diagonal cracks propagated and widened gradually due to the 2.5% drift. However, the horizontal cracks (type 3) propagated slowly due to the presence of axial loading. Then, from the 3.5% drift, these horizontal cracks were connected to the diagonal cracks located outside of the joint region. In the last step of loading (drift of 5.5%), the diagonal cracks crossed the entire width of the specimen from the bottom corner to the opposite side at approximately 45 degrees.
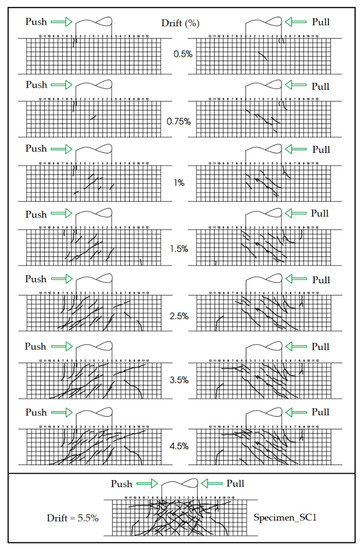
Figure 7.
Crack pattern of specimen SC1.
It should be noted that by adding the supplementary plates, the ordinal of failure modes of specimen SC2 was different in comparison with specimen SC1 (see Figure 8). From the 1% drift, the damage detected was the horizontal crack located outside of the joint region (type 3). Then, from the 1.5% drift, the diagonal cracks (type 1) appeared at the joint region but they propagated less in SC2 than SC1. From the 2.5%, 3.5%, and 4.5% drifts, the damage developed outside of the joint region in particular. They included the diagonal cracks that extended from the joint region (type 2) and various horizontal cracks crossing the half-width of the column. In the final step, the diagonal cracks on the front face connected to the vertical crack on the side face of the column. These cracks were opened, and consequently, the column was crushed. It was observed that the damage distributed to the inside and the outside of the joint region.
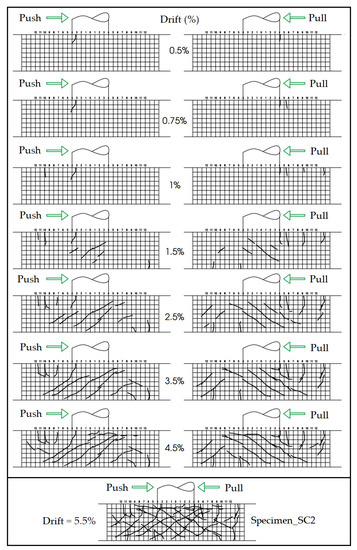
Figure 8.
Crack pattern of specimen SC2.
4.2. Hysteresis Curves
Figure 9 shows the specimen behavior regarding the joint-bending moment versus drift response in terms of the hysteresis loop for two specimens. It can be seen that in both specimens, there was no pinching effect when the loading was inversed. It can also be observed that specimen SC2 was stiffer and stronger than specimen SC1. Furthermore, the specimen behaved more like steel joint behavior than RC joint behavior; this is to say that the energy dissipation capacity and the ductility of the studied hybrid joint are suitable for RCS frames as part of a seismic design.
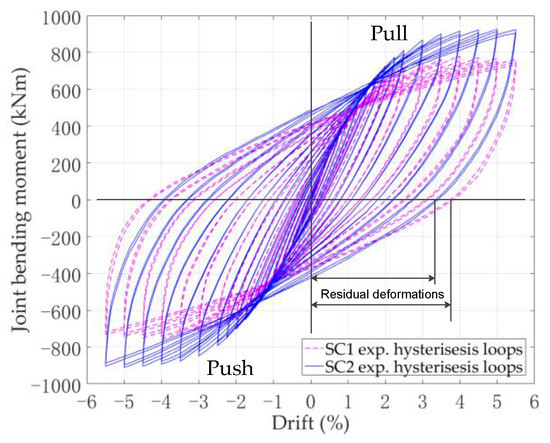
Figure 9.
Hysteresis moment–drift response of specimens.
The cyclic moment–drift envelope curves for each specimen is presented in Figure 10 such that they can be compared. Table 2 presents the values of the joint-bending moment corresponding to the maximum drift. As can be seen, the moment-bearing capacity of specimen SC1 was 779.2 kNm (at 4% drift) while that of specimen SC2 was 927.3 kNm (at 5% drift). This is to say that the two plates used in the joint region increased the moment-bearing capacity by about 19% on average for pull and push. For instance, for the 5.5% drift, specimen SC2 had a moment-bearing capacity that was 21% greater than specimen SC1. Furthermore, Table 2 also indicates that the strength degradation was more apparent in specimen SC1 than SC2.
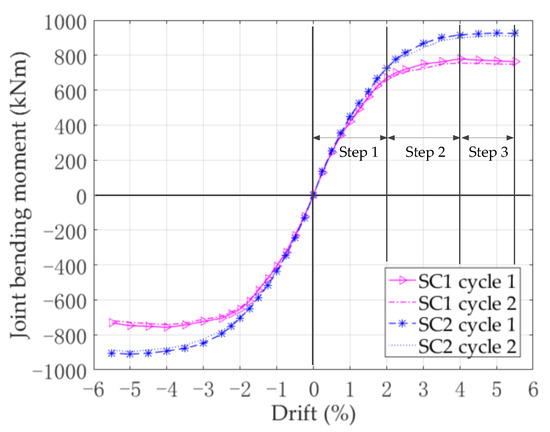
Figure 10.
Comparison between the moment–drift envelope curves.
Table 2.
Summary of the test results.
By observing the moment–drift envelope curves in Figure 10, one can say that the global cyclic behavior of the tested specimens was similar. Indeed, when the drift was smaller than 1%, the two curves were superimposed. The moment–drift response of the joint could be subdivided into three steps. Each step was characterized by several variables, such as drift, stiffness degradation, and yielding of the joints’ components. The first step was from zero to 2% drift, where the behavior was almost linear and the cracking was not clear. The second step was from 2% to 4% drift, where the behavior was nonlinear and the yielding took place at different points of the steel component in the joint region. This was correlated with the important crack propagation and opening observed during this step. The last step was from 4% drift to the end of the test, where the specimen reached the load-bearing capacity and the resistance decreased due to concrete splitting and spalling. In conclusion, the use of the steel plates at the joint region significantly improved the behavior of the studied hybrid joint as seen by the increase in the moment-bearing capacity and the decrease in the residual deformations. As such, this kind of joint detail is suitable for restoring, repairing, and strengthening structures after experiencing damage.
4.3. Strain Analysis
The yielding points detected from the strain gage and rosette data are reported on the moment–drift envelope curves in Figure 11. It was observed that the yielding of the steel at the same position in two specimens occurred at different levels of loading. All the points where the strain gauges and rosettes were glued yielded between 1% and 2.5% drift for specimen SC1 and between 1.5% and 4% drift for specimen SC2. This is to say that the two plates added in specimen SC2 changed the force transfer mechanism from the steel beam to the RC column via the embedded steel profile.
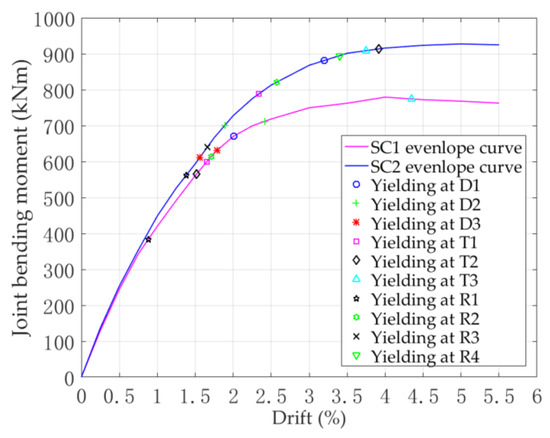
Figure 11.
Load–drift envelope curves and the yielding points.
In both specimens, the first yielding took place at the location of rosette 1 (at 0.88% drift for SC1 and 1.38% drift for SC2). The use of two additional plates increased the steel area that was under tension due to the force transmission from the upper flange of the steel beam to the web of the embedded steep profile. In particular, even after the first yielding, the specimens behaved linearly. This is an advantage of the proposed hybrid joint detail that allows for the formation of plastic hinges within the steel parts to dissipate energy without any impact on the global behavior of the joint. The yielding of the web panel in shear was detected by rosette R2 at 1.71% drift for SC1 and 2.57% for SC2 (see Table 3) It is noted that after the yielding of the steel web panel in shear, the specimen resistance almost no longer increased.
Table 3.
Joint-bending moments and the corresponding drift at several yielding points.
The experimental results concerning the yielding of the rebars (points T1 and D1 in Figure 6) in the joint region showed the efficiency of the additional plates. For instance, the yielding occurred earlier in SC1 at these positions. This can be explained by the fact that the stirrups of the specimen SC1 contributed directly to the shear resistance while those of specimen SC2 were open-loop stirrups, which were non-structural reinforcements. The efficiency of the additional plates is also seen in the crack pattern (Figure 7 and Figure 8). Indeed, the number of cracks and the crack openings were more important at the joint panel in specimen SC1. One can conclude that the steel plates can replace the shear resisting stirrups in a joint panel.
The order of the yielding at the location of strain gauges D2 and D3 indicates that the use of the embedded steel allowed for the force from the beam to the column to spread. The yielding at D3’s location took place before the one at D2’s location proves that the embedded steel profile changed the distribution of the column bending moment, as well as the way the force was transferred from the steel beam to the column. Indeed, the yielding at D2 after the one at D3 means that the force acting from the longitudinal rebar on concrete via the strut-and-tie mechanism decreased in the joint region. Thus, the risk of concrete failure in the joint region was less in specimen SC2 than specimen SC1.
Looking at the location of strain gauge T2, the yielding occurred early in specimen SC1 (at 1.52% drift) but very late in specimen SC2 (at 3.92%). This is to say that the force transmission from the embedded profile to the RC column was not the same in the two specimens. In specimen SC1, the point R1 located in the web of the embedded profile was subjected to a significant tensile force (compared to specimen SC2) from the upper flange of the steel beam. As a result, the yielding at R1 took place earlier, which caused the additional tensile force in the stirrups. Furthermore, there were more diagonal cracks around the location of T2 in specimen SC1 than specimen SC2. On the other hand, in specimen SC2, because of the two additional plates, the stiffness was locally reinforced at the joint region; therefore, although the transmitted force of the beam was larger, the embedded steel part in specimen SC2 could spread the force in a distributed way to the surrounding concrete. This explains why the yielding at the locations of T2 and T3 of the specimen SC2 occurred almost at the same applied load. Meanwhile, the yielding at the location of T3 of specimen SC1 took place later, namely at 4.35% drift, because the embedded steel part was not stiff enough to spread the force in a distributed way to the surrounding concrete.
4.4. Stiffness Deterioration
Due to concrete cracking and material yielding during the cyclic loading, the stiffness of the elements decreased, this phenomenon is known as stiffness degradation. In this study, the stiffness degradation was assessed using the secant stiffness determined from each complete hysteresis loop. The secant stiffness was determined using the slope of a line passing through the peak loads at both directions. It represents the ability to resist deformation. The stiffness degradation ratio versus drift is demonstrated in Figure 12 and Table 4.
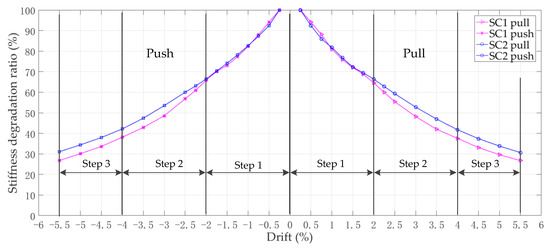
Figure 12.
Stiffness degradation ratio.
Table 4.
Joint-stiffness degradation.
It was observed that the joint stiffness gradually degraded. There was no sudden drop in stiffness. This means that the local failures did not affect the global behavior of the joint. It can be seen that up to 2% drift, the stiffnesses of the specimens were almost the same. After 2% drift, the stiffness of specimen SC2 degraded less than specimen SC1. This was in agreement with the order of yielding points presented in Section 4.3. At the high drift levels, the stiffness of specimen SC2 was about 16.2% greater than that of specimen SC1. At the end of the test, this value was about 21.2%. This highlights the contribution of the supplementary plates on the joint stiffness.
4.5. Energy Dissipation
The energy dissipation characteristics of a member are an important measure of its seismic performance. The energy dissipation in each cycle was calculated from the enclosed area within the hysteresis loop for each cycle. The cumulative energy dissipation was computed by summing the energy dissipated in previous cycles. Figure 13 presents the definition of the dissipated energy of one hysteresis loop and the maximum dissipated energy that could be theoretically dissipated within the same load and displacement limits, assuming a perfectly plastic response. The dissipated energy is illustrated as the black solid hatched area.
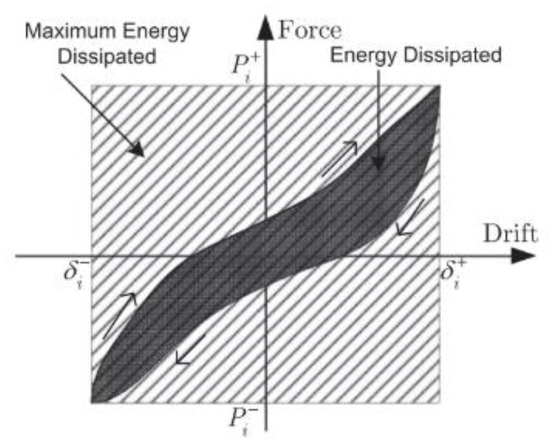
Figure 13.
Definition of energy dissipation.
Figure 14a presents the cumulated dissipated energy at each drift level, including the total cumulated dissipated energy. Figure 14b shows the energy dissipation ratio at each displacement level where two loading cycles were performed. For the drift levels under 2%, the dissipated energy slowly increased with respect to the loading cycle. However, the dissipated energy ratio was smaller than 10%, which shows there was a linear relationship between the drift and the joint-bending moment. During step 2, from 2% to 4% drift, the dissipated energy quickly increased. This can be explained by the fact that the yielding points in steel in step 1 became the yielding regions in step 2, where the energy dissipated during cyclic loading.
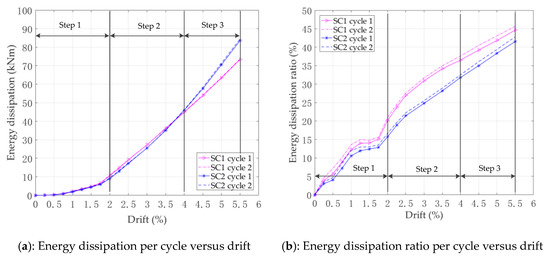
Figure 14.
Energy dissipation for each cycle.
During loading step 2, the dissipated energy of specimen SC1 was 4.8% greater than specimen SC2. As for loading step 3, the dissipated energy increased for both specimens but was 9.5% more for specimen SC2. According to Figure 11, the embedded steel profile of SC1 yielded at 1–2% drift; therefore, from 2–4% drift, the yielded region propagation resulted in the high energy dissipation ratio. The embedded steel profile of SC2 yielded at 1.5–4% drift. Thus, after 4% drift, the yielded region was still able to propagate, resulting in the high energy dissipation ratio during loading step 3. As can be seen from Figure 14b, from the beginning to the end of the test, the energy dissipation ratio of SC1 was greater than SC2. This was due to the steel yielding taking place earlier in SC1 than in SC2. Therefore, after 4% drift, the energy dissipation ratio of SC1 slowly increased, while that of SC2 quickly increased. At the end of the test (5.5% drift), the energy dissipation ratio of SC2 tended toward that of SC1.
Figure 15 and Table 5 present the cumulative energy dissipation of the two specimens, SC1 and SC2. One can observe that between both specimens, there was almost no difference. As expected, the energy dissipation was small when the drift was smaller than 2% and quickly increased at higher drifts. At the end of the test, the total cumulative energy dissipation in SC2 was 3.5% more compared to SC1. Therefore, the use of the additional plates instead of structural stirrups did not change considerably the energy dissipation capacity of the structure Moreover, at the high level of drift, the additional plates favored the formation of yielding regions, resulting in the high energy dissipation capacity of the structure.
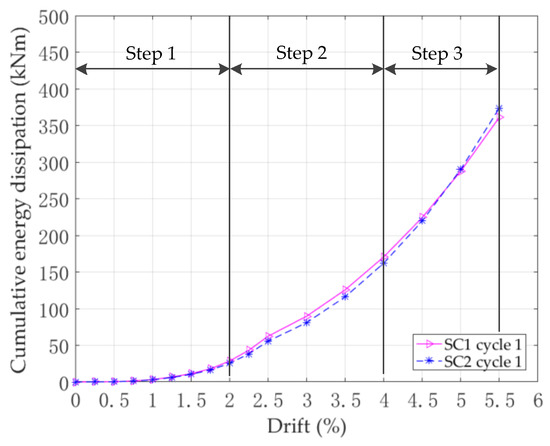
Figure 15.
Cumulative energy dissipation versus drift.
Table 5.
Cumulative energy dissipation.
4.6. Ductility
The ductility of a structure is evaluated using the amount of energy that may be dissipated through plastic deformations. The ductility concept is used in the practice of seismic-resistant design and allows, depending on the used structural system, for a reduction in the seismic forces and can control the level of damage produced during medium and strong earthquakes. The displacement ductility of the specimen is represented by the displacement ductility factor m, which is defined as the ratio of ultimate displacement du to the yield displacement dy. These displacements are determined from the envelope curve of the hysteresis loops (Figure 11). The ultimate displacement is defined as displacement corresponding to a 15% drop in the loading capacity. The yield displacement of a specimen is determined based on the general yielding method, as shown in Figure 16. An elastic behavior occurs where the initial tangent stiffness intersects the horizontal line passing the peak strength at point A. A vertical line passing the point A intersects the load–displacement envelope curve at point B. A secant line passing the point O and the point B intersects the horizontal peak strength line at point C. A vertical line passing point C intersects the envelope curve at point D, which is the yielding point [17].
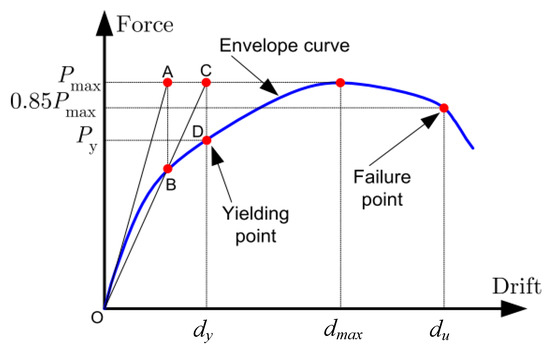
Figure 16.
Definition of the yield point according to the general yielding method.
As can be seen in Table 6, specimen SC1 reached the yielding point before specimen SC2. For instance, specimen SC1 yielded at 2.1% drift, which corresponded to a joint-bending moment of 671.8 kNm, while specimen SC2 yielded at 2.4% drift (a 15.8% increase compared to SC1), which corresponded to a joint-bending moment of 791 kNm (a 17.7% increase compared to SC1). In correlation with the yielding of the embedded steel profile, one can see that the yielding point of the specimen was at about the same load level of the yielding of the steel web panel in shear. As a result, the use of additional plates in the joint region improved the shear resistance, and thus, the joint resistance. After reaching the yielding point, the bending-resistance moment of both specimens kept increasing. Compared with the bending moment at the yielding point, the ultimate bending moment increased by about 14.4% in specimen SC1 and about 16.2% in specimen SC2. This ratio is an important response characteristic of the specimen and is called the specimen load sustainability. Furthermore, the ultimate bending moment of SC2 was 19.6% higher than that of SC1. At the yielding point, compared to the initial stiffness, the specimen SC1 lost about 36.7% stiffness at the yielding point and about 62.1% at the ultimate point. As for specimen SC2, these values were 39.5% and 65.9%, respectively.
Table 6.
Joint-bending moment and drift at different characteristic points.
Note that the test ended at 5.5% drift. At this drift level, compared to the ultimate point, the bending-resistance moment decreased by 2.8% in specimen SC1 and 0.5% in specimen SC2, despite the lower value of the drift when the bending-resistance moment decreased to 85% of the ultimate moment. Nevertheless, one can see that the tested specimens had a ductility coefficient greater than 2.5%. According to Eurocode 8, it can be concluded that the studied RCS joint can be used as a dissipative element in ductility class medium (DCM) structures. It should be noted that to study the force transfer mechanism from the beam to the column via an embedded steel profile, the tested specimens were designed to avoid failure in the steel beam. As a result, the ductility of the steel beam was not exploited. Therefore, the ductility coefficient obtained from these tests was not representative of the joint.
5. Conclusions
An experimental study on the seismic performance of a novel RCS beam-column joint has been presented in this paper. The exterior RCS connection was designed with an H steel profile, which was covered by two supplementary plates embedded inside an RC column and welded to the steel beam. This type of beam-to-column joint displayed some advantages compared to the existing RCS joint in terms of resistance and construction methods. Based on the analysis of the experimental results, the following conclusions can be drawn:
- Using an encased steel profile for connecting steel beams to RC columns created several plastic hinges, which increased the ductility and energy dissipation capacity without any impact on the global behavior of structures.
- Using additional plates instead of the stirrups to resist the shear increased the joint moment-bearing capacity of the joint by 19.6%.
- The specimen using additional plates had a failure mode that showed several advantages over specimens using the stirrups to resist the shear. These advantages included fewer cracks and smaller crack openings at the joint region, and a higher energy dissipation capacity at the high drift level thanks to a more uniformly distributed force transmission from the beam to the column.
- Regarding the stiffness, the experimental results indicated that the stiffness degradation was regular and the global behavior was not impacted by local failures. The stiffness of both tested specimens was almost the same at low drift levels. However, the specimen with additional plates was 16% stiffer than the specimen using the stirrups to resist shear at high drift levels.
- Regarding the energy dissipation capacity, both specimens had a high energy dissipation ratio. The mean value of the energy dissipation ratio of the specimen using stirrups to resist the shear was about 22.3% during the test, while this value was about 19.1% for the specimen using additional plates. However, the cumulative energy dissipation of the latter was about 3.5% greater than that of the former.
- Both specimens had a great ductility coefficient (at least 2.5%). In terms of moment-bearing capacity, the specimen using additional plates was stronger than the specimen using the stirrups to resist the shear.
- From the findings of this experimental research, it can be concluded that the studied hybrid joint design was suitable for RCS structures under cyclic loads. In particular, using additional plates instead of the stirrups to resist shear in the shear joint region is feasible from both practical and mechanical points of view.
Author Contributions
D.D.L. and X.-H.N. wrote the original draft of manuscript, D.D.L. prepared and interpreted the data, and Q.-H.N. revised and edited the manuscript. All authors have read and agreed to the published version of the manuscript.
Funding
This research was funded by the Vietnam National Foundation for Science and Technology Development (NAFOSTED) under grant number 107.01-2016.06.
Conflicts of Interest
The authors declare no conflict of interest. The funders had no role in the design of the study; in the collection, analyses, or interpretation of data; in the writing of the manuscript, or in the decision to publish the results.
References
- Deierlein, G.G.; Sheikh, T.M.; Yura, J.A.; Jirsa, J.O. Beam? Column Moment Connections for Composite Frames: Part 2. J. Struct. Eng. 1989, 115, 2877–2896. [Google Scholar] [CrossRef]
- Kanno, R.; Deierlein, G.G. Design Model of Joints for RCS Frames. In Composite Construction in Steel and Concrete IV Conference 2000; American Society of Civil Engineers (ASCE): Alberta, Canada, 2000; pp. 947–958. [Google Scholar]
- Parra-Montesinos, G.; Wight, J.K. Seismic Response of Exterior RC Column-to-Steel Beam Connections. J. Struct. Eng. 2000, 126, 1113–1121. [Google Scholar] [CrossRef]
- Mirghaderi, S.R.; Eghbali, N.B.; Ahmadi, M.M. Moment-connection between continuous steel beams and reinforced concrete column under cyclic loading. J. Constr. Steel Res. 2016, 118, 105–119. [Google Scholar] [CrossRef]
- Zhang, X.; Zhang, J.; Gong, X.; Zhang, S. Seismic performance of prefabricated high-strength concrete tube column–steel beam joints. Adv. Struct. Eng. 2017, 21, 658–674. [Google Scholar] [CrossRef]
- ASCE Task Committee on Design Criteria for Composite Structures in Steel and Concrete. Guidelines for design of joints between steel beam and reinforced concrete columns. J. Struct. Eng. 1994, 120, 2330–2357. [Google Scholar] [CrossRef]
- Nishiyama, I.; Kuramoto, H.; Noguchi, H. Guidelines: Seismic Design of Composite Reinforced Concrete and Steel Buildings. J. Struct. Eng. 2004, 130, 336–342. [Google Scholar] [CrossRef]
- Kuramoto, H.; Nishiyama, I. Seismic Performance and Stress Transferring Mechanism of Through-Column-Type Joints for Composite Reinforced Concrete and Steel Frames. J. Struct. Eng. 2004, 130, 352–360. [Google Scholar] [CrossRef]
- Li, W.; Li, Q.-N.; Jiang, W.-S.; Jiang, L. Seismic performance of composite reinforced concrete and steel moment frame structures—State-of-the-art. Compos. Part B Eng. 2011, 42, 190–206. [Google Scholar] [CrossRef]
- Tao, M.-X.; Fan, J.-S.; Nie, J.-G. Seismic behavior of steel reinforced concrete column–steel truss beam hybrid joints. Eng. Struct. 2013, 56, 1557–1569. [Google Scholar] [CrossRef]
- Zibasokhan, H.; Behnamfar, F.; Behfarnia, K. The new proposed details for moment resisting connections of steel beam to continuous concrete column. Adv. Struct. Eng. 2016, 19, 156–169. [Google Scholar] [CrossRef]
- Eghbali, N.B.; Mirghaderi, S.R. Experimental investigation of steel beam to RC column connection via a through-plate. J. Constr. Steel Res. 2017, 133, 125–140. [Google Scholar] [CrossRef]
- Somja, H.; Hjiaj, M.; Nguyen, Q.H.; Plumier, A.; Degée, H. THE SMARTCOCO DESIGN GUIDE FOR HYBRID CONCRETE-STEEL STRUCTURES. In Proceedings of the 12th international Conference on Advances in Steel-Concrete Composite Structures—ASCCS 2018, Valencia, Spain, 27–29 June 2018; pp. 749–755. [Google Scholar]
- Nguyen, X.H.; Nguyen, Q.H.; Le, D.D.; Mirza, O. Experimental Study on Seismic Performance of New RCS Connection. Structure 2017, 9, 53–62. [Google Scholar] [CrossRef]
- Nguyen, X.H.; Nguyen, Q.H.; Le, D.D. Static behavior of novel RCS through-column-type joint: Experimental and numerical study. J. Steel Compos. Struct. 2019, 32, 111–126. [Google Scholar]
- European Committee for Standardization. Eurocode 4, EN1994-1-1 Design of Composite Steel and Concrete Structures-Part 1: General Rules and Rules for Buildings; European Committee for Standardization (CEN): Brussels, Belgium, 2004. [Google Scholar]
- Li, B.; Lam, E.S.S.; Wu, B.; Wang, Y.-Y. Experimental investigation on reinforced concrete interior beam–column joints rehabilitated by ferrocement jackets. Eng. Struct. 2013, 56, 897–909. [Google Scholar] [CrossRef]


© 2020 by the authors. Licensee MDPI, Basel, Switzerland. This article is an open access article distributed under the terms and conditions of the Creative Commons Attribution (CC BY) license (http://creativecommons.org/licenses/by/4.0/).