Featured Application
This equipment enables traceable measurement of grayscale to luminance with high accuracy and can provide a standardized reference for the display of grayscale images in the fields of medicine, remote sensing, nondestructive testing, etc.
Abstract
The standardization of grayscale display is essentially significant for image signal communication, transmission, and terminal reading. The key step of this standardization is establishing a traceable equipment of grayscale. As a relative value, grayscale is transferred to two different absolute values to satisfy different traceability methods, including optical density for hardcopy image and luminance for softcopy. For luminance, a generation equipment is designed to build the relationship between luminance and grayscale. In this work, novel equipment is established using digital light processing (DLP) by time-frequency modulation, and the corresponding uncertainty is analyzed. The experiment result shows that this digital equipment builds the relationship between grayscale and luminance in the range of 0.16-4000 cd/m2. It enables traceable measurement of grayscale to luminance on this equipment with high accuracy and can provide a standardized reference for the display of grayscale images in the fields of medicine, remote sensing, non-destructive testing, etc.
1. Introduction
Grayscale is an important feature which characterizes the lightness and darkness of an image, and grayscale images are widely used in medical, remote sensing, and industrial inspection fields [1,2,3,4]. Color images can be converted to grayscale by weighting algorithm as required [5]. In recent years, it has been applied in the technology of image segmentation, target recognition, and machine vision based on differences and discontinuous changes in image grayscale [6,7,8]. Therefore, the standardization of grayscale display is essentially significant for image communication, transmission, and terminal reading.
The traditional grayscale standardization method is making or selecting a gray image as the display reference and comparing the obtained gray image with the reference to requantize the fixed value [9,10,11]. Obviously, this is limited by the complexity and fineness of the selected gray image for reference. In 2009, a grayscale standard display function (GSDF) was laid down in the Digital Imaging and Communications in Medicine (DICOM) 3.0 Standard by the American College of Radiology—National Electrical Manufacturers Association (ACR-NEMA), which is used to achieve quality control of medical imaging equipment [12]. Specially, it provides a standard model for image display in the luminance range of 0.05~4000 cd/m2 based on human visual characteristics. However, it cannot meet the needs of a wider range of luminance nor current application areas. Notably, the implementation of the standard model is not mandatory, and it is not traceable [13,14,15].
Besides DICOM, no other research discusses the standard of grayscale, especially the traceability of grayscale. The related works mainly study in two directions. One is the method to identify and distinguish the grayscale from a picture [16,17,18,19], and the other is an improvement on monitor (mostly LCD) performance compared with GSDF based on hardware or PLC [20,21,22,23]. Most research uses grayscale as a relative parameter only, without focusing on the standardization of grayscale. The traceability is a faraway work for them. However, the standardization and traceability of grayscale is crucial for the consistency of image transmission, image display on different instruments, image identification, etc. This research begins with the standardization and traceability of grayscale as it is a key step in image processing, including medical, military, and remote images.
Establishing equipment that realizes the grayscale standard display with traceability is the key to the grayscale standardization. Considering that grayscale is a discrete value, a digital light process (DLP) technology is used to solve this problem. A digital grayscale generation equipment is established by DLP, which can achieve the metrology of two-dimensional grayscale information and the calibration of a monitor by a GSDF program built into the computer. Furthermore, grayscale-to-luminance conversion measurement is performed at the terminal. Experiments show that the standard uncertainty of the measurement by this equipment has a range of 0.26~65.55 cd/m2 at the luminance range 0.16~4000 cd/m2.
2. Materials and Methods
2.1. Method
There are three steps to realize the standardization and traceability of grayscale. Firstly, the grayscale should be transmitted to an absolute value in theory, as described in Section 2.1. Secondly, a corresponding equipment should be established to realize the measurement and traceability of the theory value, as described from Section 2.2 to Section 2.4. Finally, the traceability uncertainty needs to be analyzed to accomplish the standardization, as described in Section 3.
The grayscale of an image is a relative value. For traceability research, it should be transferred to absolute value. This step is related to the image type. Hardcopy images (usually films) are mostly described by optical density [24]. Optical density includes transmission density DT and reflection density DV, and DT is defined as shown in Equation (1), where Φi is incident diffuse light flux and Φι is transmission light flux [25]. Similarly, DV is defined as shown in Equation (2), where Φr is reflection light flux [25]. We have developed a micron-scale printed density film (transmission film and reflection film) as the standard of value transmission [16]. The changes in optical density on a plane are achieved by adjusting the spatial frequency in the ways of amplitude modulation (AM) or frequency modulation (FM). Furthermore, spatial frequency is characteristic of periodic structure in space. As shown in Figure 1, different pixels in each display unit are assigned different values, and each unit is assigned the same pixel information, so it appears visually as a certain grayscale.
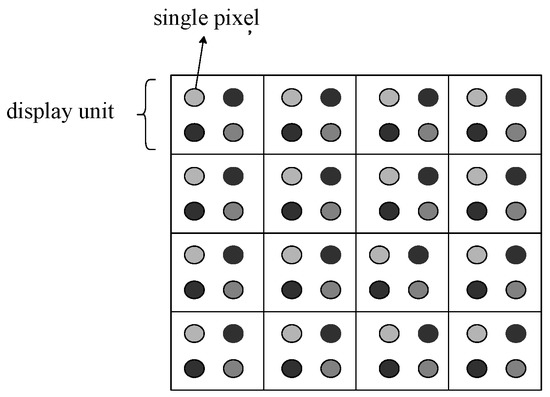
Figure 1.
Spatial frequency corresponding to hardcopy image grayscale.
For softcopy images, it is not optical density, but luminance, and the change of luminance is achieved by adjusting the time frequency. The same theory is applied in DLP technology. At the same time, image display resolution and detection precision are both improving, and real-time image processing technology is gradually maturing [26,27,28]. Consequently, digital grayscale generation equipment is established to reproduce high-resolution (bit depth) grayscale accurately, which can be regarded as grayscale-to-luminance traceability equipment, providing a measurable basis for grayscale image display standardization.
2.2. Composition and Principle
The digital grayscale generation equipment (DGGE) is shown in Figure 2. In this figure, “A” is a light source module (laser-driven light source), with characteristics of high brightness (up to 104 cd/m2) and wide bandwidth. The laser excitation mode ensures its stability. The light hits DMD through “B” (a series of lens groups), using fiber-coupled output. “C” is a DLP module, including a digital micro-mirror device (DMD) with up to 16-bit precision, drive and control circuits, etc. “D” is the projection lens that projects the outgoing light onto “E” (the luminance screen). “E” is a white polyester fluoroethylene-coated board with a diameter of 100 mm. “F” is a DC power supply, and the constant current working model is used in the equipment. “G” is a laptop for DLP control and data processing. Besides, a photometer (PR655, not labeled in Figure 2 but labeled in Figure 3) is used to measure the luminance value of the terminal output. The principle of this equipment is shown in Figure 3. The high-intensity light enters the DLP module through a series of lenses and is displayed with different luminance after being adjusted by the DMD. The light is received by the luminance screen and measured with a photometer.
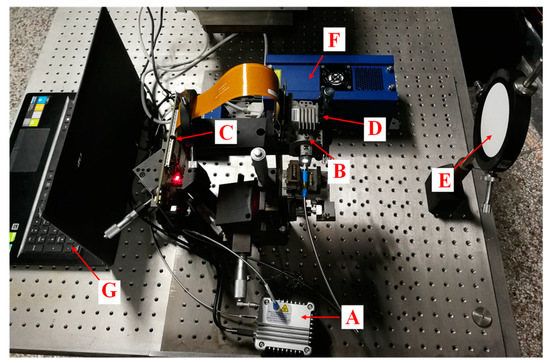
Figure 2.
Digital grayscale generation equipment (DGGE).
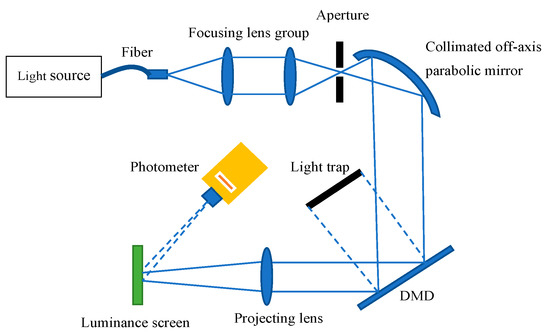
Figure 3.
Schematic diagram of DGGE.
2.3. Grayscale Standard Generation Algorithm
The core device of the DLP module is the DMD, which has the on and off states at a certain time. That is, it corresponds well to 1 and 0 of a binary image matrix. The issue of standardizing grayscale information of softcopy image can be translated into precise control of the DMD. Similar to the spatial frequency that determines the optical density of a hardcopy image, the grayscale information of softcopy image is determined by controlling the time frequency. Therefore, we conducted secondary development based on the DMD, and transformed the spatial frequency characteristics of hardcopy images to the time-frequency characteristics of softcopy images.
Specifically, the grayscale standard image generation algorithm consists of the following steps. Firstly, grayscale is quantized into numerical matrices with different bit precision, and the value is expressed in binary. Secondly, the image is layered on a corresponding bit plane, and different planes represent the information on different bit positions. Different hierarchical planes are displayed at different times during display, corresponding to the weights at different bit positions (higher bits correspond to higher weights). Lastly, the binary value is read from high to low in unit integration time, and displayed according to time-weight distribution. Thus, grayscale is achieved through the control of time frequency, and the flow chart of the grayscale generation algorithm is shown in Figure 4.
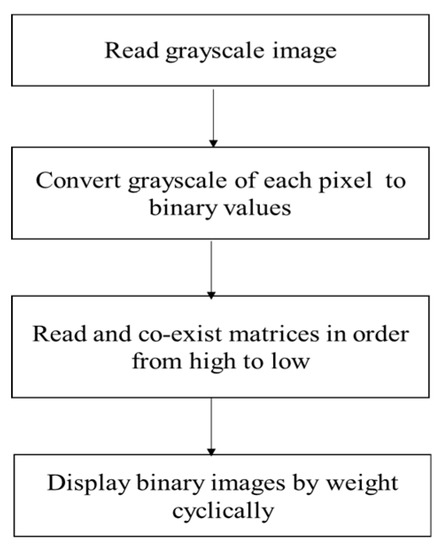
Figure 4.
Flow chart of grayscale generation algorithm.
Taking an 8-bit grayscale image with a value of 82 as example (shown in Figure 5), it is considered to be decomposed into eight binary images. The specific implementation method is to express the grayscale in eight binary numbers and then read them from high to low. Reading one bit at a time as the value of the corresponding binary image of the pixel, the 8-bit grayscale image can be decomposed into eight binary images.
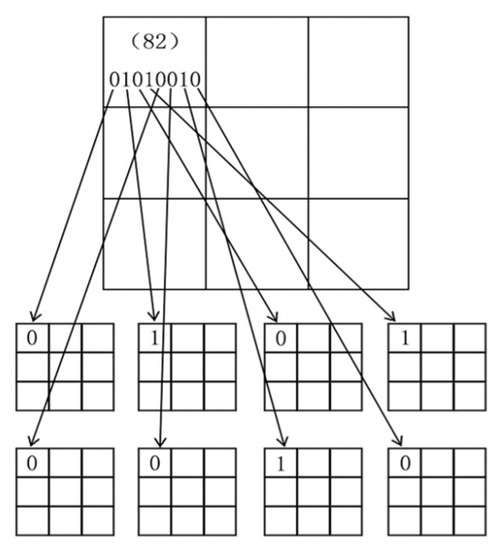
Figure 5.
Schematic diagram of gray generation algorithm.
The relevant parameters of DMD we used are shown in Table 1 (refer to the product manual provided by the manufacturer). According to the DLP characteristics used in this equipment, the integration time t is 3800 μs, so eight binary images are displayed cyclically by weight of 128t/256, 64t/256, 32t/256, 16t/256, 8t/256, 4t/256, 2t/256, 1t/256. Thus, we achieved an accurate display of the grayscale of the image. All relevant information of the DGGE is shown in Table 2.

Table 1.
Relevant parameters of DLP7000.

Table 2.
Parameters of DGGE.
2.4. Operation and Control Mechanism
The Xinlin V5 series FPGA is used in DGGE, and it communicates with the host computer via USB. The display control process is mainly managed by the host computer program, which can realize a 1~16 bit gray level display. The control process includes initialization, adjusting grayscale image, displaying grayscale image, and stopping display. We connected the DLP after power-on to the PC of the host computer, and the main interface is shown in Figure 6a. The interface is mainly composed of the grayscale preview area, control button area, and device information district. The image to be displayed is divided into six blocks, and each block can display different gray levels according to user settings. Firstly, the equipment needs to be initialized. The host computer modifies the control register on the DLP through the USB interface, so that the DLP development board enters the display preparation state. Secondly, users define the precision and content of the grayscale image to be displayed. If 8-bit is selected, the grayscale image has 256 gray levels, and users can then set the gray value of the six subareas in the preview area separately. Lastly, the approximate distribution of the generated grayscale image can be observed through the preview window, as shown in Figure 6(b). We downloaded this image to the onboard memory of the DLP, and after the data transfer was complete, the DLP displayed the grayscale image according to the preset display mode. In this way, we achieved accurate control and output of each gray level, and the luminance of the output image is measured through a photometer.

Figure 6.
PC control interface. (a)Main interface of the program; (b) Grayscale preview interface.
3. Results
3.1. Uncertainty Analysis
We analyzed the measurement uncertainty u(Lm) on the DGGE. Different grayscales are generated from the unique light source by DLP in the sequence algorithm as described in Section 2.3; the uncertainty of grayscale (relative luminance) generation of DGGE is related to the stability of the light source ΔLr and the uniformity of the luminance screen ΔLu. Furthermore, the grayscale must be traced to luminance by photometer, so the uncertainty of the photometer measurement result ΔLP should be considered. Thus, the uncertainty model of grayscale (No., n) ΔLn from DGGE can be described by:
where N means the maximum grayscale number (corresponding to bit depth).
This means there are three main sources of uncertainty; u(Sr) is the uncertainty from the stability of the light source ΔLr, u(Su) is the uncertainty from the uniformity of the luminance screen ΔLu, and u(Lp) is the uncertainty from the photometer measurement result ΔLP.
(1) u(Sr)—The uncertainty from the stability of the light source ΔLr
According to the digital control mode of the equipment, the light source works at a fixed working current, and its emission degree is also determined. We set all control bits of the DMD to “1”, that is, the luminance of the light source projected onto the whiteboard is the maximum, and the grayscale corresponds to 255 (8-bit precision). The amount of change in the luminance of the projection whiteboard at 1 h was measured as the stability of the light source. The measurement interval is 5 min, and the measurement results are shown in Table 3.

Table 3.
Stability of the light source.
The stability of the light source calculated according to Bessel’s formula is:
where Li represents each luminance measurement result, represents the average of the results, and n is the number of measurements (which is 13).
(2) u(Su)—The uniformity of the luminance screen ΔLu
According to the field of view and distance of the calibrated photometer, the size of the luminance area can be estimated. The whiteboard on the projection surface is a circular area with a diameter of 100 mm. Considering the influence of aberrations, an area with a diameter of 30 mm is selected as the calibration plane. As shown in Table 4, the uncertainty of the luminance uniformity of the screen of Φ30 mm when measuring the 255th gray level was taken as the result. The position mark on the luminance screen is shown in Figure 7.

Table 4.
Uniformity of the luminance screen.
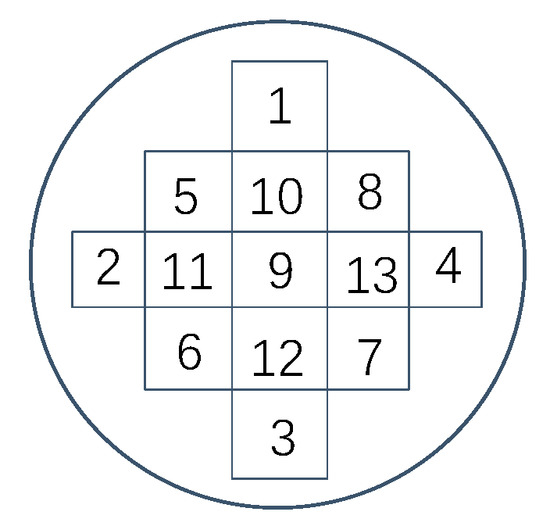
Figure 7.
Schematic diagram of the measurement position.
The uniformity calculation formula can be expressed as:
where Li represents the luminance of the i-th position (position 2 is selected here), and L0 represents the luminance at the center of the measurement area (corresponding to position 9). It can be calculated as:
(3) u(Lp)—The uncertainty from the photometer measurement result ΔLP
Both the output of the digital grayscale generation equipment and the display curve of the calibrated image are characterized by luminance. The calibration process is also determined by the luminance range, so the luminance measurement uncertainty of the photometer is the main source of uncertainty, and its value is given by the calibration of the photometer. According to the calibration certificate of photometer given by the National Institute of Metrology (NIM), its extended uncertainty is 2% (k = 2). The traceability is achieved at maximum luminance Lmax (4000 cd/m2), so u(Lp) should be:
It should be noted that DLP uses digital technology, so it can be considered to have no uncertainty. The above uncertainty compositions are summarized as shown in Table 5.

Table 5.
Summary of uncertainty compositions.
The combined standard uncertainty is:
3.2. Analysis of Luminance Measurement Result
Based on the high-brightness light source and attenuator, we control the output luminance range from 0.16~4000 cd/m2. That is, theoretically, the output luminance corresponding to 0 gray level is 0.16 cd/m2, while 255 gray level corresponds to 4000 cd/m2. Then, some typical gray levels are set, and the luminance is measured by the photometer PR655. As shown in Table 6, the corresponding uncertainty is calculated, and experimental data show that all measurements meet expectations.

Table 6.
Luminance and standard uncertainty corresponding to some typical gray levels.
4. Discussion
From the measurement result and corresponding analysis of the property of the DGGE, it is determined to have desirable luminance output in the range of 0.16~4000 cd/m2. Furthermore, the standard uncertainty of the measurement by DGGE has a range of 0.26~65.55 cd/m2 at the luminance range. From this result, it is found that the methods of equipment building and the corresponding measurement are key to the standardization and traceability of grayscale. These methods influence the uncertainty of grayscale, which is equal to the standardization. Furthermore, the calibration and processing methods of luminance data are also needed for the traceability of grayscale, which we elaborate in another published paper [29].
5. Conclusions
The digital standard grayscale generation equipment is firstly established in the National Institute of Metrology, China. It can provide a traceable grayscale value for the standardization of the terminal image of imaging equipment. Images are represented in grayscale, which is traceable to national luminance benchmarks. Thus, the images are consistent in different instruments, and they can be transmitted consistently and identified in one mode. Notably, the characteristics of human vision and machine vision are combined when establishing a measurable quality control method. The innovation of this method is that it is not limited to the imaging function or category, and it is directly calibrated and standardized from the output. Thus, the DGGE can provide a standardized platform for resource sharing in medical, remote sensing, military, and nondestructive testing images, among others.
Author Contributions
Conceptualization, Z.L. (Zilong Liu), Y.L., and J.L.; methodology, Y.J.; software, Y.L.; validation, Z.L. (Zilong Liu), Z.L. (Zhuoran Li), and J.L.; formal analysis, Y.L.; investigation, Z.L. (Zhuoran Li); resources, Z.L. (Zilong Liu) and Z.Z.; data curation, Y.L.; writing—original draft preparation, Y.J.; writing—review and editing, Z.L. (Zilong Liu) and N.L.; visualization, J.L.; supervision, J.L. All authors have read and agree to the published version of the manuscript.
Funding
This work was supported in part by the National Natural Science Foundation of China (NSFC) under Grant 61875180 and in part by the National Key Research and Development Program of China under Grant 2017YFF0205103.
Conflicts of Interest
The authors declare no conflict of interest.
References
- Digital Imaging and Communications in Medicine (DICOM) PS3. 3. Information Object Definitions National Electrical Manufacturers Association. 2009. Available online: https://www.dicomstandard.org/current/ (accessed on 25 January 2020).
- Li, J.; Fu, Y.; Li, G.; Liu, Z. Remote sensing image compression in visible/near-infrared range using heterogeneous compressive sensing. IEEE J. Sel. Top. Appl. Earth Observ. Remote Sens. 2018, 99, 1–19. [Google Scholar] [CrossRef]
- Reza, H.P.R.; Rezaie, A.H.; Sadeghi, S.H.H.; Moradi, M.H.; Ahmadi, M. A density-based fuzzy clustering technique for non-destructive detection of defects in materials. NDT E Int. 2007, 40, 337–346. [Google Scholar] [CrossRef]
- Li, J.; Liu, Z. Optical focal plane based on MEMS light lead-in for geometric camera calibration. Microsyst. Nanoeng. 2017, 3, 17058. [Google Scholar] [CrossRef]
- Hua, X. Human computer interactions for converting color images to gray. Neurocomputing 2012, 85, 1–5. [Google Scholar] [CrossRef]
- Sun, G.; Zhang, A.; Wang, Z. Grayscale image segmentation using multilevel thresholding and nature-inspiredlgorithms. In Hybrid Soft Computing for Image Segmentation; Bhattacharyya, S., Dutta, P., De, S., Klepac, G., Eds.; Springer: Berlin, Germany, 2016. [Google Scholar]
- Greene, W.N.; Zhang, Y.; Lu, T.T.; Chao, T.H. Feature extraction and selection strategies for automated target recognition. In Proceedings of the Independent Component Analyses, Wavelets, Neural Networks, Biosystems, & Nanoengineering VIII. International Society for Optics and Photonics, Orlando, FL, USA, 7–9 April 2010. [Google Scholar]
- Theriault, D.H.; Walker, M.L.; Wong, J.Y.; Betke, M. Cell morphology classification and clutter mitigation in phase-contrast microscopy images using machine learning. Mach. Vis. Appl. 2011, 23, 659–673. [Google Scholar] [CrossRef]
- Fahnestock, J.D.; Schowengerdt, R.A. Spatially variant contrast enhancement using local range modification. Opt. Eng. 1983, 22, 378–381. [Google Scholar] [CrossRef]
- Phillips, P.J.; Vardi, Y. Efficient illumination normalization of facial images. Pattern Recognit. Lett. 1996, 17, 921–927. [Google Scholar] [CrossRef]
- Al-Osaimi, F.R.; Bennamoun, M.; Mian, A. Illumination normalization of facial images by reversing the process of image formation. Mach. Vis. Appl. 2011, 22, 899–911. [Google Scholar] [CrossRef]
- Rosslyn, Digital Imaging and Communications in Medicine (DICOM) Part 14: Grayscale Standard Display Function; National Electrical Manufacturers Association: Rosslyn, VA, USA, 2009.
- Tanaka, N.; Naka, K.; Sueoka, M.; Higashida, Y.; Morishita, J. Application of the grayscale standard display function to general purpose liquid-crystal display monitors for clinical use. Jpn. J. Radiol. Technol. 2010, 66, 25–32. [Google Scholar] [CrossRef][Green Version]
- Kimpe, T.; Deroo, D.; Xthona, A. Current challenges in DICOM GSDF calibration for medical displays. Med. Phys. 2006, 33, 2209. [Google Scholar] [CrossRef]
- Kimpe, T.; Rostang, J.; Van Hoey, G.; Xthona, A. Color standard display function: A proposed extension of DICOM GSDF. Med. Phys. 2016, 43, 5009. [Google Scholar] [CrossRef] [PubMed]
- Leong, D.L.; Rainford, L.; Haygood, T.M.; Whitman, G.J.; Tchou, P.M.; Geiser, W.R.; Carkaci, S.; Brennan, P.C. Verification of DICOM GSDF in complex backgrounds. J. Digit. Imaging 2012, 25, 662–669. [Google Scholar] [CrossRef] [PubMed]
- Jones, D.M. Utilization of DICOM GSDF to modify lookup tables for images acquired on film digitizer. J. Digit. Imaging 2006, 19, 167–171. [Google Scholar] [CrossRef] [PubMed]
- Yan, Y.L.; Desvignes, T.; Bremiller, R.; Wilson, C.; Dillon, D.; High, S.; Draper, B.; Buck, C.L.; Postlethwait, J. The gonadal soma controls ovarian follicle proliferation through Gsdf in zebrafish. Dev. Dyn. 2017, 246, 925–945. [Google Scholar] [CrossRef]
- Kimpe, T.; Rostang, J.; Hoey, G.V.; Xthona, A. WE-D-204–04: Color Standard Display FUNCTION (CSDF): A proposed extension of DICOM GSDF. Med. Phys. 2015, 42, 3670. [Google Scholar] [CrossRef]
- Mckenney, S.; Bevins, N.; Olariu, E.; Flynn, M. A Six-Year longitudinal evaluation of the DICOM GSDF conformance stability of LCD monitors. Med. Phys. 2015, 42, 3670. [Google Scholar] [CrossRef]
- Yoshimura, K.; Nihashi, T.; Ikeda, M.; Ando, Y.; Kawai, H.; Kawakami, K.; Kimura, R.; Okada, Y.; Okochi, Y.; Ota, N.; et al. Comparison of liquid crystal display monitors calibrated with gray-scale standard display function and with γ 2.2 and iPad: Observer performance in detection of cerebral infarction on brain CT. AJR Am. J. Roentgenol. 2013, 200, 1304–1309. [Google Scholar] [CrossRef]
- Matsuyama, M.; Takahashi, K.; Akamine, H.; Awamoto, S.; Nakamura, Y.; Hashimoto, N.; Morishita, J. When should we recalibrate the grayscale standard display function in different ambient lighting conditions. Med. Phys. 2010, 37, 3113. [Google Scholar] [CrossRef]
- Kuroki, H.; Katayama, R.; Sakaguchi, T.; Maeda, T.; Morishita, J.; Hayabuchi, N. Evaluation of image quality using the normalized-rank approach for primary class liquid-crystal display (LCD) monitors with different colors and resolution. Nihon Hoshasen Gijutsu Gakkai Zasshi 2010, 66, 1423. [Google Scholar] [CrossRef][Green Version]
- Liu, Z.; Chen, R.; Liao, N.; Li, Z.; Wang, Y. New standard densitometer of NIM for visual diffuse transmission density. Opt. Int. J. Light Electron Opt. 2013, 124, 3751–3755. [Google Scholar] [CrossRef]
- Liu, Z.; Li, Y.; Jiang, Y.; Li, J.; Liu, R.; Zhang, S.; Zhang, Q.; Chen, R. A new diffuse optics emitter for high visual diffuse transmission density measurement. Appl. Sci. 2019, 9, 2774. [Google Scholar] [CrossRef]
- Li, J.; Liu, Z.; Liu, P. Using sub-resolution features for self-compensation of the modulation transfer function in remote sensing. Opt. Express 2017, 25, 4018. [Google Scholar] [CrossRef]
- Thung, K.H.; Raveendran, P. A survey of image quality measures. In 2009 International Conference for Technical Postgraduates (TECHPOS); IEEE: Kuala Lumpur, Malaysia, 2009; pp. 1–4. [Google Scholar]
- Theiler, J.; Cao, G.; Bachega, L.R.; Bousan, C.A. Sparse matrix transform for hyperspectral image processing. Selected Top. Signal Process. 2011, 5, 424–437. [Google Scholar] [CrossRef]
- Liu, Z.; Jiang, Y.; Li, Y.; Li, J.; Li, Z.; Zhang, S.; Lian, Y.; Liu, R. A neural network processing method based on self-assembly equipment for optical image display standardization. IEEE Access 2019, 7, 137552–137559. [Google Scholar] [CrossRef]
© 2020 by the authors. Licensee MDPI, Basel, Switzerland. This article is an open access article distributed under the terms and conditions of the Creative Commons Attribution (CC BY) license (http://creativecommons.org/licenses/by/4.0/).