Article

Multi-Scale and Multi-Dimensional Time Series InSAR Characterizing of Surface Deformation over Shandong Peninsula, China

1
School of Geology Engineering and Geomatics, Chang’an University, Xi’an 710054, China
2
State Key Laboratory of Geo-Information Engineering, Xi’an 710054, China
3
Roy M. Huffington Department of Earth Sciences, Southern Methodist University, Dallas, TX 75275, USA
4
Qingdao Institute of Marine Geology, Qingdao 266071, China
*
Author to whom correspondence should be addressed.
Appl. Sci. 2020, 10(7), 2294; https://doi.org/10.3390/app10072294
Submission received: 11 February 2020 / Revised: 18 March 2020 / Accepted: 19 March 2020 / Published: 27 March 2020
(This article belongs to the Special Issue Advances in Ground Deformation Monitoring)

Abstract

:
Shandong peninsula, the largest peninsula of China, is prone to severe land subsidence hazards along the coastline. In this paper, we provide, for the first time, multi-scale and multi-dimensional time series deformation measurements of the entire Shandong peninsula with advanced time series Interferometric Synthetic Aperture Radar (InSAR) techniques. We derive the spatiotemporal evolutions of the land subsidence by integrating multi-track Sentinel-1A/B and RADARSAT-2 satellite images. InSAR measurements are cross validated by the independent deformation rate results generated from different SAR tracks, reaching a precision of less than 1.3 cm/a. Two-dimensional time series over the Yellow River Delta (YRD) from 2017 to 2019 are revealed by integrating time series InSAR measurements from both descending and ascending tracks. Land subsidence zones are mainly concentrated on the YRD. In total, twelve typical localized subsidence zones are identified in the cities of Dongying (up to 290 mm/a; brine and groundwater exploitation for industrial usage), Weifang (up to 170 mm/a; brine exploitation for industrial usage), Qingdao (up to 70 mm/a; aquaculture and land reclamation), Yantai (up to 50 mm/a; land reclamation) and Rizhao (up to 60 mm/a; land reclamation). The causal factors of localized ground deformation are discussed, encompassing groundwater and brine exploitation, aquaculture and land reclamation. Multi-scale surveys of spatiotemporal deformation evolution and mechanism analysis are critical to make decisions on underground fluid exploitation and land reclamation.

Graphical Abstract

1. Introduction

Land subsidence caused by either natural or anthropogenic factors has become one of the serious environmental problems around the world regarding population expansion and economic growth, among which the coastal subsidence phenomenon is reported frequently in many countries, such as in Shenzhen and Xiamen (China), Urayasu (Japan), Sibari and Venice (Italy), Houston and New Orleans (USA) [1,2,3,4,5,6,7,8]. Land subsidence makes coastal areas more vulnerable to coastal flooding, saltwater intrusion, shoreline erosion and infrastructure damage. Therefore, accurate measurements and detailed analyses are critical for natural hazard assessment and risk evaluation in the coastal regions.
Shandong peninsula (36°12′–38°12′ N, 119°30′–122°43′ E), the largest peninsula in China, is located in the east of Shandong province. The peninsula is surrounded by the Bohai Sea to the north and the Yellow Sea to the east, occupying an area of 34,000 km2. The Shandong peninsula consists of several cities with large populations and prosperous economies, including Binzhou, Dongying, Weifang, Yantai, Weihai, Qingdao and Rizhao (Figure 1). The Yellow River Delta (YRD), located between Laizhou Bay and Bohai gulf on the northern coast of Shandong peninsula, is the second largest river delta in China. However, due to the rapid urbanization, industrialization and economy growth, serious long-term subsidence of different magnitudes has occurred in this area. Firstly, overexploitation of natural groundwater resources, including fresh water and brine, has led to severe land subsidence for decades [9,10,11,12]. Abundant natural brine deposits occur in the coastal zones where many salt factories were built along the coastline of Laizhou Bay and Jiaozhou Bay. Coastlines are dominated by numerous aquaculture factories created in the bays. Subsidence in the salt and aquaculture fields may intensify storm surges and river flooding, salinate groundwater, destabilize infrastructure, and accelerate shoreline retreat. Secondly, the YRD possesses the second largest oilfield in China, Shengli oilfield, where hydrocarbon exploitation since the 1970s [13] has resulted in severe land subsidence near oil exploitation centers [13,14]. Thirdly, there are 31 bays with an area larger than 5 km2 along the coast of the peninsula. Land reclamation activities over these bays caused new land subsidence, which has raised great public concerns for the safety of structures such as harbors, highways, airport runways, and underground facilities [2,15,16].
Interferometric Synthetic Aperture Radar (InSAR) measures various surface displacements by differentiating the phase observations between two complex radar images with a centimeter to millimeter accuracy over large area. It has been an excellent technique for investigating the distribution, magnitude, and temporal changes of the earth’s surface deformation over the past two decades [17,18]. Multi-temporal InSAR techniques, such as Persistent Scatterers InSAR (PSInSAR), Small Baseline Subset (SBAS) InSAR and SqueeSAR, have been developed to map land surface displacements by minimizing temporal/spatial decorrelation and the artifacts inherent in conventional InSAR [19,20]. The advanced time series InSAR techniques have facilitated coastal land subsidence monitoring in many regions [1,2,3,4,5,21]. Moreover, the InSAR technique shows its potential in large-scale deformation monitoring, e.g., on a regional scale or national scale with the increased availability of free-of-charge and commercial SAR datasets [22,23,24]. Although the conventional ground-based methods including global positioning systems (GPS) and leveling can provide precise measurements, the lack of such measurements makes it difficult to verify the InSAR measurements.
Numerous studies have been carried out for the land subsidence monitoring over YRD in recent years [9,10,11,12,13,14,25,26]. However, a comprehensive and multi-dimensional surface deformation mapping over the YRD has not been done and the causal factors of the geohazards have not been fully explored. Moreover, there is a lack of knowledge of the spatial extent, magnitude, and temporal evolution of land subsidence and the causal factor analysis in the entire Shandong peninsula, which impedes the governments in making precise decisions concerning hazard prevention and mitigation.
In this study, comprehensive and detailed surface deformation measurements over the entire Shandong peninsula are conducted. A time series InSAR technique with multi-satellite and multi-track SAR datasets from 2016 to 2019 is employed. Two-dimensional (2-D) ground deformation in YRD is retrieved by the Multidimensional SBAS (MSBAS) technique. The temporal evolution of land subsidence and spatial deformation distribution of localized subsidence zones are also revealed. Finally, the causal factors associated with the localized subsidence are discussed.

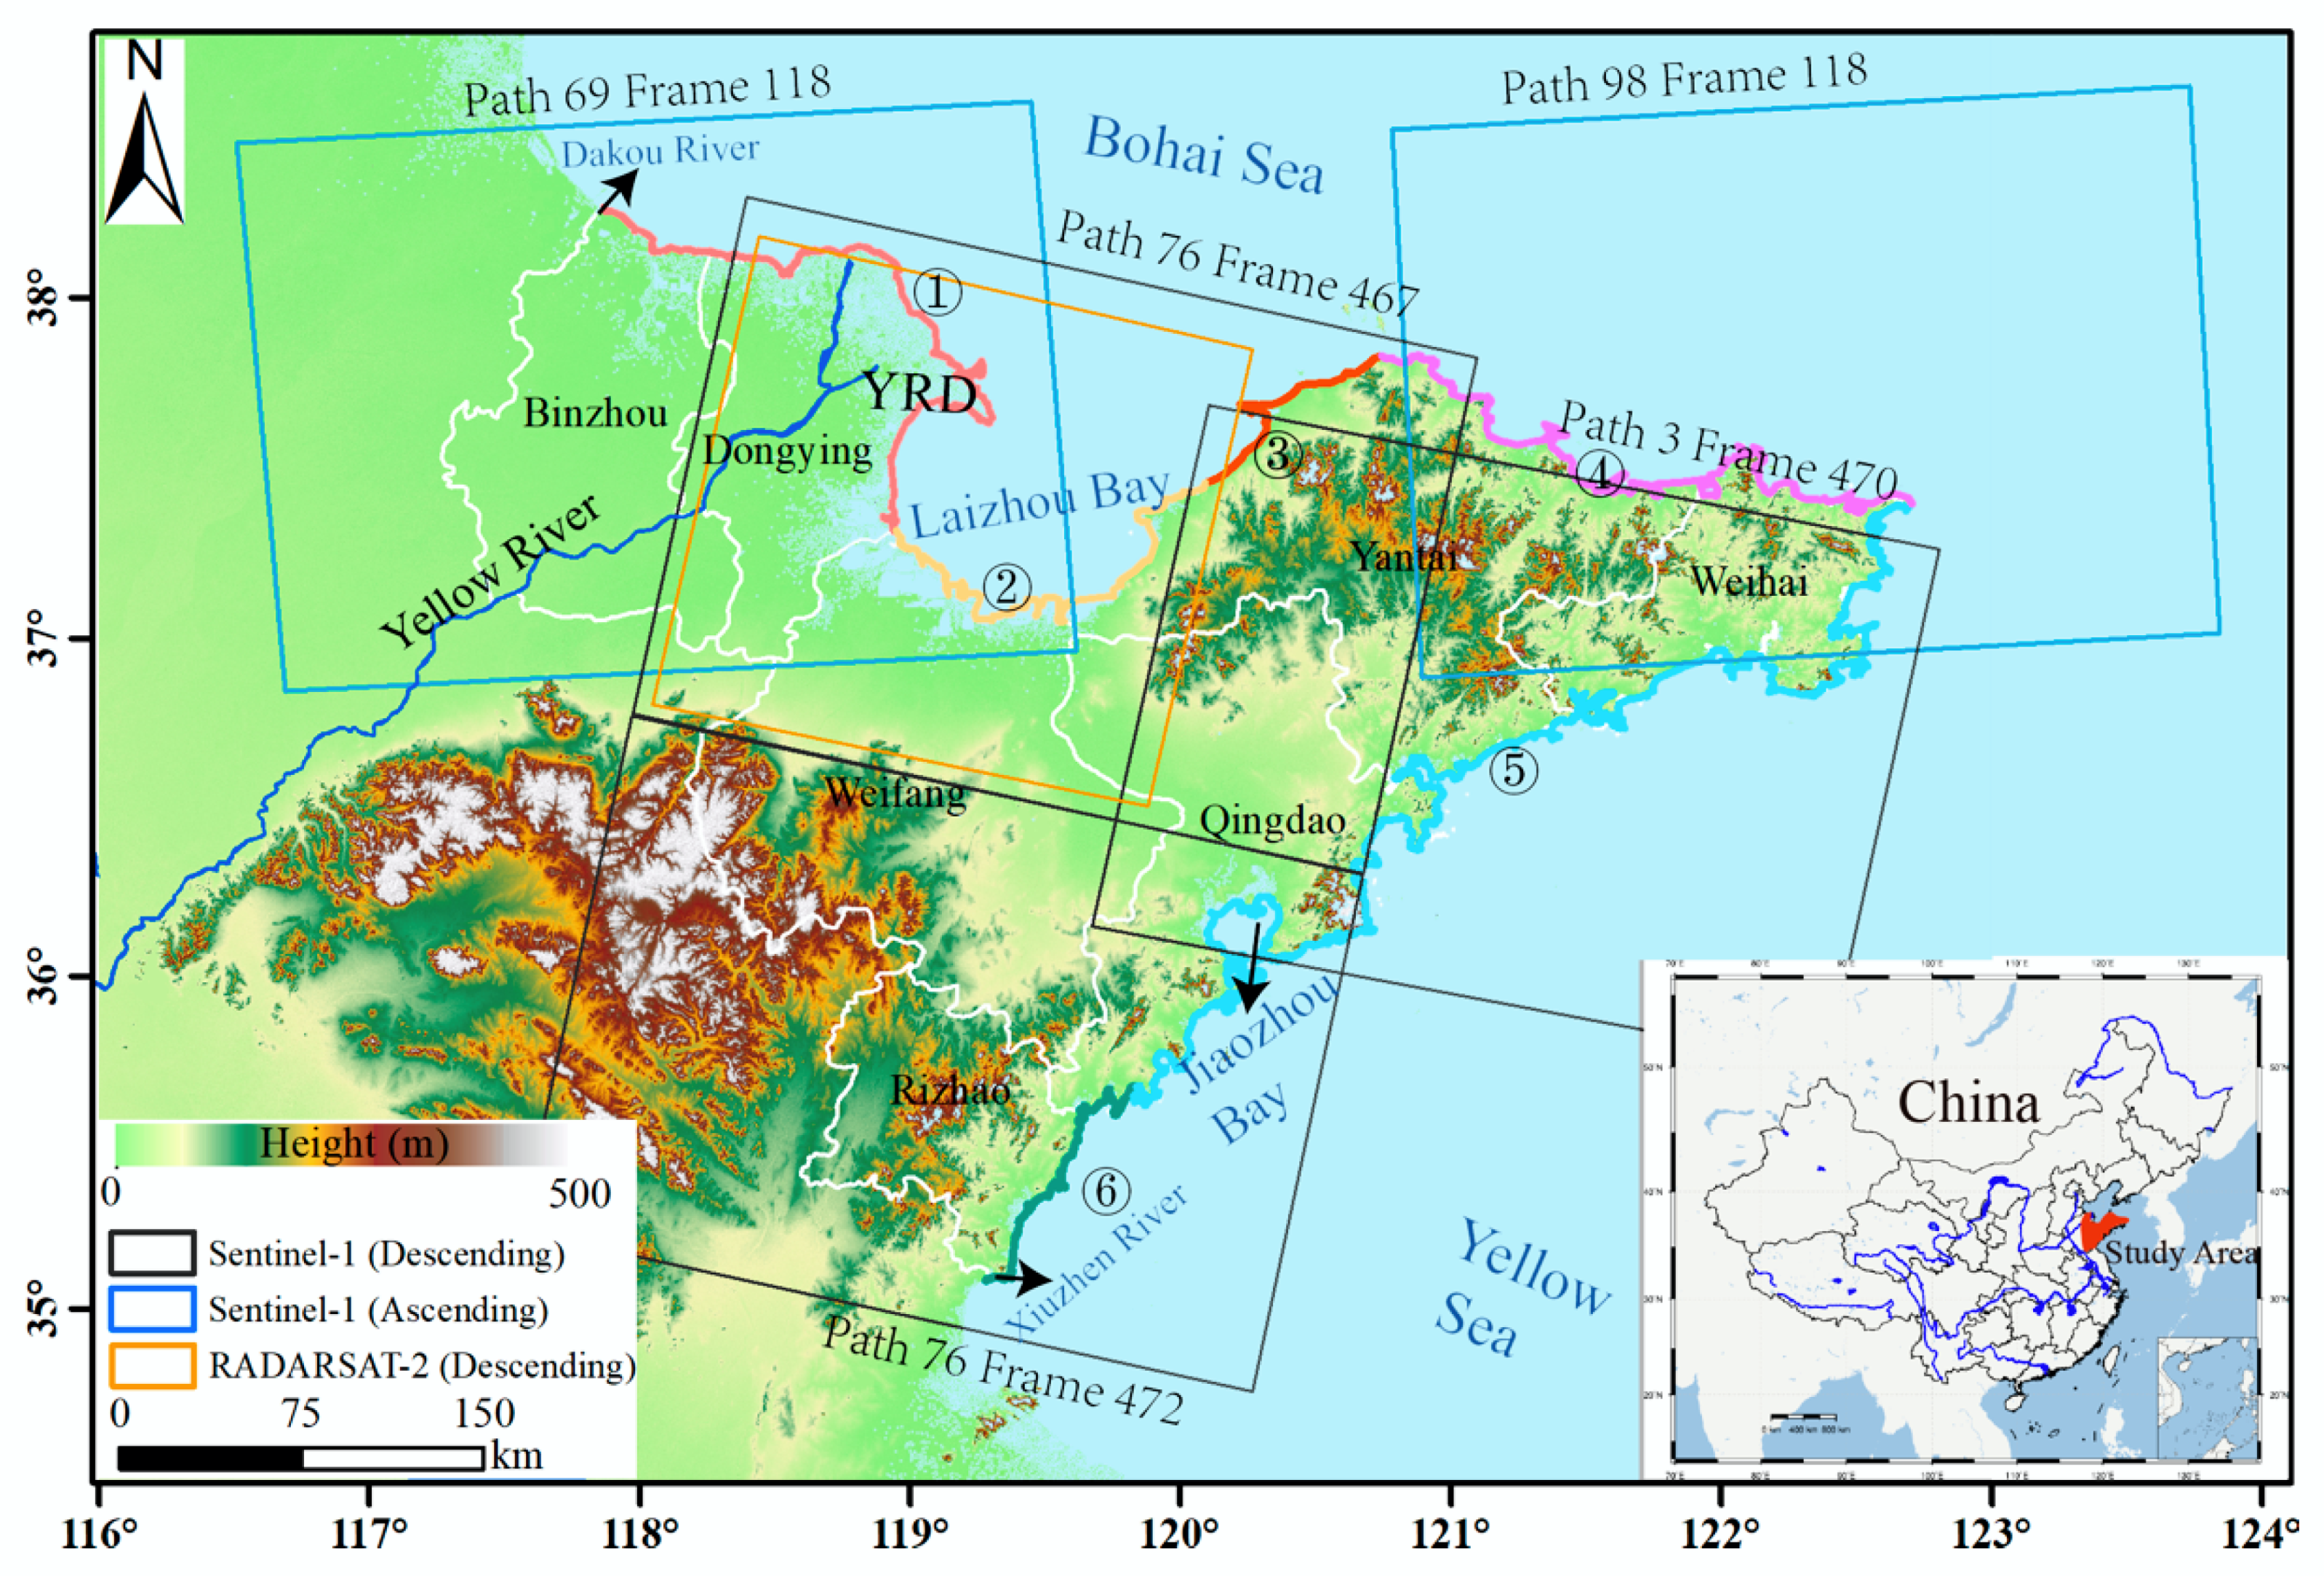
2. Study Area and Geological Settings

Shandong Province has a warm, semi-humid monsoon climate with an average annual temperature of around 12 °C, which is significantly impacted by the ocean surrounding it. The average annual precipitation is 731 mm, and 70%–80% of it is concentrated in the flood season from July to September, gradually increasing from west to east. The average annual evaporation is 1648.1 mm, and 50% of the total annual evaporation is concentrated from March to June [27].
Shandong Peninsula is surrounded by the seas on three sides. There are seven coastal prefecture-level cities in the peninsula from north to south, namely Binzhou, Dongying, Weifang, Yantai, Weihai, Qingdao and Rizhao. The coastline is ~3300 km in length from the estuary of the Dakou River in the north to the estuary of Xiuzhen in the south (Figure 1), which accounts for one-sixth of the national coastline in length. The inshore area of Shandong province is 170,000 km2, accounting for 37% of the total area of the Bohai Sea and the Yellow Sea. Most of the coasts in Shandong peninsula are formed by the rise of the crustal fault or the marine accumulation. The shoreline at the Yellow River estuary is formed by the impact of the sediment carried by the Yellow River. This area is mud flat and forms a delta with a tortuous and interstitial sandy shoreline. The ability of the river to transport sand has a significant effect on the coastal zone, and the Yellow River has the largest capacity for sediment transport [28].
Based on geological structure, river sediment transport and marine transgression, six different coastal segments (Segment ①–Segment ⑥), marked with different colored lines in Figure 1, are formed from the north to the south coastline of Shandong peninsula, according to the types of the coast and their suitability for land reclamation [29]: (1) Segment ① is a silt mud coast with a great amount of sediment input from the Yellow River for land progradation and is the best area for land reclamation; (2) Segment ② is also a silt mud coast with shallow water offshore that is suitable for large scale land reclamation; (3) Segment ③ is mainly a sandy coast with shallow or medium depth of water offshore and is suitable for land reclamation on a medium scale; (4) Segment ④ is mainly a sandy, gravely and partly rocky coast, with medium to deeper water offshore and is suitable for smaller scale land reclamation; (5) Segment ⑤ is dominated by a rocky coast with sand and gravel only in the bays; land reclamation is only suitable in the bays; (6) Segment ⑥ is characterized by a sandy coast with some rocky areas, and is also only suitable for small scale land reclamation.

3. Data and Methods

3.1. Data

We combine the Sentinel-1A/B and RADARSAT-2 satellite imageries with different geometries to study the spatiotemporal characteristics of surface deformation over the entire Shandong peninsula. Sentinel-1A/B images with five tracks are all considered, including three descending tracks and two ascending tracks. The descending tracks include Path 76 (frame 467 and 472) and Path 3 and ascending tracks include Path 98 and Path 69. A set of 137 descending Sentinel-1B scenes from Path 76 and Paths 3 and a set of 122 ascending Sentinel-1A scenes from Path 98 and Path 69 are utilized to identify the distribution of surface deformation and to derive its evolution over the entire peninsula from 2016 to 2019. To monitor the surface deformation over YRD, ascending Sentinel-1 imagery (Path 69) is utilized, which is also combined with descending data to decompose the vertical and horizontal surface deformation. To this end, a total of 66 scenes of ascending and 33 scenes of descending Sentinel-1 imagery are used. Lastly, 12 scenes of descending RADARSAT-2 images from April 2012 to June 2016 are also involved to restore the historical deformation over YRD.
One-arc-second (~30 m) SRTM DEM is used as an external DEM to remove the topographic phase from the interferograms [30]. Detailed SAR parameters are shown in Table 1.

3.2. Methods

3.2.1. 1-D Surface Deformation Derived from SBAS Technique

The SBAS technique is applied to derive deformation rate and time series in a one-dimensional (1-D) line-of-sight (LOS) direction from a set of highly coherent interferograms generated with small temporal and spatial baselines [20,31]. The SBAS technique is applied to each ascending and descending track individually to derive the deformation results based on GAMMA software [32].
Multilook average processing of ten pixels in the range and two pixels in azimuth directions for Sentinel-1 data, as well as one pixel in the range and five pixels in azimuth directions for RADARSAT-2 data, is adopted to reduce the phase noise and to obtain large scale deformation results. All Sentinel-1 interferograms are generated by setting the temporal and spatial baseline thresholds as 100 days and 200 m, respectively. Then, the differential interferograms are calculated, filtered, unwrapped and geocoded and resampled to the common grid. Differential interferograms are filtered using the adaptive filtering method based on the local fringe spectrum [33] and unwrapped by the general minimum cost flow (MCF) approach [32]. A 2-D quadratic model is used to remove the baseline residual error and to mitigate the long-wavelength artifacts of atmospheric disturbance. Then, deformation rates at highly coherent pixels in the LOS direction are derived by the stacking technique [32].

3.2.2. Multidimensional Small Baseline Subset (MSBAS) Technique

The MSBAS technique is an extension of the SBAS technique, which can simultaneously process both ascending and descending D-InSAR interferograms and produce 2-D deformation time series with dense temporal sampling and low noise, once SAR datasets cover the same region and have an overlap in the time domain [34,35,36,37]. After removing topographic phase from every interferogram and unwrapping the phase, the MSBAS method is employed to estimate the vertical and the east–west deformation time series. As space-borne SAR satellites operate in a near-polar sun-synchronous orbit, the deformation in the north–south direction can be hardly retrieved. Therefore, the multidimensional time series model can be expressed in the following equation [34].
( 4 π λ A c o s α s i n θ   4 π λ A c o s θ β I ) ( V E V U ) = ( Φ 0 )
where λ, α and θ are the radar wavelength, the azimuth angle, and the incidence angle, respectively, A is a matrix constructed from the time interval between consecutive SAR acquisitions, β is a regularization parameter, which can be determined by using the L-curve method, and I is an identity matrix. V E and V U represent the east–west and vertical components (unit: m/a) of the ground deformation rate vector during each time interval, Φ is the unwrapped interferometric phase (unit: radian) from both ascending and descending tracks. The unknown parameters V E and V U are estimated by solving the design matrix of Equation (1) via singular value decomposition (SVD) [20].
Finally, the 2-D cumulative deformation time series at the i t h acquisition is reconstructed from the deformation rates in the following manner:
d E i = i = 1 n V E i Δ t i ,   d U i = i = 1 n V U i Δ t i
where n = 1 , 2 , 3 , 2 ( k = 1 K N k 1 )   d E i and d U i are the cumulative horizontal east–west and vertical deformations, respectively, N k is the number of SAR acquisition dates from k t h SAR datasets, K is the number of different sensors, here K = 2 .

4. Results

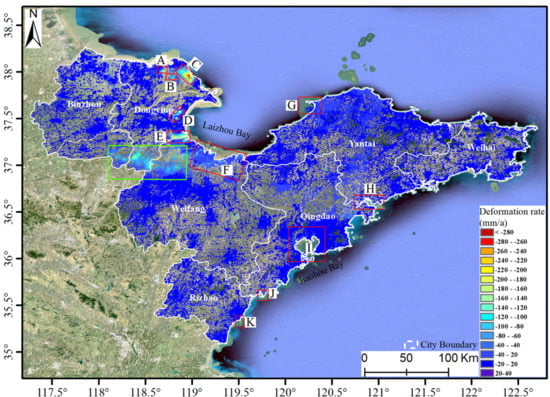
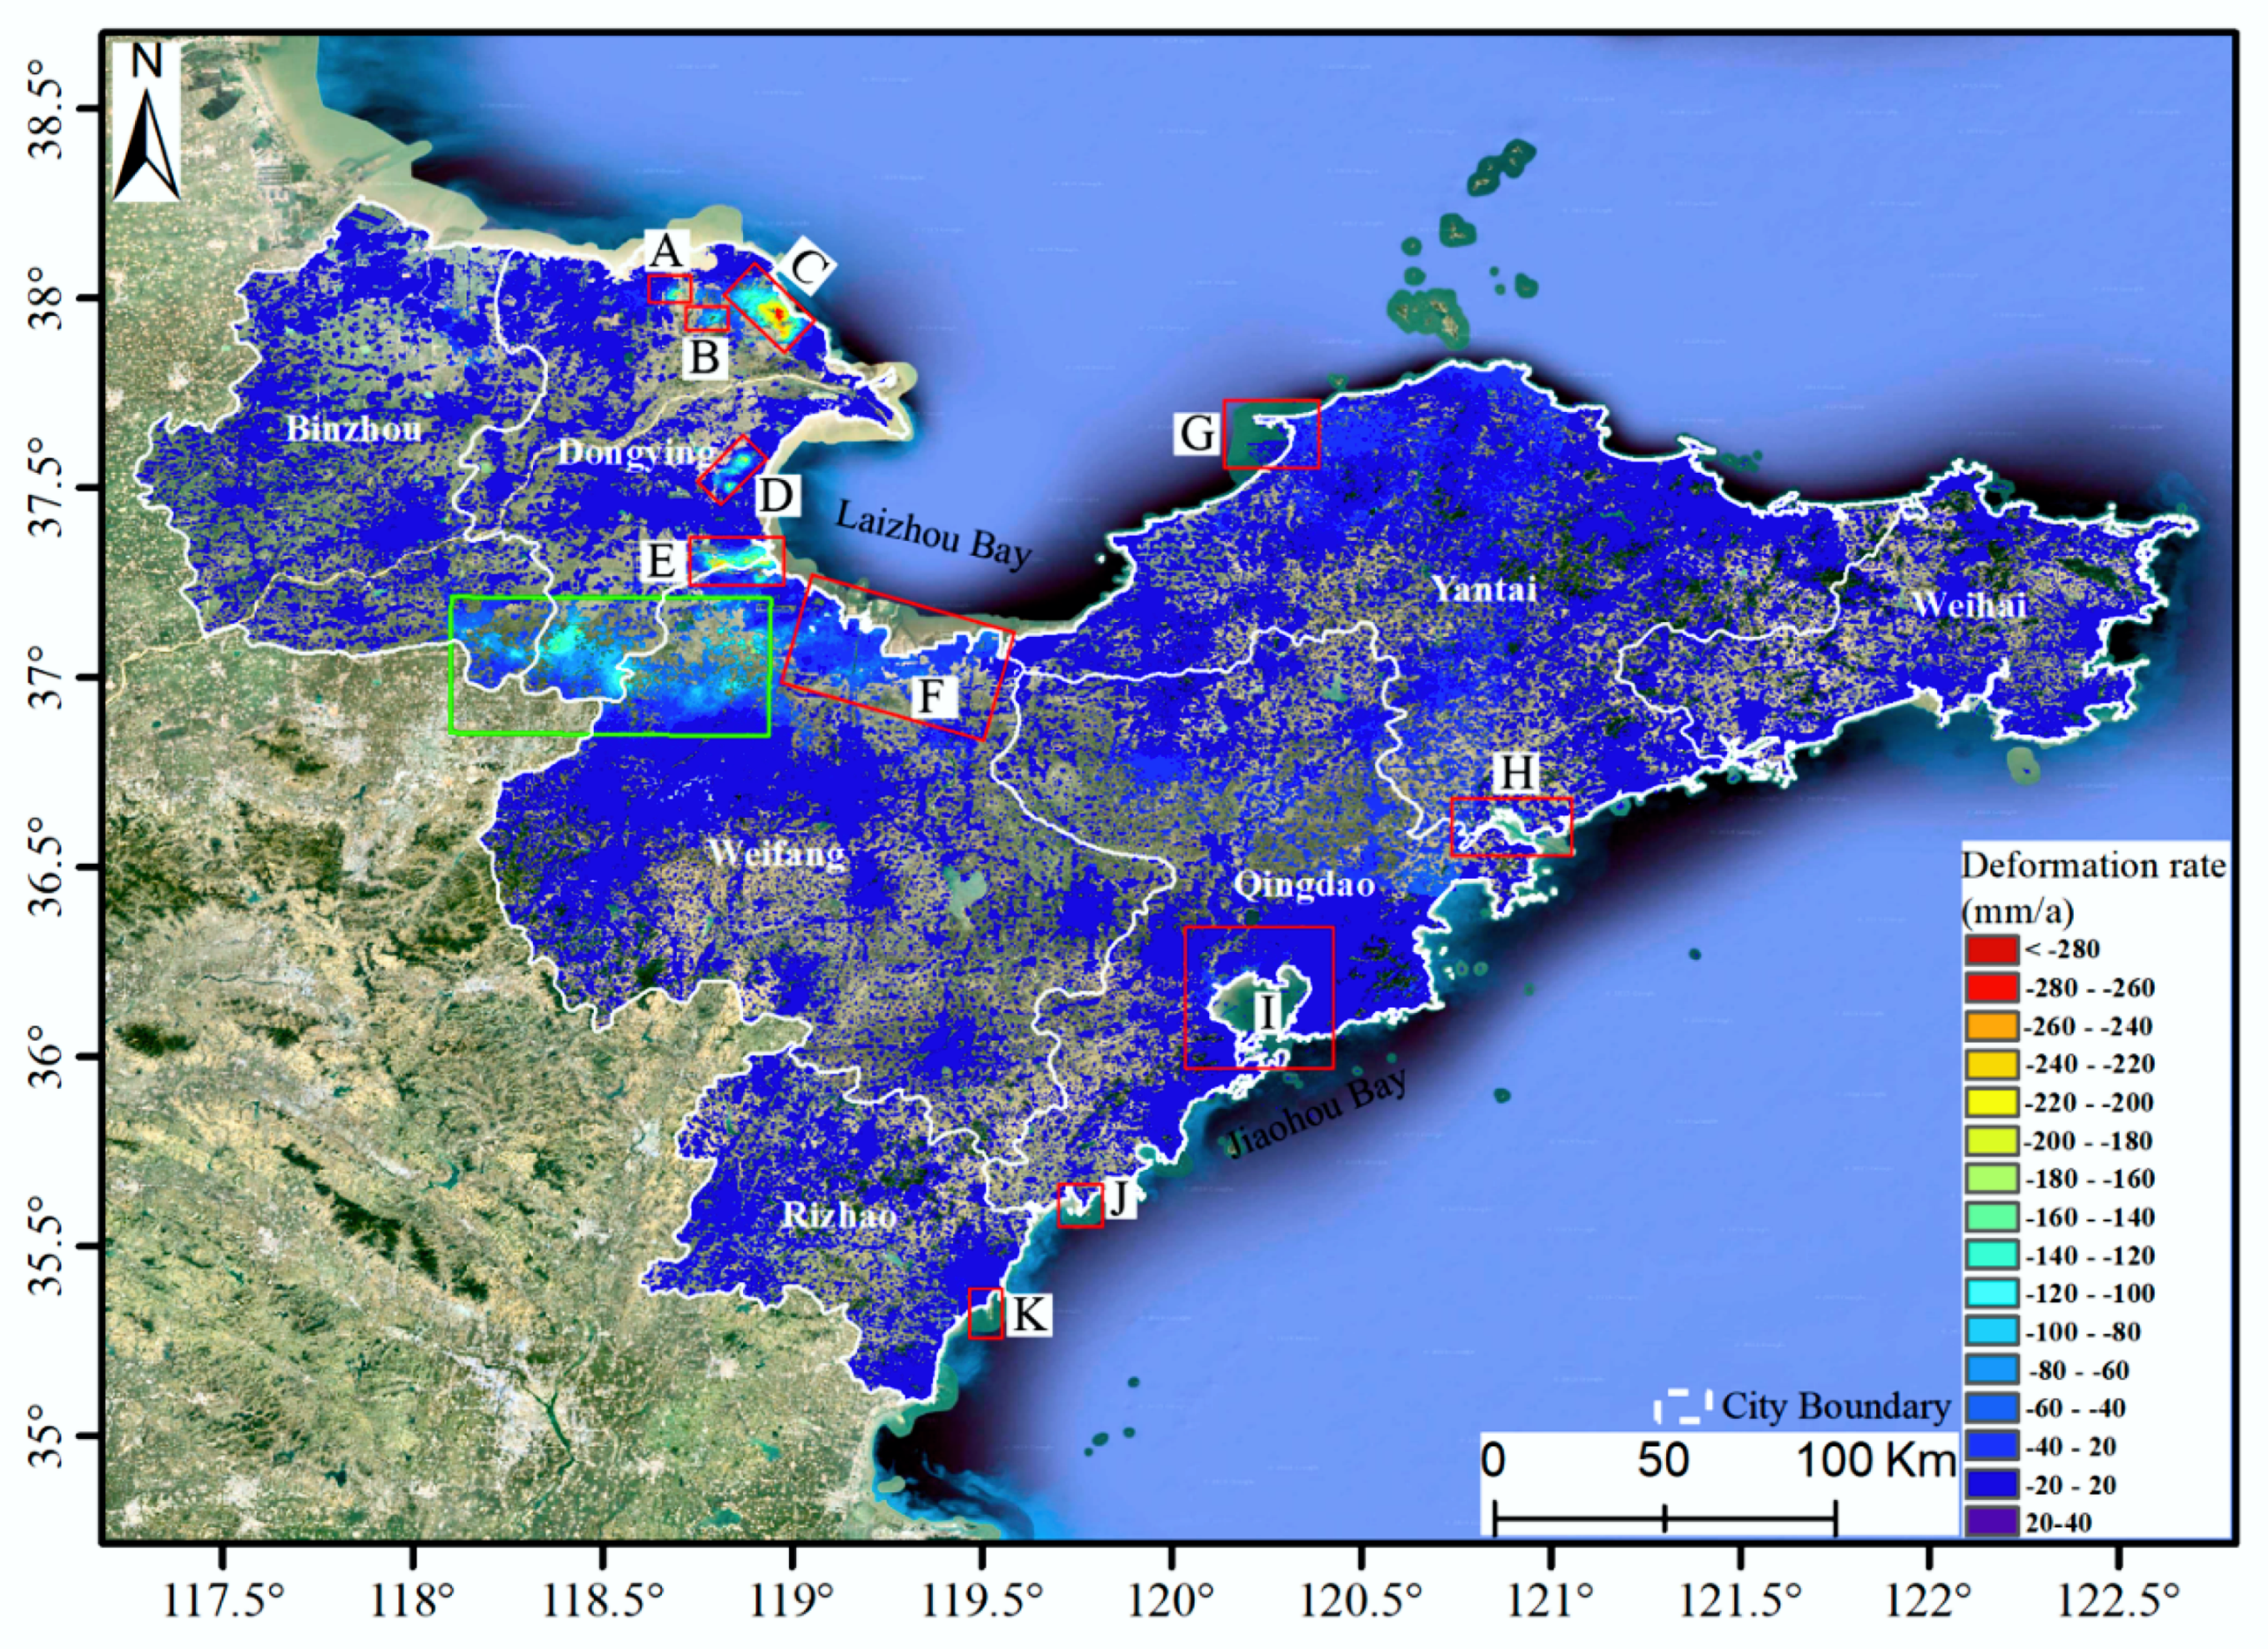
4.1. Surface Deformation over The Entire Peninsula

The LOS deformation rates of four different paths (Path 76, Path 69, Path 98 and Path 3) Sentinel-1 SAR data are firstly calculated independently. Then, all the deformation maps are transferred to the same coordinate system according to the external DEM. Finally, the annual land subsidence rate map over the entire peninsula from 2016 to 2019 is generated by mosaicking all four deformation rates shown in Figure 2. All the background images on which the InSAR-derived deformation maps are superimposed are from Google Earth. The accuracy of the InSAR measurements will be cross validated with independent InSAR observations from different tracks in Section 4.2.
The surface deformation characteristics of six cities seated in the peninsula have been explored, that is Dongying, Weifang, Yantai, Weihai, Qingdao and Rizhao from north to south. We detected land subsidence in a total of twelve regions, eleven of which occur in or near the coastal areas defined by red rectangles from Region A to Region K (Figure 2). The remaining one is the subsidence over inland Guangrao, occupying an area as large as 110 by 35 km (green rectangle in Figure 2). On the whole, land subsidence is mainly concentrated in the northern Shandong peninsula (i.e., YRD), and the southern and southeastern areas are relatively stable. There is no large scale ground subsidence zone, except some scattered coastal zones, with the subsidence rate varying from 10 mm/a to 60 mm/a, which can be explained by the different coastal geological settings (i.e., YRD is mainly a silt mud coastline, and the south and southeast areas are mainly bedrock coastline). The most remarkable subsidence is located in Region C with a subsidence rate as large as 260 mm/a. The GPS results show that the vertical ground movement gradually changes from subsidence to slight uplift along the north to the south of Shandong peninsula during the period of 2010 to 2015 [38]. Although the observation periods between GPS and InSAR are different, the overall deformation trends are consistent. Detailed analysis of the main regional subsidence in Figure 2 will be given in the following Section 5.

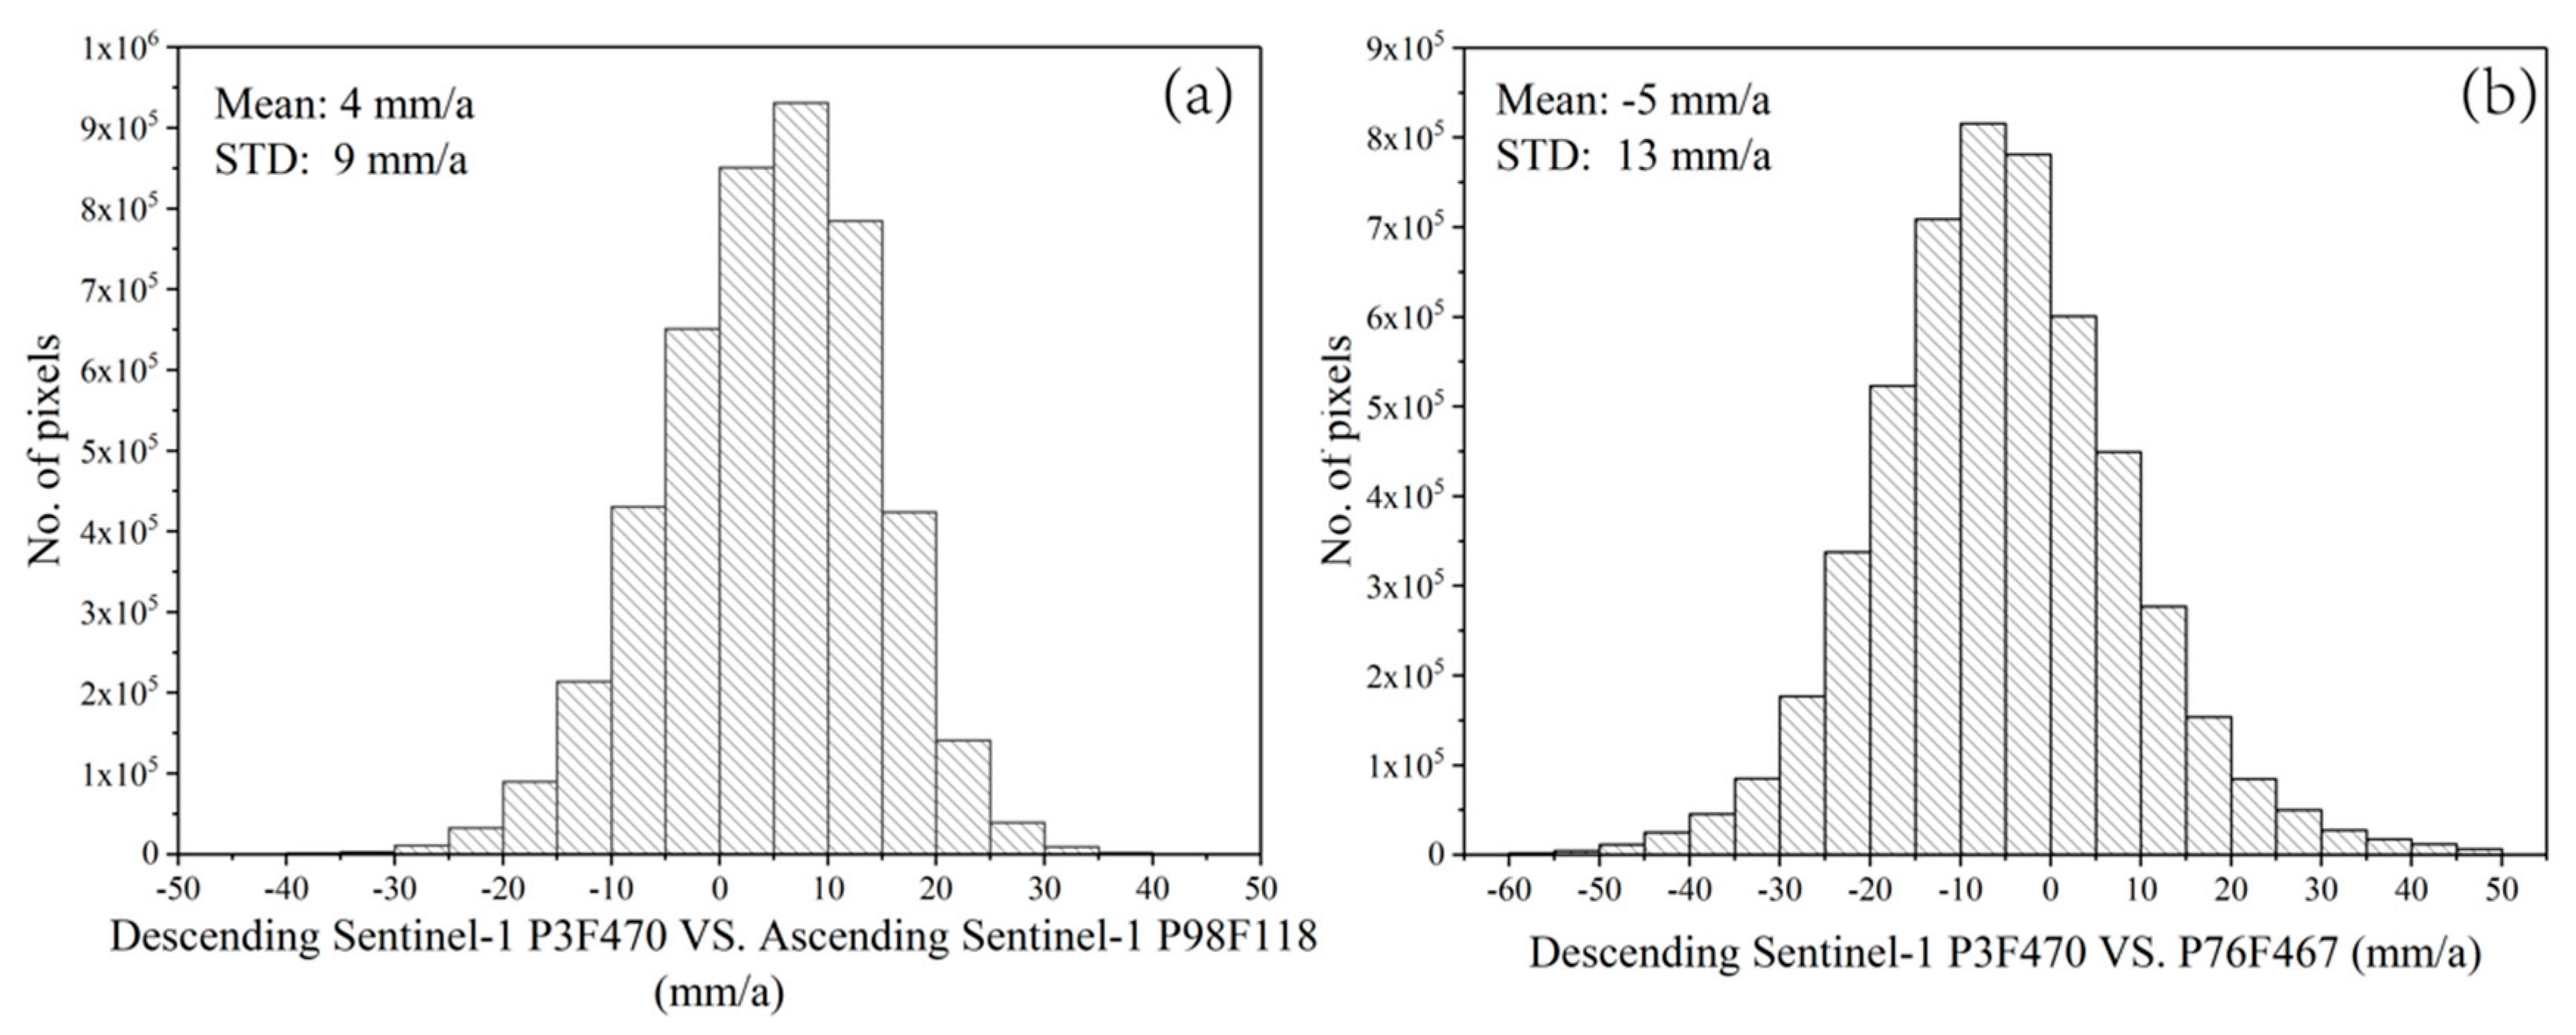
4.2. Accuracy Assessment of The InSAR Measurements

In order to assess the uncertainty of InSAR measurements, independent InSAR observations from the Sentinel-1 satellite images covering the same area and during the same time interval are utilized. As the overlapped region is stable, the horizontal displacements are not considered in this step. Four InSAR deformation rates in LOS direction from 2016 to 2019 are all projected in the vertical direction with respect to their corresponding incidence angles at each pixel. Please note that an identical DEM is applied for the geocoding of every SAR measurement, which guarantees that the cross validation is taken under the same ground coordinate system.
Histograms of the differences in deformation rate between different measurements are shown in Figure 3, where Figure 3a is the difference between descending Sentinel-1 Path 3 Frame 470 and ascending Sentinel Path 98 Frame 118, and Figure 3b is the difference between descending Sentinel-1 Path 3 Frame 470 and Path 76 Frame 467. The standard deviations for two differences are about 0.9 and 1.3 cm/a, respectively.

4.3. Deformation Results in The YRD

Yellow River Delta (YRD), including Regions A–F and Guangrao city, has been undergoing the most severe land subsidence over the Shandong peninsula, so the SBAS technique was applied to both ascending and descending datasets individually to retrieve the annual deformation rate and deformation time series along the LOS direction (Figure 4).
Figure 4a,b show the LOS annual deformation rate maps from March 2017 to June 2019 acquired from ascending and descending datasets, respectively. The two maps show similar deformation patterns with the maximum LOS deformation rate as large as 260 mm/a in Region C. Slightly different patterns and magnitudes can also be seen in some regions, which were caused by the different LOS imaging geometries of the ascending and descending tracks. Compared to the previous studies [10,11,14], there are two notable spatial changes: (1) before 2016, the subsidence mainly occurred in the Shengli oilfield and Gudong oilfield, located in the Xicheng district and the southeast of Region C, respectively. However, our measurements did not show any obvious deformation, as the two oilfields mentioned above had been closed since 2016; (2) Regions A, B, C and D are the newly detected deformation centers from this research.

2-D Deformation Result

To estimate the 2-D deformation time series, i.e., vertical and east–west deformation components over the YRD, InSAR measurements from the ascending Path 69 and the descending Path 76 are calculated with the MSBAS technique. The north–south deformation component is negligible due to the low sensitivity of near-polar orbiting sensors. In this case, the satellite parameters for the heading angles of ascending and descending Sentinel-1 track are −13.2° and −166.8°, respectively, and the average incidence angles of ascending and descending track are 33.7° and 33.9°, respectively. The vertical and east–west deformation rate maps of the overlapped areas of ascending and descending SAR images are shown in Figure 5a,b, respectively.
Nine typical feature points (a–i), located in the subsidence centers (Figure 5a), are selected to analyze the time series deformation from March 2017 to March 2019, which are shown in Figure 6. It can be found from Figure 5 and Figure 6 that the vertical deformations are much larger than the east–west deformations, which confirms that the vertical movements dominate the deformation fields in the YRD. Points a and b are located in the subsidence center in Region B, points c and d are in Region C, points e, f and g are in Region D, and points h and i are in Region E. The 2-D deformation time series measurements show a moderate linear deformation during the two years. The maximum cumulative deformation reached −450 mm in the vertical direction at point e and reached 100 mm in the east–west direction at point b during the observation interval (Figure 6). According to the time series deformation evolution at points a and b for Region B (Figure 6a,b), it should be noted that land deformation was not detected before December 2017, and then the point underwent severe subsidence with the maximum cumulative deformation by more than −400 mm, which can be explained by the fact that the land type had been changed from aquaculture to salt fields after 2017; since then, the large volume of underground brine was withdrawn.

5. Discussion

Land deformation in Shandong peninsula can be induced by one or more different anthropogenic activities. Although each localized subsidence site is unique over the whole Shandong peninsula, it may reflect unique local geological and hydrological conditions and some similar causal factors can be summarized. Land subsidence disasters in Shandong peninsula are mainly caused by the fluid overexploitation of underground resources, such as brine, oil and groundwater, and the reclamation of new artificial land along the coastline. As extensive land subsidence along the coastline may induce the occurrence of inundation, damage of infrastructure, pipelines and roads, and the loss of the wetland habitat, the analysis of the spatiotemporal evolution of land subsidence and the deformation mechanism can better guide the prevention of localized geohazards.
In this section, multiple localized geohazards in Shandong peninsula have been revealed and summarized in Table 2. The causes of regional land subsidence in terms of brine withdrawal, aquaculture farm, land reclamation and local faults will be discussed in detail.

5.1. Correlation between Land Subsidence and Faults

Fault-related subsidence has been recorded worldwide, such as in some regions of China, and Houston, USA [6,7,39,40,41]. The faults in YRD are composed of the Yishu fault (NNE 10°–30°) and its secondary faults, including the Shangwujing fault and Yidu fault (Figure 7a). The Yishu fault zone is conjugated spatially with its secondary faults, where earthquakes mostly occurred [42,43]. Figure 7a demonstrates a strong correlation between the land subsidence and fault distribution in the YRD region, which indicates that land subsidence in YRD was affected by the localized faults significantly.
Three profiles, perpendicular to the faults, are chosen to analyze the spatial correlation between land subsidence and faults, where profile aa’ is located in Region F, crossing the Yishu fault, and profiles bb’ and cc’ are located in Guangrao, crossing the Yidu fault and Shangwujing fault, respectively. Deformation rates along three profiles are shown in Figure 7b–d, from which it can be seen that different displacements are observed across three faults. Based on the InSAR measurements, the differences between the mean deformation rates on two sides of the faults from 2016 to 2019 are 40 mm/a for the Yishu fault, 110 mm/a for the Yidu fault and 70 mm/a for the Shangwujing fault.
In general, the fault constrains the flow of groundwater, the extraction of groundwater can cause a decline in pore stress within the groundwater reservoir and alters the stress state near the fault section, which therefore aggravates the localized subsidence [6,41].

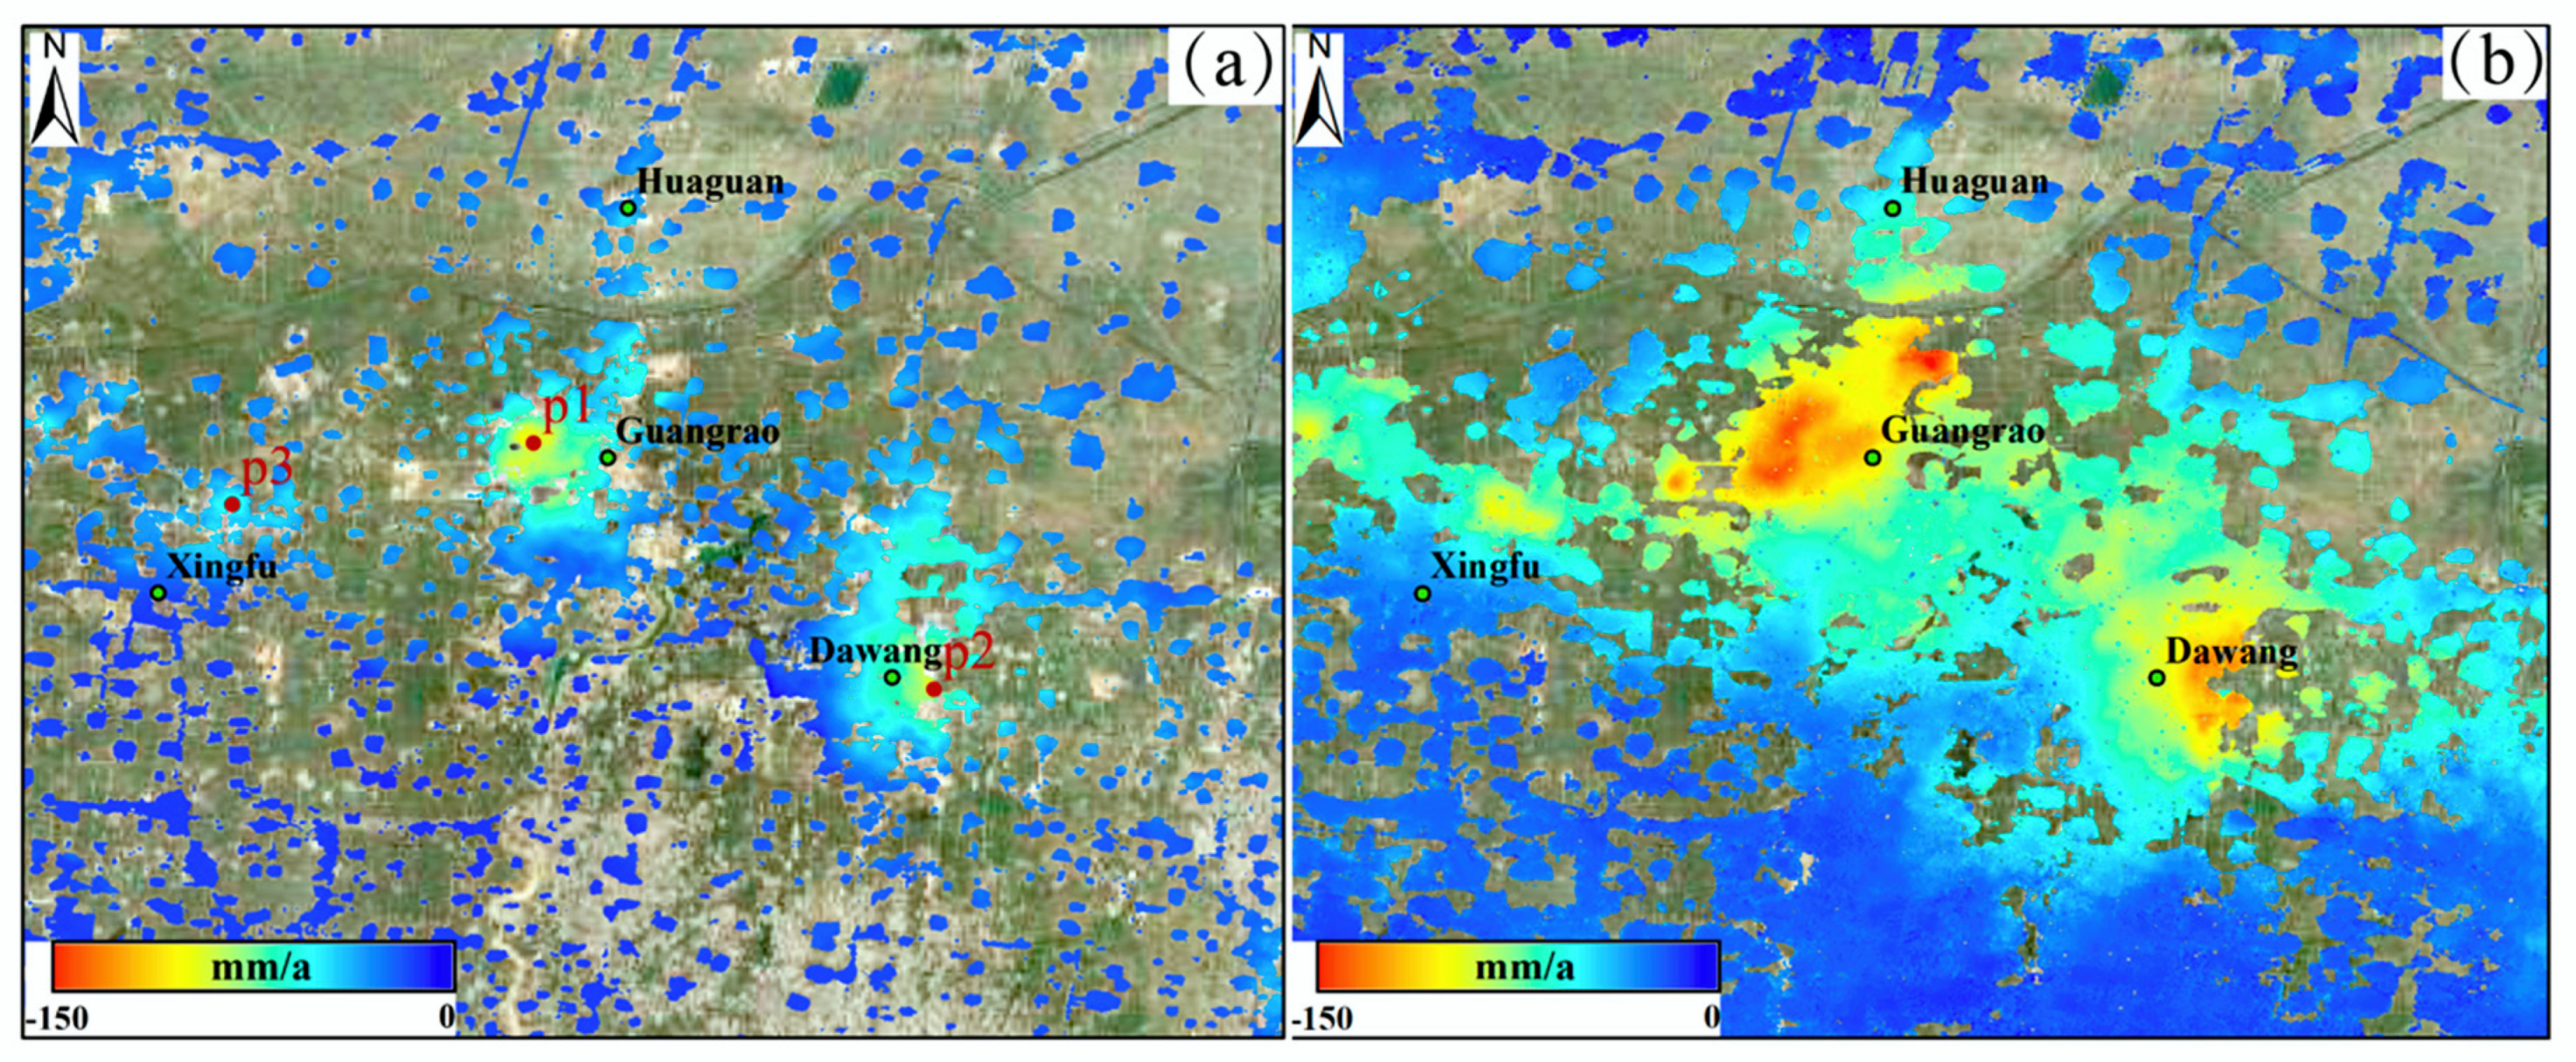
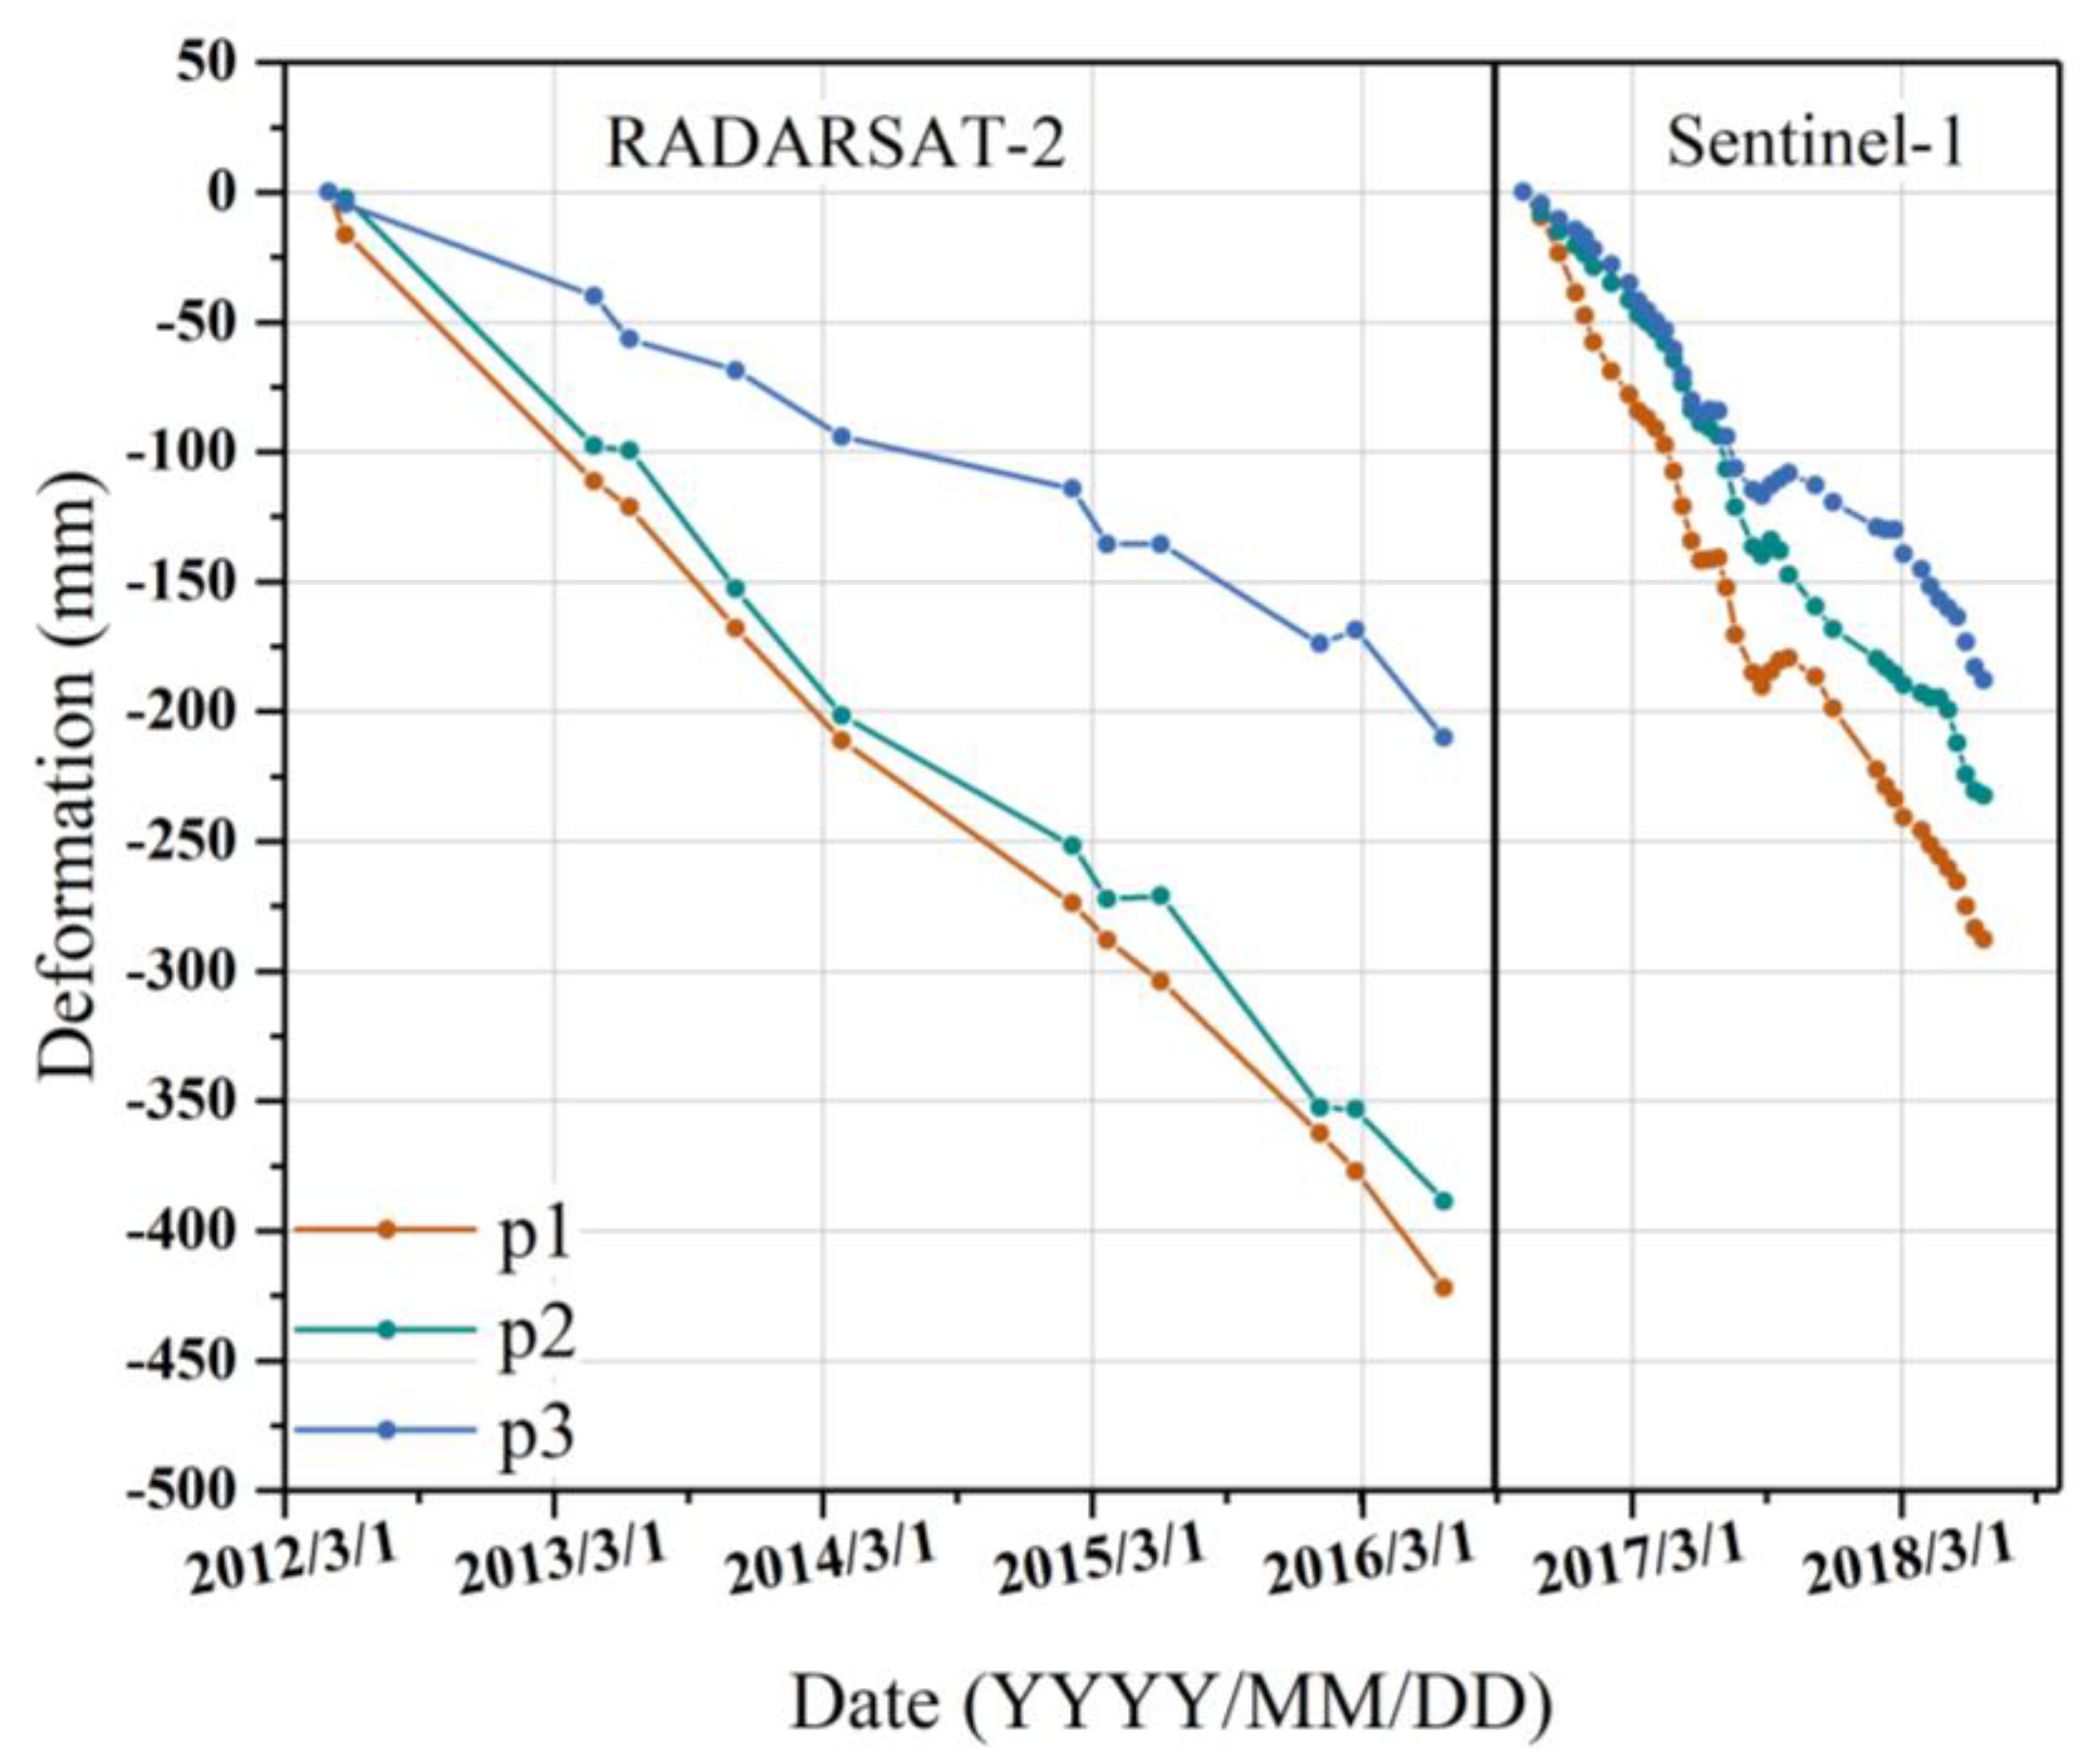
5.2. Land Subsidence in Guangrao Due to Over-Exploitation of Groundwater

Guangrao County, indicated by the green rectangle in Figure 2, is the exclusive inland subsidence in the Shandong peninsula and has been suffering subsidence for decades [10,11,14]. Figure 8a,b show the average deformation rates derived from RADARSAT-2 datasets from 2012 to 2016 and Sentinel-1A datasets from 2016 to 2018, from which the land subsidence evolution during two periods can be clearly seen. All the deformation measurements have been projected in the vertical direction. The land subsidence cones remained the same, while the land subsidence area and intensity had changed significantly. Quantitatively, the maximum deformation rate increased from 80 mm/a to 130 mm/a in the Gruangrao subsidence center, and the deformed areas with deformation rates greater than 10 mm/a increased from about 240 km2 to about 460 km2 (Figure 8).
To better analyze the temporal characteristics of the observed deformation, deformation time series at three feature points (Figure 8a) are extracted during two observation periods shown in Figure 9, where quasi-linear deformation during two periods are revealed. The annual subsidence rates during these two observation periods varied from 88 mm/a to 126 mm/a at Guangrao subsidence cones, from 88 mm/a to 126 mm/a at Dawang subsidence cones and from 43 mm/a to 87 mm/a at Xingfu subsidence cones. Cumulative deformation time series at points a, b and c reached 708, 620 and 398 mm, respectively.
The primary source of the land subsidence in this area is mainly attributed to the long-term overexploitation of deep confined aquifer groundwater, which was mainly used for farmland irrigation, industrial and commercial water supply [10,11,14,25,26].

5.3. Land Subsidence in Salt Field

An abundant natural brine deposit is reserved in the Laizhou Bay, especially in Dongying and Weifang city [12,27,45,46]. As shown in Figure 4, the high correlation between the distribution of salt fields and the land subsidence suggests that the exploitation of underground brine resource is the main cause of the land subsidence. All subsidence in Regions A, B, C, D, E and F (Figure 2) is due to the extraction of underground brine.
In Laizhou Bay, the formation of natural brine is the result of the comprehensive action of geological structure, geographical environment and marine geology [45,46]. A growing number of chemical factories in this area require the overexploitation of underground brine for salt production. There are more than 5000 wells for extraction of underground brine resources in Shandong province and all the exploitation is concentrated on the shallow ground brine at the depth less than 100 m [27]. The over pumping in the brine area significantly decreases the brine salinity and deepens the brine water depth. Therefore, overexploitation of brine declines the groundwater level and undermines the stratigraphic structure, forming severe subsidence zones in YRD.

5.4. Land Subsidence in Aquaculture Farm

In Shandong peninsula, the coastal aquaculture is one of the crucial national economic industries. Recently, fish and shrimp ponds have become the boundary between land and sea in YRD and some other bays. Subsidence in these areas is a potential threat to aquaculture fields [9].
Figure 10a,c show the surface deformation maps in Dingzi Bay and Jiaozhou Bay, which corresponds to Region H and I in Figure 2. Black solid lines indicate aquaculture units. The distribution of the large deformation zone and the aquaculture fields is highly consistent. Land subsidence rate in Dingzi Bay ranges from 0 to 50 mm/a and, in Jiaozhou Bay, it ranges from 0 to 70 mm/a. Figure 10b–d show the deformation time series at the selected feature points in Figure 10a,c, respectively. Linear function is used to fit the time series plots, where the deformation rates in Figure 10b,d are 18.6 mm/a and 53.5 mm/y, respectively. The cumulative deformation at the feature point in Dingzi Bay reaches 60 mm from July 2017 to March 2019, and at the feature point in Jiaozhou Bay reaches to 140 mm from September 2016 to May 2019. Aquaculture fields are vulnerable to land subsidence due to exploitation of groundwater. According to the literature [9,26], to ensure that shrimp live in the water with moderate salinity, farmers often continuously extract groundwater to dilute the brackish water in the pond in order to increase the seafood production. Furthermore, groundwater with a higher temperature is extracted to keep the seafood safe in the winter when the temperature is low.

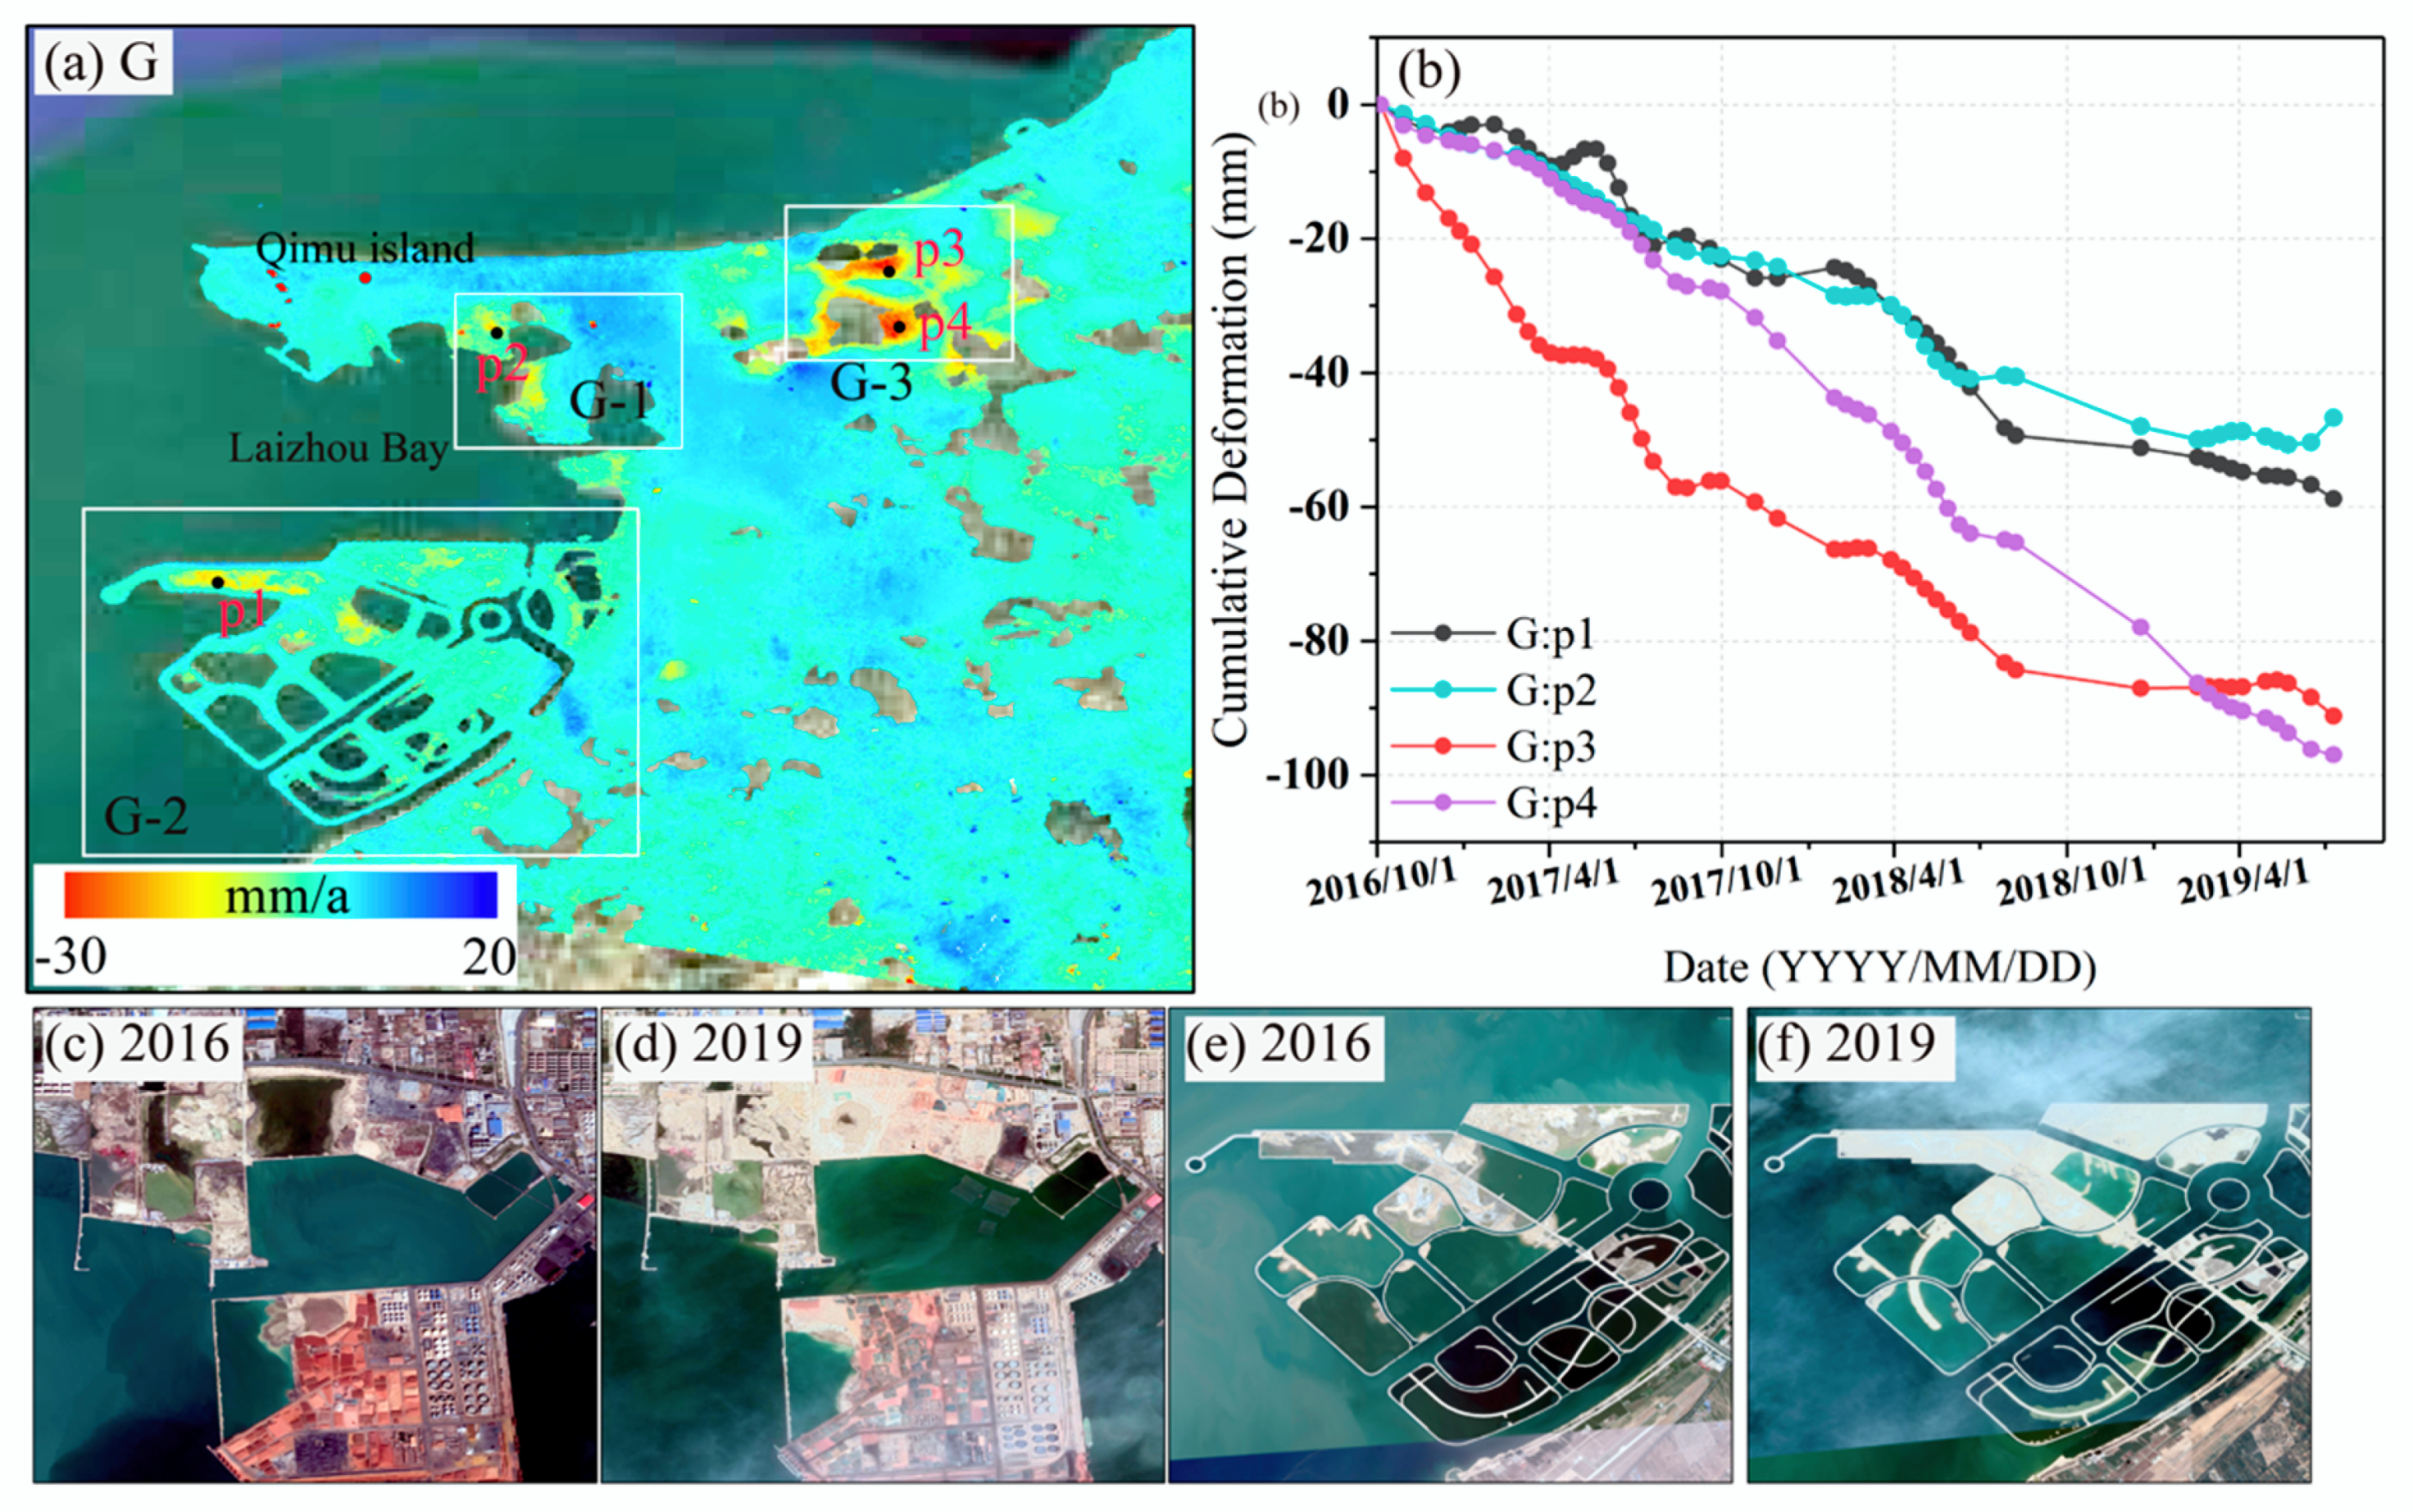
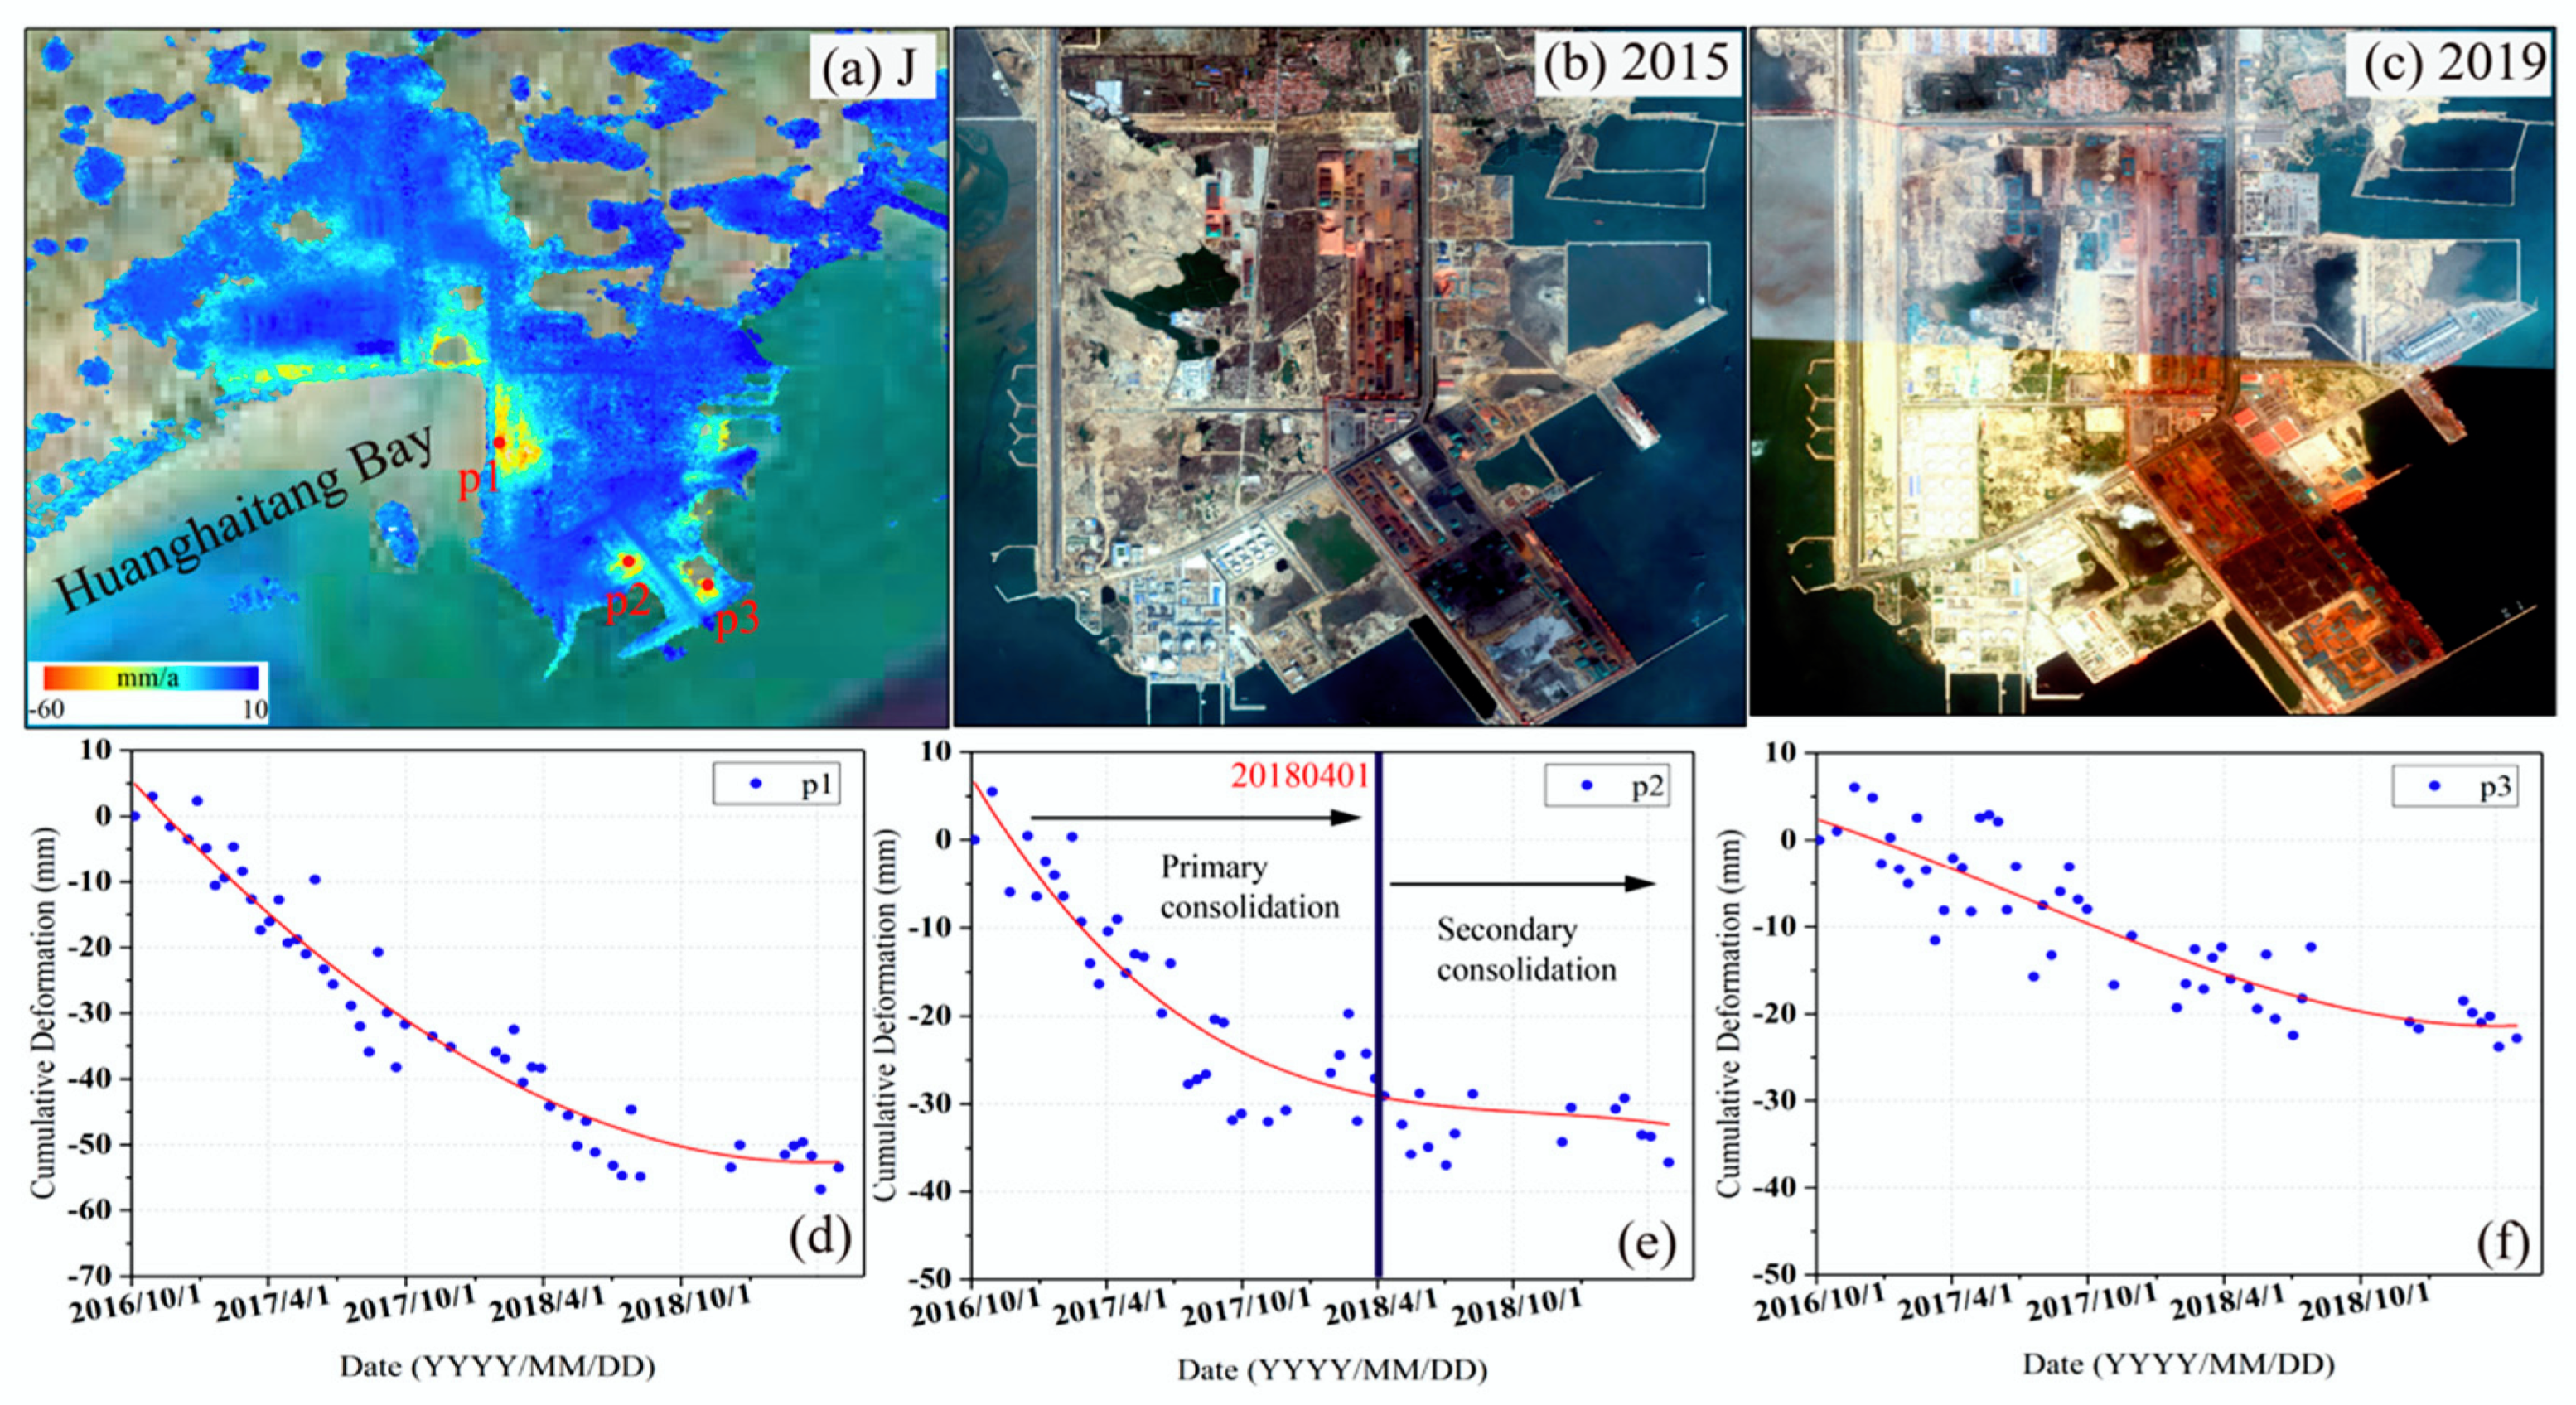
5.5. Land Subsidence Caused by Land Reclamation

Laizhou Bay and southeast coastal of Shandong peninsula is suitable for land reclamation for its sandy and bedrock composition. According to the InSAR measurements in Figure 2, Figure 10 and Figure 11, several remarkable subsidence regions associated with land reclamation are successfully detected in Longkou Port, Jiaozhou Bay and several south coastal areas such as Regions G, J, K and the subsidence zones marked by white rectangles in Figure 10c. To reveal the deformation patterns and temporal evolution, some typical deformation regions (Regions G, J and K) of land reclamation are chosen and shown enlarged as Figure 11, Figure 12 and Figure 13.
Longkou Port (i.e., Region G), located in the south of Longkou Bay with an area of 50.41 km2, is mainly composed of seven small islands, which will be the first large artificial islands in China. Figure 11a shows the deformation rate map in the LOS direction in Longkou city from October 2016 to July 2019. To study the temporal deformation evolution, four feature points over this area are extracted and given in Figure 11b. Land subsidence in Regions G-1 and G-2 is mainly associated with land reclamation and Region G-3 is associated with farm irrigation. Two groups of Google Earth images over Regions G-1 and G-2 (Figure 11c–f), acquired in January 2016 and September 2019, respectively, show the detailed changes in the reclamation process. Compared with Figure 11a,c,f, deformation coverage in Regions G-1 and G-2 is highly consistent with the surface reclamation. The cumulative deformation in p1 and p2 reached around 50 mm, and slowed down in July 2018, finally turning into a relatively mild subsidence pattern. Maximum cumulative deformations were observed at p3 and p4, with a magnitude of about 100 mm, while the time series of p3 also turned into a mild subsidence trend from September 2018, which suggested that the reclaimed land entered a long-term slow compression stage. Land subsidence at p4 presents a linear land subsidence tendency with the cumulative deformation in the LOS direction larger than 100 mm.
Additionally, regions J and K (Figure 2) are also detected as showing land subsidence caused by soil compaction over reclaimed land. The enlarged land subsidence maps are shown in Figure 12 and Figure 13, respectively. Compared with the Google Earth images, acquired in January 2015 and September 2019, respectively (Figure 12b,c and Figure 13b,c), the land subsidence areas in Figure 12a and Figure 13a highly correspond to the regions with reclamation activities. In order to further investigate the temporal evolution of land subsidence after reclamation, three typical points for Region J and two for Region K (Figure 12a and Figure 13a), are selected and shown in Figure 12d–f and Figure 13d,e. Time series deformation measurements at three feature points in Region J present nonlinear deformation characteristics. We used cubic polynomial function ( y = a 0 + a 1 x + a 2 x 2 + a 3 x 3 ) to fit the time series at feature points. The subsidence at p2 slowed down in April 2018 and then turned into a relatively mild subsidence pattern with an average deformation rate varying from 17.2 mm/a to 2.8 mm/a. The average subsidence rates at p1 and p3 were approximately 27.6 and 11.4 mm/a, respectively, and then gradually slowed down in January 2019. Different from the deformation evolution in Region J, the time series deformation in Region K presented an approximate linear trend, where the deformation rates in Figure 13d,e were 31.0 mm/a and 22.3 mm/y, respectively.
Land subsidence associated with land reclamation mainly experiences two consolidation processes: primary consolidation and long-term secondary compression, as recorded in [1,2,16,25,47]. The primary stage is governed by the dissipation of pore pressure and the secondary stage is creep under constant effective stress. Coastal soft soils are characterized by clear secondary consolidation. After the completion of primary consolidation, in turn, the pore pressure dissipates and a long-term compression process occurs [25]. The subsidence in the primary stage is faster than that in the secondary stage. The compression magnitude and velocity of land subsidence after land reclamation activities largely depend on the type and thickness of geotechnical parameters. Such a subsidence process can be explained by the well-known Terzaghi theory of consolidation [47], a typical time–subsidence prediction curve for both primary consolidation and secondary compaction. We explain the temporal evolution of surface deformation in Regions G, J and K using the Terzaghi theory of consolidation. Therefore, we can infer from the graph of the deformation time series that, before the SAR observed period, the reclamation project in Region J was basically completed; therefore, it suffered primary consolidation and then entered the secondary stage, which evidently presents a typical time–subsidence prediction curve under the reclamation, especially for Figure 12c. However, Regions G and K are the new reclamation areas and are currently still in the primary consolidation stage with an approximate linear deformation and larger deformation rate. Accordingly, significant land subsidence will continue for some time and finally enter a long-term slow compression stage. InSAR-derived results account for only a small part compared to the entire compaction process due to the short-term observation period. By integrating the geotechnical parameters of reclamation materials, the whole subsidence will be forecasted.

6. Conclusions

In this study, time series InSAR and MSBAS techniques are utilized to investigate the multi-scale and multi-dimensional surface deformation of Shandong peninsula. Sentinel-1A/B SAR imagery from five tracks acquired from October 2016 to July 2019, as well as descending RADARSAT-2 images acquired from April 2012 to June 2016, are all considered.
The spatial pattern and temporal evolution over the entire peninsula are investigated with the SBAS algorithm. The precision of our measurements is 1.3 cm/a based on independent InSAR measurements for the same regions. On the whole, most of the deformation areas occurred along the northern coastline of the peninsula (i.e., YRD) and the maximum subsidence velocity reached 290 mm/a.
Two-dimensional deformation rates and time series for both the vertical and east–west directions over Dongying city are calculated using MSBAS algorithm. The results show that there is not only vertical land subsidence, but also eastward deformation, which enriches the previous research results.
In total, twelve regional areas with land subsidence are identified over the whole Shandong peninsula and the detailed resuts is summarized. The localized land subsidence areas are associated with overexploitation of brine and underground water, aquaculture and land reclamation, and fault activity. The maximum land subsidence occurred in inland Guangrao with the annual rate being 105 mm/a due to the overexploitation of groundwater. In addition, several faults in Guangrao and Weifang affected the local subsidence due to the heterogeneous strata across the fault. Lastly, land reclamation suffers from land subsidence significantly. InSAR time series results reveal the different temporal evolutions, which obey the Terzaghi theory of consolidation very well.
Our research into the characteristics of spatiotemporal evolution and the mechanisms of land subsidence can be referred to local underground fluid exploitation and land reclamation.

Author Contributions

All authors participated in editing and reviewing the manuscript. M.P. implemented the methodology, analyzed InSAR results, made the figures and wrote the original paper. C.Z. and Z.L. designed the research program, supervised the research and provided valuable suggestions for the revision. Q.Z., L.B. and W.B. made contributions to the results interpretation. All authors have read and agree to the published version of the manuscript.

Funding

This work is jointly supported by the National Natural Science Foundation of China NSFC (Grant No. 41874005 and 41929001), the Special Project granted by the China Earthquake Administration (Grant No. 2018010103) and the Fundamental Research Funds for the Central Universities, CHD (No. 300102269722, 300102269303, 300102269104).

Acknowledgments

The authors would like to thank the European Space Agency for providing the Sentinel-1A SAR data freely. SRTM DEM can be freely downloaded from http://www2.jpl.nasa.gov/srtm/cbanddataproducts.html. The MSBAS software package can be downloaded from http://insar.ca/. Thanks go to Google Earth for providing the optical images. We also would like to thank two anonymous reviewers for their elaborate comments.

Conflicts of Interest

The authors declare no conflict of interest.

References

  1. Xu, B.; Feng, G.C.; Li, Z.W.; Wang, Q.J.; Wang, C.C.; Xie, R.G. Coastal Subsidence Monitoring Associated with Land Reclamation Using the Point Target Based SBAS-InSAR Method: A Case Study of Shenzhen, China. Remote Sens. 2016, 8, 652. [Google Scholar] [CrossRef] [Green Version]
  2. Liu, X.J.; Zhao, C.Y.; Zhang, Q.; Yang, C.S.; Zhang, J. Characterizing and Monitoring Ground Settlement of Marine Reclamation Land of Xiamen New Airport, China with Sentinel-1 SAR Datasets. Remote Sens. 2019, 11, 585. [Google Scholar] [CrossRef] [Green Version]
  3. Aimaiti, Y.; Yamazaki, F.; Liu, W. Multi-Sensor InSAR Analysis of Progressive Land Subsidence over the Coastal City of Urayasu, Japan. Remote Sens. 2018, 10, 1304. [Google Scholar] [CrossRef] [Green Version]
  4. Cianflone, G.; Tolomei, C.; Brunori, C.A.; Dominici, R. InSAR Time Series Analysis of Natural and Anthropogenic Coastal Plain Subsidence: The Case of Sibari (Southern Italy). Remote Sens. 2015, 7, 16004–16023. [Google Scholar] [CrossRef] [Green Version]
  5. Tosi, L.; Lio, C.D.; Teatini, P.; Strozzi, T. Land Subsidence in Coastal Environments: Knowledge Advance in the Venice Coastland by TerraSAR-X PSI. Remote Sens. 2018, 10, 1191. [Google Scholar] [CrossRef] [Green Version]
  6. Qu, F.F.; Lu, Z.; Kim, J.-W.; Zheng, W.Y. Identify and Monitor Growth Faulting Using InSAR over Northern Greater Houston, Texas, USA. Remote Sens. 2019, 11, 1498. [Google Scholar] [CrossRef] [Green Version]
  7. Qu, F.F.; Lu, Z.; Zhang, Q.; Bawden, G.W.; Kim, J.-W.; Zhao, C.Y.; Qu, W. Mapping ground deformation over Houston–Galveston, Texas using multi-temporal InSAR. Remote Sens. Environ. 2015, 169, 290–306. [Google Scholar] [CrossRef]
  8. Dixon, T.H.; Amelung, F.; Ferretti, A.; Novali, F.; Rocca, F.; Dokka, R.; Sella, G.; Kim, S.-W.; Wdowinski, S.; Whitman, D. Space geodesy: Subsidence and flooding in New Orleans. Nature 2006, 441, 587–588. [Google Scholar] [CrossRef] [PubMed]
  9. Higgins, S.; Overeem, I.; Tanaka, A.; Syvitski, J.P.M. Land subsidence at aquaculture facilities in the Yellow River delta, China. Geophys. Res. Lett. 2013, 40, 3898–3902. [Google Scholar] [CrossRef]
  10. Zhang, J.Z.; Huang, H.J.; Bi, H.B. Land subsidence in the modern Yellow River delta based on InSAR time series analysis. Nat. Hazards 2015, 75, 2385–2397. [Google Scholar] [CrossRef]
  11. Liu, Y.L.; Huang, H.J.; Dong, J.F. Large-area land subsidence monitoring and mechanism research using the small baseline subset interferometric synthetic aperture radar technique over the Yellow River Delta, China. J. Appl. Remote Sens. 2015, 9, 096019. [Google Scholar] [CrossRef]
  12. Zhang, X.Y.; Miao, J.J.; Hu, B.X.; Liu, H.W.; Zhang, H.X.; Ma, Z. Hydrogeochemical characterization and groundwater quality assessment in intruded coastal brine aquifers (Laizhou Bay, China). Environ. Sci. Pollut. R. 2017, 24, 21073–21090. [Google Scholar] [CrossRef] [PubMed]
  13. Liu, P.; Li, Q.Q.; Li, Z.H.; Hoey, T.; Liu, Y.X.; Wang, C.S. Land Subsidence over Oilfields in the Yellow River Delta. Remote Sens. 2015, 7, 1540–1564. [Google Scholar] [CrossRef] [Green Version]
  14. Liu, Y.L.; Huang, H.J.; Liu, Y.X.; Bi, H.B. Linking land subsidence over the Yellow River delta, China, to hydrocarbon exploitation using multi-temporal InSAR. Nat. Hazards 2016, 84, 271–291. [Google Scholar] [CrossRef]
  15. Sun, Q.S.; Jiang, L.M.; Jiang, M.; Lin, H.; Ma, P.F.; Wang, H.S. Monitoring Coastal Reclamation Subsidence in Hong Kong with Distributed Scatterer Interferometry. Remote Sens. 2018, 10, 1738. [Google Scholar] [CrossRef] [Green Version]
  16. Yang, M.S.; Yang, T.L.; Zhang, L.; Lin, J.X.; Qin, X.Q.; Liao, M.S. Spatial-Temporal Characterization of a Reclamation Settlement in the Shanghai Coastal Area with Time Series Analyses of X-, C-, and L-band SAR datasets. Remote Sens. 2018, 10, 329. [Google Scholar] [CrossRef] [Green Version]
  17. Bamler, R.; Hartl, P. Synthetic aperture radar interferometry. Inverse Probl. 1998, 14, R1–R54. [Google Scholar] [CrossRef]
  18. Massonnet, D.; Feigl, K. Radar interferometry and its application to changes in the Earth’s surface. Rev. Geophys. 1998, 36, 441–500. [Google Scholar] [CrossRef] [Green Version]
  19. Ferretti, A.; Prati, C.; Rocca, F. Permanent scatterers in SAR interferometry. IEEE Trans. Geosci. Remote Sens. 2001, 39, 8–20. [Google Scholar] [CrossRef]
  20. Berardino, P.; Fornaro, G.; Lanari, R.; Sansoto, E. A new algorithm for surface deformation monitoring based on small baseline differential SAR interferograms. IEEE Trans. Geosci. Remote Sens. 2002, 40, 2375–2383. [Google Scholar] [CrossRef] [Green Version]
  21. Wang, H.; Wright, T.J.; Yu, Y.P.; Lin, H.; Jiang, L.L.; Li, C.H.; Qiu, G.X. InSAR reveals coastal subsidence in the Pearl River Delta, China. Geophys. J. Int. 2012, 191, 1119–1128. [Google Scholar] [CrossRef] [Green Version]
  22. Du, Y.N.; Feng, G.C.; Peng, X.; Li, Z.W. Subsidence Evolution of the Leizhou Peninsula, China, Based on InSAR Observation from1992 to 2010. Appl. Sci. 2017, 7, 466–484. [Google Scholar] [CrossRef] [Green Version]
  23. Bartsch, A.; Leibman, M.; Strozzi, T.; Khomutov, A.; Widhalm, B.; Babkina, E.; Mullanurov, D.; Ermokhina, K.; Kroisleitner, C.; Bergstedt, H. Seasonal Progression of Ground Displacement Identified with Satellite Radar Interferometry and the Impact of Unusually Warm Conditions on Permafrost at the Yamal Peninsula in 2016. Remote Sens. 2019, 11, 1865. [Google Scholar] [CrossRef] [Green Version]
  24. Zinno, I.; Bonano, M.; Buonanno, S.; Casu, F.; De, L.C.; Manunta, M.; Lanari, R. National Scale Surface Deformation Time Series Generation through Advanced DInSAR Processing of Sentinel-1 Data within a Cloud Computing Environment. IEEE Trans. Big Data 2018. [Google Scholar] [CrossRef] [Green Version]
  25. Zhang, Y.; Huang, H.J.; Liu, Y.L.; Liu, Y.X.; Bi, H.B. Spatial and temporal variations in subsidence due to the natural consolidation and compaction of sediment in the yellow river delta, China. Mar. Georesour. Geotec. 2019, 37, 152–163. [Google Scholar] [CrossRef]
  26. Zhang, B.W.; Wang, R.; Deng, Y.K.; Ma, P.F.; Lin, H.; Wang, J.L. Mapping the Yellow River Delta land subsidence with multitemporal SAR interferometry by exploiting both persistent and distributed scatterers. ISPRS J. Photogramm. Remote Sens. 2019, 148, 157–173. [Google Scholar] [CrossRef]
  27. Xu, Y. Study on Comprehensive Development and Utilization Mode and the Distribution Law of Underground Brine Resources in the Yellow River Delta. Master’s Dissertation, Qingdao University, Qingdao, China, 2013. (In Chinese). [Google Scholar]
  28. Guo, Q.C.; Zheng, Z.; Huang, L.M.; Deng, A. Regularity of sediment transport and sedimentation during floods in the lower Yellow River, China. Int. J. Sediment Res. 2020, 35, 97–104. [Google Scholar] [CrossRef]
  29. Yin, Y.H. A discussion on land reclamation along the coast of Shandong and its problems. Mar. Geol. Lett. 2010, 26, 35–39. (In Chinese) [Google Scholar]
  30. Farr, T.G.; Rosen, P.A.; Caro, E.; Crippen, R.; Duren, R.; Hensley, S.; Kobrick, M.; Paller, M.; Rodriguez, E.; Roth, L.; et al. The shuttle radar topography mission. Rev. Geophys. 2007, 45, 1–33. [Google Scholar] [CrossRef] [Green Version]
  31. Lanari, R.; Mora, O.; Manunta, M.; Mallorqui, J.J.; Berardino, P.; Sansosti, E. A small-baseline approach for investigating deformations on full-resolution differential SAR interferograms. IEEE Trans. Geosci. Remote Sens. 2004, 42, 1377–1386. [Google Scholar] [CrossRef]
  32. Werner, C.; Wegmüller, U.; Strozzi, T.; Wiesmann, A. GAMMA SAR and interferometric processing software. In Proceedings of the ERS-Envisat Symposium, Gothenburg, Sweden, 16–20 October 2000. [Google Scholar]
  33. Goldstein, R.; Engelhardt, H.; Kamb, B.; Frolich, R. Satellite radar interferometry for monitoring ice sheet motion: Application to an Antarctic ice stream. Science 1993, 262, 1525–1530. [Google Scholar] [CrossRef] [PubMed]
  34. Samsonov, S.; d’Oreye, N. Multidimensional Small Baseline Subset (MSBAS) for Two-Dimensional Deformation Analysis: Case Study Mexico City. Can. J. Remote Sens. 2017, 43, 318–329. [Google Scholar] [CrossRef]
  35. Samsonov, S.; d’Oreye, N. Multidimensional time series analysis of ground deformation form multiple InSAR data sets applied to Virunga Volcanic Province. Geophys. J. Int. 2012, 191, 1095–1108. [Google Scholar]
  36. Samsonov, S.; d’Oreye, N.; Smets, B. Ground deformation associated with post-mining active at the French-German border revealed by novel InSAR time series method. Int. J. Appl. Earth Obs. Geoinf. 2013, 23, 142–154. [Google Scholar] [CrossRef]
  37. Samsonov, S.; Tiampo, K.; Camacho, A.; Fernandez, J.; Gonzalez, P. Spatiotemporal analysis and interpretation of 1993–2013 ground deformation at Campi Flegrei, Italy, observed by advanced DInSAR. Geophys. Res. Lett. 2014, 41, 6101–6108. [Google Scholar] [CrossRef] [Green Version]
  38. Guo, C.X.; Nie, J.L.; Tian, J.; Wang, W.L.; Cheng, C.L.; Wang, B.; Yin, H.F.; Zhang, H.P. Vertical ground displacements in the Shandong Province derived from long-term GNSS and leveling surveying. Adv. Space Res. 2019, 64, 1388–1397. [Google Scholar] [CrossRef]
  39. Peng, M.M.; Zhao, C.Y.; Zhang, Q.; Lu, Z.; Li, Z.S. Research on Spatiotemporal Land Deformation (2012–2018) over Xi’an, China, with Multi-Sensor SAR Datasets. Remote Sens. 2019, 11, 664. [Google Scholar] [CrossRef] [Green Version]
  40. Yang, C.S.; Lu, Z.; Zhang, Q.; Liu, R.C.; Ji, L.Y.; Zhao, C.Y. Ground deformation and fissure activity in Datong basin, China 2007–2010 revealed by multi-track InSAR. Geomat. Nat. Haz. Risk 2019, 10, 465–482. [Google Scholar] [CrossRef]
  41. Chaussard, E.; Wdowinski, S.; Cabral-Cano, E.; Amelung, F. Land subsidence in central Mexico detected by ALOS InSAR time series. Remote Sens. Environ. 2014, 140, 94–106. [Google Scholar] [CrossRef]
  42. Wu, X.M.; Yu, G.M.; Teng, W.G. Study on the features of fault distribution of urban agglomeration areas in Shandong peninsula. J. Qingdao Univ. Technol. 2011, 32, 60–65. (In Chinese) [Google Scholar]
  43. Luo, W.Q.; Zhang, S.K.; Yu, X.F.; Tian, J.X.; Yang, B.; Zhang, Y.; Chen, J.; Ma, X.X.; Tang, L.L.; Sun, X.Z. Review on research progress of Yishu fault zone. Shandong Land Resour. 2018, 34, 59–65. (In Chinese) [Google Scholar]
  44. Li, J.; Yu, C.; Zhu, C.L.; Jia, Y.; Feng, Z.J.; Han, H.H. Vertical deformation characteristics of the Yishu fault zone and its nearby area. Earthquake 2018, 38, 167–177. (In Chinese) [Google Scholar]
  45. Zou, Z.G.; Zhang, D.S.; Tan, Z.R. Ground Brine Resource and Its Exploitation in Shandong Province. Geol. Surv. Res. 2008, 31, 214–221. (In Chinese) [Google Scholar]
  46. Chang, Y.W.; Hu, B.X.; Xu, Z.X.; Li, X.; Tong, J.X.; Chen, L.; Zhang, H.X.; Miao, J.J.; Liu, H.W.; Ma, Z. Numerical simulation of seawater intrusion to coastal aquifers and brine water/freshwater interaction in south coast of Laizhou Bay, China. J. Contam. Hydrol. 2018, 215, 1–10. [Google Scholar] [CrossRef] [PubMed] [Green Version]
  47. Terzaghi, K.; Peck, R.; Mesri, G. Soil Mechanics in Engineering Practice; John Wiley and Sons: Hoboken, NJ, USA, 1996; pp. 1–592. [Google Scholar]
Figure 1. Study area and coverage of radar data tracks superimposed on the Shuttle Radar Topography Mission (SRTM) Digital Elevation Model (DEM) shaded topography map over Shandong peninsula, China. Black and blue rectangles indicate the Sentinel-1 coverage and the orange rectangle represents RADARSAT-2 coverage. Different colored lines represent different types of coastal zones alone the coastline. The right-bottom inset is the approximate location of Shandong Peninsula in China.
Applsci 10 02294 g001
Figure 2. Vertical deformation velocity of the whole Shandong peninsula derived from Sentinel-1 datasets with different tracks and acquisition geometries (ascending and descending). The red rectangles labeled from A to K indicate the deformation areas along the coastline. The green rectangle box shows the Guangrao subsidence area.
Applsci 10 02294 g002
Figure 3. Histogram of deformation rate difference in the vertical direction derived from different Sentinel-1 SAR datasets. (a) Path 3 Frame 470 vs. Path 98 Frame 118. (b) Path 3 Frame 470 vs. Path 76 Frame 467.
Applsci 10 02294 g003
Figure 4. Annual LOS deformation maps spanning from 2016 to 2019 derived from (a) ascending Sentinel-1 (Path 69), and (b) descending Sentinel-1 (Path 76) datasets using SBAS technique.
Applsci 10 02294 g004
Figure 5. Vertical and horizontal east–west deformation rate maps calculated with multidimensional SBAS technique. (a) Vertical deformation rate map; (b) horizontal east–west deformation rate map. The white and black solid lines indicate salt field and aquaculture field coverage, respectively.
Applsci 10 02294 g005
Figure 6. Horizontal east–west and vertical deformation time series for feature points (i.e. points ai), whose positions are shown in Figure 5a.
Applsci 10 02294 g006
Figure 7. Land subsidence rate map over YRD and the deformation results along three profiles. (a) Land subsidence rate map, where black lines indicate the surface projections of faults. Graphs (b), (c) and (d) the deformation rates along the profiles aa’, bb’ and cc’, whose positions are labeled on (a), respectively. The locations of the faults are adopted from [44].
Applsci 10 02294 g007
Figure 8. Average vertical deformation maps in Guangrao city derived from (a) RADARSAT-2 (2012–2016) datasets and (b) Sentinel-1A (2016–2019) datasets.
Applsci 10 02294 g008
Figure 9. Cumulative vertical deformation time series at three feature points deriving from RADARSAT-2 (2012–2016) and Sentinel-1 (2016–2018) measurements. The positions are marked in Figure 8a.
Applsci 10 02294 g009
Figure 10. Deformation rate and time series at the selected feature points. The black solid lines mark the aquaculture fields. The white polygons in (c) indicate the subsidence regions caused by land reclamation. (b,d) The time series deformation measurements at two locations are shown in (ac).
Applsci 10 02294 g010
Figure 11. Deformation analyses at Longkou Port. (a) the deformation rate at Longkou Port (area G), (b) the time series at feature points p1, p2, p3 and p4, marked in (a), (c,d) and (e,f) are the optical images for Regions G-1 and G-2, respectively, acquired in January 2016 and September 2019.
Applsci 10 02294 g011
Figure 12. Deformation analysis at Region J. (a) the deformation rate map; (b,c) the Google Earth images acquired in January 2015 and September 2019, respectively; (df) the deformation time series at feature points p1, p2 and p3, marked in (a).
Applsci 10 02294 g012
Figure 13. Deformation analysis at Region K. (a) the deformation rate map; (b,c) the Google Earth images acquired in January 2015 and September 2019, respectively; (d,e) the deformation time series at feature points p1 and p2, marked in (a).
Applsci 10 02294 g013
Table 1. Imaging parameters of Synthetic Aperture Radar (SAR) datasets.
SatelliteOrbit DirectionPath/TrackFrameScene NumbersTime IntervalIncidence Angle
Sentinel-1A/B
(C-Band)
Ascending98118562017/04–2019/0333.75
69118662017/03–2019/0533.73
Descending3470502017/04–2019/0334.08
76468332016/10–2019/0233.91
76472542016/10–2017/0433.95
RADARSAT-2
(C-Band)
Descending//122012/04–2016/0626.23
Table 2. List of localized land subsidence and causes.
CityLocationLat/LonCorresponding RegionPeriodMaximum Magnitude (cm/a)Size (km2)
(>2cm/a)
Cause
Dongying, WeifangYRD (coastal area)/A, B, C, D, E, F201204–20190729522Brine withdrawal
Yantai, QingdaoDingzi Bay, Jiaozhou BayN36.6E120.8 /N36.2E120.1H, I201610–2019047166Aquaculture
Yantai, Qingdao, Rizhao/N37.6E120.2/
N35.6E119.7/
N35.3E119.5
G, J, K201610–201904615Land reclamation, Sediment consolidation
DongyingGuangraoN37.05E118.4/201610–20190714730groundwater withdrawal, fault

