Intrusion Detection with Unsupervised Techniques for Network Management Protocols over Smart Grids

 , ,
, ,  ,
,  ,
,  , , , , , and
Abstract
1. Introduction
2. Literature Review
3. Materials and Methods
3.1. Preprocessing
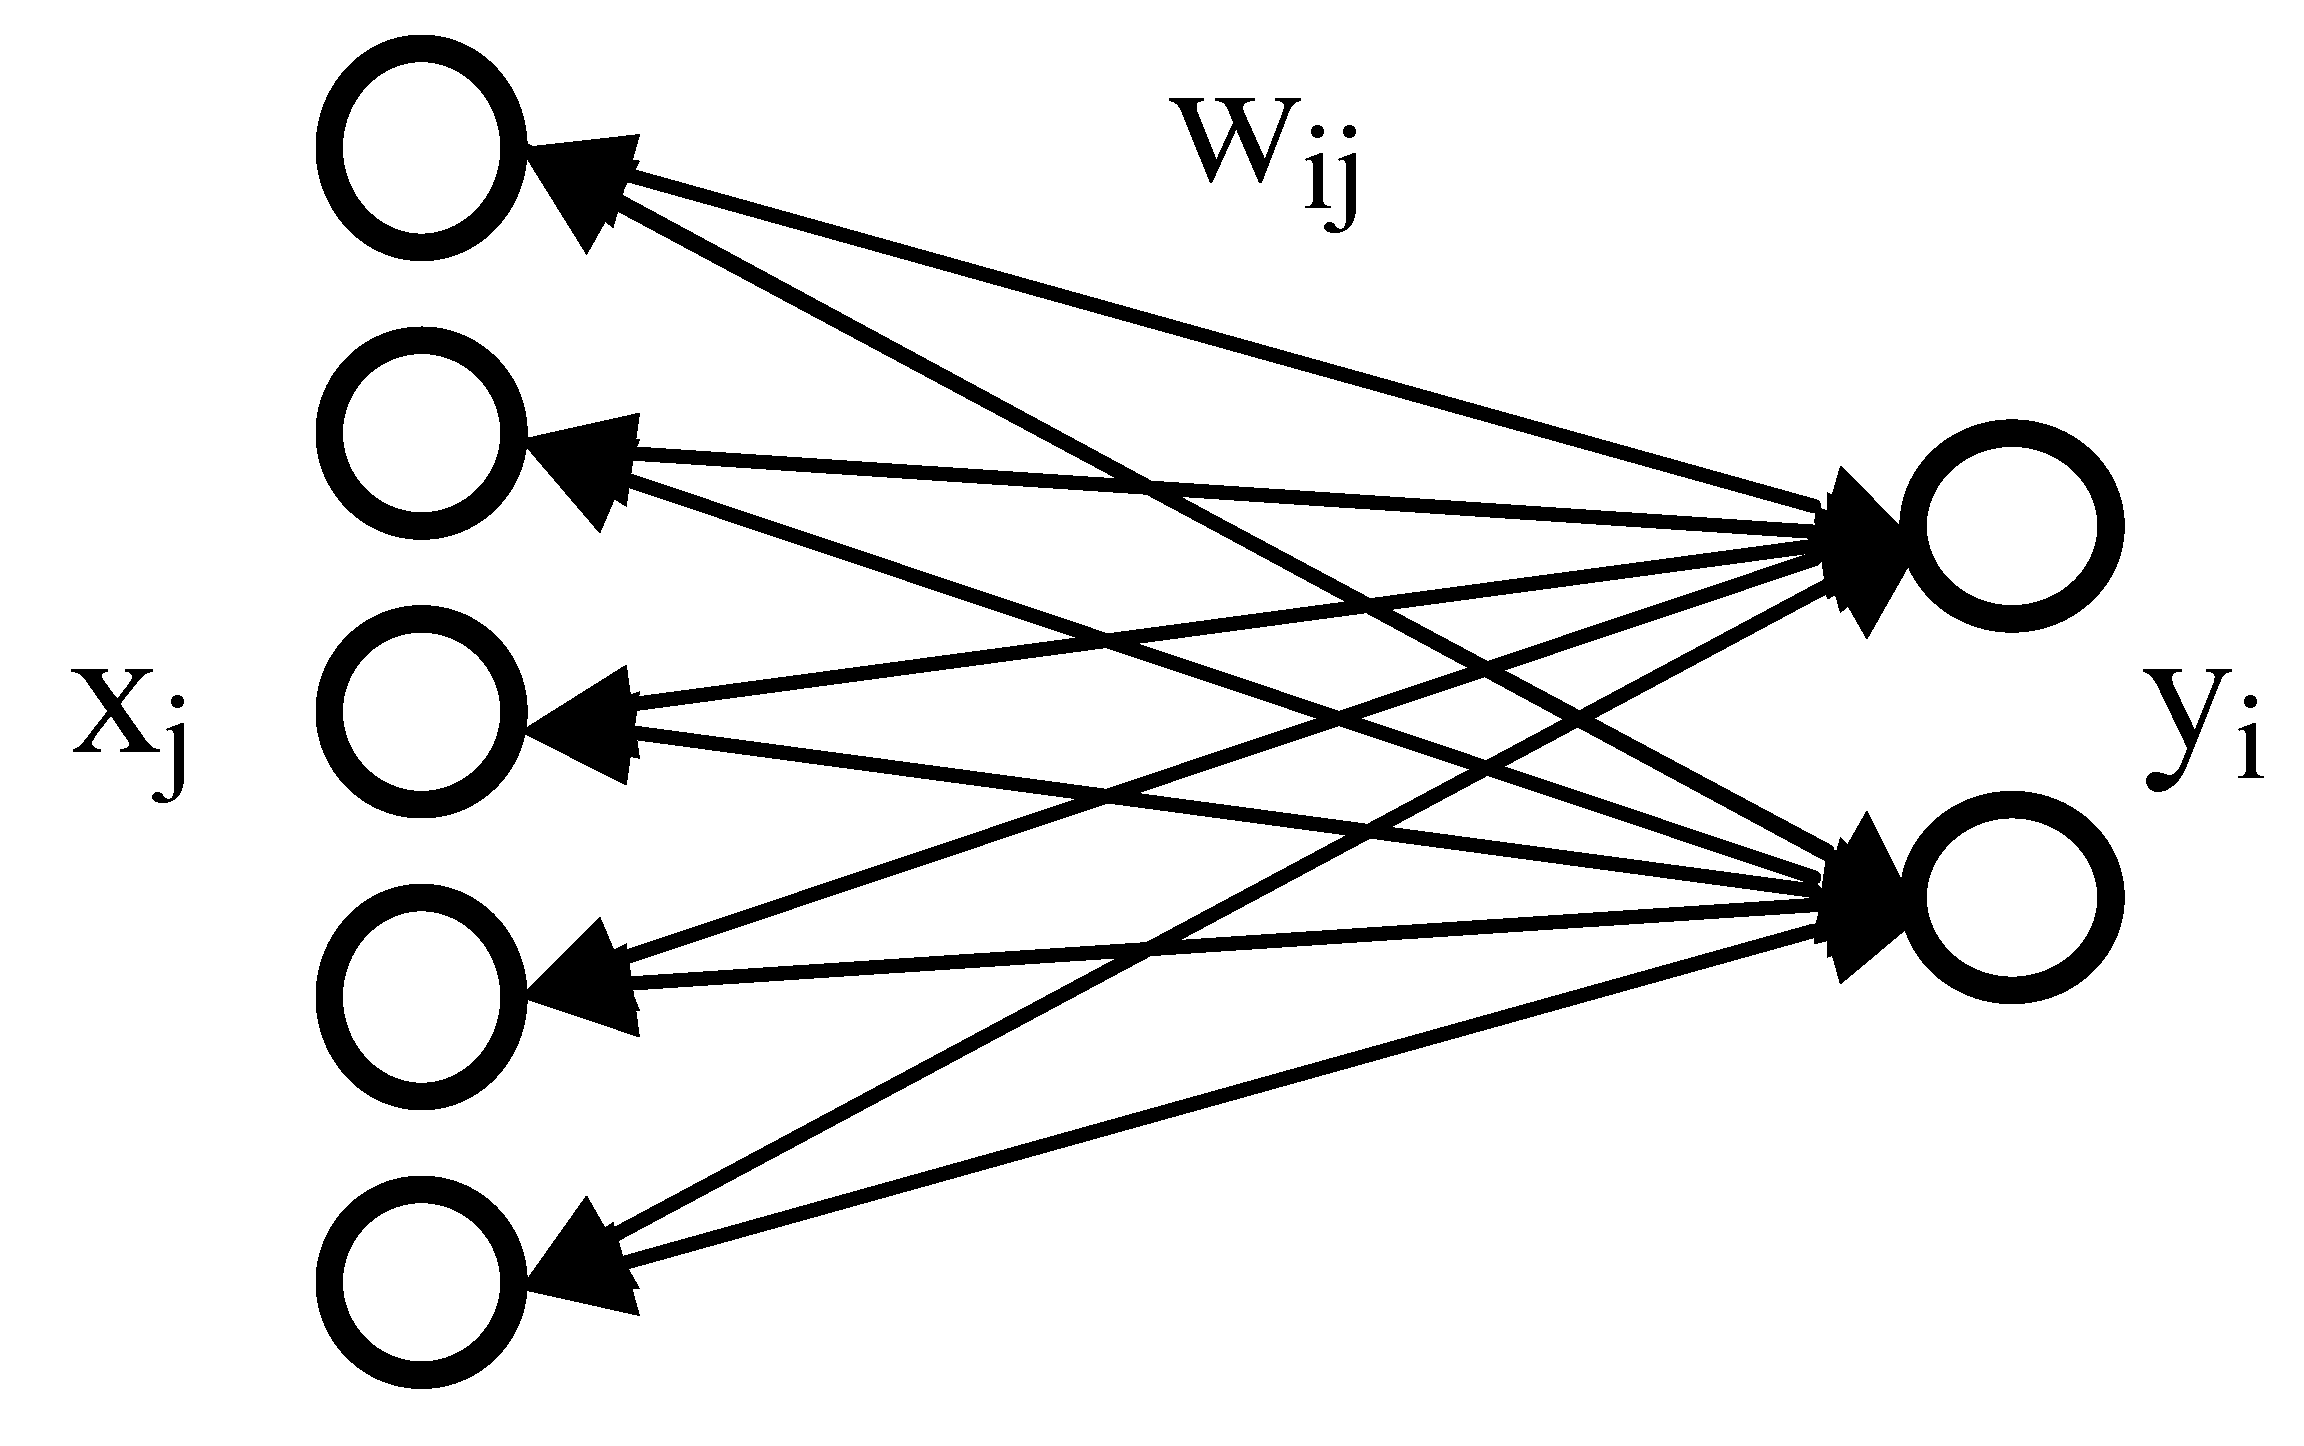
3.2. Beta Hebbian Learning Algorithm
3.3. Dataset
- Packet ID.
- Timestamp: respect to the first captured packet.
- Source Port: It is the host port from which the packet is sent.
- Destination Port: It is the host port to which the packet is sent.
- Packet Size.
- Protocol ID: from 1 to 35 for different packet protocols.
4. Experiments and Results
5. Conclusions
Author Contributions
Funding
Acknowledgments
Conflicts of Interest
References
- Kuwae, T.; Hori, M. Global Environmental Issues. In Blue Carbon in Shallow Coastal Ecosystems: Carbon Dynamics, Policy, and Implementation; Routledge: London, UK, 2019. [Google Scholar]
- Karunathilake, H.; Hewage, K.; Mérida, W.; Sadiq, R. Renewable energy selection for net-zero energy communities: Life cycle based decision making under uncertainty. Renew. Energy 2019, 130, 558–573. [Google Scholar] [CrossRef]
- Prakash, R.; Bhat, I.K. Energy, economics and environmental impacts of renewable energy systems. Renew. Sustain. Energy Rev. 2009, 13, 2716–2721. [Google Scholar]
- Chen, S.; Zhu, F.; Long, H.; Yang, J. Energy footprint controlled by urban demands: How much does supply chain complexity contribute? Energy 2019, 183, 561–572. [Google Scholar] [CrossRef]
- Carrosio, G.; Scotti, I. The ‘patchy’ spread of renewables: A socio-territorial perspective on the energy transition process. Energy Policy 2019, 129, 684–692. [Google Scholar] [CrossRef]
- Montero-Sousa, J.A.; Casteleiro-Roca, J.L.; Calvo-Rolle, J.L. Evolution of the electricity sector after the 2nd world war. DYNA 2017, 92, 280–284. [Google Scholar]
- Nizami, M.; Haque, A.; Nguyen, P.; Hossain, M. On the application of Home Energy Management Systems for power grid support. Energy 2019, 188, 116104. [Google Scholar] [CrossRef]
- Yang, C.J.; Jackson, R.B. Opportunities and barriers to pumped-hydro energy storage in the United States. Renew. Sustain. Energy Rev. 2011, 15, 839–844. [Google Scholar] [CrossRef]
- Amin, M. Smart Grid. In Public Utilities Reports; Public Utilities Fortnightly: Rochester, NY, USA, 2015. [Google Scholar]
- De Souza Dutra, M.D.; Anjos, M.F.; Digabel, S.L. A general framework for customized transition to smart homes. Energy 2019, 189, 116138. [Google Scholar] [CrossRef]
- Yu, Y.; Luan, W. Smart grid and its implementations. Proc. CSEE 2009, 29, 1–8. [Google Scholar]
- Gungor, V.C.; Sahin, D.; Kocak, T.; Ergut, S.; Buccella, C.; Cecati, C.; Hancke, G.P. Smart grid technologies: Communication technologies and standards. IEEE Trans. Ind. Inform. 2011, 7, 529–539. [Google Scholar] [CrossRef]
- Moslehi, K.; Kumar, R. A reliability perspective of the smart grid. IEEE Trans. Smart Grid 2010, 1, 57–64. [Google Scholar] [CrossRef]
- McDaniel, P.; McLaughlin, S. Security and privacy challenges in the smart grid. IEEE Secur. Priv. 2009, 7, 75–77. [Google Scholar] [CrossRef]
- Khurana, H.; Hadley, M.; Lu, N.; Frincke, D.A. Smart-grid security issues. IEEE Secur. Priv. 2010, 8, 81–85. [Google Scholar] [CrossRef]
- Metke, A.R.; Ekl, R.L. Security technology for smart grid networks. IEEE Trans. Smart Grid 2010, 1, 99–107. [Google Scholar] [CrossRef]
- Leszczyna, R. A review of standards with cybersecurity requirements for smart grid. Comp. Secur. 2018, 77, 262–276. [Google Scholar] [CrossRef]
- Wagner, M.; Fischer, F.; Luh, R.; Haberson, A.; Rind, A.; Keim, D.A.; Aigner, W. A Survey of Visualization Systems for Malware Analysis. In Proceedings of the Eurographics Conference on Visualization (EuroVis)—STARs, Cagliari, Italiy, 25–29 May 2015. [Google Scholar] [CrossRef]
- González, A.; Herrero, Á.; Corchado, E. Neural Visualization of Android Malware Families. In Proceedings of the International Joint Conference SOCO’16-CISIS’16-ICEUTE’16, San Sebastián, Spain, 19–21 October 2016; pp. 574–583. [Google Scholar] [CrossRef]
- Paturi, A.; Cherukuri, M.; Donahue, J.; Mukkamala, S. Mobile malware visual analytics and similarities of Attack Toolkits (Malware gene analysis). In Proceedings of the International Conference on Collaboration Technologies and Systems (CTS), San Diego, CA, USA, 20–24 May 2013; pp. 149–154. [Google Scholar] [CrossRef]
- Park, W.; Lee, K.; Cho, K.; Ryu, W. Analyzing and detecting method of Android malware via disassembling and visualization. In Proceedings of the International Conference on Information and Communication Technology Convergence (ICTC), Busan, Korea, 22–24 October 2014; pp. 817–818. [Google Scholar] [CrossRef]
- Moonsamy, V.; Rong, J.; Liu, S. Mining permission patterns for contrasting clean and malicious android applications. Future Gener. Comp. Syst. 2014, 36, 122–132. [Google Scholar] [CrossRef]
- Somarriba, O.; Zurutuza, U.; Uribeetxeberria, R.; Delosieres, L.; Nadjm-Tehrani, S. Detection and Visualization of Android Malware Behavior. J. Electr. Comp. Eng. 2016, 2016, 17. [Google Scholar] [CrossRef]
- Herrero, Á.; Zurutuza, U.; Corchado, E. A Neural-Visualization IDS for Honeynet Data. Int. J. Neural Syst. 2012, 22, 1250005. [Google Scholar] [CrossRef]
- Basque Honeypot Network. Euskalert. 2010. Available online: https://www.eurekalert.org/ (accessed on 10 May 2010).
- Corchado, E.; Herrero, Á. Neural visualization of network traffic data for intrusion detection. Appl. Soft Comput. 2011, 11, 2042–2056. [Google Scholar] [CrossRef]
- Lincoln Laboratory, M.I.o.T. 2000 DARPA Intrusion Detection Scenario Specific Datasets. 2019. Available online: https://www.ll.mit.edu/r-d/datasets/2000-darpa-intrusion-detection-scenario-specific-datasets (accessed on 3 December 2019).
- Herrero, Á.; Navarro, M.; Corchado, E.; Julián, V. RT-MOVICAB-IDS: Addressing real-time intrusion detection. Future Gener. Comp. Syst. 2013, 29, 250–261. [Google Scholar] [CrossRef]
- Sánchez, R.; Herrero, Á.; Corchado, E. Visualization and Clustering for SNMP Intrusion Detection. Cybernet. Syst. 2013, 44, 505–532. [Google Scholar] [CrossRef]
- Sánchez, R.; Herrero, Á.; Corchado, E. Clustering extension of MOVICAB-IDS to identify SNMP community searches. Log. J. IGPL 2015, 23, 121–140. [Google Scholar] [CrossRef][Green Version]
- Sánchez, R.; Herrero, Á.; Corchado, E. Clustering extension of MOVICAB-IDS to distinguish intrusions in flow-based data. Log. J. IGPL 2017, 25, 83–102. [Google Scholar] [CrossRef][Green Version]
- Sperotto, A.; Sadre, R.; van Vliet, F.E.; Pras, A. A Labeled Data Set for Flow-Based Intrusion Detection. In Proceedings of the Operations and Management, 9th IEEE International Workshop (IPOM 2009), Venice, Italy, 29–30 October 2009; pp. 39–50. [Google Scholar] [CrossRef]
- Vega Vega, R.; Quintián, H.; Calvo-Rolle, J.L.; Herrero, Á.; Corchado, E. Gaining deep knowledge of Android malware families through dimensionality reduction techniques. Log. J. IGPL 2019, 27, 160–176. [Google Scholar] [CrossRef]
- Vega, R.V.; Quintián, H.; Cambra, C.; Basurto, N.; Herrero, Á.; Calvo-Rolle, J.L. Delving into Android Malware Families with a Novel Neural Projection Method. Complexity 2019, 2019, 10. [Google Scholar] [CrossRef]
- Jove, E.; Casteleiro-Roca, J.L.; Quintián, H.; Pérez, J.A.M.; Calvo-Rolle, J.L. A fault detection system based on unsupervised techniques for industrial control loops. Expert Syst. 2019, 36, e12395. [Google Scholar] [CrossRef]
- Jove, E.; Casteleiro-Roca, J.L.; Quintián, H.; Pérez, J.A.M.; Calvo-Rolle, J.L. A New Approach for System Malfunctioning over an Industrial System Control Loop Based on Unsupervised Techniques. In Proceedings of the International Joint Conference SOCO’18-CISIS’18-ICEUTE’18, San Sebastián, Spain, 6–8 June 2018; pp. 415–425. [Google Scholar] [CrossRef]
- Quintián, H.; Corchado, E. Beta Hebbian Learning as a New Method for Exploratory Projection Pursuit. Int. J. Neural Syst. 2017, 27, 1–16. [Google Scholar] [CrossRef]
- Berro, A.; Larabi Marie-Sainte, S.; Ruiz-Gazen, A. Genetic algorithms and particle swarm optimization for exploratory projection pursuit. Ann. Math. Artif. Intell. 2010, 60, 153–178. [Google Scholar] [CrossRef]


| Dataset | Description | Nº Samples | Nº of Attacks |
|---|---|---|---|
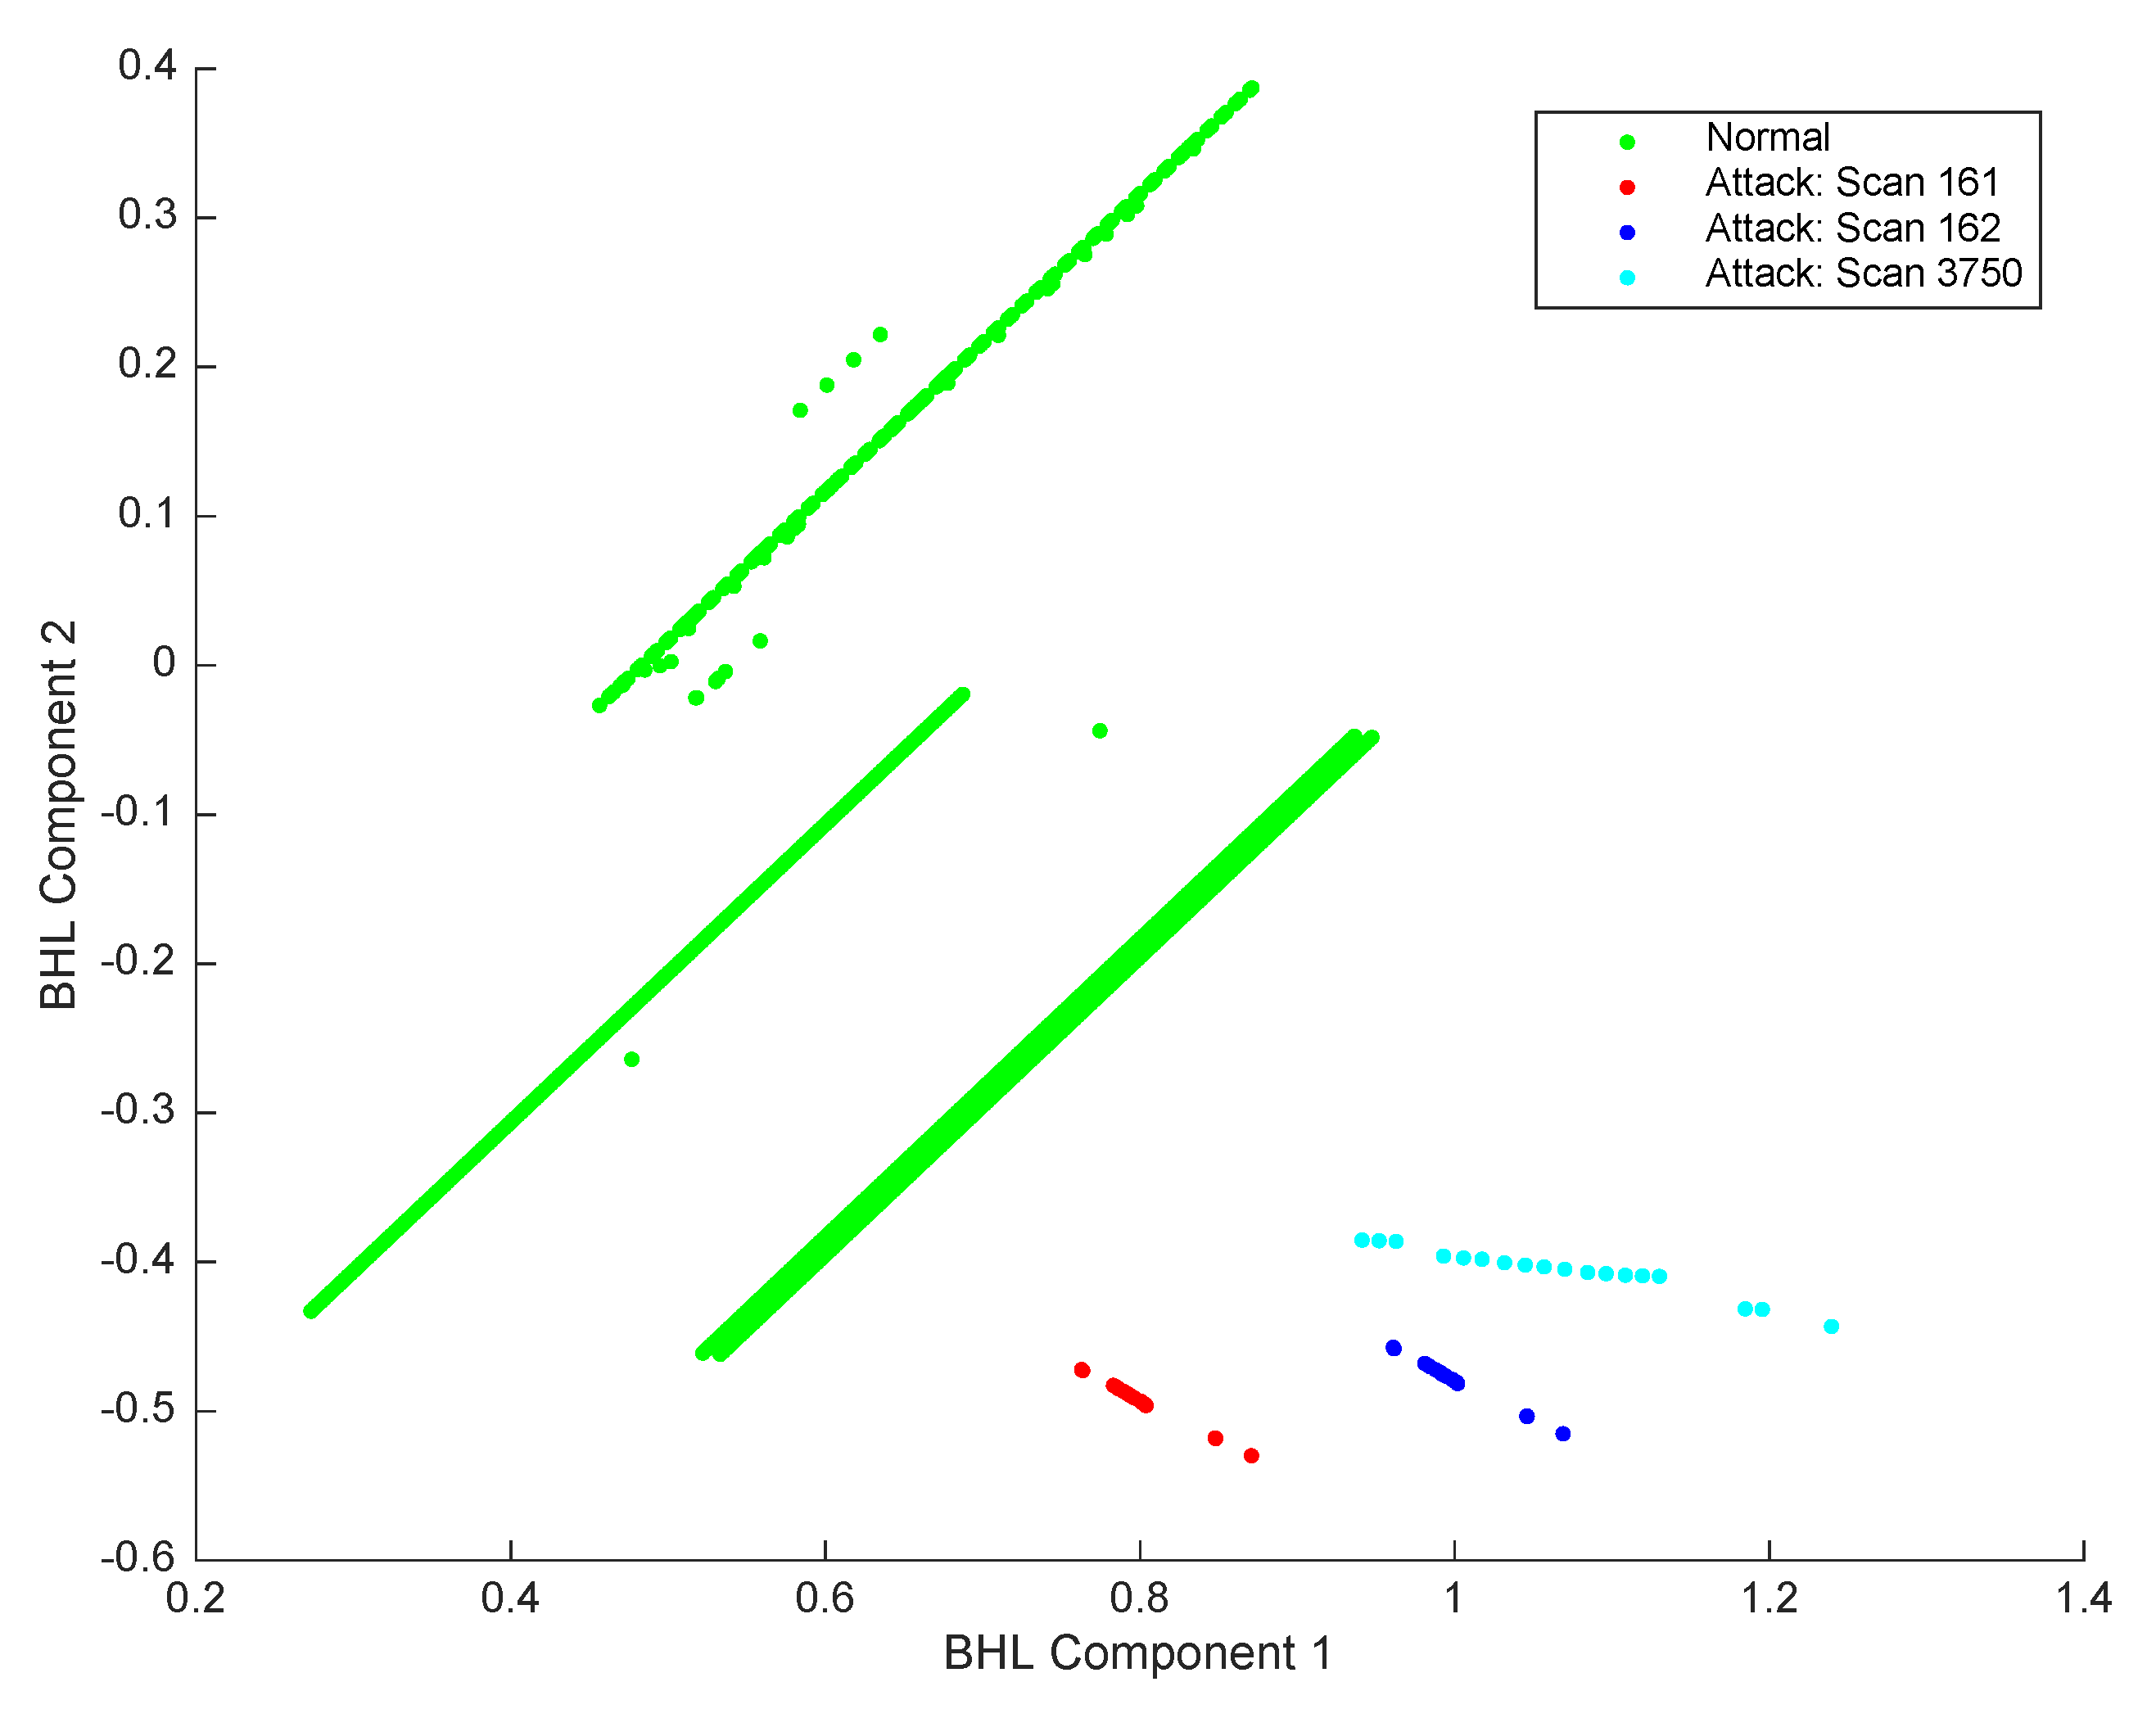
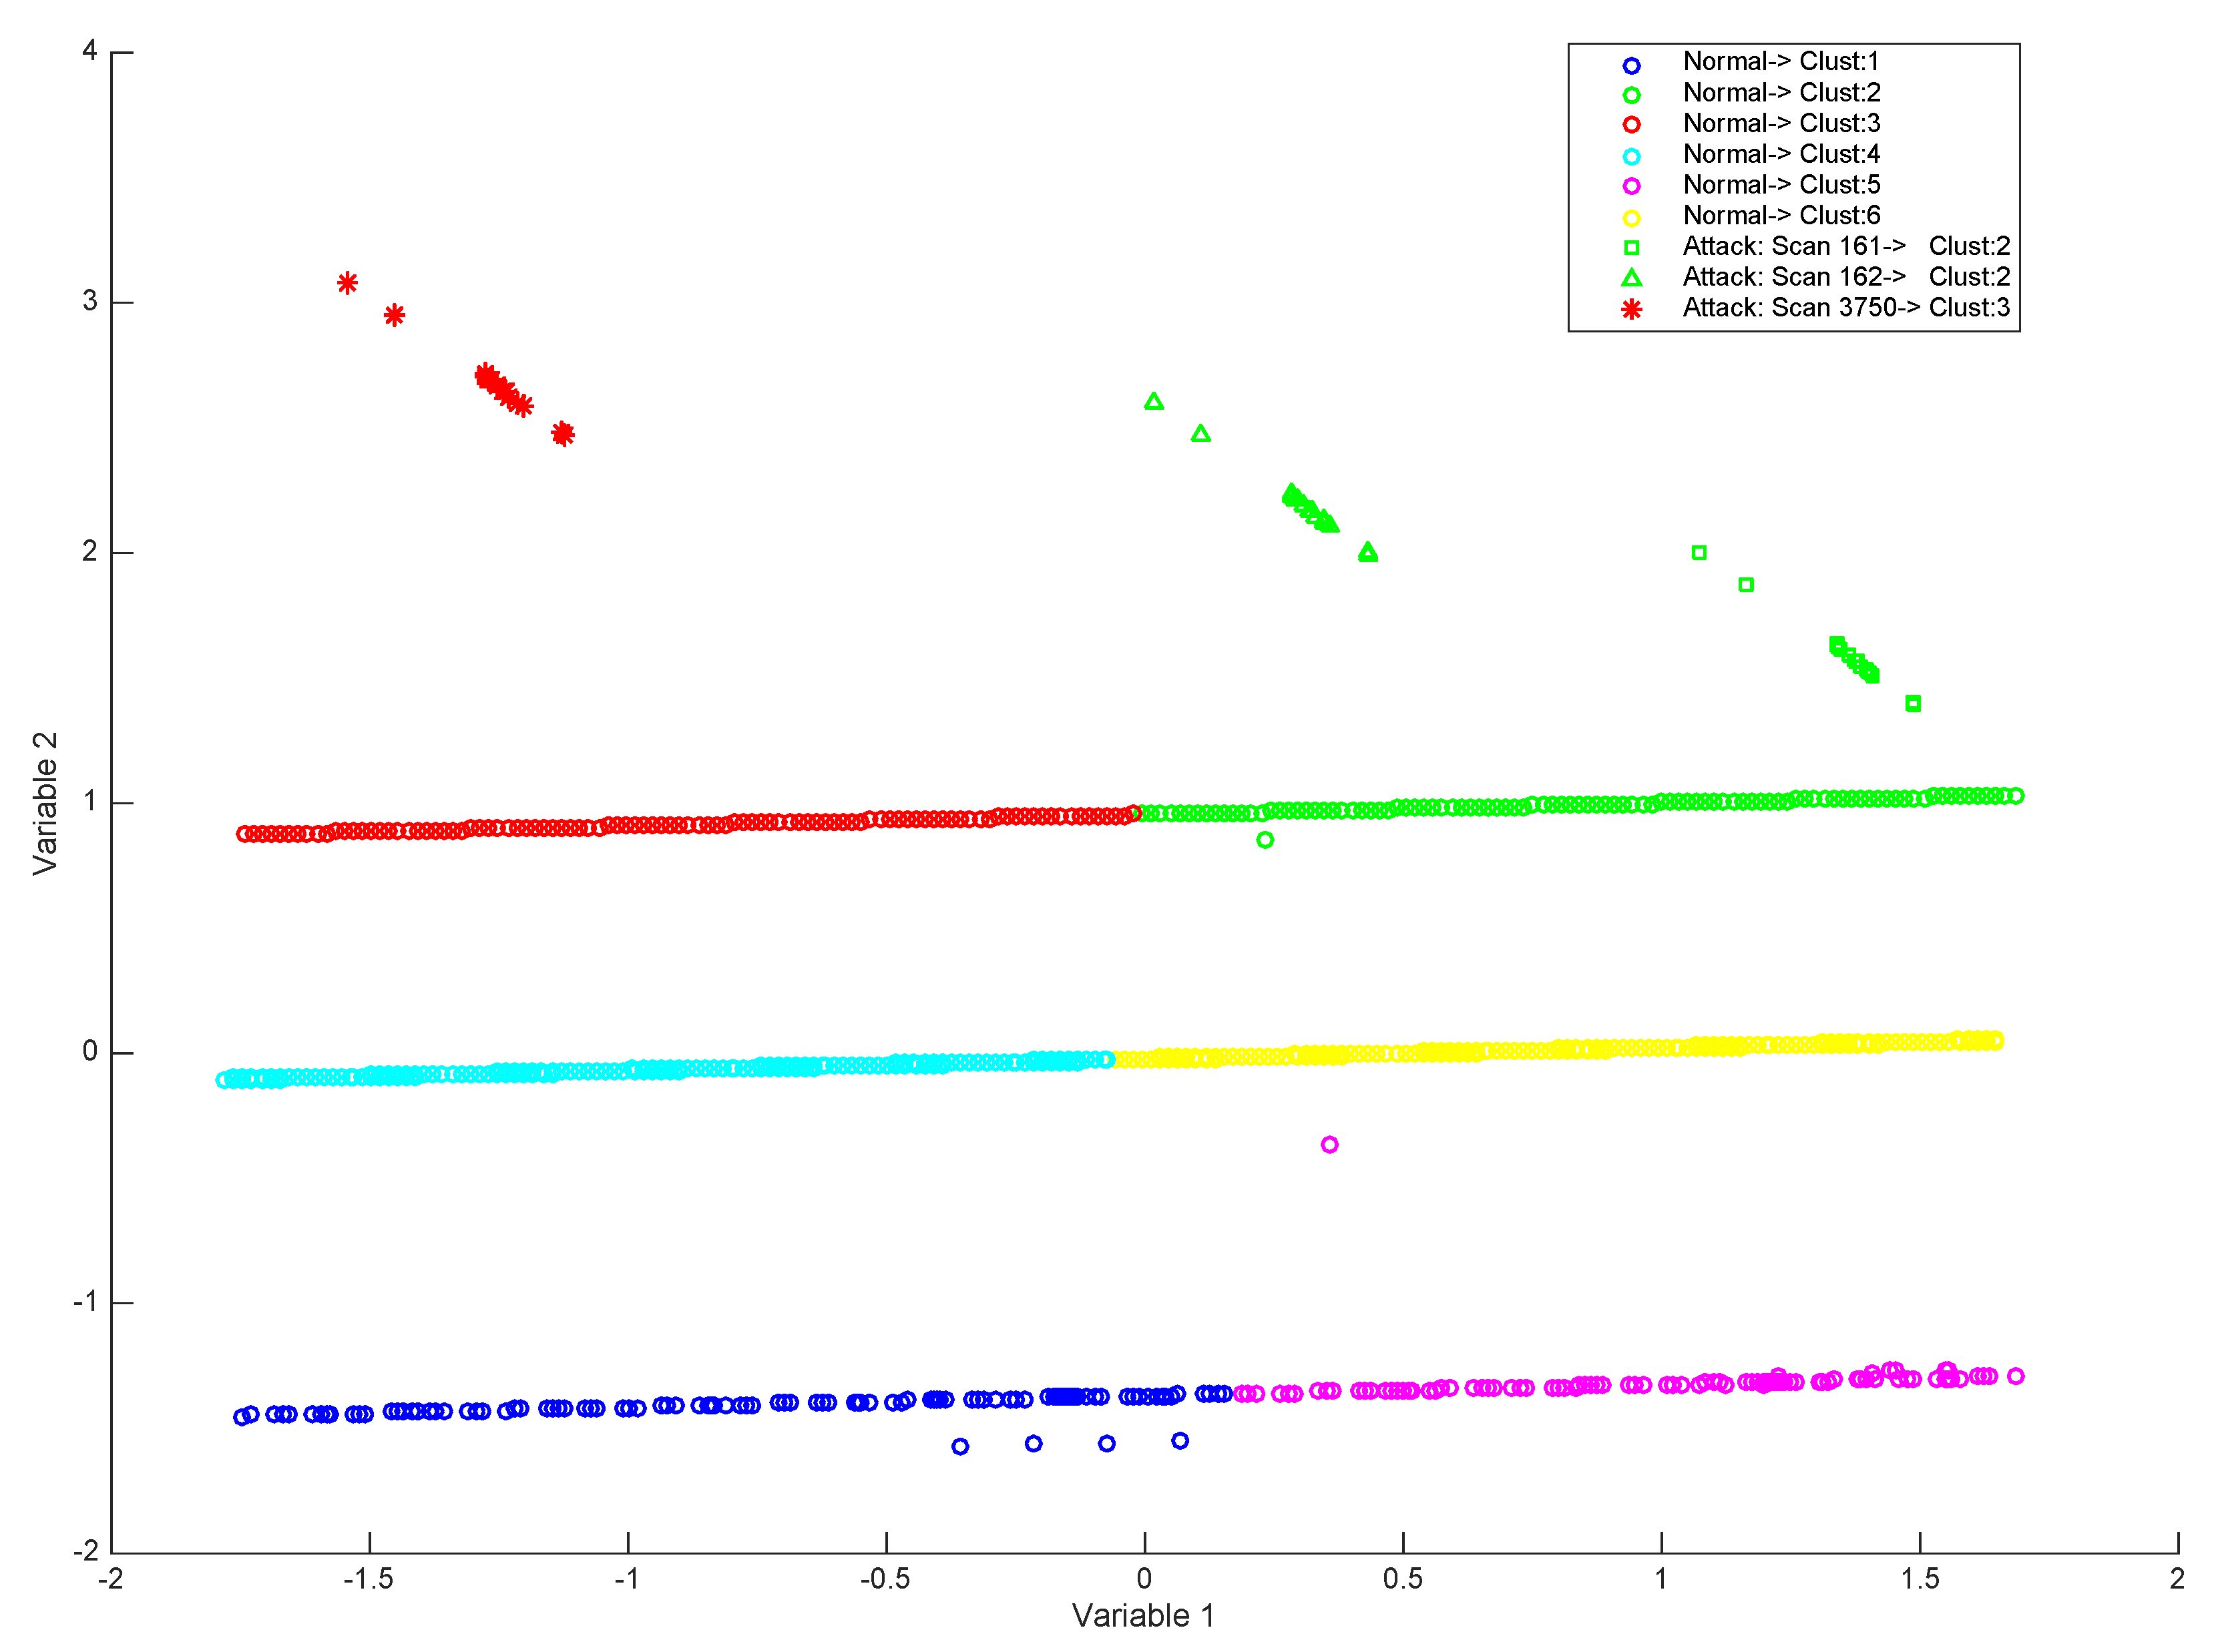
| 1 | Type of attack: Scans. In this type of attack, diverse messages are sent to various host ports to extract information about the activity status. An external agent could send these messages with the aim of getting information about host network services. However, in the case of a network scan, the target of several hosts is a specific port (frequently, a single IP address range for all hosts). The target port numbers are 161, 162, and 3750 in the same IP address range for all machines. | 866 | 18 attacks × 3 ports attacks |
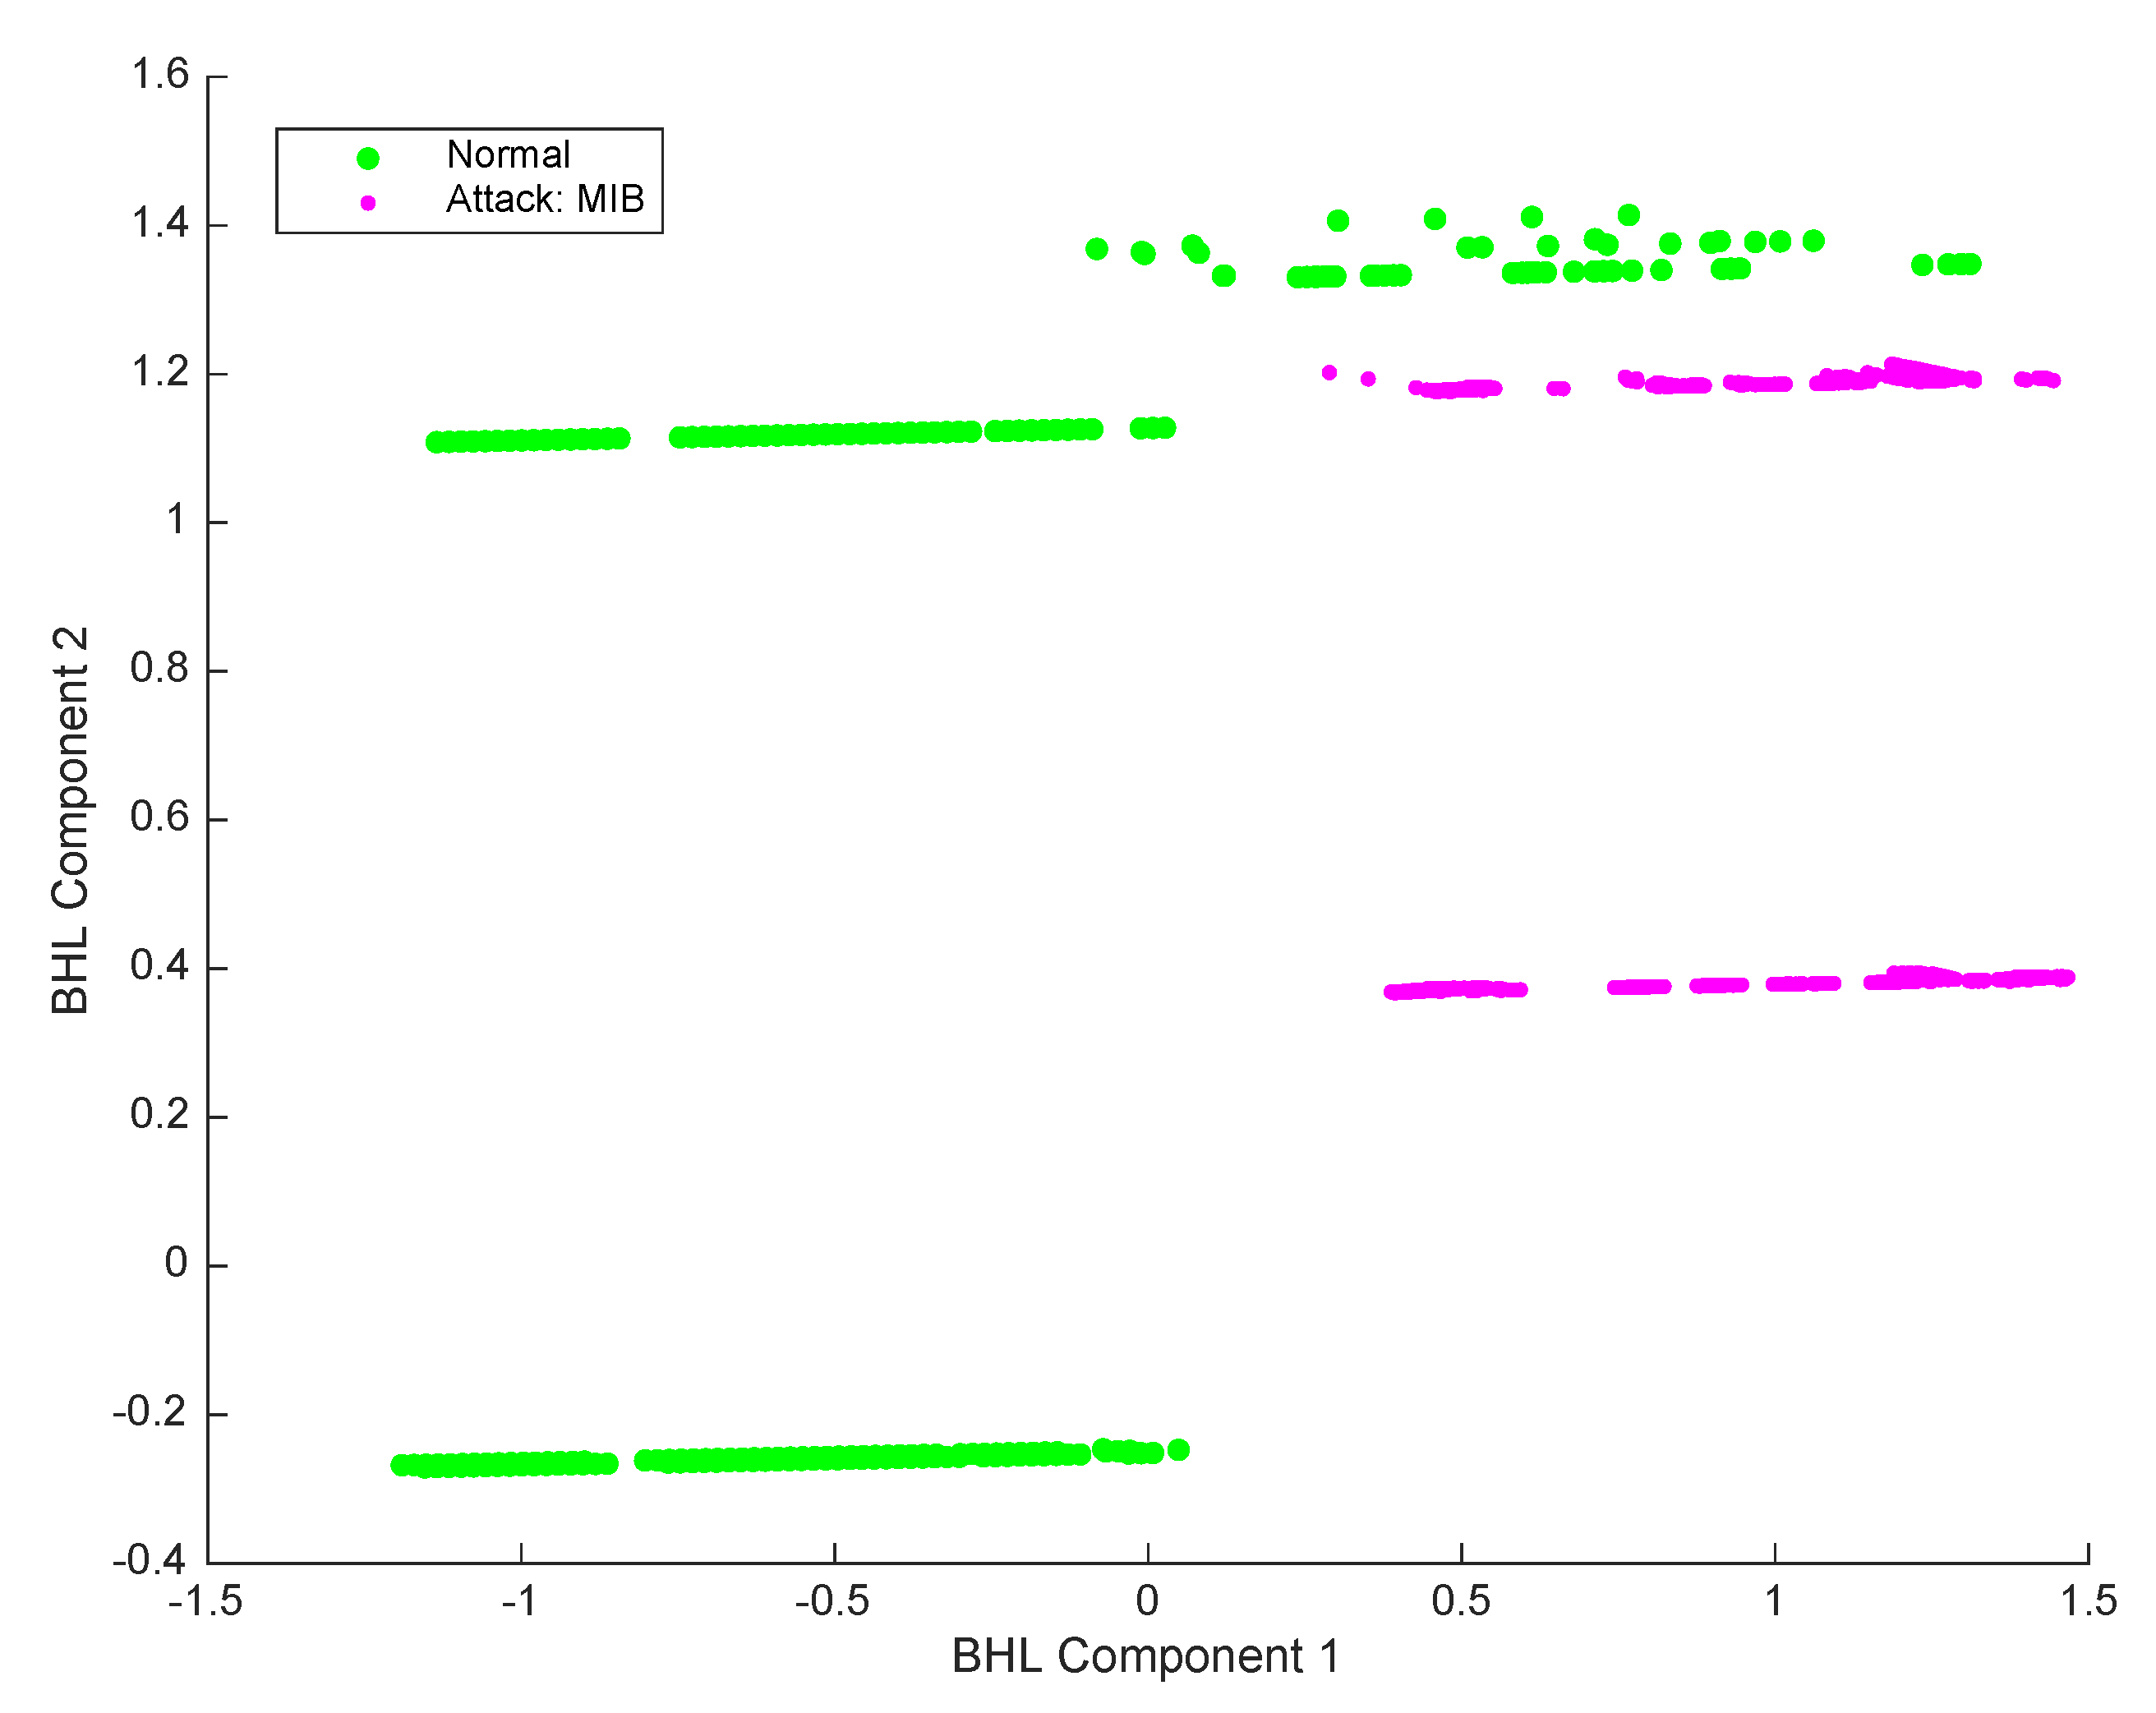
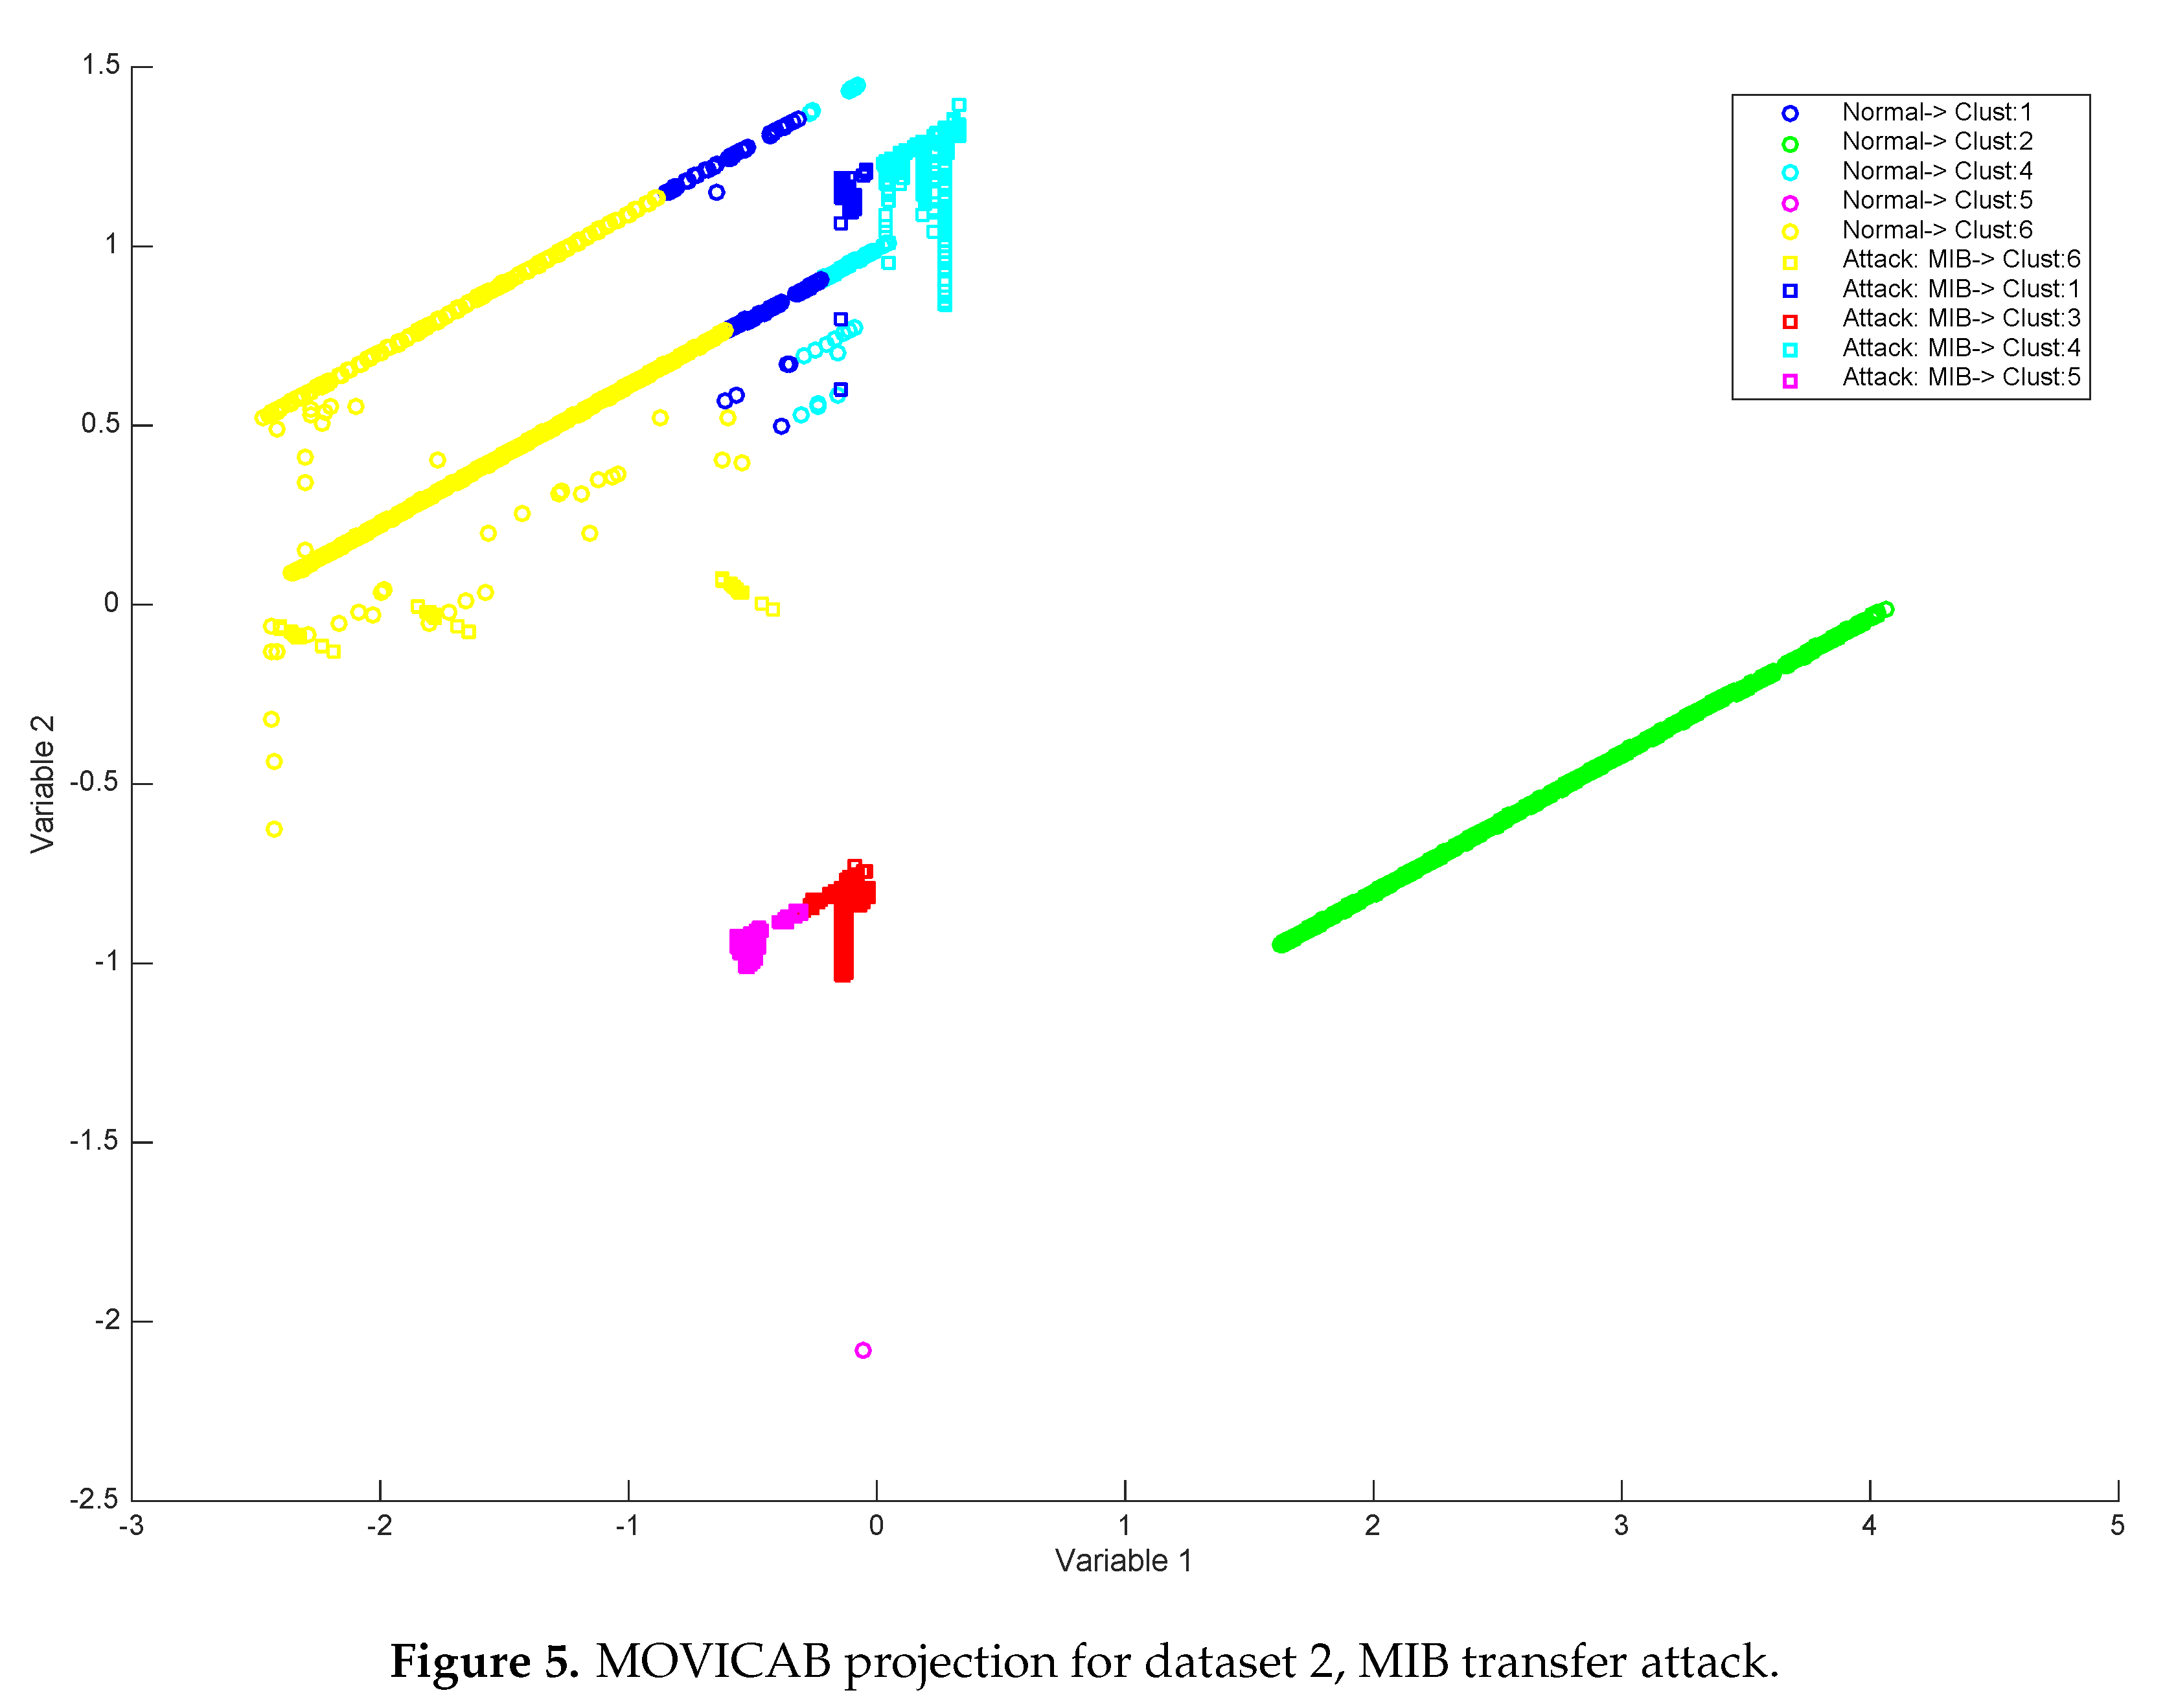
| 2 | Type of attack: MIB (management information base) Information Transfer. In this attack part of the information (or all) of SNMP MIB is captured, usually by means of get/get-bulk command, which represents a potentially dangerous situation. However, some queries of MIB could belong to a “normal” network behavior. | 5000 | 226 attacks |
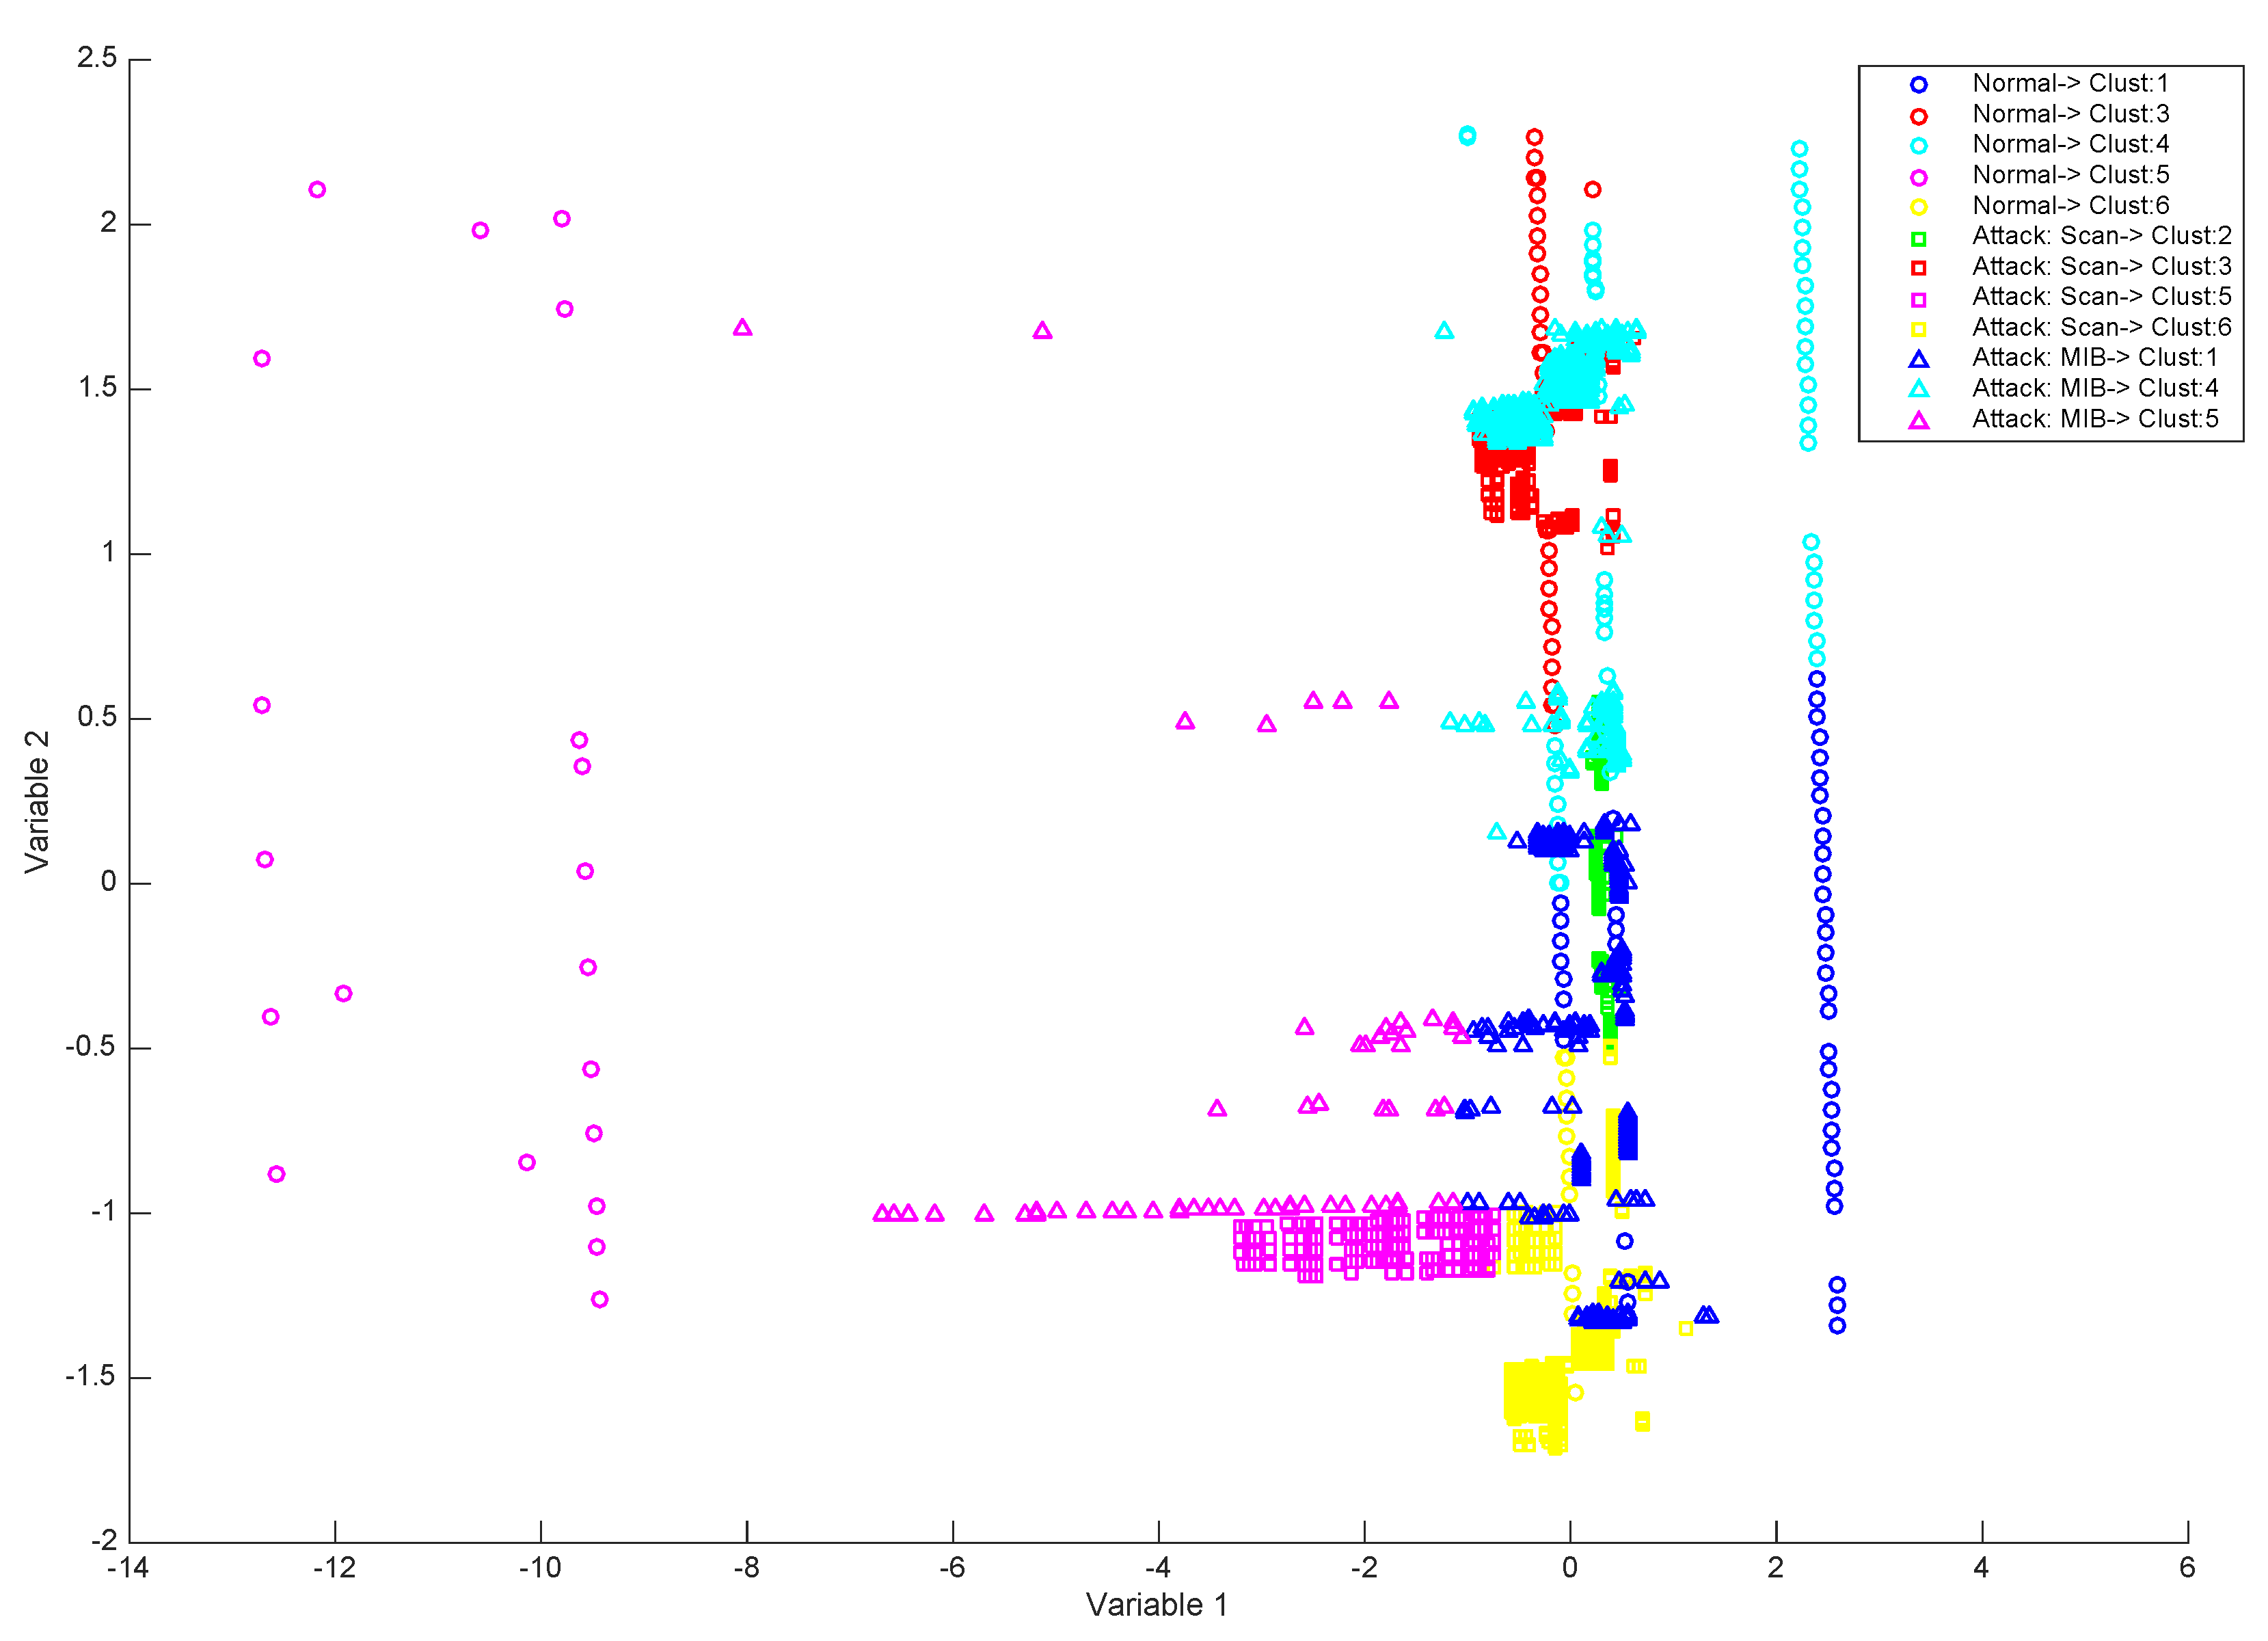
| 3 | Type of attack: It is a combination of Scan and MIB Information Transfer. | 5866 | 18 attacks × 3 ports port attacks and 226 MIB attacks |
| Algorithm | Parameters |
|---|---|
| BHL (dataset 1) | iters = 3000, lrate = 0.01, , |
| BHL (dataset 2) | iters = 10,000, lrate = 0.01, , |
| BHL (dataset 3) | iters = 10,000, lrate = 0.05, , |
| k-means (dataset 1, 2 and 3) | k = 6, random initialization of the centroids, sqEuclidean distance |
© 2020 by the authors. Licensee MDPI, Basel, Switzerland. This article is an open access article distributed under the terms and conditions of the Creative Commons Attribution (CC BY) license (http://creativecommons.org/licenses/by/4.0/).
Share and Cite
Vega Vega, R.A.; Chamoso-Santos, P.; González Briones, A.; Casteleiro-Roca, J.-L.; Jove, E.; Meizoso-López, M.d.C.; Rodríguez-Gómez, B.A.; Quintián, H.; Herrero, Á.; Matsui, K.; et al. Intrusion Detection with Unsupervised Techniques for Network Management Protocols over Smart Grids. Appl. Sci. 2020, 10, 2276. https://doi.org/10.3390/app10072276
Vega Vega RA, Chamoso-Santos P, González Briones A, Casteleiro-Roca J-L, Jove E, Meizoso-López MdC, Rodríguez-Gómez BA, Quintián H, Herrero Á, Matsui K, et al. Intrusion Detection with Unsupervised Techniques for Network Management Protocols over Smart Grids. Applied Sciences. 2020; 10(7):2276. https://doi.org/10.3390/app10072276
Chicago/Turabian StyleVega Vega, Rafael Alejandro, Pablo Chamoso-Santos, Alfonso González Briones, José-Luis Casteleiro-Roca, Esteban Jove, María del Carmen Meizoso-López, Benigno Antonio Rodríguez-Gómez, Héctor Quintián, Álvaro Herrero, Kenji Matsui, and et al. 2020. "Intrusion Detection with Unsupervised Techniques for Network Management Protocols over Smart Grids" Applied Sciences 10, no. 7: 2276. https://doi.org/10.3390/app10072276
APA StyleVega Vega, R. A., Chamoso-Santos, P., González Briones, A., Casteleiro-Roca, J.-L., Jove, E., Meizoso-López, M. d. C., Rodríguez-Gómez, B. A., Quintián, H., Herrero, Á., Matsui, K., Corchado, E., & Calvo-Rolle, J. L. (2020). Intrusion Detection with Unsupervised Techniques for Network Management Protocols over Smart Grids. Applied Sciences, 10(7), 2276. https://doi.org/10.3390/app10072276