Article

Hyperspectral Inversion Model of Chlorophyll Content in Peanut Leaves

1
National Center for International Collaboration Research on Precision Agricultural Aviation Pesticides, Spraying Technology (NPAAC), South China Agricultural University, Guangzhou 510642, China
2
College of Engineering, South China Agricultural University, Guangzhou 510642, China
3
College of Agriculture, South China Agricultural University, Guangzhou 510642, China
4
College of Electronics Engineering, South China Agricultural University, Guangzhou 510642, China
*
Authors to whom correspondence should be addressed.
Appl. Sci. 2020, 10(7), 2259; https://doi.org/10.3390/app10072259
Submission received: 25 February 2020 / Revised: 19 March 2020 / Accepted: 23 March 2020 / Published: 26 March 2020

Abstract

:

Featured Application

We conducted this study to characterize reflectance spectra of peanut leaves and develop models for chlorophyll detection in peanuts. A new normalized difference spectral indices (NDSI), ratio spectral index (RSI), difference spectral index (DSI) and soil-adjusted spectral index (SASI) based on the original spectral at leaf level were calculated with the range of 350–2500 nm. These sensitive spectral indices and regression equations can be used to predict the chlorophyll content of peanut leaves.

Abstract

The purpose of this study is to determine a method for quickly and accurately estimating the chlorophyll content of peanut plants at different plant densities. This was explored using leaf spectral reflectance to monitor peanut chlorophyll content to detect sensitive spectral bands and the optimum spectral indicators to establish a quantitative model. Peanut plants under different plant density conditions were monitored during three consecutive growth periods; single-photon avalanche diode (SPAD) and hyperspectral data derived from the leaves under the different plant density conditions were recorded. By combining arbitrary bands, indices were constructed across the full spectral range (350–2500 nm) based on blade spectra: the normalized difference spectral index (NDSI), ratio spectral index (RSI), difference spectral index (DSI) and soil-adjusted spectral index (SASI). This enabled the best vegetation index reflecting peanut-leaf SPAD values to be screened out by quantifying correlations with chlorophyll content, and the peanut leaf SPAD estimation models established by regression analysis to be compared and analyzed. The results showed that the chlorophyll content of peanut leaves decreased when plant density was either too high or too low, and that it reached its maximum at the appropriate plant density. In addition, differences in the spectral reflectance of peanut leaves under different chlorophyll content levels were highly obvious. Without considering the influence of cell structure as chlorophyll content increased, leaf spectral reflectance in the visible (350–700 nm): near-infrared (700–1300 nm) ranges also increased. The spectral bands sensitive to chlorophyll content were mainly observed in the visible and near-infrared ranges. The study results showed that the best spectral indicators for determining peanut chlorophyll content were NDSI (R520, R528), RSI (R748, R561), DSI (R758, R602) and SASI (R753, R624). Testing of these regression models showed that coefficient of determination values based on the NDSI, RSI, DSI and SASI estimation models were all greater than 0.65, while root mean square error values were all lower than 2.04. Therefore, the regression model established according to the above spectral indicators was a valid predictor of the chlorophyll content of peanut leaves.

1. Introduction

Chlorophyll is the primary substance used by green plants to absorb, transform and transmit light energy via photosynthesis and is associated with processes related to plant growth and senescence, photosynthetic capacity, disease, nutrition and environmental stress [1]. Therefore, the evaluation of chlorophyll content is of great significance in the study of plant physiology and ecology, as it is a measure of photosynthetic capacity, nitrogen levels and developmental status. The nitrogen (N) status of plant leaves is closely related to chlorophyll content; studies show that when plant N levels are high, plant growth tends to be strong and chlorophyll content increases [2]. Chlorophyll absorption provides the necessary link between remote sensing observations and canopy state variables, so canopy state variables are used as indicators of plant N status and photosynthesis [3]. The main methods used in determining chlorophyll content are ultraviolet spectrophotometry, fluorescence analysis and chlorophyll in vivo, all of which are not only time-consuming but may also damage the studied vegetation. In contrast, hyperspectral technology, now a developed and mature technology that is increasingly being widely used in crop monitoring, carries advantages of low consumption, velocity and no vegetation damage, it therefore provides new opportunities to obtain plant physiological information [4,5,6]. Hyperspectral spectrometry predicts chlorophyll content by measuring the reflectance of plant leaves. The response of leaf and canopy spectral reflectance or transmittance to photosynthetic pigments can be used as a powerful means to monitor crop growth, regulate fertilizer application and estimate expected yield. The hyperspectral inversion model is established by processing the emissivity by applying spectral differentiation technology and statistical analysis technology; exploring the relationship between hyperspectral reflectance and its various variations and peanut chlorophyll by curve fitting analysis. Hyperspectral inversion of chlorophyll content was first carried out at the leaf scale and then developed at the canopy scale. Two methods are generally employed for estimating vegetation physiological parameters using hyperspectral data: (i) Optical radiation transmission model [7,8]; and (ii) determining the empirical relationship between vegetation physiological parameters and spectral vegetation indices [9].
The spectral index method is beneficial to extract crop physiological and ecological information from remote sensing data [10], it is also important in analyzing imaging spectrometer data. Its main purpose is to enhance information contained in the spectral reflectance data by extracting changes caused by vegetation characteristics (e.g., chlorophyll and the leaf area index) while minimizing the geometric effects of soil, atmosphere and solar sensors [11], as well as to improve the utilization of spectral information and accuracy of the estimation model [12]. Spectral vegetation indices are mathematical combination of different spectral bands, mainly distributed in the visible (VIS) and near-infrared (NIR) regions of the electromagnetic spectrum [1]. It is often used to evaluate various plant leaf properties, such as the leaf area index (LAI), biomass, chlorophyll content or N content. Most current spectral indices are calculated using a ratio of two or three bands, or the normalized difference; of these, the normalized difference vegetation index (NDVI) and ratio vegetation index (RVI) are widely used in the analysis of multispectral information derived from crops, due to their simple structure and convenient calculation methodology [13,14]. In addition, Broge and Leblanc (2001) have shown that RVI is the best method for estimating the low-density vegetation leaf area index (LAI) and canopy chlorophyll density (CCD); they propose a triangular vegetation index (TVI) sensitive to both chlorophyll content and LAI, based on the area of the triangle with vertices of green, red and NIR wavelengths. Haboudane et al. (2008) established a triangular chlorophyll index (TCI) based on the green, red and red-edge bands to estimate the crop leaf chlorophyll content, which is a modified version of the triangular vegetation index (TVI) because it makes TVI more sensitive to chlorophyll effects. Hunt et al. (2013) proposed the establishment of a triangular greenness index (TGI) based on the red, green and blue bands. This index estimates the chlorophyll concentration in leaves and the canopy based on the area of the triangle. TGI is indicated to be sensitive to canopy chlorophyll content and relatively insensitive to LAI [15].
Peanut is a widely cultivated cash crop worldwide and is important in global agricultural production and trade [16]. Appropriate density and planting methods are the basis for improving the utilization rate of light energy. Therefore, it is one of the effective ways to increase peanut yield by selecting appropriate planting methods and density to increase peanut yield. In this study, peanut was used as research objects, allocated to seven different density treatments. Data for peanut leaves were determined by field experiments using single-photon avalanche diode (SPAD) and hyperspectral analysis. A novel method was used to systematically explore and identify sensitive bands, develop simpler spectral indicators and use hyperspectral sensing information to establish a peanut chlorophyll estimation model of greater accuracy than other models. Therefore, the aims of this study were as follows: (i) to explore the effect of planting density on chlorophyll content during the peanut growth period; (ii) to analyze the spectral characteristics of peanut canopies under different chlorophyll levels; and (iii) to identify the sensitive spectral bands of peanut chlorophyll and adjust the chlorophyll spectral estimation model according to different vegetation indices.

2. Materials and Methods
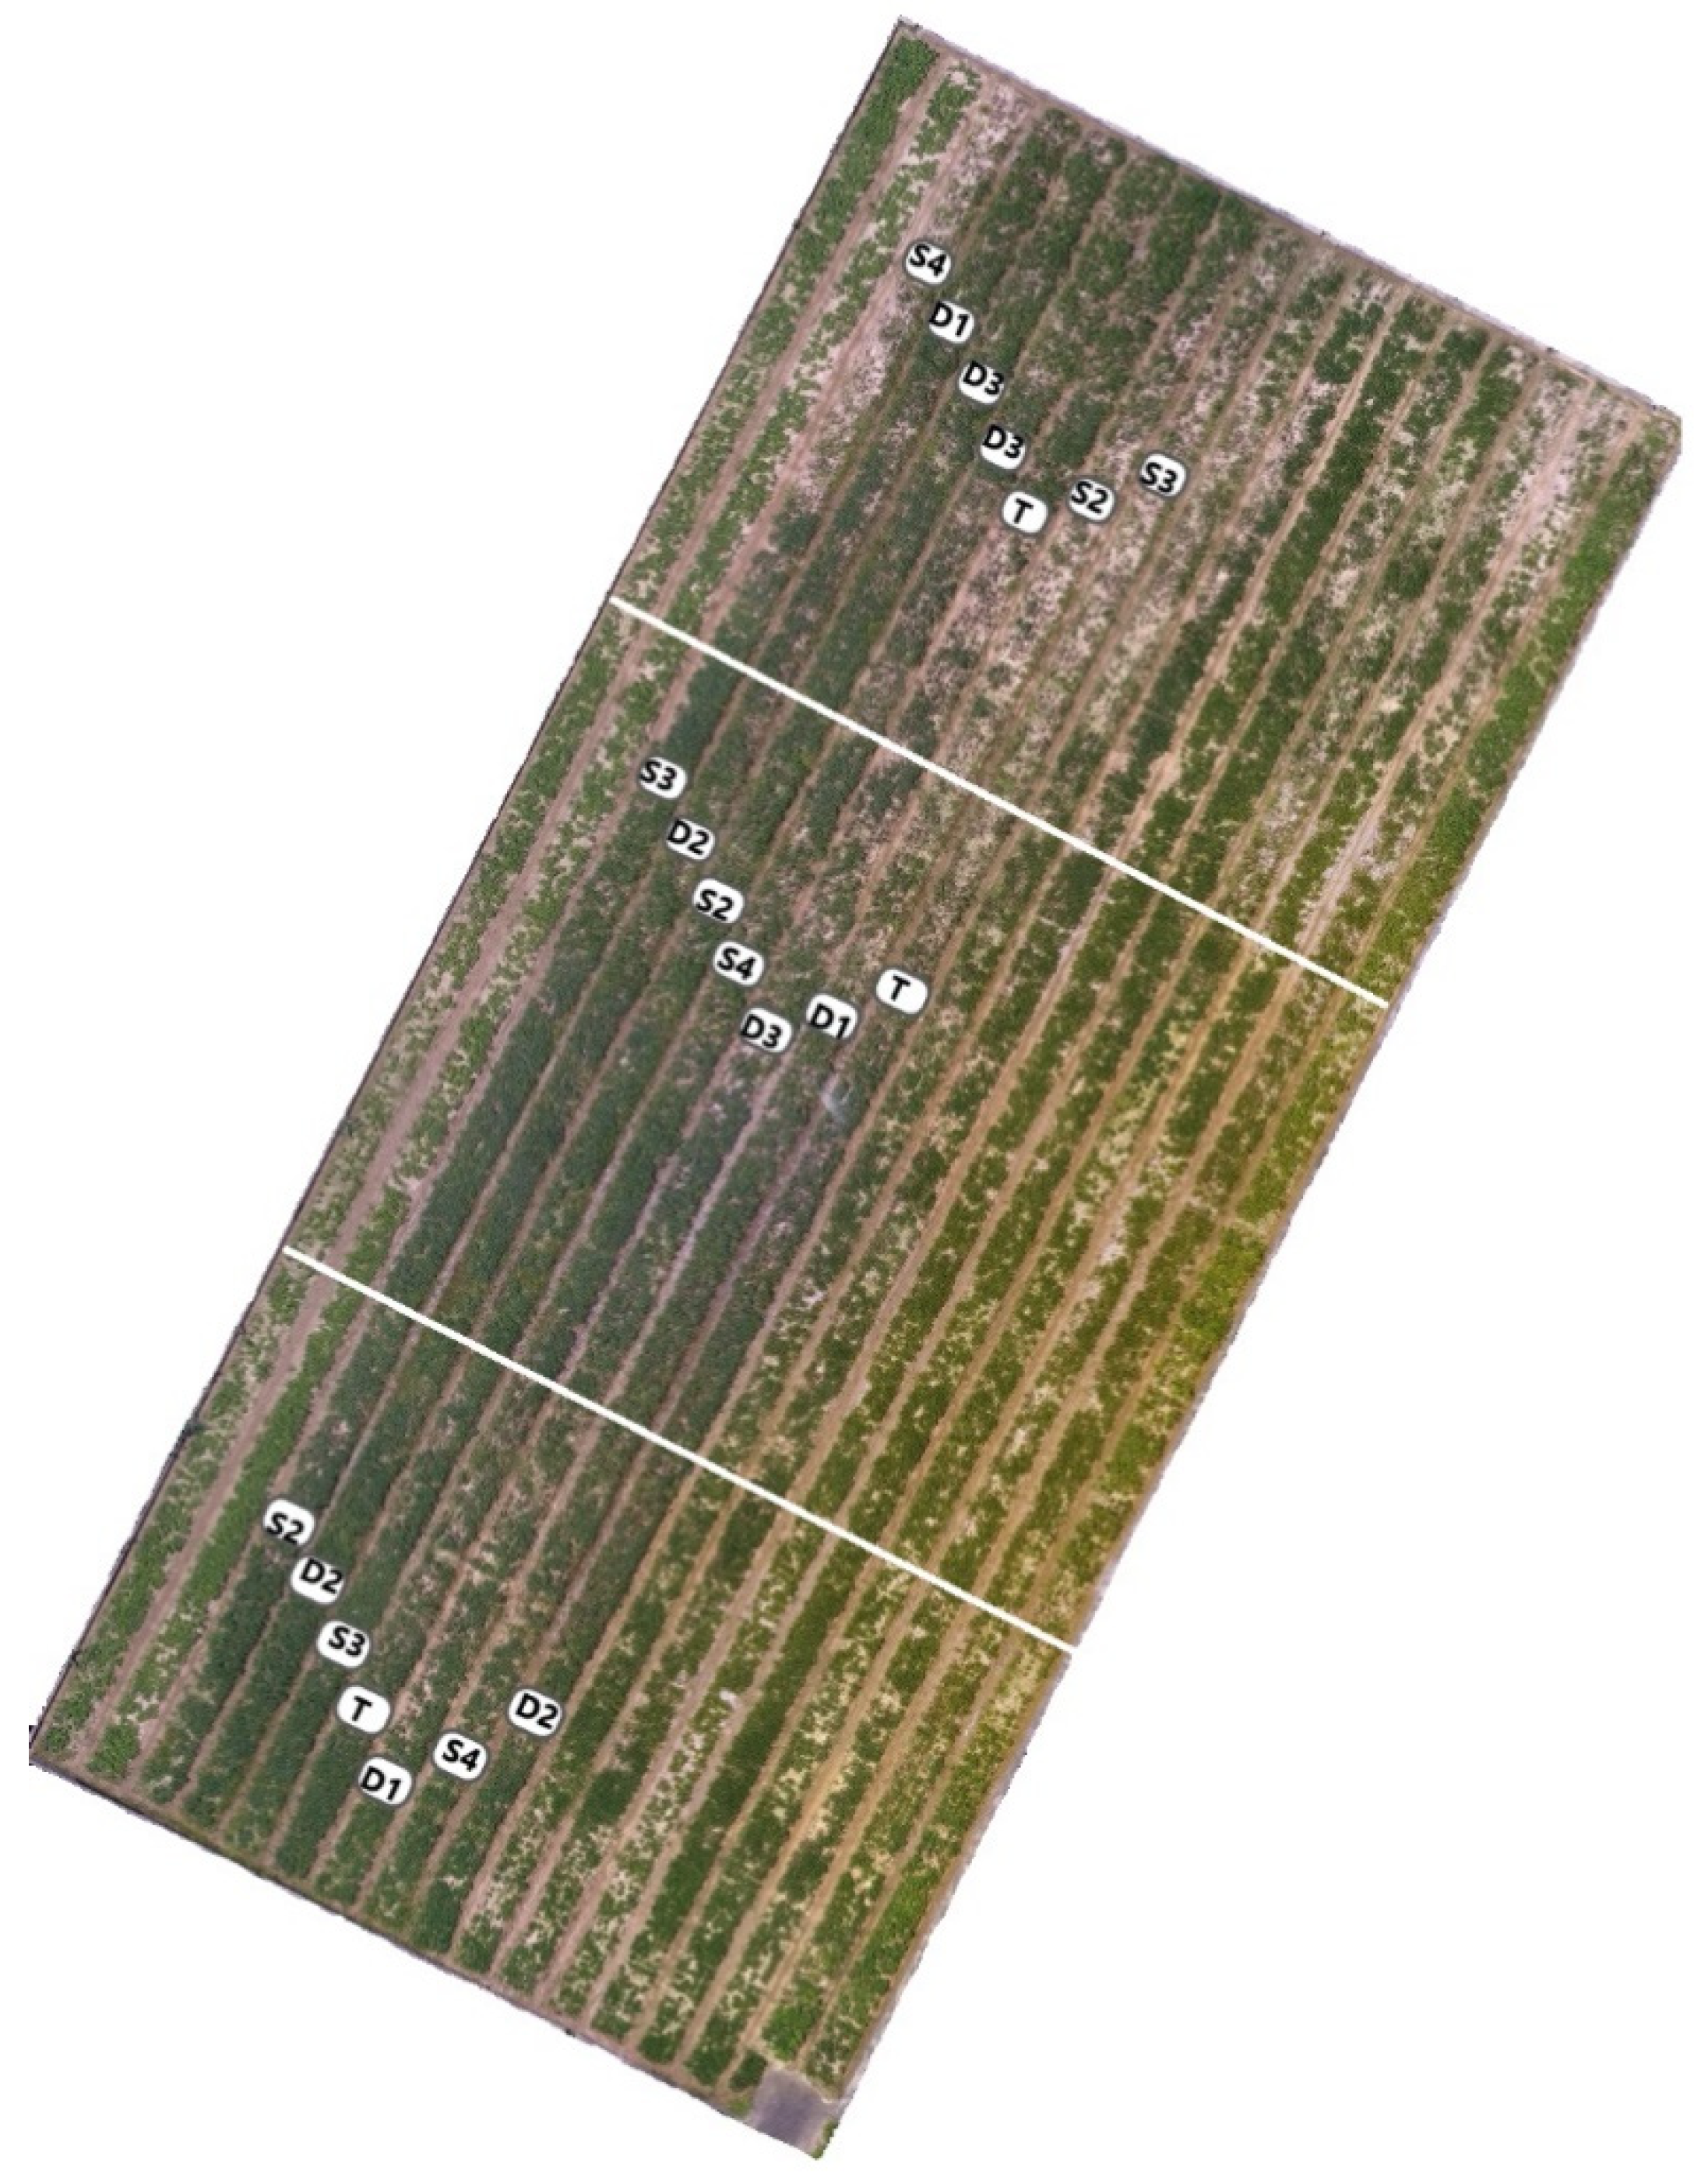
2.1. Test Design

Field experiments were conducted in 2019 at the Zengcheng Teaching and Research Base of South China Agricultural University (113°63′23″ E, 23°23′94″ N), which is located in a tropical monsoon climate zone, with annual sunshine of 1945 h, annual average temperature of 20–22 °C and annual precipitation of 1623.6–1899.8 mm. A commercial peanut cultivar (Huayu 25) was used in the experiment.
Seven treatments, incorporating single, double and triangular seeding at different plant spacings, were established: single seeding at 8 cm, 10 cm and 12 cm (S1, S2 and S3, respectively); double seeding at 16 cm, 20 cm and 24 cm (D1, D2 and D3, respectively); and triangular seeding at 20 cm (T). A randomized complete block design with three replications was used (Figure 1). Each plot consisted of five rows with row length and in-row spacing of 20 m and 35 cm, respectively. The crops were not stressed and were grown under the recommended fertilization and irrigation conditions.

2.2. Leaf Spectral Data Collection and Determination of Chlorophyll Content

Spectral data for the peanut leaves were collected using a spectroradiometer (ASD Field Spec4; Analytical Spectral Devices, Inc., Boulder, CO, Colorado, USA). This device is a full-band geosynchronous spectrometer with a band range of 350–2500 nm and a sampling interval of 1.4 nm at 350–1000 nm and 2 nm at 1000–2500 nm. Sample sites with no pests and diseases were selected in the test area at the flowering (April 29), pod-bearing (May 18) and mature (June 15) stages. Leaf spectral data were collected separately. Two to three samples of peanut plants in each plot were collected and been brought back to the laboratory for leaf hyperspectral data collection. A whiteboard was used for calibration before each measurement was taken. Vegetation radiance measurements were made at five sample sites on each plot, with each result determined from averaging 10 scans at an optimized integration time. The saved spectrum file contained continuous spectral reflectance in 1-nm steps over the 350–2500 nm bandwidth region. The spectral reflectance difference of each sample was determined using ViewSpec Pro software (Analytical Spectral Devices, Inc., Boulder, CO, Colorado, USA) and the average of the 10 data measured at each sample was used as its spectral reflectance.
Corresponding to the leaf spectrum position, after measuring the spectral reflectance of the selected peanut plants, the chlorophyll content of their leaves was determined using a portable chlorophyll meter (SPAD-502 Plus; Minolta Camera Co. Ltd., Osaka, Japan). Two peanut plants were randomly selected from each density treatment cell. The chlorophyll content of three leaves for each plant was randomly determined and the average of each set of six results was taken to be the chlorophyll content of the related density plot.

2.3. Data Processing

2.3.1. Spectral Data Processing

ViewSpec Pro software was used to convert the original digital number (DN) values recorded in the spectral data into spectral reflectance values [17]. During the spectral measurement process, the original spectrum was affected by factors relating to the environment, human influence and instruments. The spectral curve was collinear and nonlinear, with evidence of data redundancy and other issues. Practice has shown that if the frequency of the noise is high and its magnitude is not large, it can be reduced by the smoothing method to a certain extent. In this study, the original spectrum was smoothed using a five-point weighted average. Practice has proved that this method has a good smoothing effect and has no effect on the original spectral characteristics.
r i = 0.1 R i 2 + 0.2 R i 1 + 0.4 R i + 0.2 R i + 1 + 0.1 R i + 2
where R i ( i = 3 ,   4 ,   , N ) is the reflectance of the original spectral curve measurement point and r i ( i = 3 ,   4 ,   , N ) is the reflectance of the five-point smoothed spectral curve measurement point.

2.3.2. Peanut SPAD

The peanut SPAD values were processed according to measurement time and abnormal data were removed, so that the obtained peanut SPAD values were within a range of 40–70. The data were preliminarily processed in Excel (Microsoft Office 365) and the average value of each observation sample was calculated.

2.3.3. Vegetation Index Selection

We analyzed the vegetation indices used to invert crop chlorophyll in other research [18,19,20,21,22,23] and used this information to select four widely used spectral indices: the normalized difference spectral index (NDSI), ratio spectral index (RSI), difference spectral index (DSI) and soil-adjusted spectral index (SASI) (Table 1). Across the whole 350–2500 nm spectrum, a vegetation index based on the original spectrum was constructed by combining two arbitrary bands. The correlation between the vegetation index and SPAD was analyzed and the contour of the coefficient of determination of the vegetation index and SPAD was obtained. The band corresponding to the largest decision coefficient was selected and its combination was substituted into the newly constructed vegetation indices.

2.3.4. Model Construction and Accuracy Test

The regression analysis method was used to construct the model for estimating chlorophyll content in the peanut leaves. Root mean square error (RMSE), coefficient of determination (R2) and slope values were used to evaluate goodness of fit between the predicted and observed values. Statistical analysis and contour mapping of R2 and standard error (SE) values were processed using a self-programming software (Mathworks, 2000) script. The smaller the RMSE, the higher the model accuracy. The RMSE calculation formula used is as follows:
RMSE = 1 M j = 1 M ( Y j X j ) 2
where Yj and Xj are the predicted and observed values, respectively and M is the number of samples.

3. Results and Analysis

3.1. Descriptive Statistics of Peanut SPAD Data

A total of 40 sample data were obtained. The cross-validation method was used to randomly divide the data into two groups, of which 32 were used as training samples for analysis and modeling and 8 were used as verification samples to verify the accuracy of the model. SPAD values of the training sample were between 35 and 49.35 (Table 2), including the minimum and maximum values for the whole sample. The interval distribution was reasonable and degree of variation relatively large, which is guaranteed in a certain sense the applicable scope of the constructed peanut leaf SPAD estimation model. The descriptive statistics of the verification sample and training sample were similar, therefore verifying the reliability of the established model.

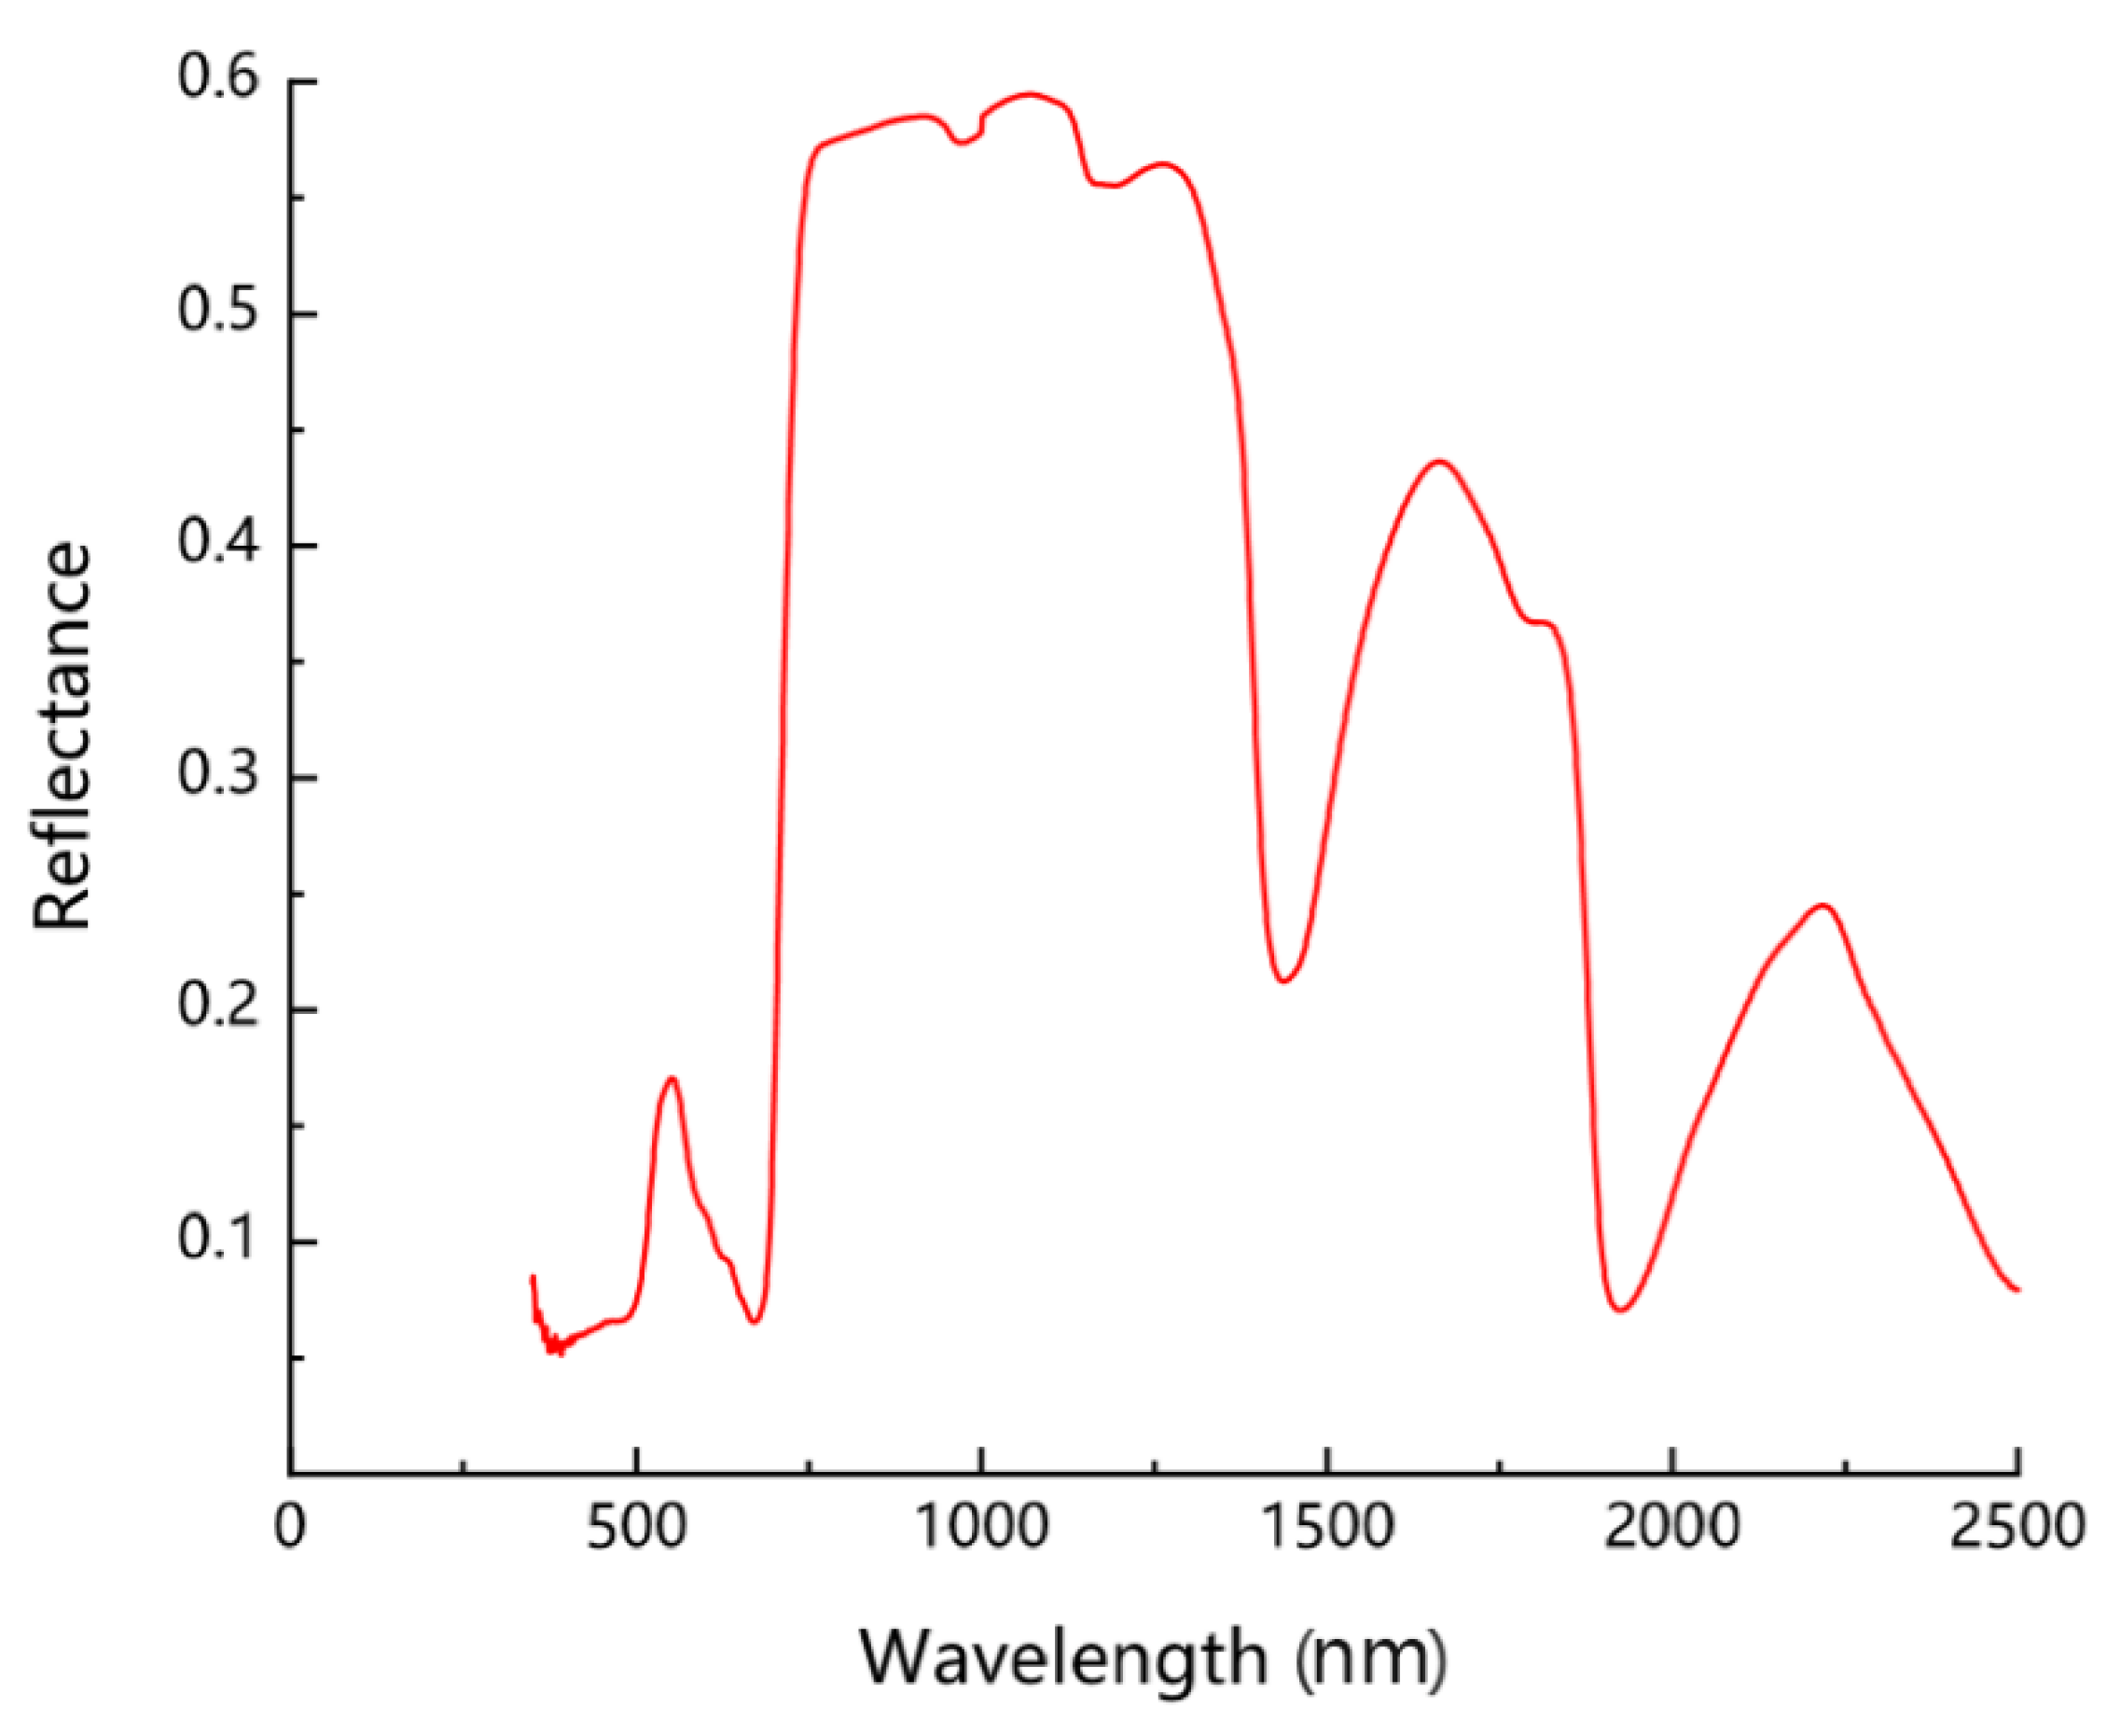
3.2. Relationship between Chlorophyll and Spectral Reflectance of the Peanut Leaves

The spectral reflectance curve for peanut leaves chlorophyll is shown in Figure 2. The reflectivity of peanut leaves is lower in the blue (400–500 nm) and red (650–690 nm) spectral regions. A wide reflection peak was observed in the green wavelength region, concentrated around 550 nm; the minimum reflectance at red wavelengths was concentrated around 680 nm. Reflectivity increased sharply at 680 nm and 750 nm; reflectance reached its maximum value between 750 and 900 nm. In the red-edge region at 680–750 nm, chlorophyll absorption increased at wavelengths above 700 nm; reflectance increased at NIR wavelengths, resulting in a sharp rise in reflectance in the red region.

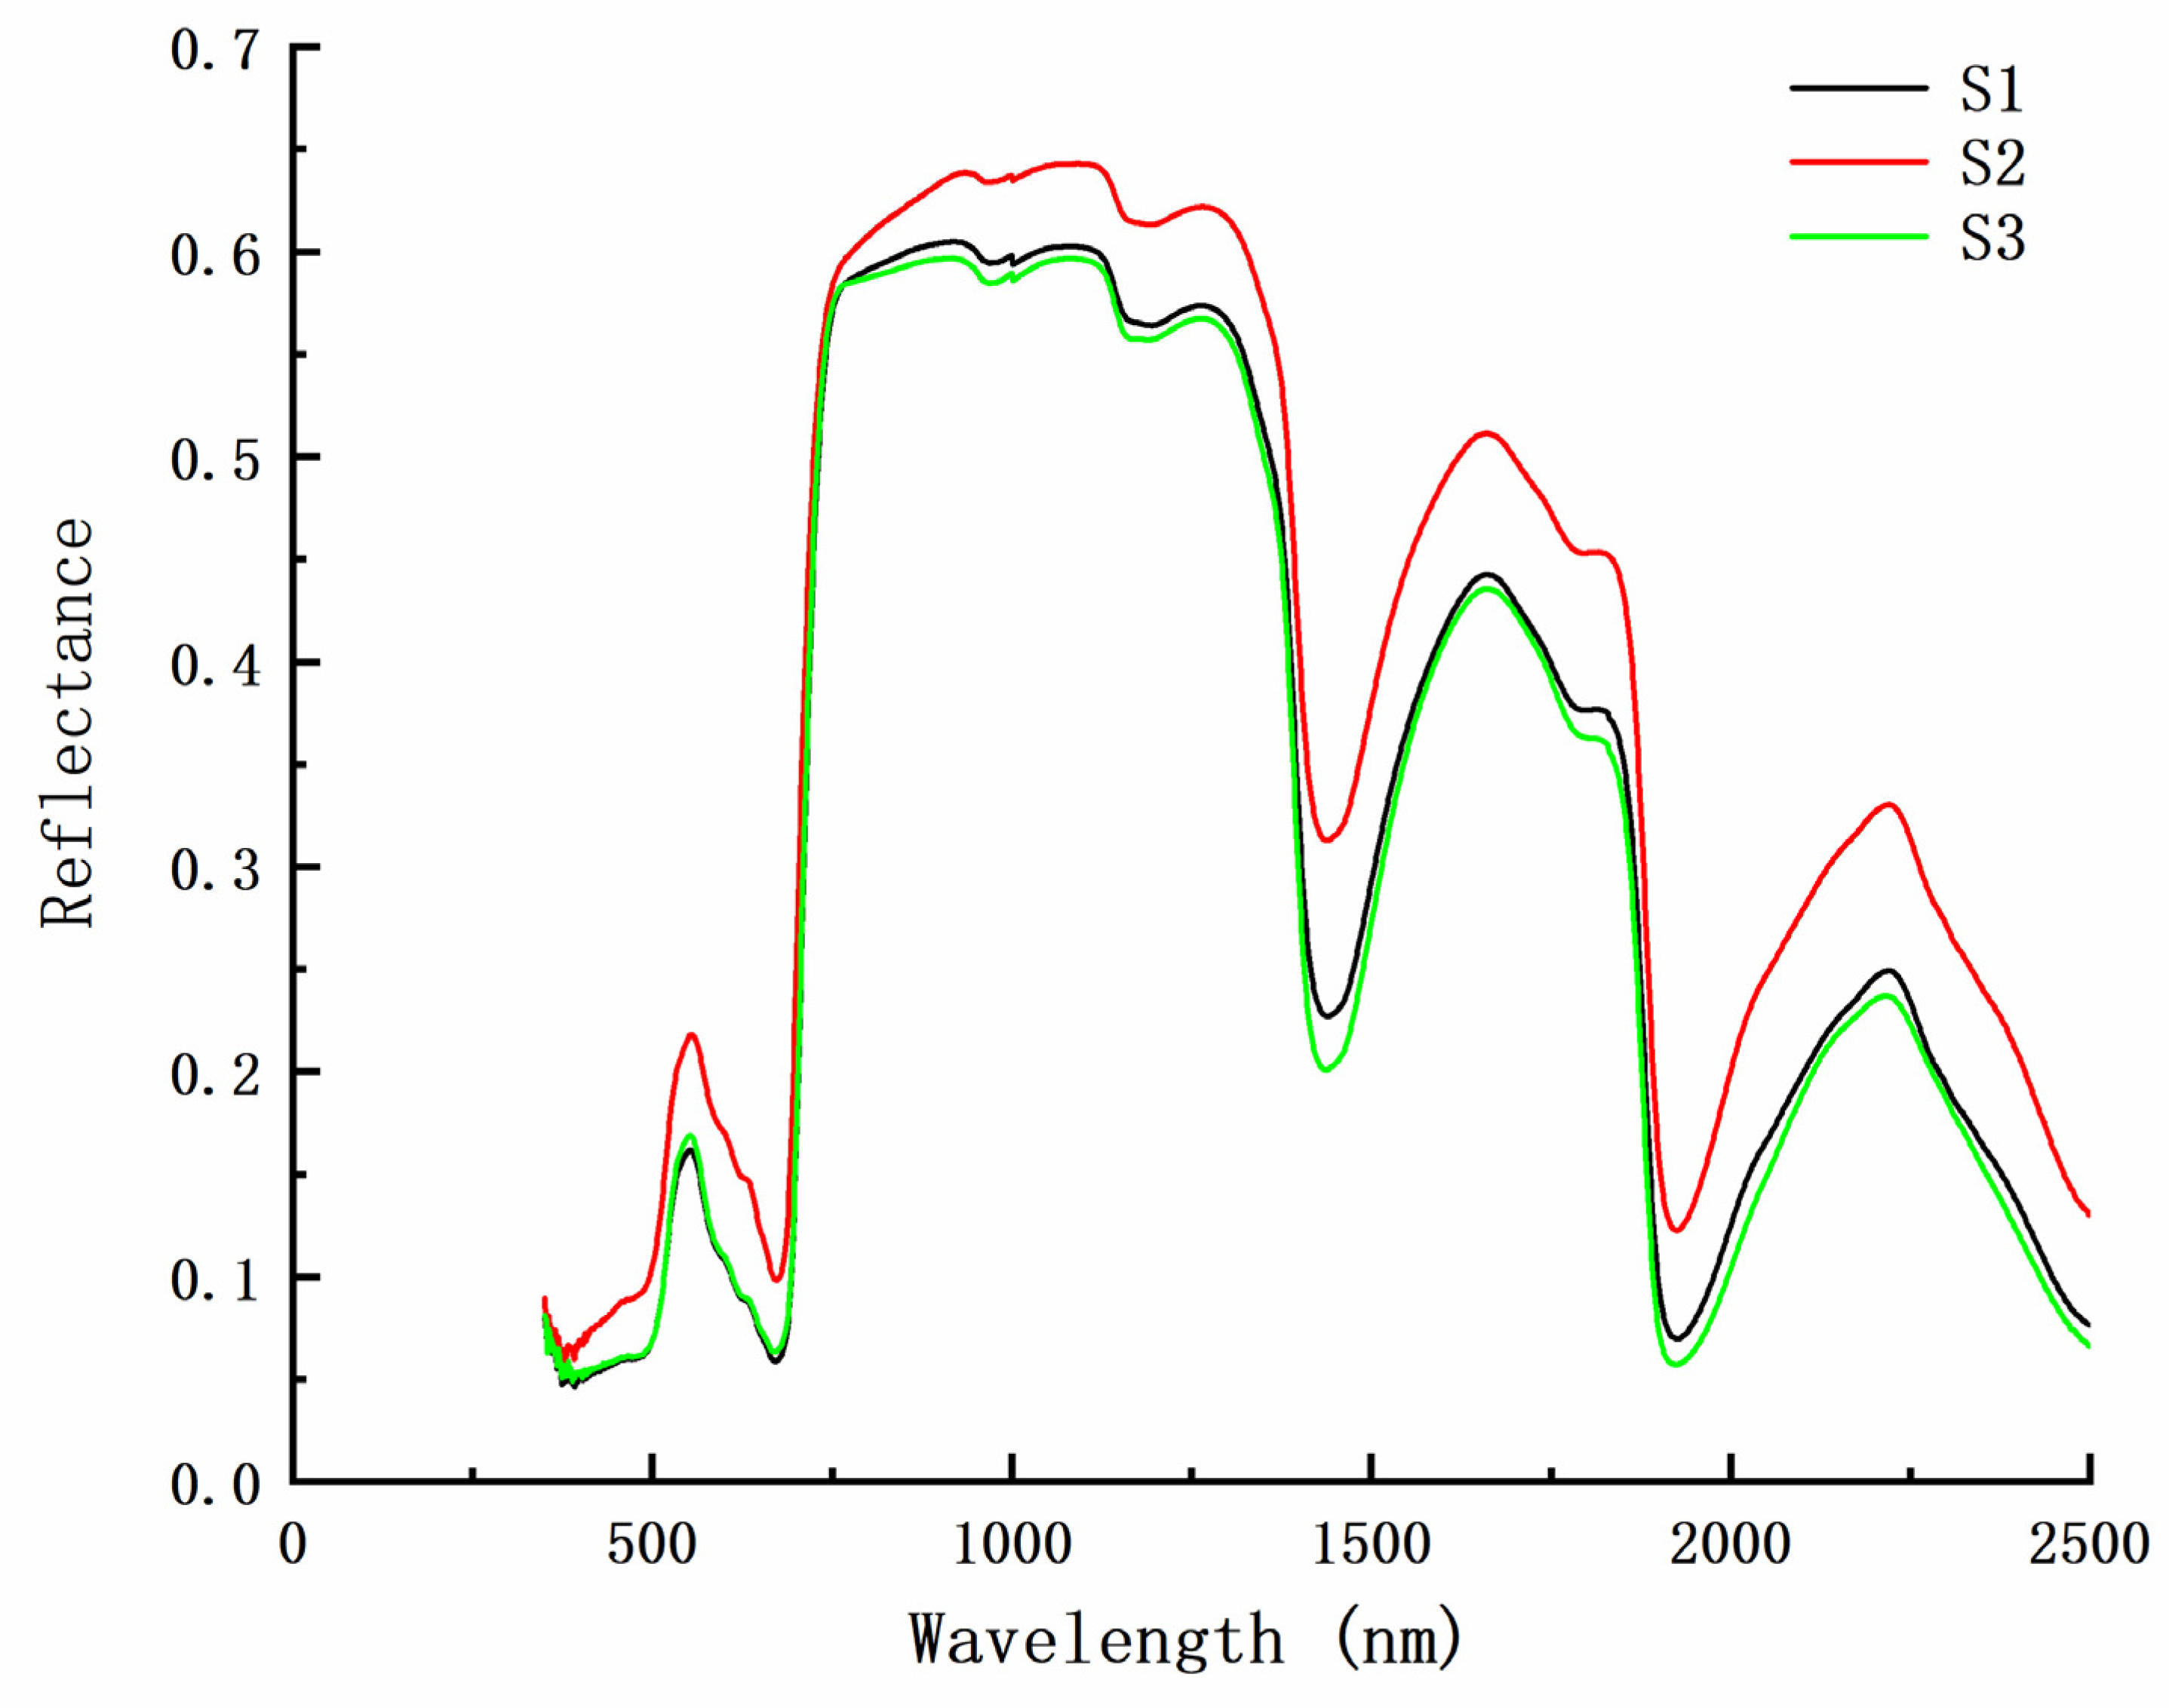
3.3. Relationship between Chlorophyll and Spectral Reflectance in Peanut at Different Densities

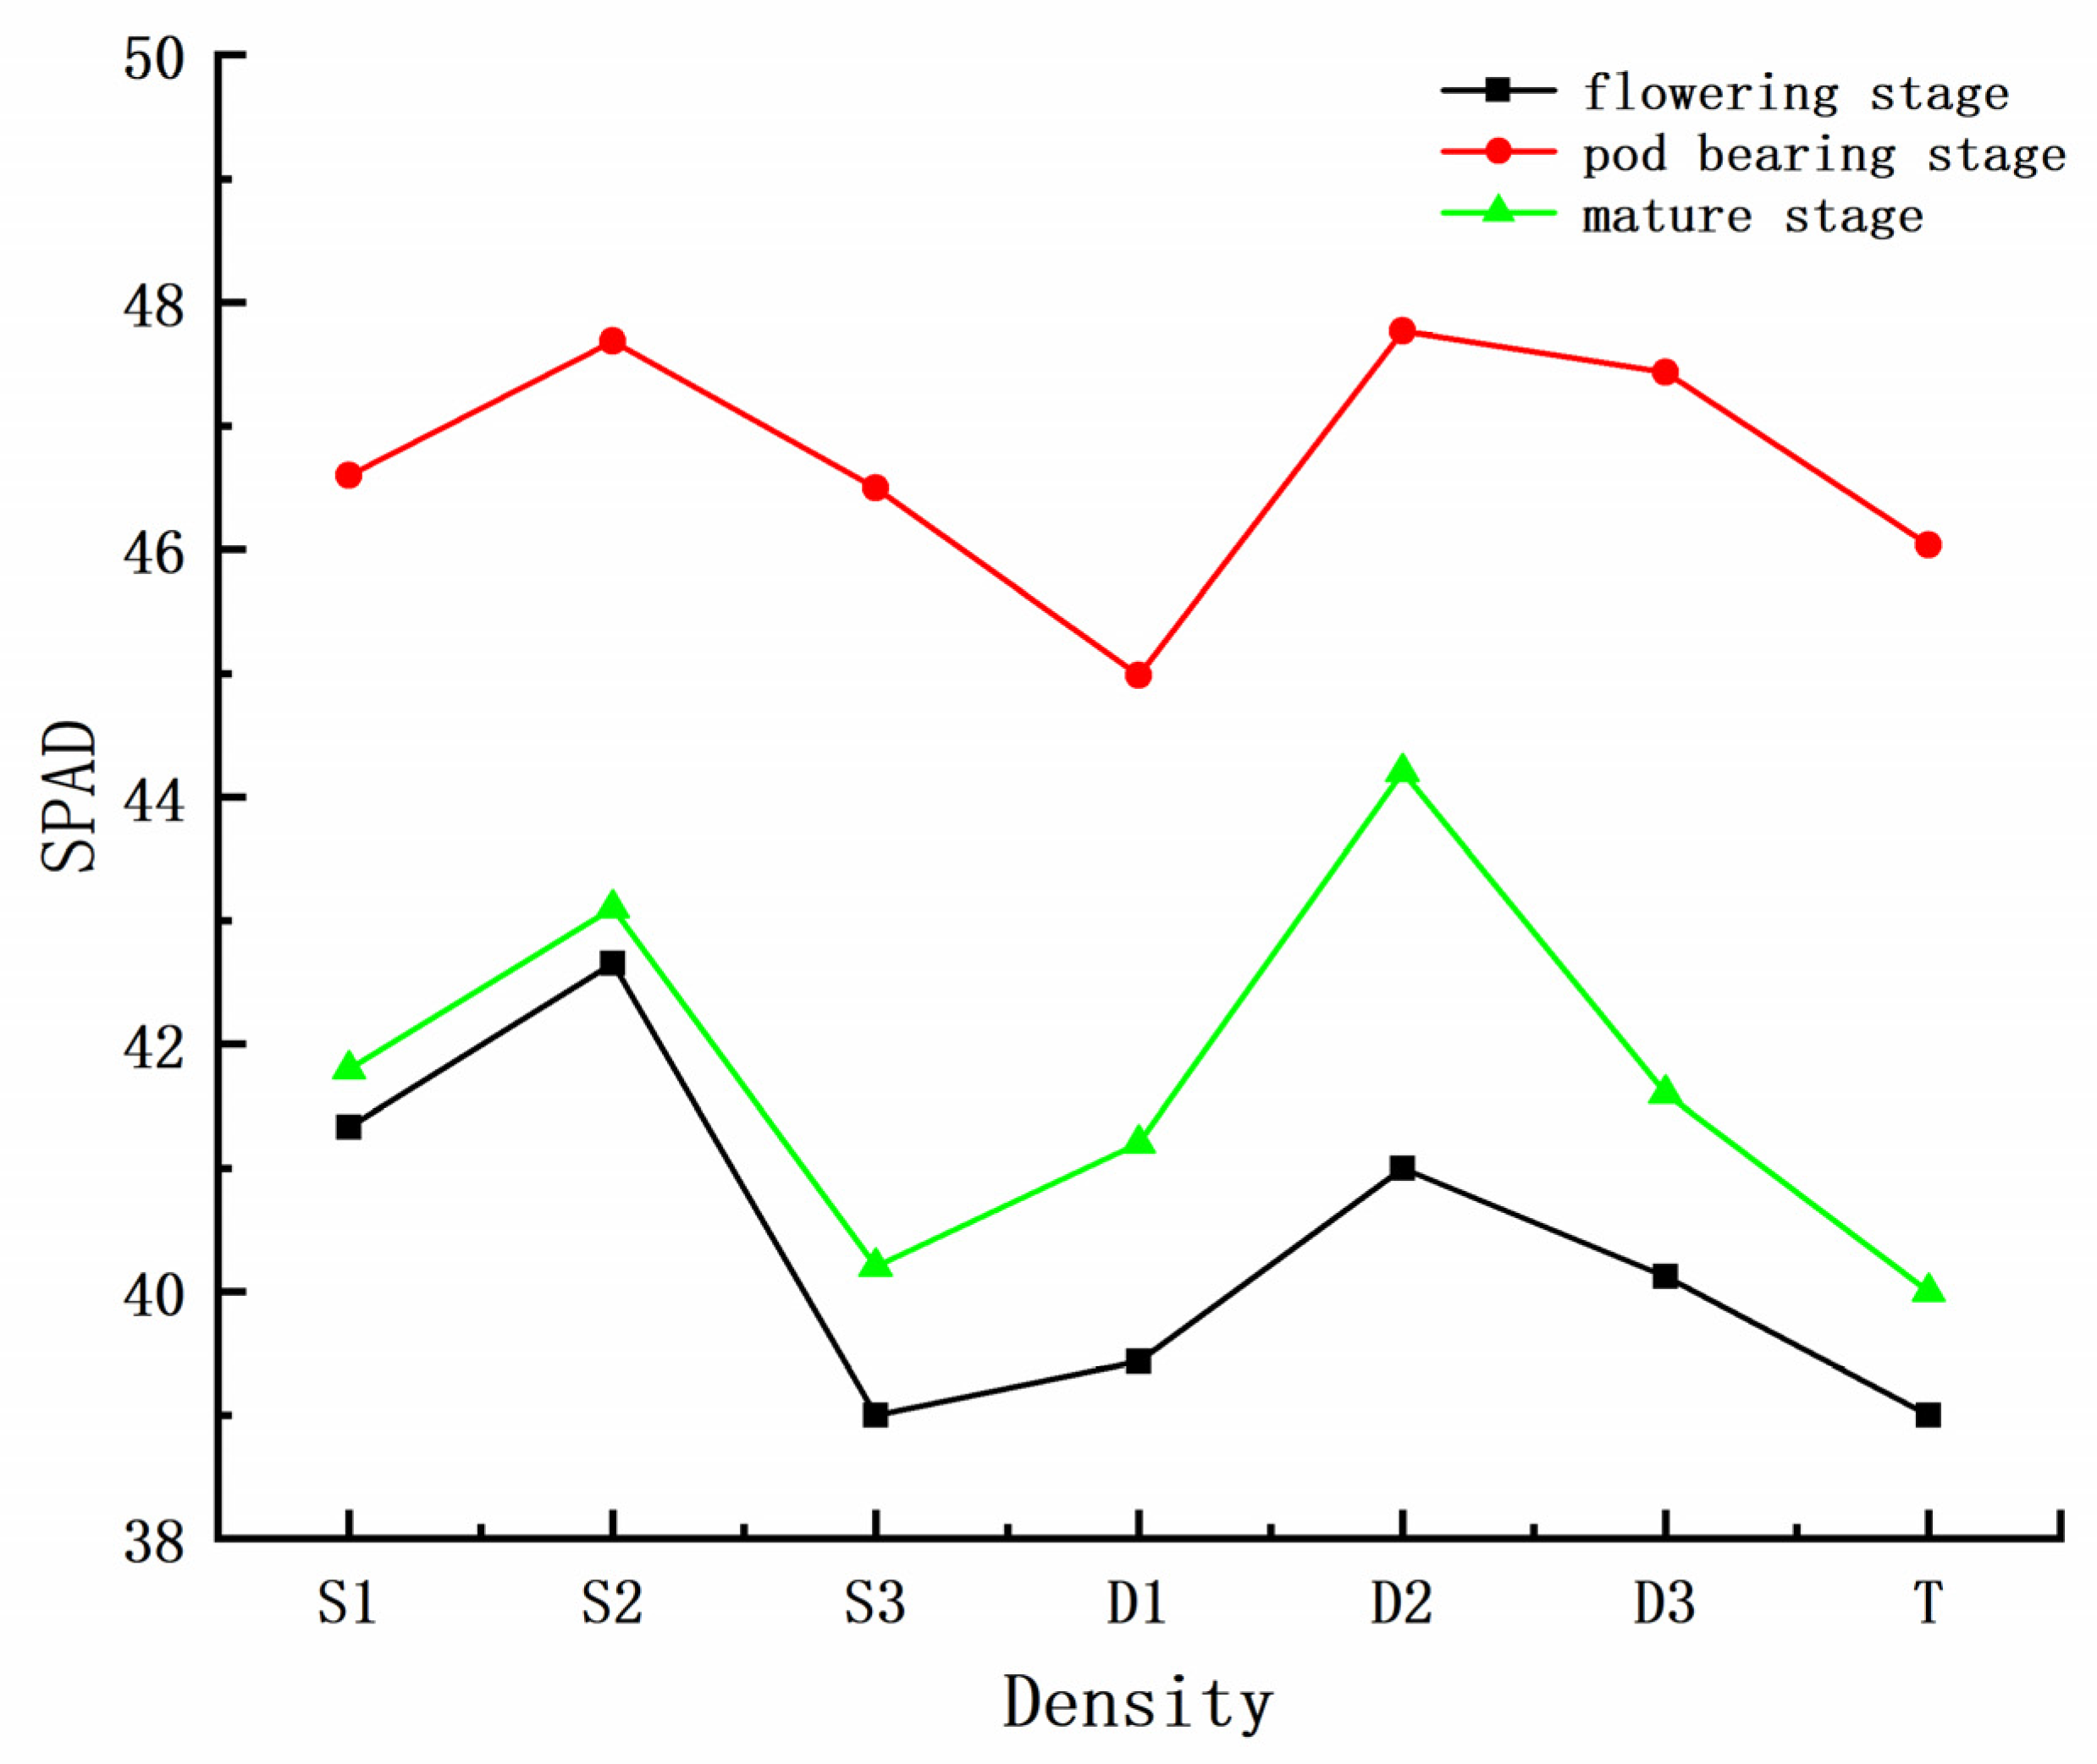
3.3.1. Effect of Planting Density on Chlorophyll Content in Peanut Growth Period

Figure 3 shows that, under different peanut seeding densities, chlorophyll content of peanut leaves during the flowering stage is obviously lower than in the other two growth stages and the peanut leaf had the highest chlorophyll content in the pod bearing stage, followed by the mature stage. As an example, for treatment D1 (double grain, 16 cm) measured on May 18, peanut chlorophyll content first increased and then decreased during the growth period, reaching its maximum in the pod bearing stage, mainly because peanut plants flourished, the number of leaves increased and leaf area increased during this stage. As plants reached the mature stage when leaves and stems gradually age and turn yellow, photosynthesis weakened and chlorophyll content declined.
For the three single-seeding density treatments (S1, single grain, 8 cm; S2, single grain, 10 cm; S3, single grain, 12 cm), chlorophyll content in the peanut leaves first increased and then decreased with decreasing seeding density (Figure 3). Chlorophyll content of peanut under density treatment S2 was the highest, reaching 47.68. Similarly, for the three double-seeding densities (D1, double grain, 16 cm; D2, double grain, 20 cm; D3, double grain, 24 cm), chlorophyll content in the peanut leaves first increased and then decreased with decreasing seeding density. Peanut chlorophyll content under density treatment D2 was the highest, reaching 47.76 (Figure 3). These results showed that chlorophyll content in peanut leaves is affected by too high and too low seeding densities. In the present study, a single-seeding density of 10 cm and double-seeding density of 20 cm provided the optimal seeding density and the maximum chlorophyll content. Therefore, employing an appropriate seeding density is beneficial to the rational regulation of the relationship between individual plants and populations, the construction of a reasonable population structure and full exploitation of the high yield potential of crops. When comparing the three different sowing treatments (single-grain, double-grain and three-point), differences in chlorophyll content between S1 and D1, S2 and D2, S3 and D3, T and D1 were not obvious, because the plot densities were similar. In addition, the similar density of S1 and D1 can better explain the difference between S and D.

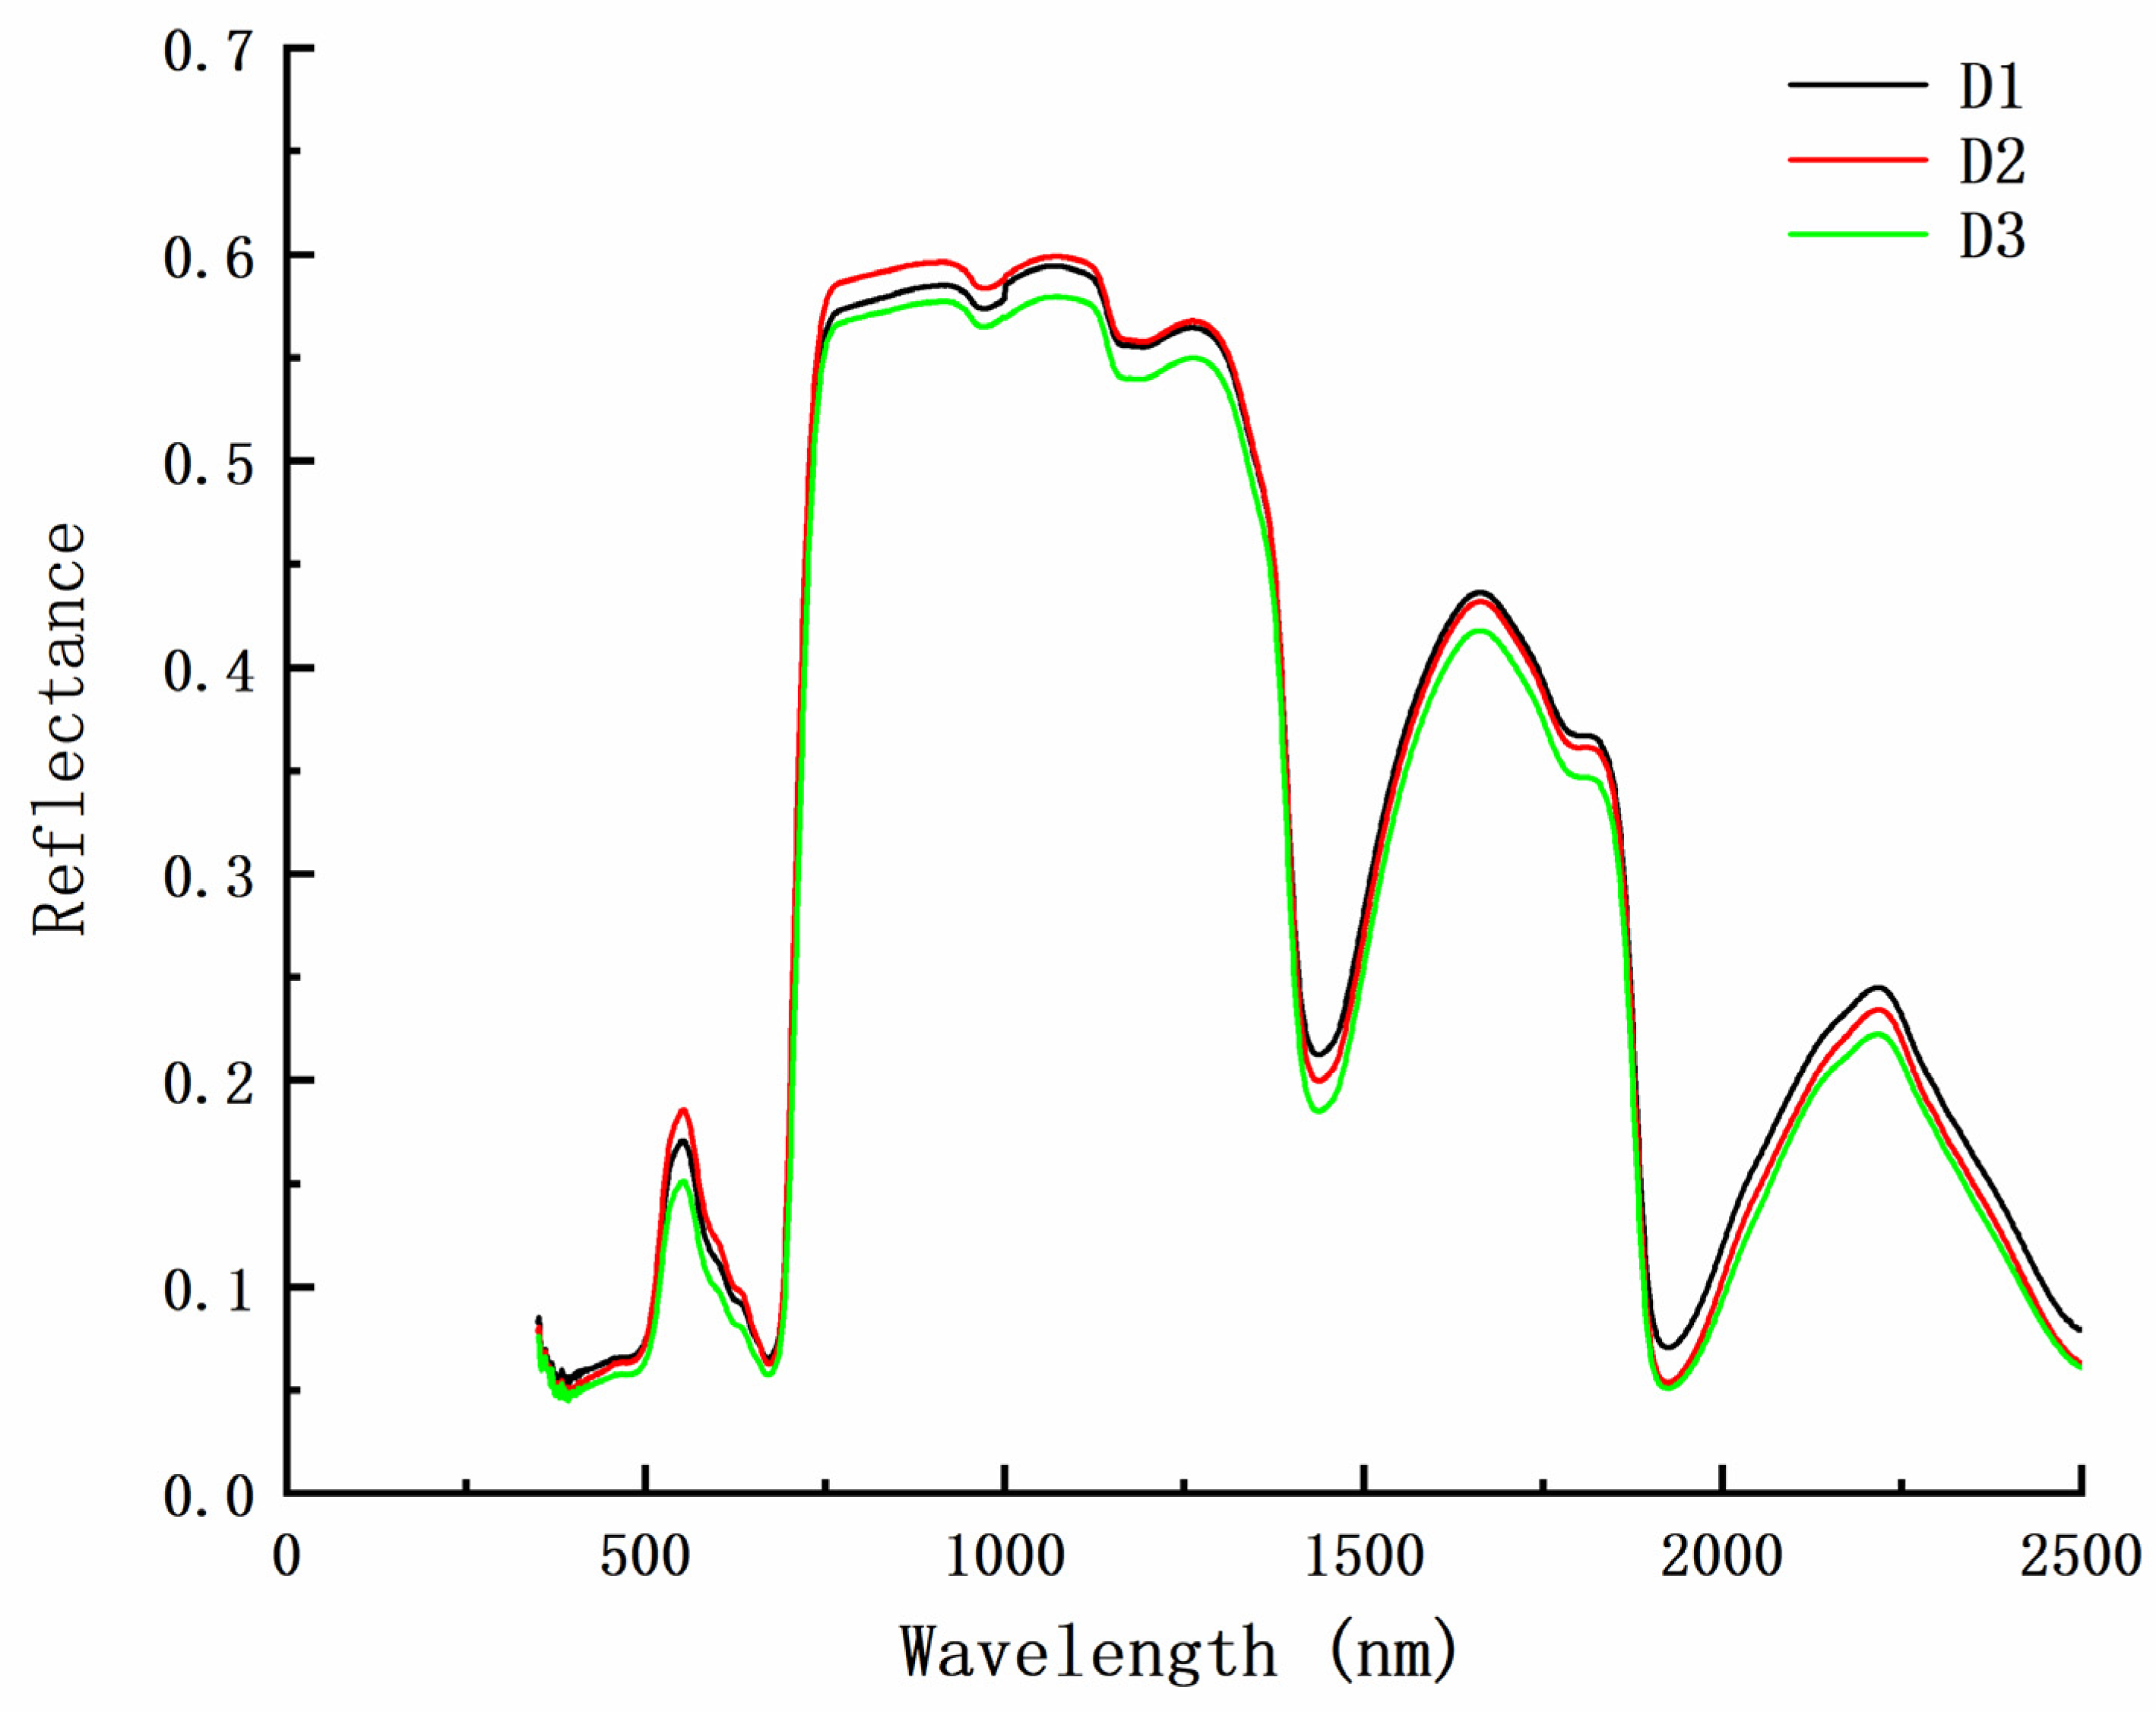
3.3.2. Spectral Characteristics of the Peanut Leaves at Different Chlorophyll Levels

There were significant changes in the peanut leaf spectral reflectance at different chlorophyll levels. As shown in Figure 4, a high correlation was observed between the chlorophyll content and the original spectrum. Generally, leaf spectral reflectance decreased in the VIS due to the strong absorption of chlorophyll but increased significantly in the NIR region due to the influence of blade structure and moisture.
According to the above results, the leaf chlorophyll content was the highest in S2 when compared with the other two single-grained treatments (Figure 4). For double-grained treatments, the leaf chlorophyll content was the highest in D2 (Figure 5). When combined with the original spectral reflectance curve of the peanut leaves, it was observed that differences in chlorophyll content had a greater effect on the spectral response of peanut leaves in different bands. The leaf spectrum showed different trends in different bands with increasing chlorophyll content. The higher the chlorophyll content of the peanut leaves in the VIS (350–700 nm) and NIR (700–1300 nm) bands, the greater the reflectivity.

3.4. Spectral Indicators and Estimation Models Based on the Original Spectrum

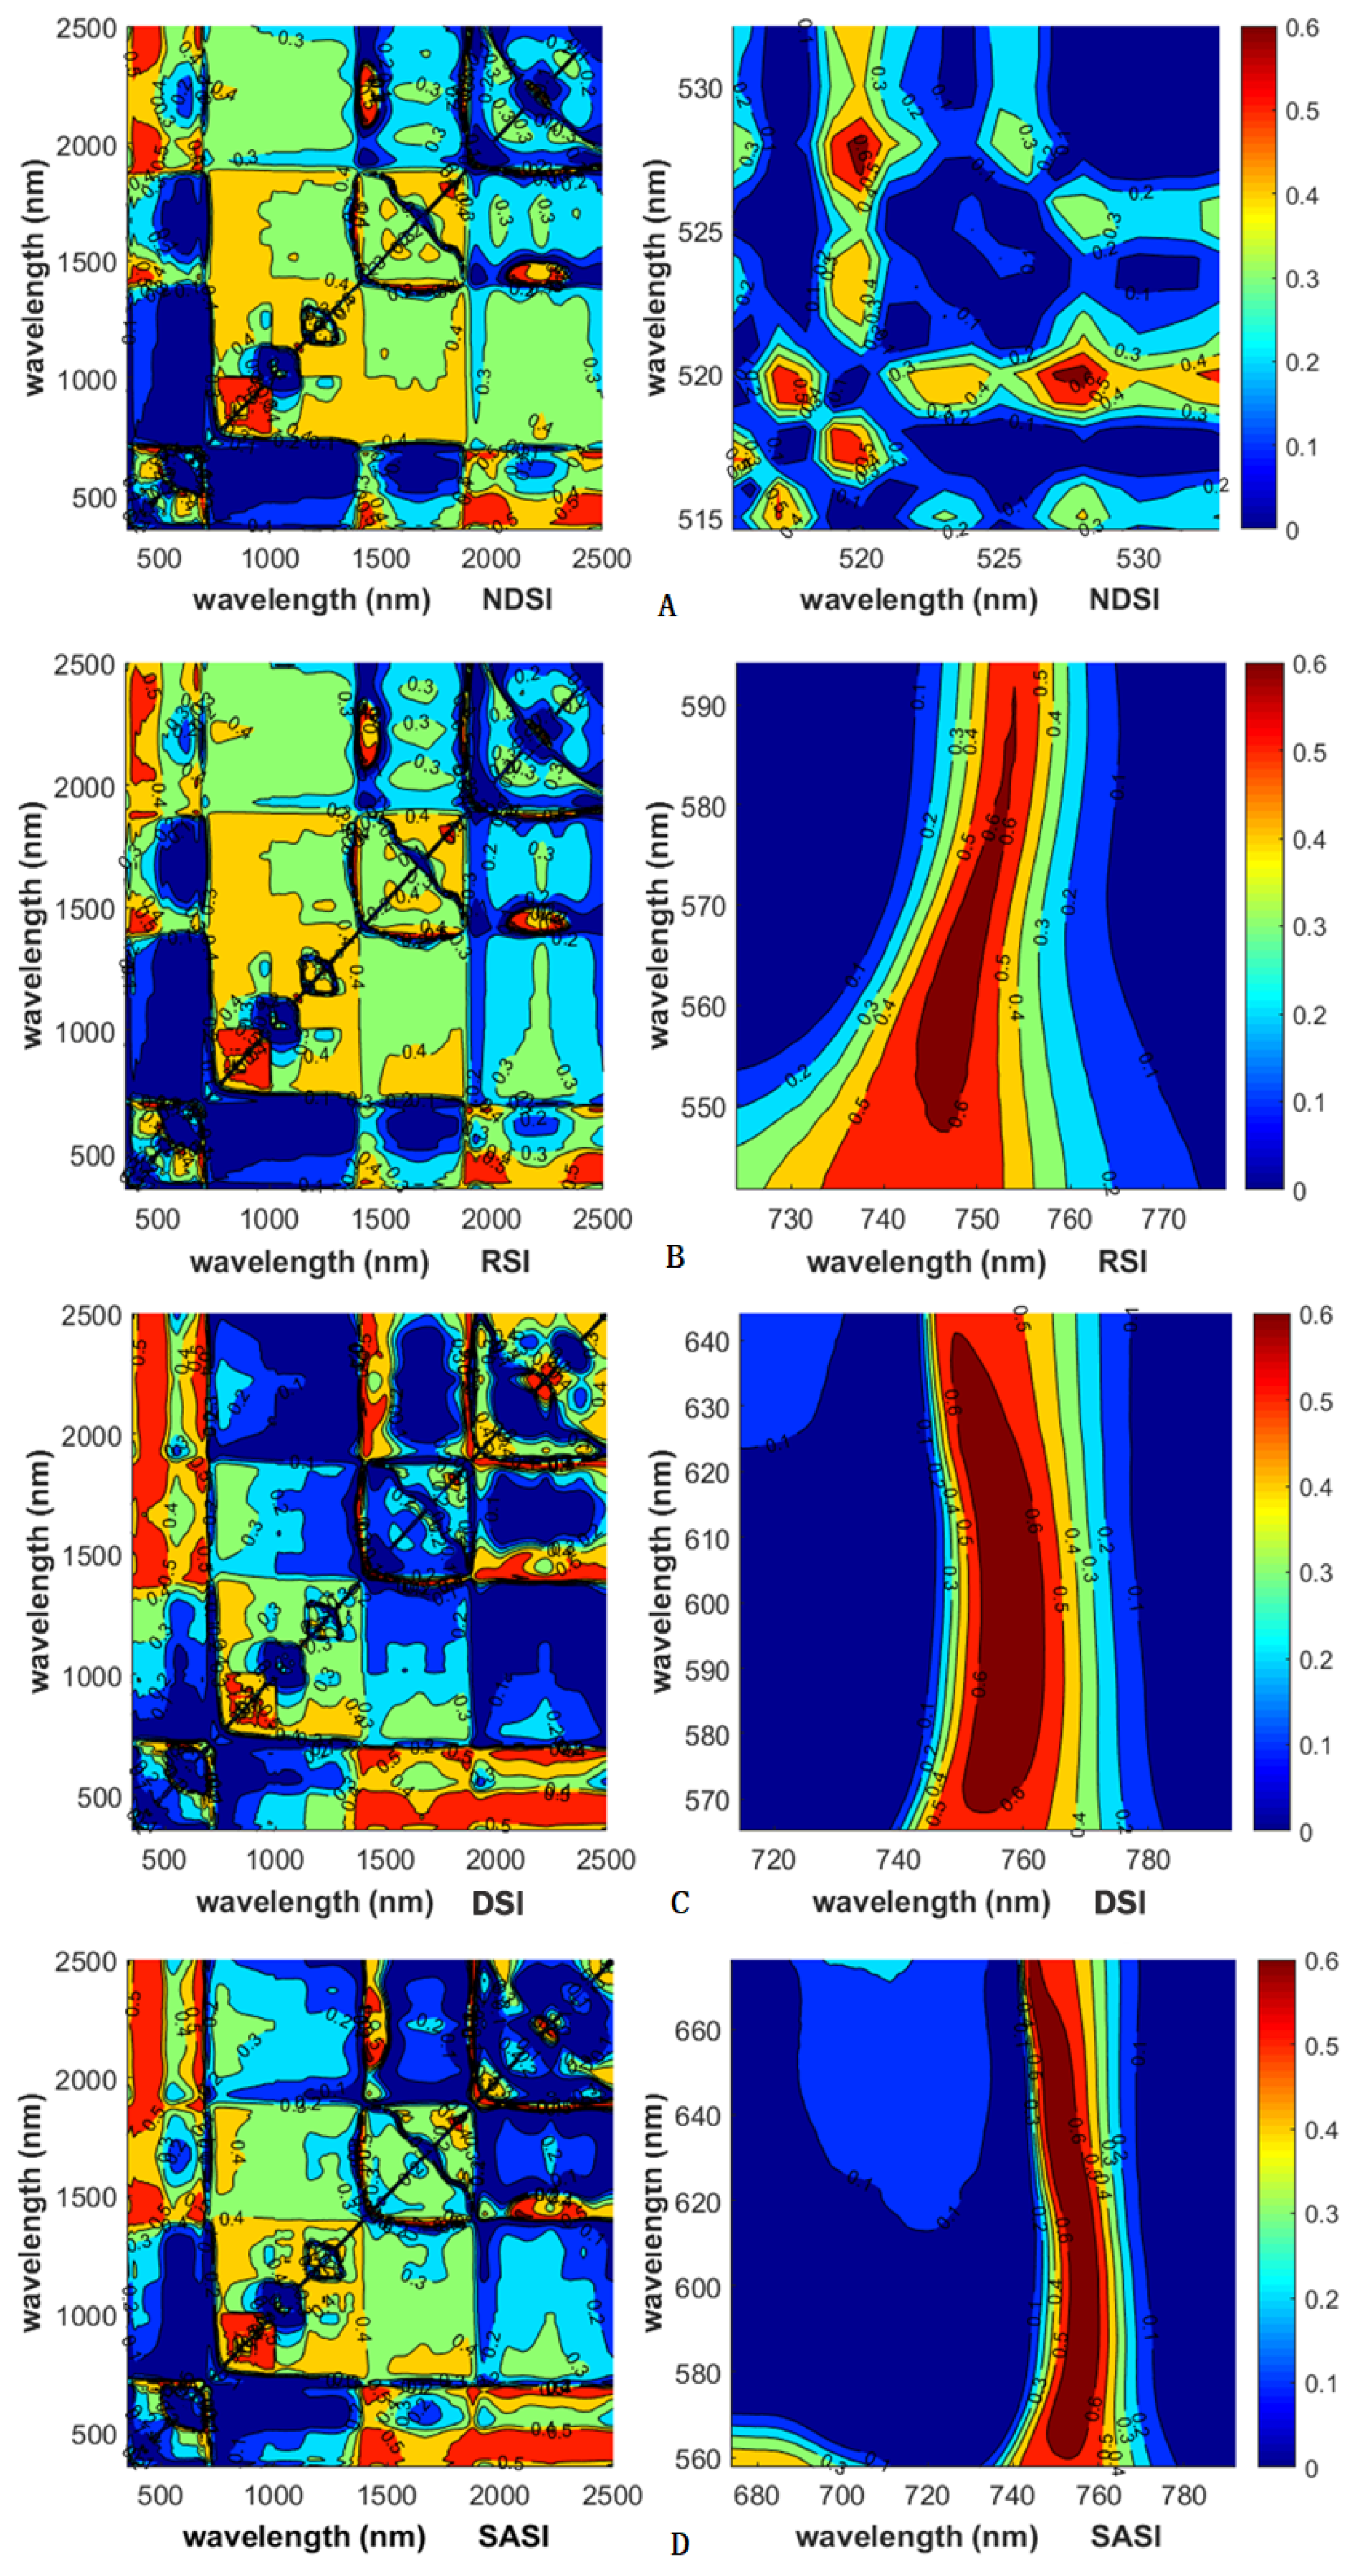
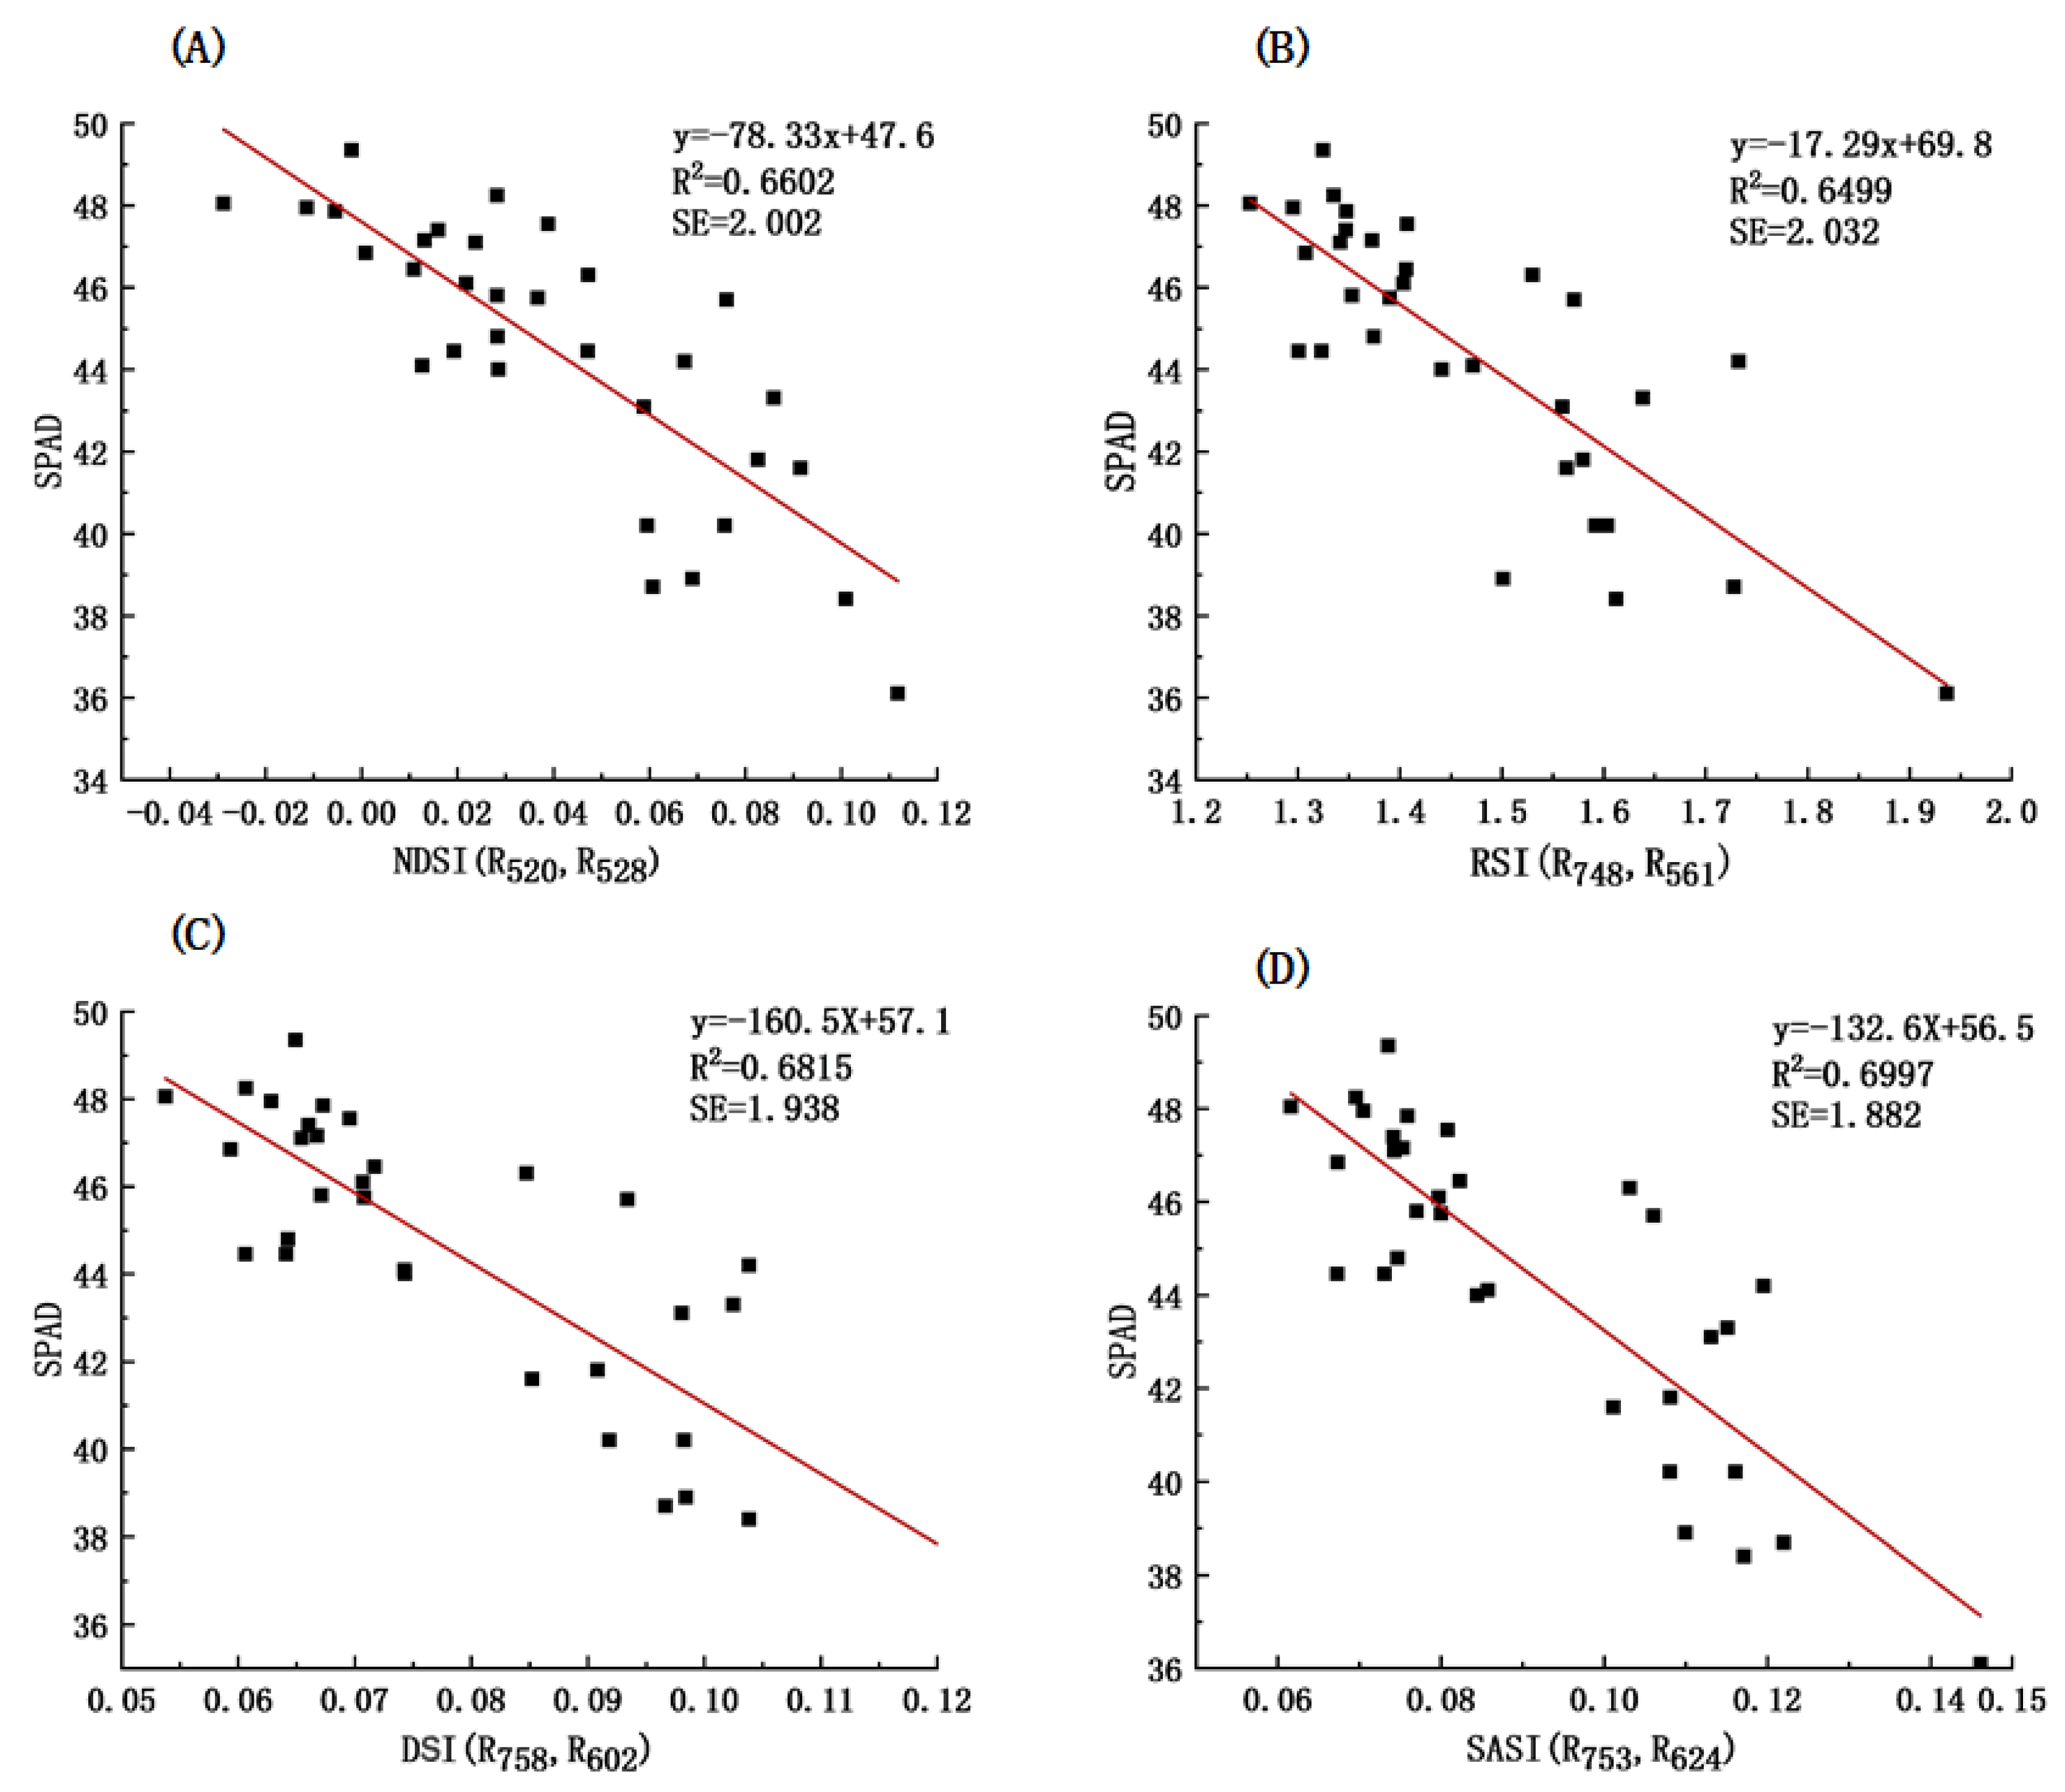
3.4.1. Identification of Sensitive Bands and Construction of Vegetation Indices

The reduced sampling method was adopted for the systematic quantification of all possible two-band combinations of hyperspectral indices within the full wavelength range (350–2500 nm) [24]. This enabled us to evaluate the relationships between chlorophyll and NDSI, RSI, DSI and SASI from 350 nm to 2500 nm at 10 nm intervals. According to changing values of R2, we obtained the contour map for the R2 values of chlorophyll and NDSI, RSI, DSI and SASI across the full wavelength region, based on the original spectral reflectance. The contour map was then used to identify the sensitive spectral range with a relatively greater R2. The "hotspots" of high correlation coefficients between chlorophyll and NDSI, RSI, DSI and SASI were found to be located in the VIS and NIR bands. The full-wavelength R2 contour map showed the sensitive wavelength ranges for chlorophyll based on the different indices: NDSI, 515–525 nm and 525–530 nm; RSI, 730–760 nm and 550–590 nm; DSI, 720–780 nm and 570–640 nm; and SASI, 680–780 nm and 560–660 nm. After linear regression analysis, R2 values were mostly greater than 0.65 and the values for RMSE based on the NDSI, RSI, DSI and SASI estimation models were all lower than 2.04 in the two spectral ranges of VIS and NIR; this indicated that the vegetation index constructed by these bands had a good correlation with the chlorophyll value for peanut.
In addition, accurate sampling of these sensitive spectral regions yielded more detailed contour maps of R2 values for chlorophyll and either NDSI, RSI, DSI or SASI at 1 nm intervals. The optimum vegetation indices were obtained from the R2 and RMSE values: NDSI group, NDSI (R520, R528) (R2 = 0.66); RSI group, RSI (R748, R561) (R2 = 0.65); DSI group, DSI (R758, R602) (R2 = 0.68); SASI group, SASI (R753, R624) (R2 = 0.69) (Figure 6).

3.4.2. Model Construction and Accuracy Test

Using the determined vegetation index as an independent variable, the peanut leaf SPAD values were linearly regressed to construct an estimation model for the leaf chlorophyll (Figure 7). The linear regression models based on the different indices were as follows: NDSI (R520, R528), R2 (0.66), RMSE (2.002); RSI (R748, R561), R2 (0.65), RMSE (2.032); DSI (R758, R602), R2 (0.68), RMSE (1.94); SASI (R753, R624), R2 (0.68), RMSE (1.88). These results showed that the linear model can achieve good prediction accuracy (R2>0.65, RMSE<2.04). By comparing R2 and RMSE, the optimal single variable estimation model for each vegetation index was obtained.

4. Discussion

Peanut is an important cash crop, with an important role in ensuring food supply and security. How to improve its yield per unit area has been a constant focus of peanut research. Traditional cultivation methods aiming to ensure peanut production and emergence rates have set excessive seeding densities, resulting in decreases in peanut yield. Seeding density is not only related to the physiological form of the plant, but also affects crop yield. Some studies have suggested that low-density peanut planting facilitates good growth and chlorophyll content, while high-density planting results in poor growth and a decrease in the overall photosynthetic performance of leaves [25]. In contrast, a low planting density creates a large light-receiving area per individual plant, which is conducive to photosynthesis, but the lower number of groups leads to greater light leakage, which is not conducive to use of light energy.
Leaf chlorophyll content is an important indicator of plant nitrogen status. Changes in leaf chlorophyll lead to broad band differences in leaf reflectance and transmission spectra. However, the transition from the leaf to canopy spectrum is complex; canopy spectral reflectance is strongly affected by changes in chlorophyll concentration and by other factors (e.g., canopy architecture, soil background and LAI), making chlorophyll retrieval at the canopy level complicated and challenging. Hyperspectral data provide a large number of adjacent narrow-band leaf reflectivity. However, the lack of an effective means for analyzing hyperspectral information makes it difficult to conduct systematic quantitative analysis of hyperspectral indices on all possible two-band combinations (from 350 nm to 2500 nm), precise feature bands indicating biochemical components in plants might therefore not be fully explored and utilized [26]. Therefore, the development and optimization of techniques such as a spectral vegetation index that requires only limited data is of great significance and practical value in monitoring the physiological and ecological parameters of plants [27]. Studies have shown that the paired spectral vegetation index, a method that minimizes interference from LAI and background reflectance, can be used to estimate leaf chlorophyll concentrations [28]. Chlorophyll absorbs intense radiation in the VIS spectrum (400 nm to 700 nm) and is most obvious in chlorophyll a at wavelengths of 430 (B) and 660 (R) nm and chlorophyll b at wavelengths of 450 (B) and 650 (R) nm. In contrast, plants have higher reflectivity in the NIR region (700 nm to 1300 nm) due to the effects of leaf density and canopy structure. This sharp contrast between red and NIR reflectance behaviors in the spectrum is the motivation for developing spectral indices based on the ratio of reflectance values in the VIS and NIR regions [29]. The spectral vegetation index uses the characteristic shape of the green vegetation spectrum by combining the low reflectance in the VIS spectrum with the high reflectivity in the NIR spectrum. These combinations can be ratios of two or more bands, slopes or ratios of other formulae that minimize the effects of changes due to external factors and maximize sensitivity to variables of interest [30]. Therefore, the main purpose of the spectral vegetation index is to enhance information contained in the spectral reflectance data by extracting changes caused by vegetation characteristics (such as LAI, vegetation coverage) and to minimize the effects of soil, atmosphere and solar sensors [1].
Our objectives were to investigate the spectral behavior of the relationship between reflectance and chlorophyll content and to develop a technique for non-destructive estimation of chlorophyll in leaves with a wide range of pigment content and composition, using reflectance in a few broad spectral bands [19]. The selection and exploration of new key bands is an important technology in the field of vegetation remote sensing and has been applied in several cases [31]. We selected several widely used vegetation indices covering the whole wavelength range, established a correlation model between leaf chlorophyll and spectra and determined that the VIS and NIR bands provide the best sensitivity in identifying chlorophyll. Based on this optimal sensitivity range, we refined the sampling interval and constructed the spectral vegetation index most sensitive to peanut chlorophyll. Finally, the regression model was established, and the accuracy evaluated. The results confirmed that the vegetation index constructed in this paper is a good predictor of chlorophyll. Non-destructive monitoring of physiological parameters, such as chlorophyll, in peanut plants is of great significance for monitoring crop growth in agricultural production systems and in the accurate diagnosis and management of nutrient indicators, such as nitrogen.

5. Conclusions

In this study, four new sets of sensitive spectral indices were identified: NDSI (R520, R528), RSI (R748, R561), DSI (R758, R602) and SASI (R753, R624); these generated corresponding regression models (y = −78.33x + 17.6, y = −17.29x + 69.8, y = −160.5x + 57.1, y = −132.6x + 56.5). Some research results show that the non-destructive estimation of leaf chlorophyll content in the green and red-edge spectral range is optimal [32,33], which is consistent with the results of our study. At the same time, the model established in our study is simple and practical and can be used to estimate the chlorophyll content of the peanut leaves. However, it is worth noting that since our study was only carried out in one ecological region, further experimental verification using plant species in different geographical and climatic regions and under different measurement conditions is necessary if these spectral indices are to be developed as a universal tool for vegetation remote sensing [34]. This will increase their value in the non-destructive monitoring and accurate diagnosis of crop chlorophyll content during peanut growth.

Author Contributions

Conceptualization, H.Q. and L.Z.; Data curation, B.Z., L.K., W.Y. and J.Z.; Formal analysis, B.Z.; Funding acquisition, Y.L.; Investigation, H.Q., B.Z., W.Y., L.K., J.Z. and L.Z.; Project administration, Y.L.; Resources, Y.L., L.Z.; Writing—original draft, B.Z.; Writing—review and editing, H.Q. and L.Z. All authors have read and agreed to the published version of the manuscript.

Funding

This work was funded by the National Key R&D Program of China (2018YFD1000906), Key Science and Technology Planning Project of Guangdong Province (2019B020214003) and Guangdong Technical System of Peanut and Soybean Industry (2019KJ136-05), Characteristic innovation projects of Guangdong Provincial Department of education in 2019: Study on variable spray system of plant protection UAV Based on small grid prescription map (2019Ktscx015).

Conflicts of Interest

The authors declare that there are no conflict of interest in the reported research.

References

  1. Viña, A.; Gitelson, A.A.; Nguy-Robertson, A.L.; Peng, Y. Comparison of different vegetation indices for the remote assessment of green leaf area index of crops. Remote Sens. Environ. 2011, 115, 3468–3478. [Google Scholar] [CrossRef]
  2. Wood, C.; Reeves, D.; Duffield, R.; Edmisten, K. Field chlorophyll measurements for evaluation of corn nitrogen status. J. Plant Nutr. 1992, 15, 487–500. [Google Scholar] [CrossRef]
  3. Schlemmer, M.; Gitelson, A.; Schepers, J.; Ferguson, R.; Peng, Y.; Shanahan, J.; Rundquist, D. Remote estimation of nitrogen and chlorophyll contents in maize at leaf and canopy levels. Int. J. Appl. Earth Obs. Geoinf. 2013, 25, 47–54. [Google Scholar] [CrossRef] [Green Version]
  4. Oppelt, N.; Mauser, W. Hyperspectral monitoring of physiological parameters of wheat during a vegetation period using AVIS data. Int. J. Remote Sens. 2004, 25, 145–159. [Google Scholar] [CrossRef]
  5. Monteiro, S.T.; Minekawa, Y.; Kosugi, Y.; Akazawa, T.; Oda, K. Prediction of sweetness and amino acid content in soybean crops from hyperspectral imagery. ISPRS J. Photogramm. Remote Sens. 2007, 62, 2–12. [Google Scholar] [CrossRef]
  6. Stagakis, S.; Markos, N.; Sykioti, O.; Kyparissis, A. Monitoring canopy biophysical and biochemical parameters in ecosystem scale using satellite hyperspectral imagery: An application on a Phlomis fruticosa Mediterranean ecosystem using multiangular CHRIS/PROBA observations. Remote Sens. Environ. 2010, 114, 977–994. [Google Scholar] [CrossRef]
  7. Darvishzadeh, R.; Skidmore, A.; Schlerf, M.; Atzberger, C. Inversion of a radiative transfer model for estimating vegetation LAI and chlorophyll in a heterogeneous grassland. Remote Sens. Environ. 2008, 112, 2592–2604. [Google Scholar] [CrossRef]
  8. Dawson, T.P.; Curran, P.J.; Plummer, S.E. LIBERTY—Modeling the effects of leaf biochemical concentration on reflectance spectra. Remote Sens. Environ. 1998, 65, 50–60. [Google Scholar] [CrossRef]
  9. Broge, N.H.; Mortensen, J.V. Deriving green crop area index and canopy chlorophyll density of winter wheat from spectral reflectance data. Remote Sens. Environ. 2002, 81, 45–57. [Google Scholar] [CrossRef]
  10. Jackson, R.D.; Huete, A.R. Interpreting vegetation indices. Prev. Vet. Med. 1991, 11, 185–200. [Google Scholar] [CrossRef]
  11. Moulin, S. Impacts of model parameter uncertainties on crop reflectance estimates: A regional case study on wheat. Int. J. Remote Sens. 1999, 20, 213–218. [Google Scholar] [CrossRef]
  12. Claudio, H.C.; Cheng, Y.; Fuentes, D.A.; Gamon, J.A.; Luo, H.; Oechel, W.; Qiu, H.-L.; Rahman, A.F.; Sims, D.A. Monitoring drought effects on vegetation water content and fluxes in chaparral with the 970 nm water band index. Remote Sens. Environ. 2006, 103, 304–311. [Google Scholar] [CrossRef]
  13. Seelig, H.-D.; Hoehn, A.; Stodieck, L.; Klaus, D.; Adams Iii, W.; Emery, W. Relations of remote sensing leaf water indices to leaf water thickness in cowpea, bean, and sugarbeet plants. Remote Sens. Environ. 2008, 112, 445–455. [Google Scholar] [CrossRef]
  14. Yilmaz, M.T.; Hunt, E.R., Jr.; Jackson, T.J. Remote sensing of vegetation water content from equivalent water thickness using satellite imagery. Remote Sens. Environ. 2008, 112, 2514–2522. [Google Scholar] [CrossRef]
  15. Hunt, E.R.; Daughtry, C.; Eitel, J.U.; Long, D.S. Remote sensing leaf chlorophyll content using a visible band index. Agron. J. 2011, 103, 1090–1099. [Google Scholar] [CrossRef] [Green Version]
  16. Singh, B.; Singh, U. Peanut as a source of protein for human foods. Plant Foods Hum. Nutr. 1991, 41, 165–177. [Google Scholar] [CrossRef] [Green Version]
  17. FieldSpec Pro User’s Guide; Advanced Systems Development, Inc.: Alexandria, VA, USA, 2002.
  18. Richardson, A.D.; Duigan, S.P.; Berlyn, G.P. An evaluation of noninvasive methods to estimate foliar chlorophyll content. New Phytol. 2002, 153, 185–194. [Google Scholar] [CrossRef] [Green Version]
  19. Gitelson, A.A.; Gritz, Y.; Merzlyak, M.N. Relationships between leaf chlorophyll content and spectral reflectance and algorithms for non-destructive chlorophyll assessment in higher plant leaves. J. Plant Physiol. 2003, 160, 271–282. [Google Scholar] [CrossRef]
  20. Le Maire, G.; Francois, C.; Dufrene, E. Towards universal broad leaf chlorophyll indices using PROSPECT simulated database and hyperspectral reflectance measurements. Remote Sens. Environ. 2004, 89, 1–28. [Google Scholar] [CrossRef]
  21. Blackburn, G.A. Hyperspectral remote sensing of plant pigments. J. Exp. Bot. 2007, 58, 855–867. [Google Scholar] [CrossRef] [Green Version]
  22. Hatfield, J.; Gitelson, A.A.; Schepers, J.S.; Walthall, C. Application of spectral remote sensing for agronomic decisions. Agron. J. 2008, 100, S-117–S-131. [Google Scholar] [CrossRef] [Green Version]
  23. Féret, J.-B.; François, C.; Gitelson, A.; Asner, G.P.; Barry, K.M.; Panigada, C.; Richardson, A.D.; Jacquemoud, S. Optimizing spectral indices and chemometric analysis of leaf chemical properties using radiative transfer modeling. Remote Sens. Environ. 2011, 115, 2742–2750. [Google Scholar] [CrossRef] [Green Version]
  24. Yao, X.; Zhu, Y.; Tian, Y.; Feng, W.; Cao, W. Exploring hyperspectral bands and estimation indices for leaf nitrogen accumulation in wheat. Int. J. Appl. Earth Obs. Geoinf. 2010, 12, 89–100. [Google Scholar] [CrossRef]
  25. Fei, L.; Sijia, L.; Xiaoling, J.; Xinjun, H.; Yanzhong, Z.; Yueqiang, Z.; Shan, G.; Na, Y. Effects of Planting Densities on the Agronomic Characters and Yield of Luohua 4087. Crop Res. 2019, 33, 191–193. [Google Scholar]
  26. Zhang, L.; Zhou, Z.; Zhang, G.; Meng, Y.; Chen, B.; Wang, Y. Monitoring the leaf water content and specific leaf weight of cotton (Gossypium hirsutum L.) in saline soil using leaf spectral reflectance. Eur. J. Agron. 2012, 41, 103–117. [Google Scholar] [CrossRef]
  27. Chen, T.; Zeng, R.; Guo, W.; Hou, X.; Lan, Y.; Zhang, L. Detection of stress in cotton (Gossypium hirsutum L.) caused by aphids using leaf level hyperspectral measurements. Sensors 2018, 18, 2798. [Google Scholar] [CrossRef] [Green Version]
  28. Hunt, E.R., Jr.; Doraiswamy, P.C.; McMurtrey, J.E.; Daughtry, C.S.; Perry, E.M.; Akhmedov, B. A visible band index for remote sensing leaf chlorophyll content at the canopy scale. Int. J. Appl. Earth Obs. Geoinf. 2013, 21, 103–112. [Google Scholar] [CrossRef] [Green Version]
  29. Mulla, D.J. Twenty five years of remote sensing in precision agriculture: Key advances and remaining knowledge gaps. Biosyst. Eng. 2013, 114, 358–371. [Google Scholar] [CrossRef]
  30. Daughtry, C.; Walthall, C.; Kim, M.; De Colstoun, E.B.; McMurtrey Iii, J. Estimating corn leaf chlorophyll concentration from leaf and canopy reflectance. Remote Sens. Environ. 2000, 74, 229–239. [Google Scholar] [CrossRef]
  31. Hansen, P.; Schjoerring, J. Reflectance measurement of canopy biomass and nitrogen status in wheat crops using normalized difference vegetation indices and partial least squares regression. Remote Sens. Environ. 2003, 86, 542–553. [Google Scholar] [CrossRef]
  32. Buschmann, C.; Nagel, E. In vivo spectroscopy and internal optics of leaves as basis for remote sensing of vegetation. Int. J. Remote Sens. 1993, 14, 711–722. [Google Scholar] [CrossRef]
  33. Gitelson, A.A.; Merzlyak, M.N.; Lichtenthaler, H.K. Detection of red edge position and chlorophyll content by reflectance measurements near 700 nm. J. Plant Physiol. 1996, 148, 501–508. [Google Scholar] [CrossRef]
  34. Datt, B. A new reflectance index for remote sensing of chlorophyll content in higher plants: Tests using Eucalyptus leaves. J. Plant Physiol. 1999, 154, 30–36. [Google Scholar] [CrossRef]
Figure 1. Peanut density plot layout.
Applsci 10 02259 g001
Figure 2. Spectral reflectance curve of peanut canopy leaves.
Applsci 10 02259 g002
Figure 3. Chlorophyll content of peanuts at different growth stages under different plant densities.
Applsci 10 02259 g003
Figure 4. Spectral reflectance curves of peanuts of different plant densities under single seeding conditions.
Applsci 10 02259 g004
Figure 5. Spectral reflectance curves of peanuts of different plant densities under double seeding conditions.
Applsci 10 02259 g005
Figure 6. Pictures from A to D are contour maps of the coefficients of determination of the linear relationship between the vegetation indices NDSI, RSI, DSI, and SASI and the chlorophyll content of peanut leaves, respectively. (left) 10-nm sampling interval (right) 1-nm sampling interval.
Applsci 10 02259 g006
Figure 7. Pictures from (A) to (D) show the linear regression of vegetation indices NDSI, RSI, DSI, and SASI with chlorophyll content in peanut leaves respectively.
Applsci 10 02259 g007
Table 1. Names and algorithms of the spectra indices used in this paper.
Hyperspectral IndexFormula
Normalized difference spectral index
(NDSI)
R λ 1 R λ 2 R λ 1 + R λ 2
Ratio spectral index
(RSI)
R λ 1 R λ 2
Difference spectral index
(DSI)
R λ 1 R λ 2
Soil adjust spectral index
(SASI)
R λ 1 R λ 2 R λ 1 + R λ 2 + L (1 + L )
R λ 1 and R λ 2 refer to the canopy spectral reflectance of 2 wavelengths, L is the soil correction parameter and L = 0.5 is selected in this paper.
Table 2. Descriptive statistics of peanut canopy single-photon avalanche diode (SPAD).
SampleNumberMinMaxMeanSDCV
Training sample323549.3544.623.380.0758
Verification sample836.143.340.11252.870.7155
Overall sample403549.3543.573.690.0843

