Article

Role of Multi-Scale Microstructure in the Degradation of Al Wire for Power Transmission

1
National Quality Supervision & Inspection Center of Electrical Equipment Safety Performance, Zhejiang Huadian Equipment Testing Institute, Hangzhou 310015, China
2
Laboratory of fatigue and fracture for materials, Institute of Metal Research, Chinese Academy of Sciences, 72 Wenhua Road, Shenyang 110016, China
3
Department of Materials Physics and Chemistry, School of Materials Science and Engineering, and Key Laboratory for Anisotropy and Texture of Materials, Ministry of Education, Northeastern University, Shenyang 110819, China
*
Authors to whom correspondence should be addressed.
Appl. Sci. 2020, 10(7), 2234; https://doi.org/10.3390/app10072234
Submission received: 10 March 2020 / Revised: 19 March 2020 / Accepted: 23 March 2020 / Published: 25 March 2020
(This article belongs to the Special Issue Microstructural and Mechanical Properties of Metallic Materials)

Abstract

:
As common conductive materials, Al wires are used on overhead transmission lines under long-term heating conditions. In this study, the strength degradation behavior and the strength-electrical conductivity relation of the commercially pure Al wires (CPAWs) and the Al-Fe wires (AFWs) annealed at various temperatures were investigated based on the microstructure evolution. The strength degradation rate of the AFW is always higher than that of the CPAW. A linear trade-off relation between strength and electrical conductivity for the annealed Al wires are clarified. The results reveal that the mechanisms behind the trade-off relation between the strength and the electrical conductivity for the annealed CPAWs and the annealed AFWs are the recovery of dislocations and the obvious increase of grain width, which leads to the decrease of strength and the increase of electrical conductivity. The coalescence of precipitate in the AFW leads to the obvious decrease of strength, which results in the higher strength degradation rate for the AFW as compared with that for the CPAW. Consequently, the principle of microstructure design for anti-degradation of Al wire is presented.

1. Introduction

Au, Ag, Cu, and Al are four kinds of excellent conductive materials, among which Al—depending on its excellent comprehensive performance—is widely used on the overhead transmission line as the outer layer of Al conductor steel reinforced (ACSR) [1,2,3,4,5]. In recent years, more and more Al alloy conductors were developed to replace the expensive copper to prepare Al-Fe cable and to replace the steel core to strand Al conductor steel reinforced (ACSR) and all Al alloy conductor (AAAC) to acquire higher energy efficiency [6,7].
As conductive materials, strength and electrical conductivity are two important parameters closely related to safety and energy-saving against various loads and conductor resistance, respectively [8,9]. Wind load, ice load and dead weight are some common loads that the conductor must be borne during the service. Therefore, stable mechanical properties are vital for the power transmission. However, due to the resistance of the conductor itself, heat will inevitably be generated in the process of power transmission, which inevitably influences the reliability of the overhead conductor [10]. Degradation of Al conductor is defined as the loss of mechanical properties caused by heat during the long-term service, which depends on the evolution of multi-scale microstructure. Moreover, in long-term service, not only the mechanical properties are changing gradually, but also the electrical conductivity, so the strength-electrical conductivity relation will also be significantly influenced. In the previous studies, some experiments were carried out to simulate the degradation of Al conductor, and the strength loss of Al wire is attributed to the recovery of defects and the growth of grains [11]. Furthermore, the degradation of Al-Fe alloy conductor was also investigated in our previous studies and the result shows that the strength loss of Al-Fe wire (AFW) can be attributed to the recovery of defects, the growth of grain and precipitates [12]. However, the effect of alloying elements on the degradation rate of mechanical properties during the degradation of Al and Al alloy wires is little investigated, which is closely related to the anti-degradation design of microstructure. Additionally, the strength-electrical conductivity relations of the cold-drawn commercially pure Al wire (CPAW) and the cold-drawn AFW were systematically discussed [13,14]. Many researchers focus on the strength and the electrical conductivity of the deformed pure Al and Al alloys. Valiev et al. [15] manufactured a kind of Al-Mg-Si alloy with high strength and high electrical conductivity by high-pressure torsion (HPT) at 180 °C. Miyajima et al. [16] focused on the strength and electrical conductivity of commercially pure Al processed by accumulative roll bonding (ARB). Medvedev et al. [17] investigated the trade-off relation between the strength and the electrical conductivity of an Al-Fe alloy produced by HPT and aging. However, the strength-electrical conductivity relation for the CPAW and the AFW during the degradation has never been studied.
In this paper, the influence of the multi-scale microstructure of the Al wire on the degradation behavior of the mechanical properties were compared, especially the strength degradation rate of the strength under different temperatures, to reveal the degradation mechanism and principles for the design of Al wire with anti-degradation microstructure.

2. Materials and Methods

The chemical composition of the CPAW and the AFW is listed in Table 1. The CPAW was prepared by 9 passes cold-drawing from 9.5 to 2.98 mm and the AFW was prepared by 8 passes cold-drawing from 8.5 to 3.15 mm on a drawing machine. Subsequently, the cold-drawn CPAWs and AFWs were heat treated for 8 h in a thermotank at 90, 150, 200 and 250 °C, and then cooled with air.
An Instron 5982 tester was used to measure the strength of the CPAWs and the AFWs with the gauge length of 150 mm. In addition, the experimental temperature is room temperature and the tensile rate is 1.0 × 10⁻³ s−1. The tensile axis is parallel to the axial direction of the Al wires.
The electrical resistance of the Al wire was tested by a direct current double-arm bridge at the ambient temperature of 20 °C. The length of the sample for the electrical resistance measurement is 1000.0 mm. The electrical conductivity of the CPAWs and the AFWs is calculated as follow:
w = L R S 5.8 10 7 100 % ,
where w is the electrical conductivity (%IACS, International Annealed Copper Standard); L is the length of the tested section of the Al wire. (1 m in this work); S is the radial area of the Al wire (m2) and R is the resistance (Ω).
Electron backscatter diffraction (EBSD) observations and transmission electron microscopy (TEM) were used to characterize the microstructures of the Al wire. The samples of the CPAWs and the AFWs were cut from the radial section and the axial section. The EBSD samples were polished using 800#, 1200# and 2000# SiC paper followed by electrolytic polished using a mixed solution (10% perchloric acid and 90% alcohol by volume) at 0 °C for about 90 s. Based on the EBSD data, the orientation distribution maps were analyzed by Channel 5 software integrated into ZEISS SUPRA 35 scanning electron microscope (SEM). The samples for TEM observation were ground to a thickness of ~0.05 mm followed by twin-jet electro-polishing process at −20 °C. The components of the mixed solution used for twin-jet electro-polishing are 80% methanol and 20% perchloric acid in volume. FEI Tecnai F20 microscope was used for TEM observation, which was operating at 200 kV.

3. Results

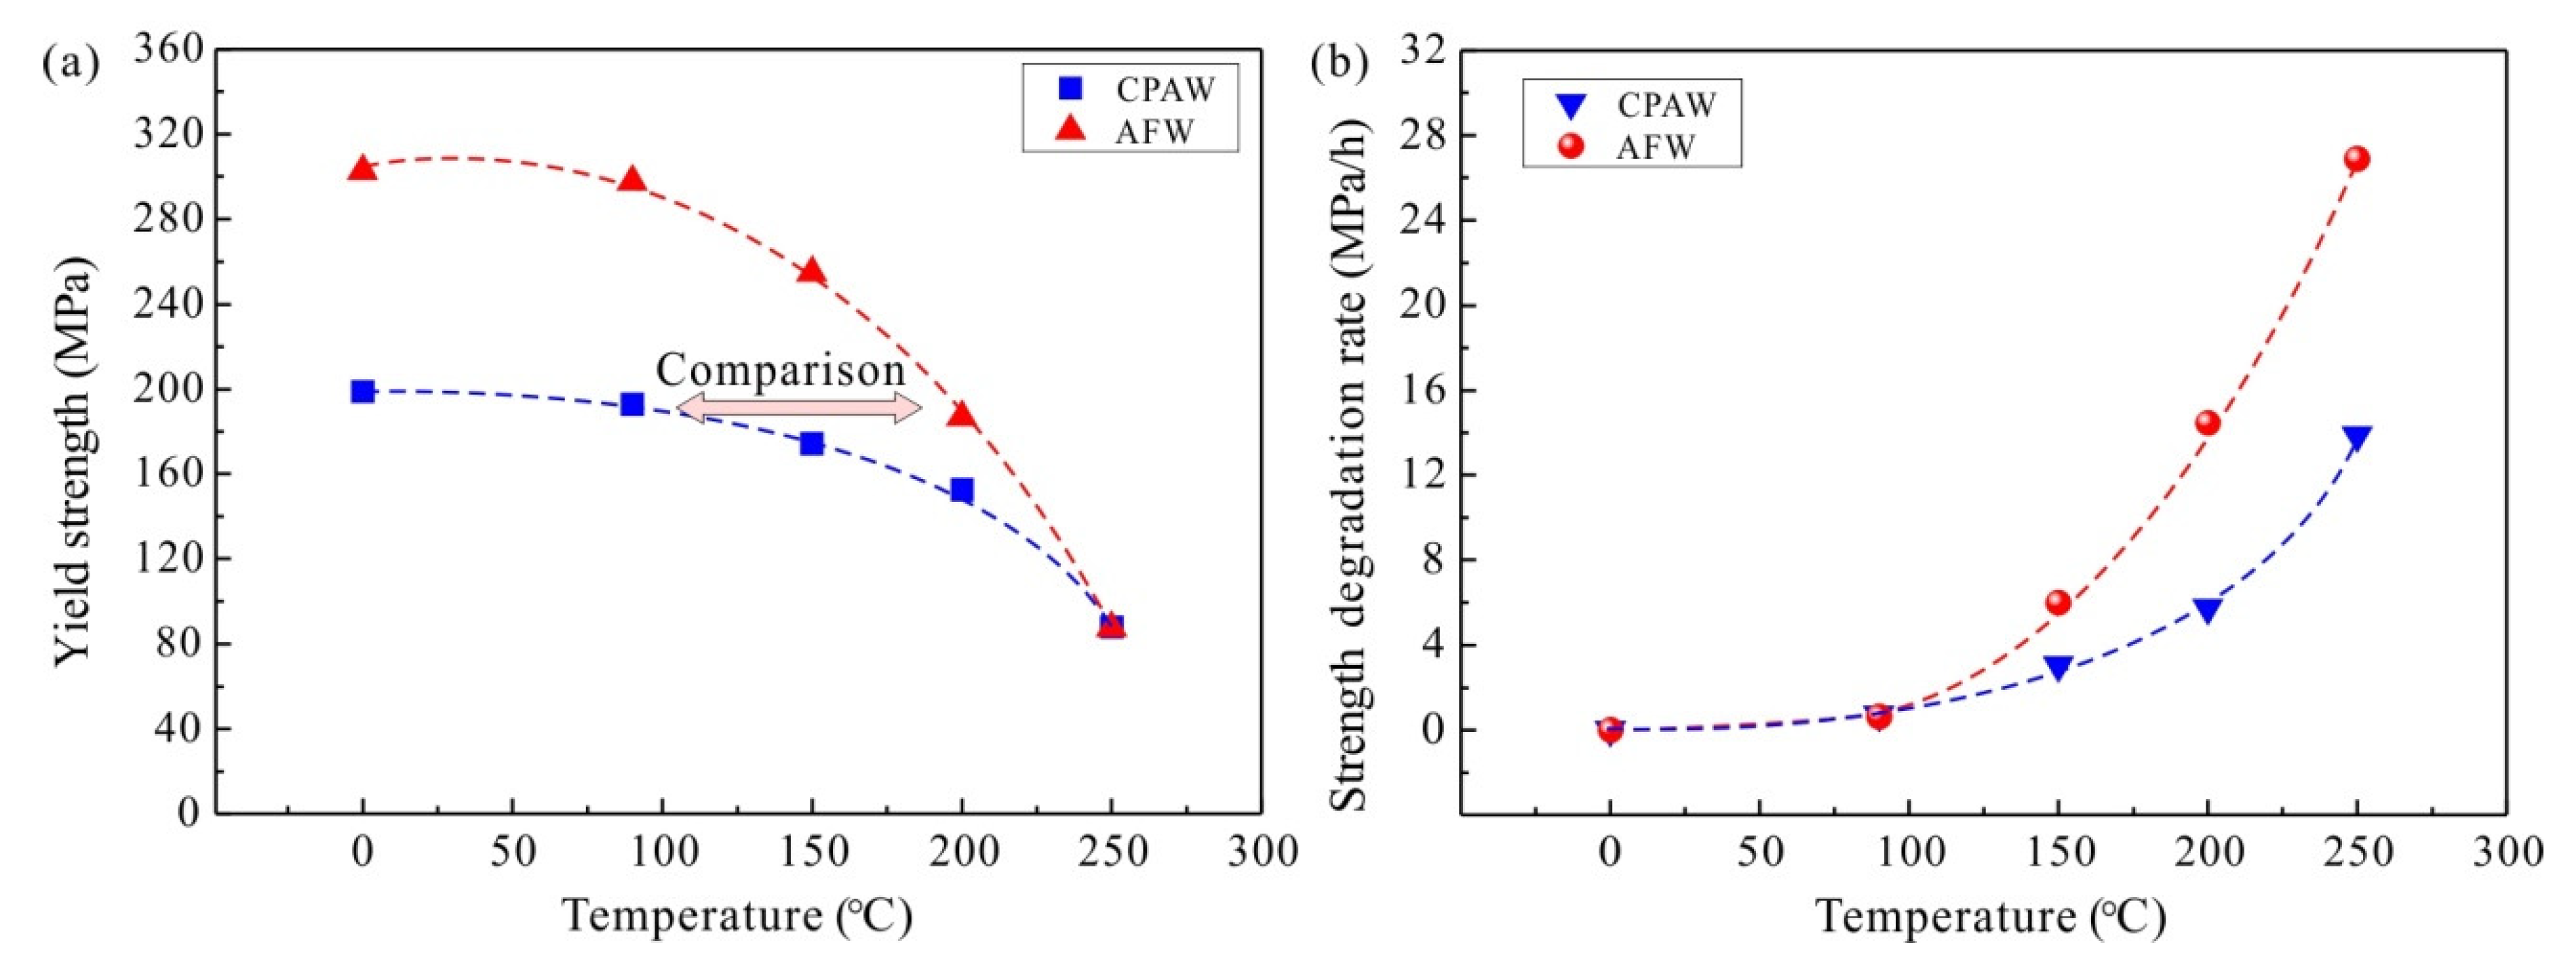
3.1. Strength Degradation and Strength Degradation Rate

The loss of strength is the typical characterization of the annealed Al wire. Here, the strength degradation rate is defined as to quantitatively describe the strength degradation of Al wire, which is calculated as the following equation:
δ = σ 0 σ i t ,
where δ is the strength degradation rate; σ 0 is the yield strength of the cold-drawn Al wire; σ i is the yield strength of the annealed Al wire, t is the holding time for the annealed Al wire.
Figure 1 shows the evolution of strength and the strength degradation rate of the CPAWs and the AFWs annealed at different temperature. As the annealing temperature increased from 90 °C to 250 °C, the yield strength of the AFWs decreased from 302.7 MPa to 87.5 MPa, and the yield strength of the CPAWs decreased from 198.8 MPa to 87.8 MPa. Clearly, the yield strength of the annealed AFW is always higher than that of the annealed CPAW until the annealing temperature increases to 250 °C. In addition, as shown in Figure 1b, the strength degradation rate of the AFWs and the CPAWs increase obviously with the increase of annealing temperature. The obvious difference is that the strength degradation rate of the annealed AFWs is always higher than that of the annealed CPAWs. In summary, the yield strength and the strength degradation rate of the annealed AFWs are higher than those of the annealed CPAWs.

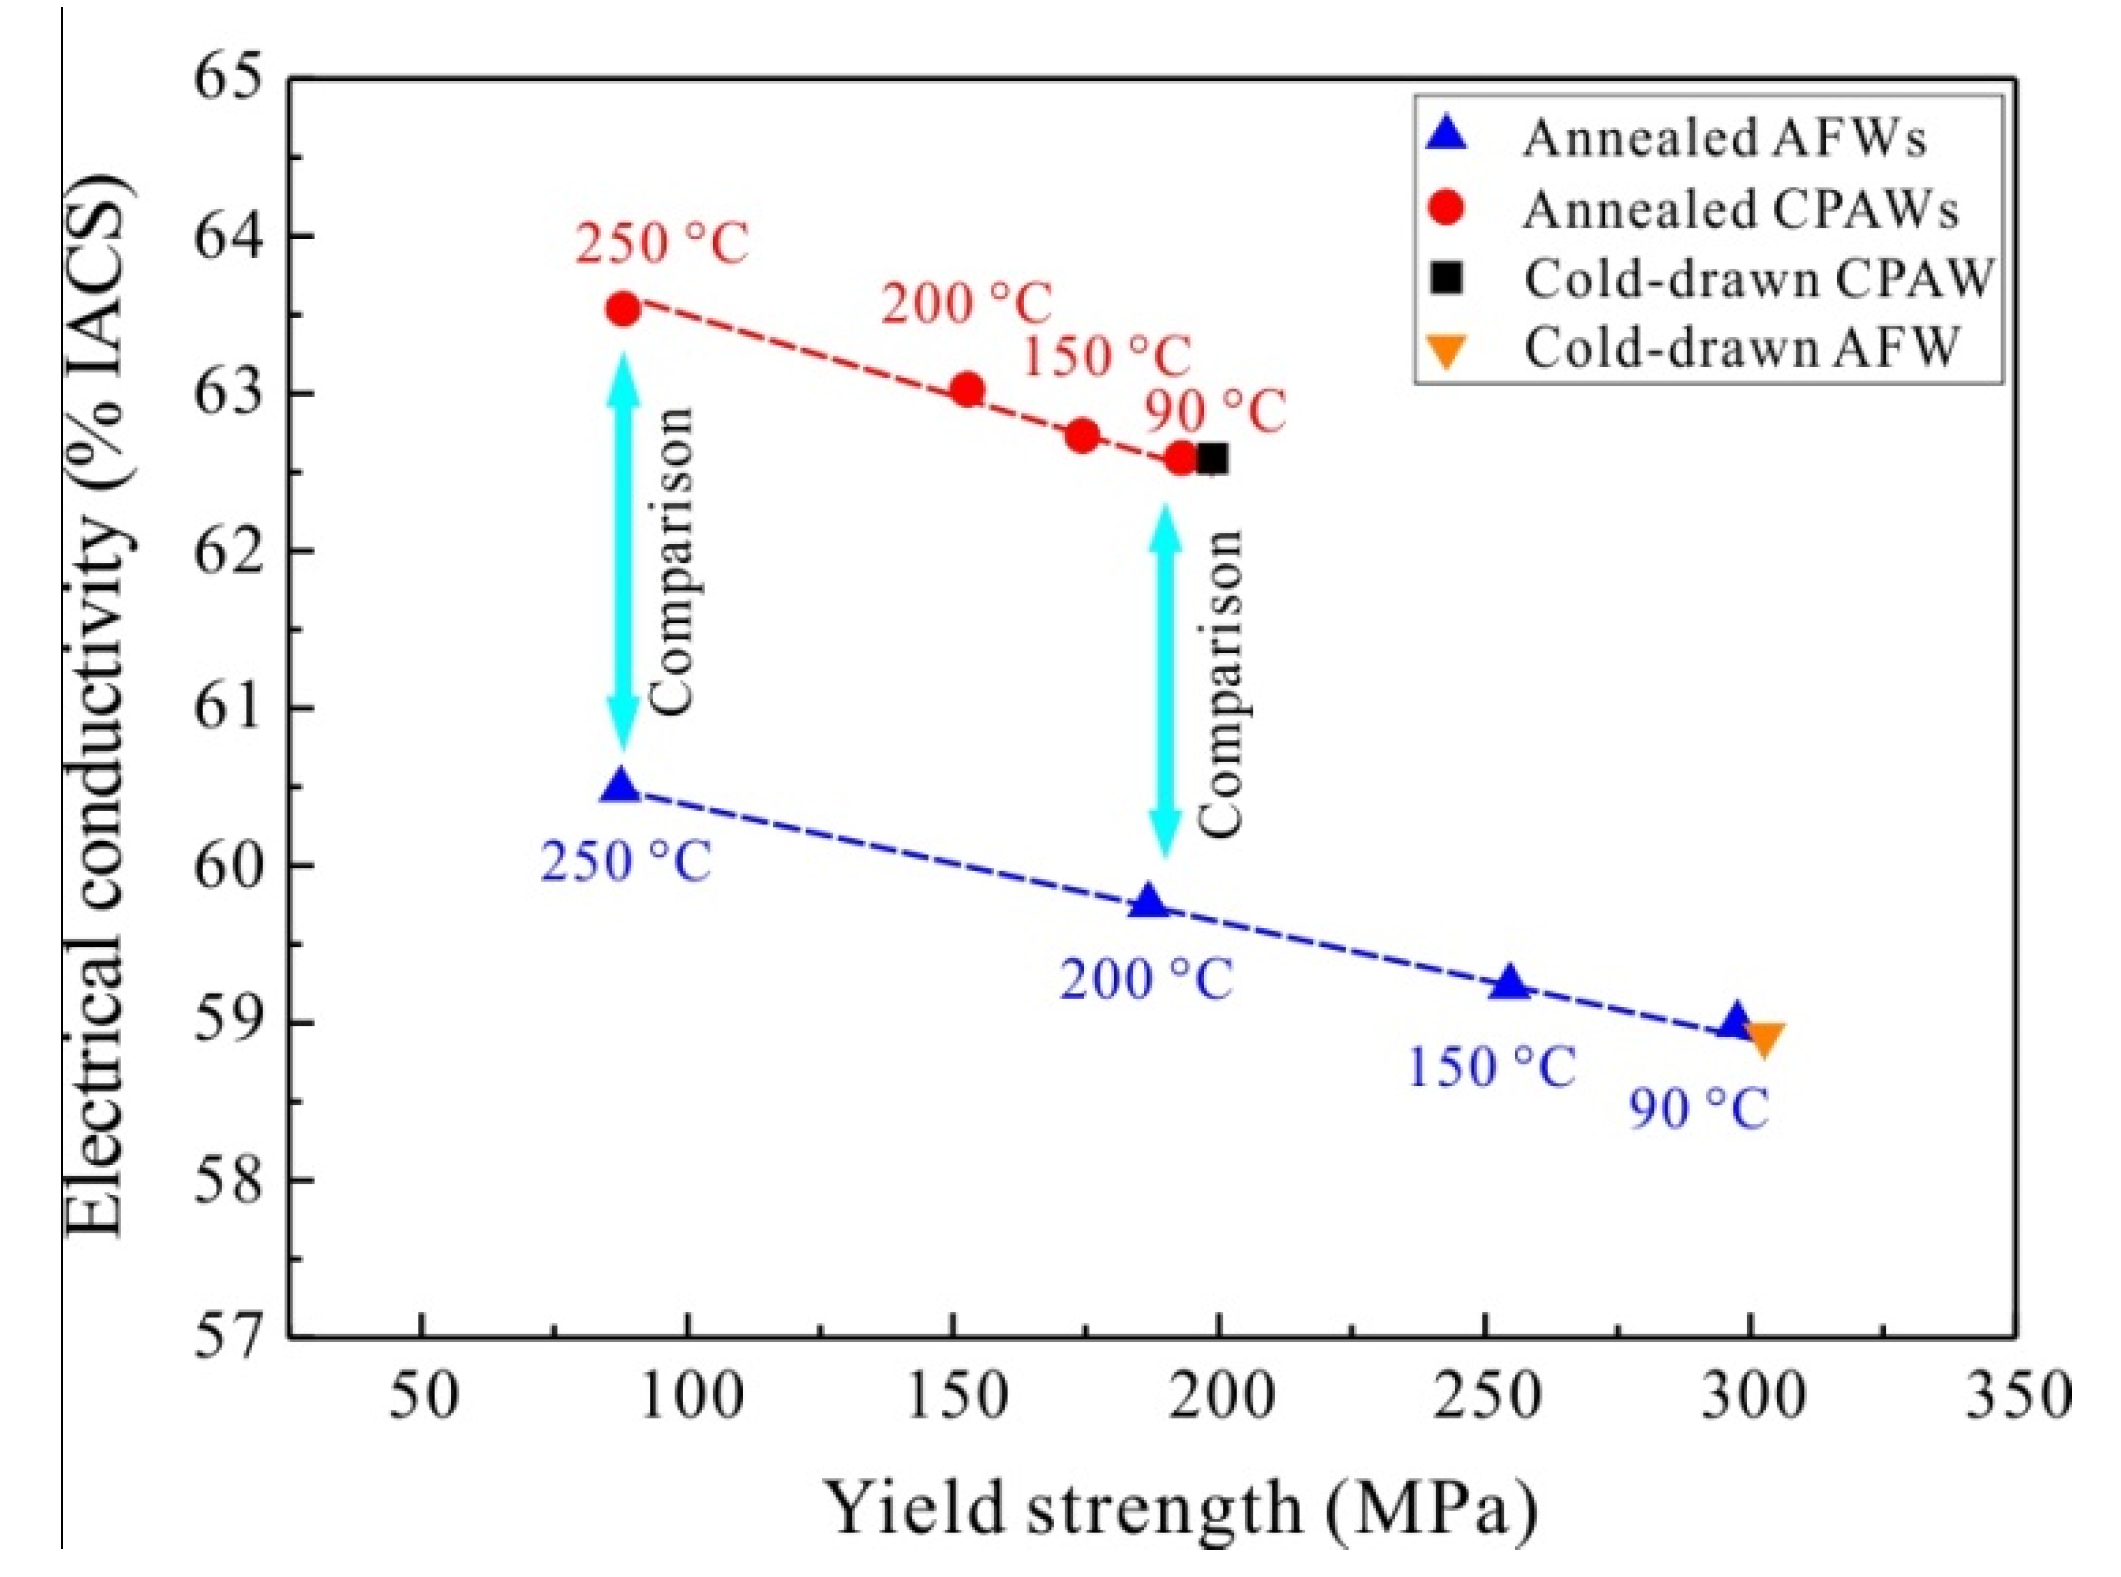
3.2. Strength-Electrical Conductivity Relation

The strength-electrical conductivity relation is an important performance of the Al wire used as the overhead transmission line. Thus, the yield strength and the electrical conductivity (EC) of the annealed CPAWs and the annealed AFWs are shown in Figure 2. For the CPAWs, with the increase of annealing temperature, the yield strength gradually decreases from 198.8 MPa to 87.8 MPa and the EC increases from 62.6 %IACS to 63.5 %IACS. Similarly, with the increase of annealing temperature, the yield strength and the EC of the AFWs continuously decrease from 302.7 MPa to 87.5 MPa and increases from 58.9 %IACS to 60.5 %IACS, respectively. Obviously, based on the strength-electrical conductivity curve (Figure 2), the loss of strength and the improvement of EC were observed both for the annealed CPAW and the annealed AFW with the increase of temperature. Moreover, the yield strengths of the annealed CPAWs and AFWs show a good linear relationship with the EC. In addition, compared with the AFWs annealed at 200 and 250 °C, the CPAWs annealed at 90 and 250 °C have similar yield strength and higher EC, respectively.

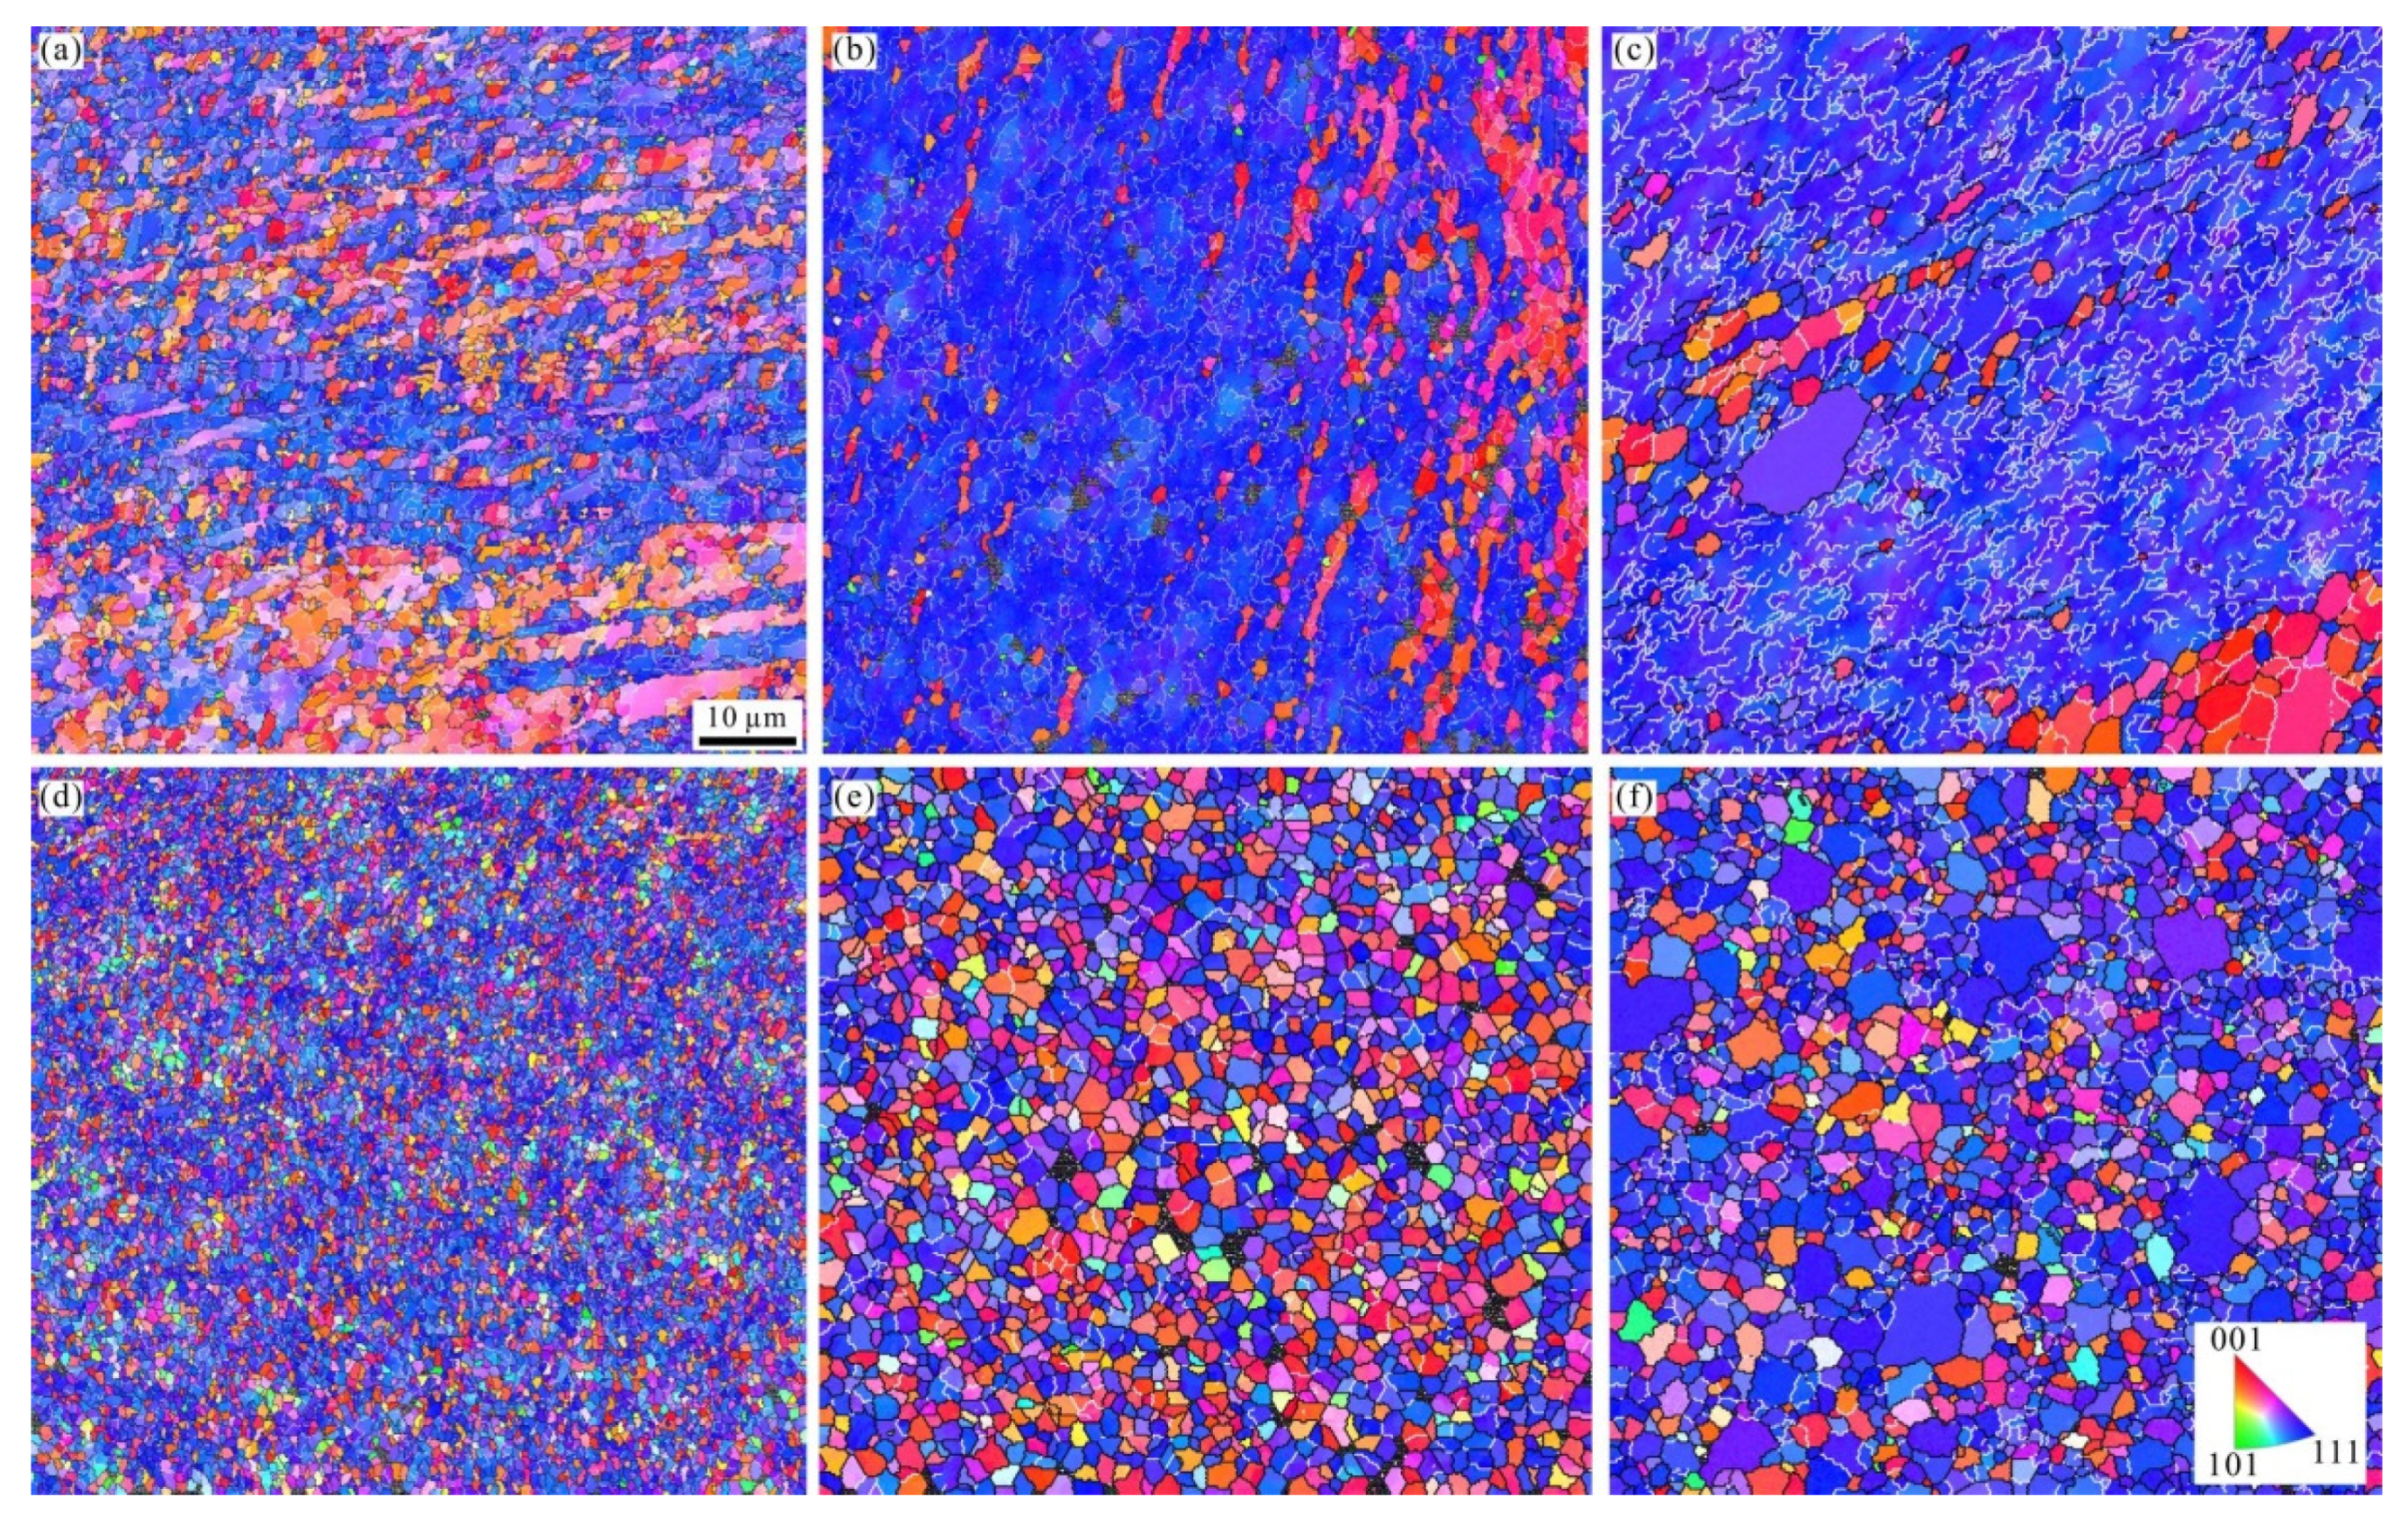
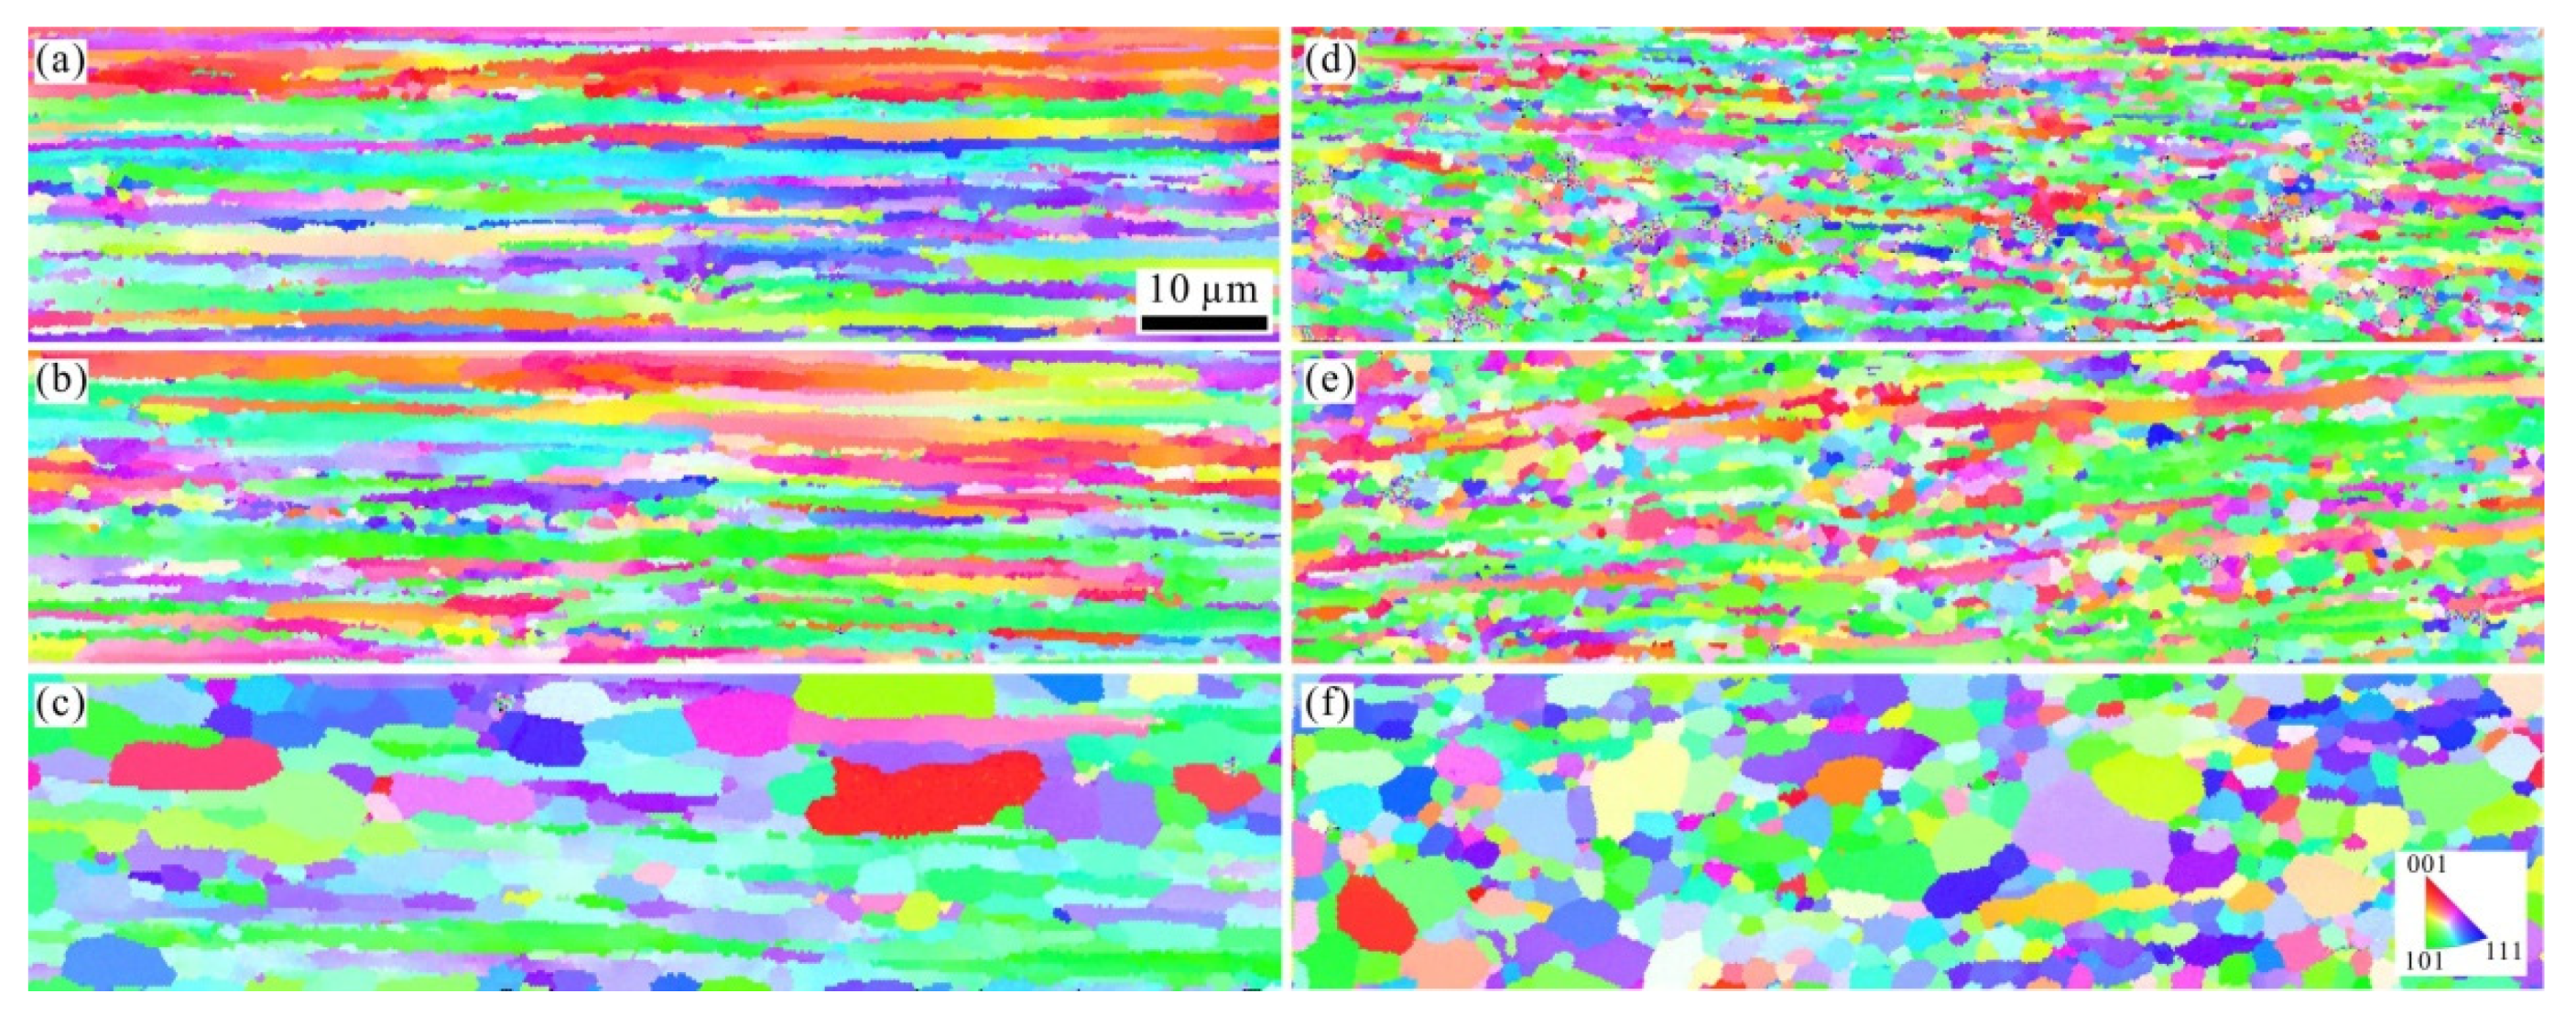
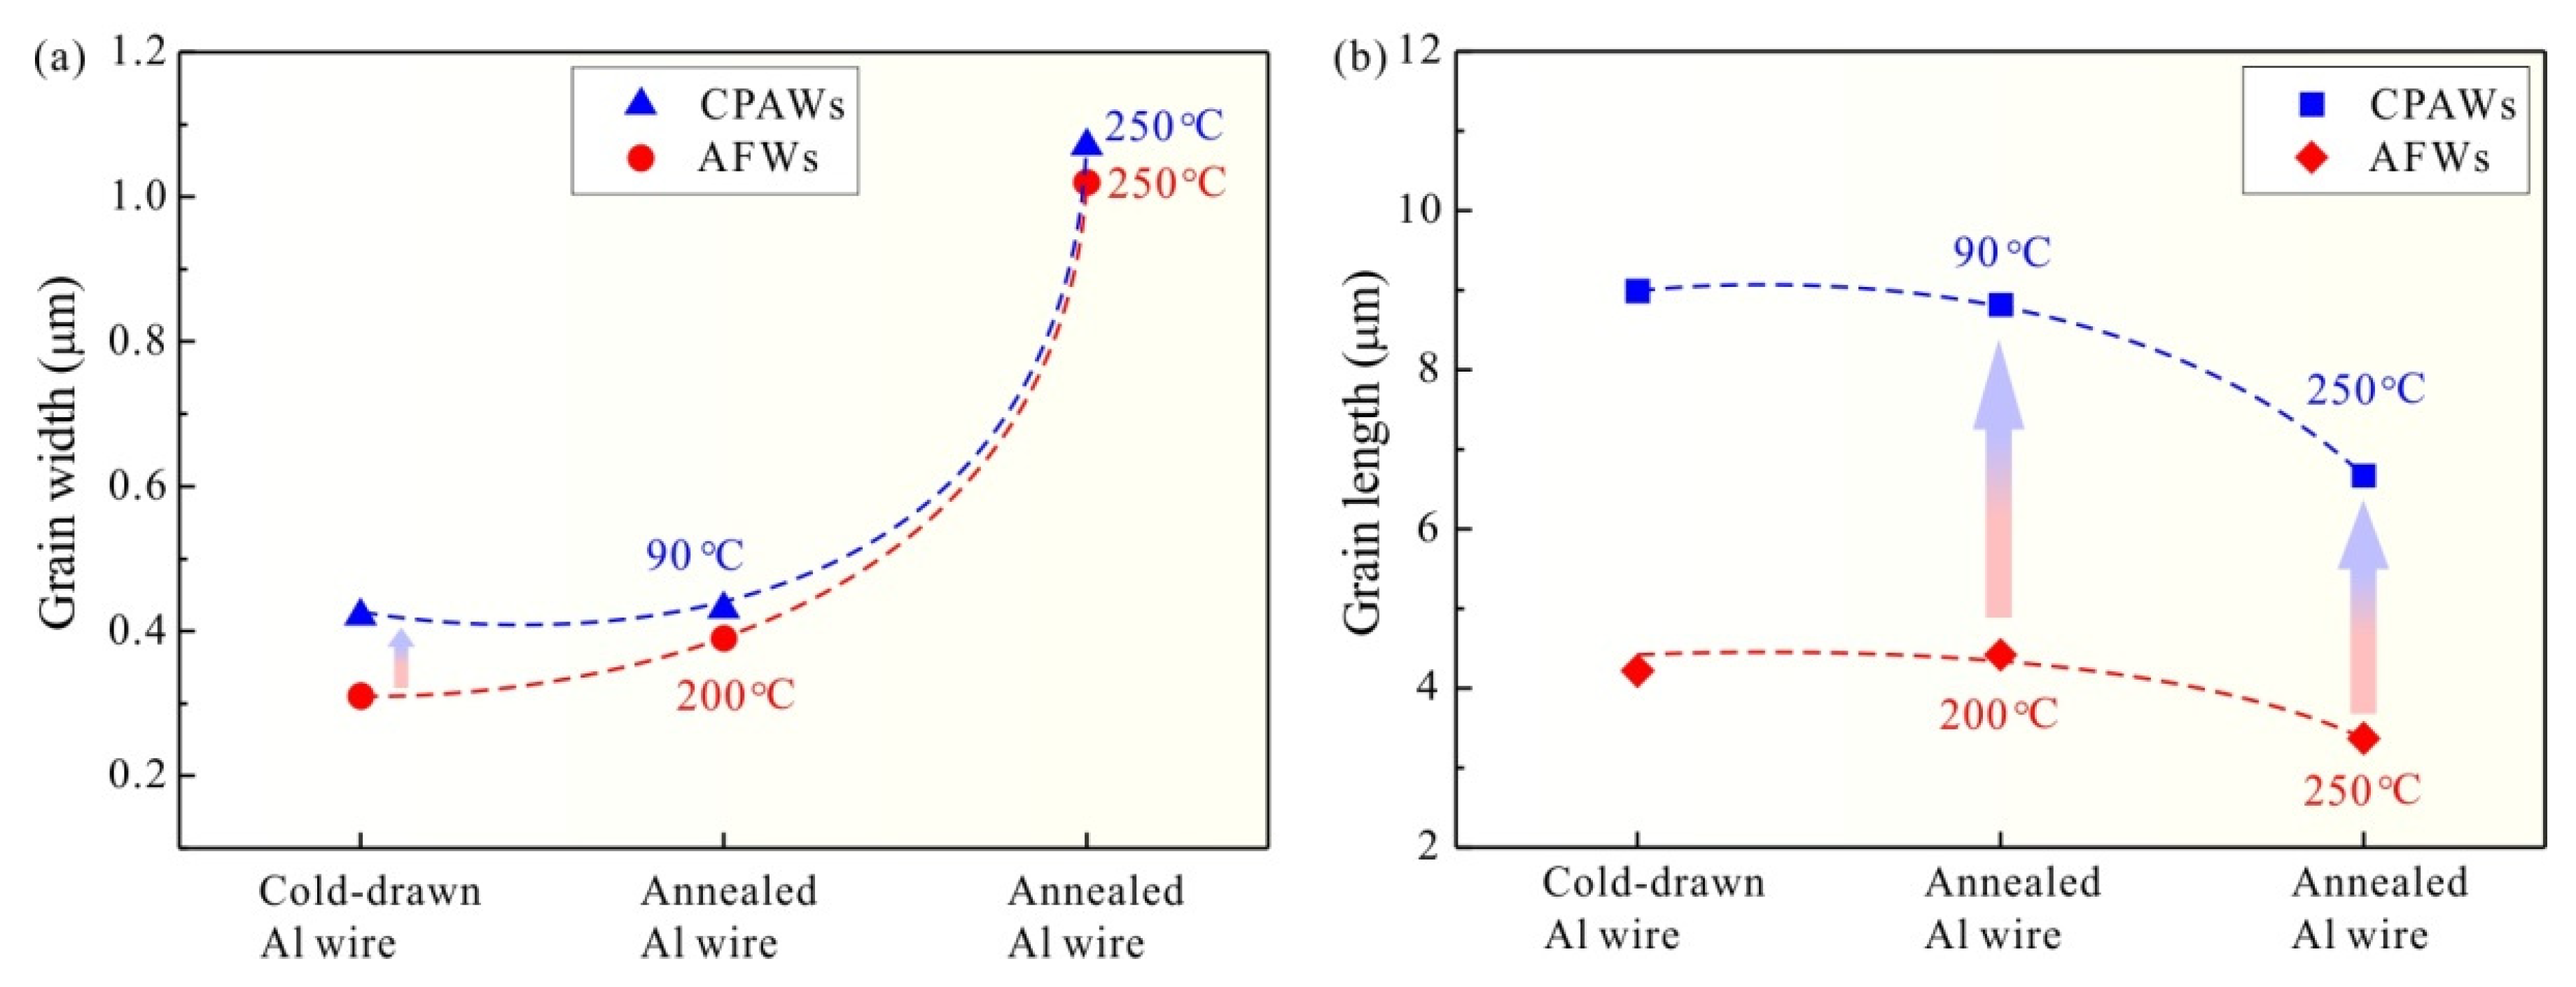
3.3. Microstructure Characterization

The cold-drawn CPAW, the CPAWs annealed at 90 and 250 °C for 8 h, the cold-drawn AFW and the AFWs annealed at 200 and 250 °C for 8 h were chosen as the samples to show their microstructure evolution.

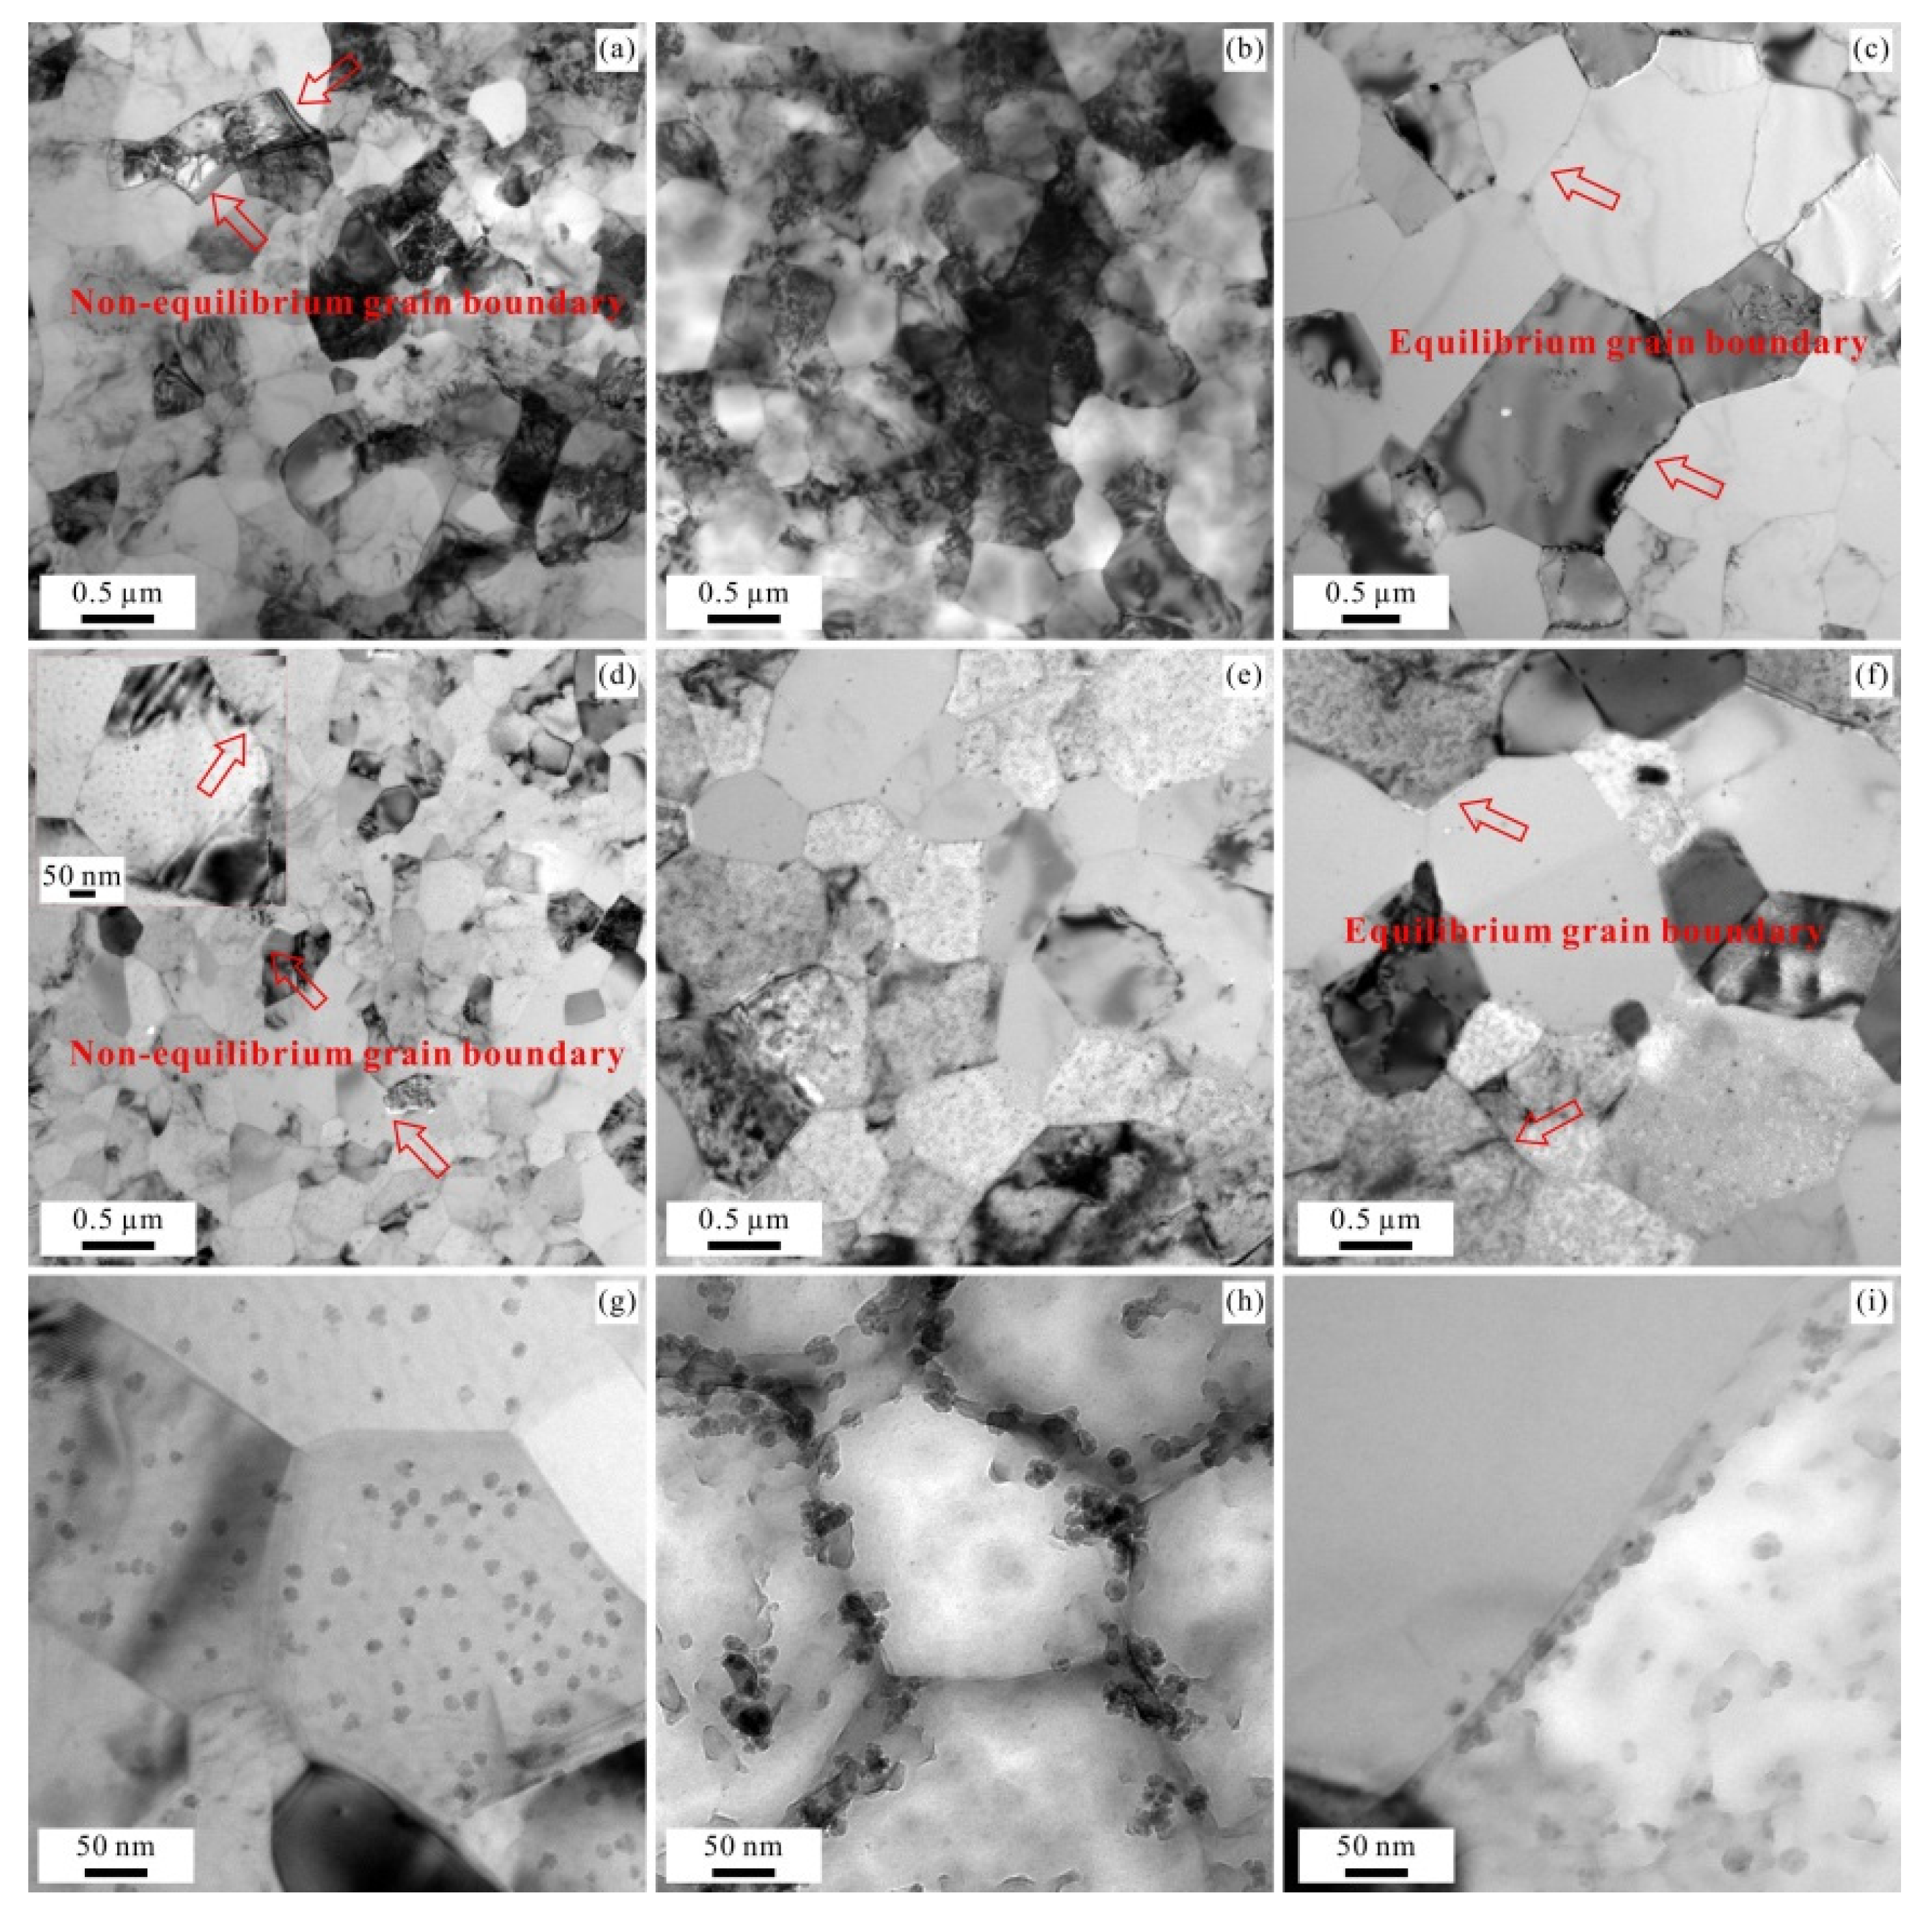
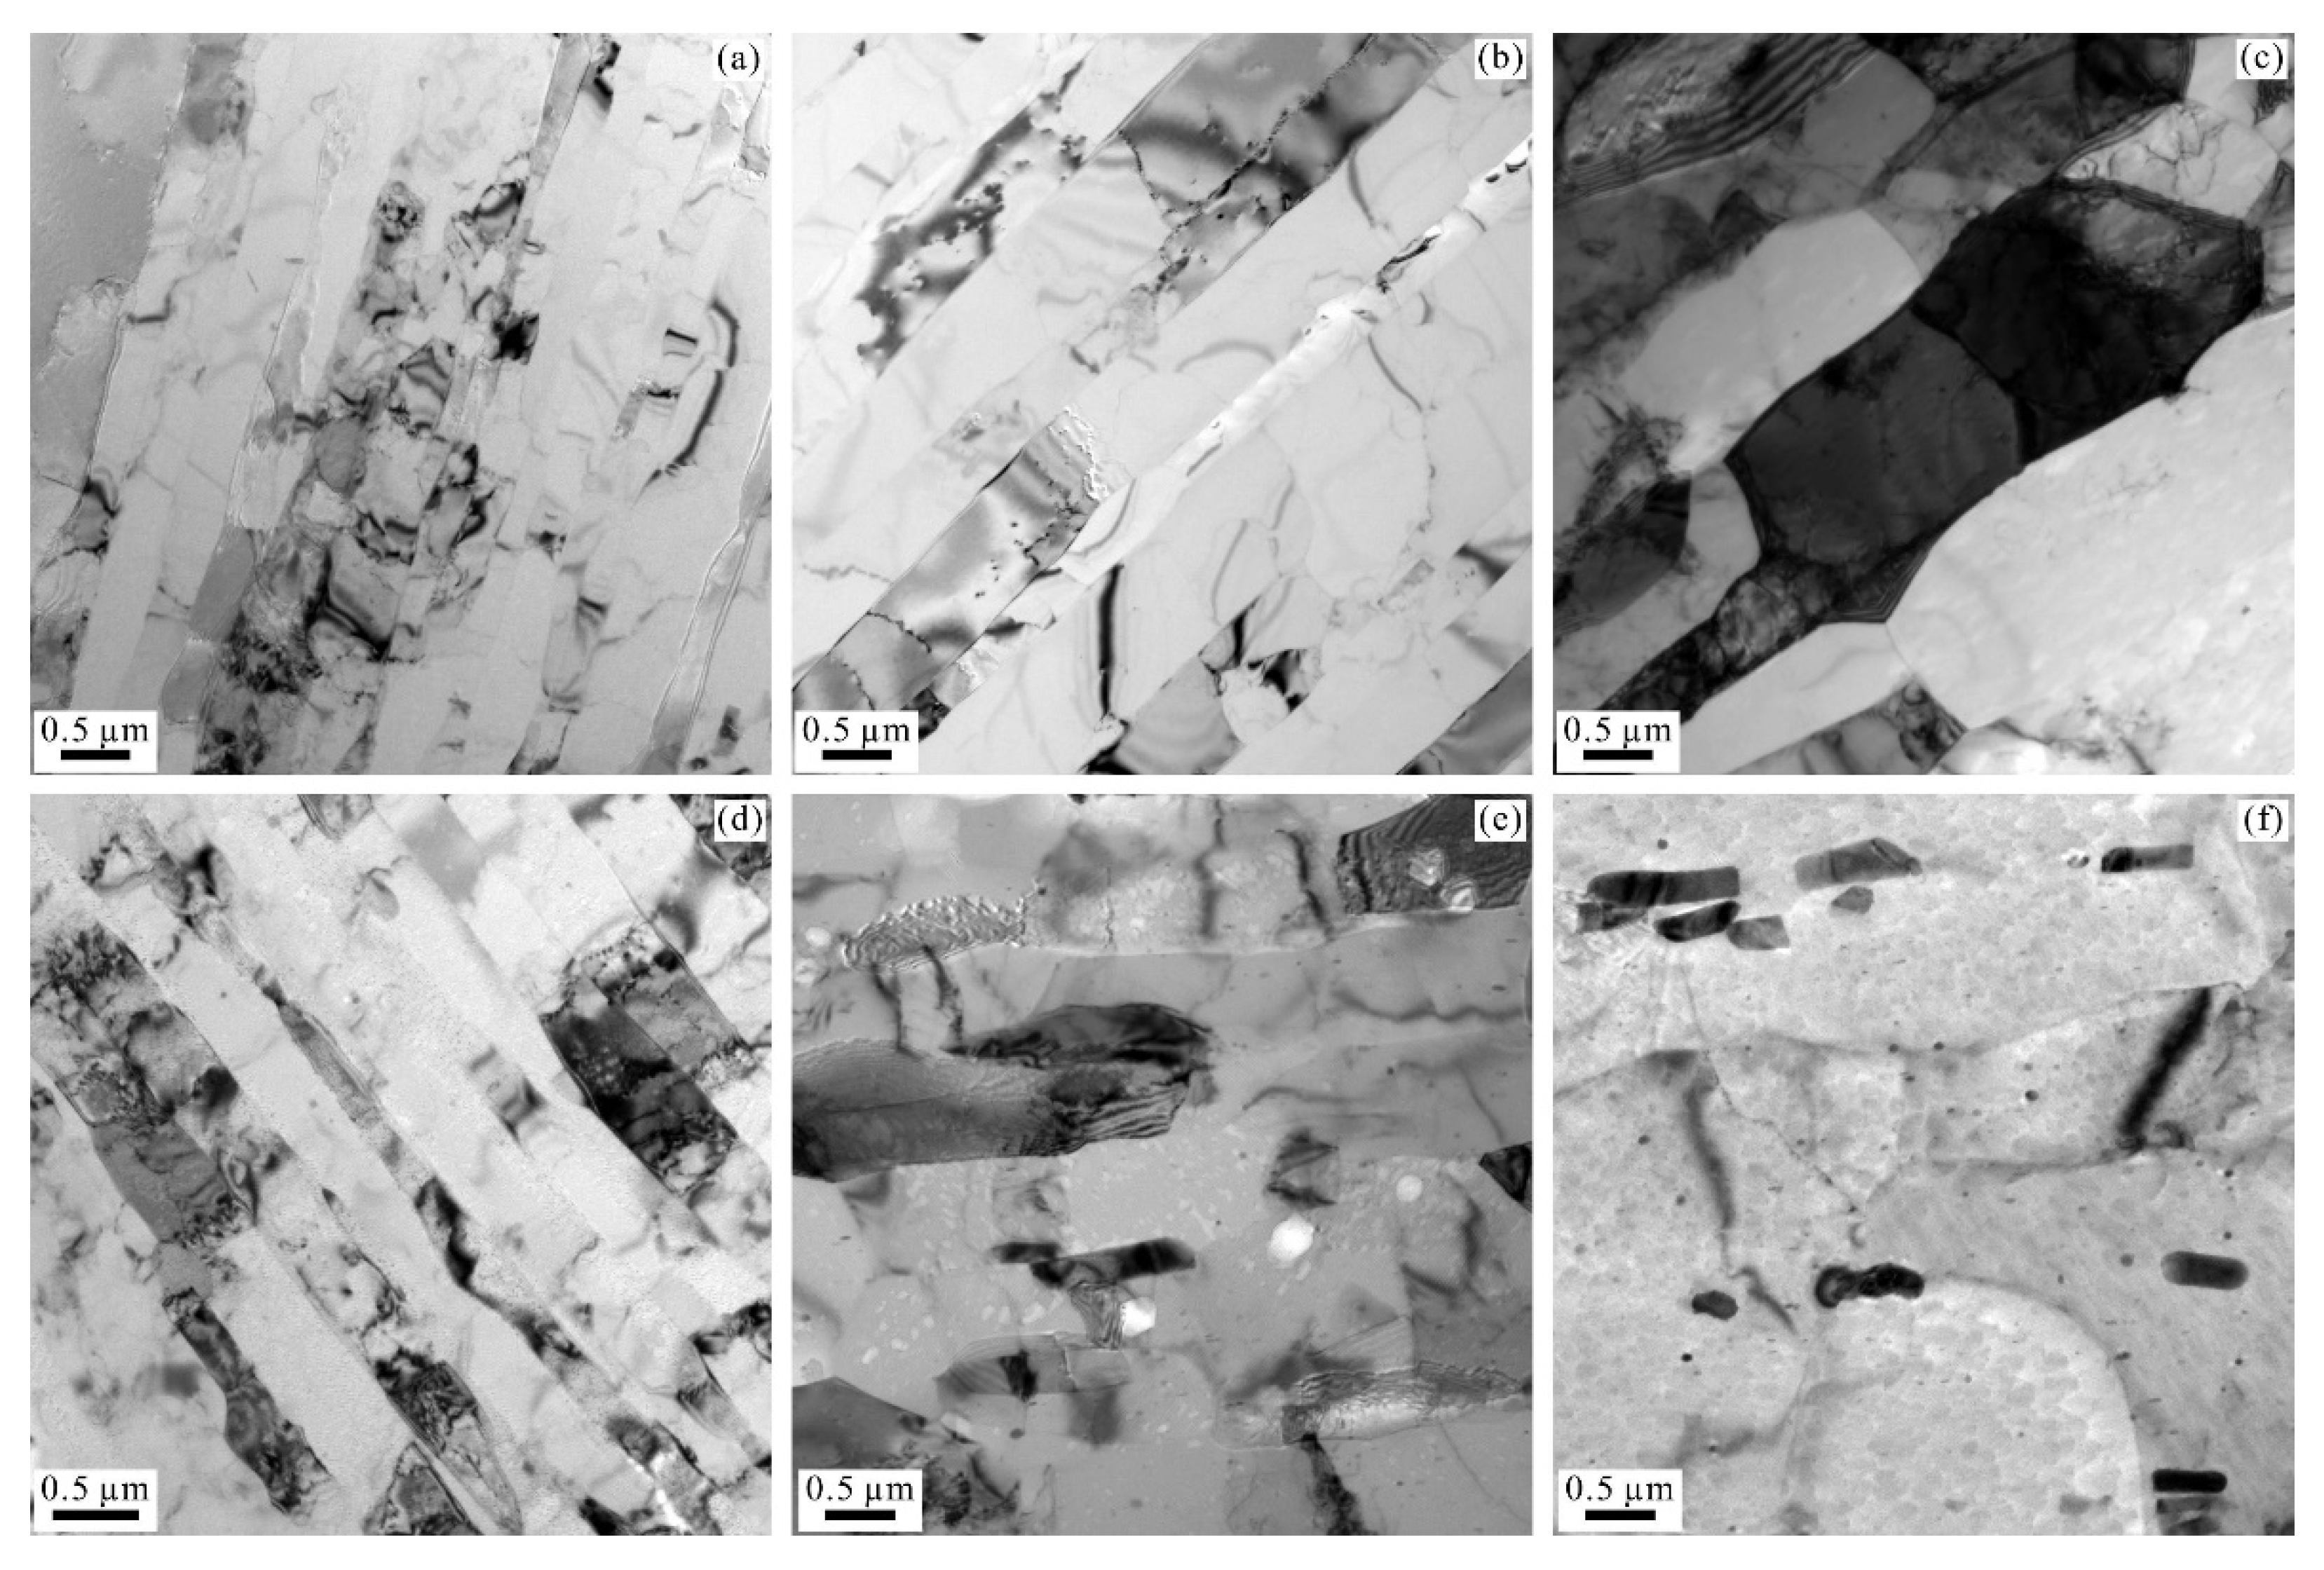
3.3.1. Transmission Electron Microscopy (TEM) Observations

As shown in Figure 3a–i, the grains in the radial section of the CPAWs and the AFWs are equiaxed. With the increase of annealing temperature, the radial grains of the CPAWs and the AFWs grew up gradually. Additionally, the evolution of precipitates in the AFWs was also observed (Figure 3g–i). The dispersive precipitated phases found in the cold-drawn AFW were identified to be Al6Fe in our previous paper [12]. As the annealing temperature increases to 200 and 250 °C, the coalescence of precipitates at grain boundaries occurs (Figure 3h,i).
Moreover, the TEM images of cold-drawn CPAWs and cold-drawn AFWs (Figure 3a,d) demonstrated wider extinction contours near grain boundaries compared with those in the CPAWs and the AFWs annealed at 250 °C (Figure 3c,f). It is reported that the non-equilibrium grain boundaries usually have wider extinction contours [18]. Besides, the non-equilibrium grain boundaries are unstable at elevated temperature, which could revert to the stable equilibrium grain boundaries [19,20]. As a result, the grain boundaries in the cold-drawn CPAWs and AFWs are non-equilibrium grain boundaries formed during the drawing process (Figure 3a,d). In contrast, the grain boundaries in the CPAWs and the AFWs annealed at 250 °C (Figure 3c,f) are in equilibrium state. Therefore, the transformation from non-equilibrium grain boundary to equilibrium grain boundary occurs for the cold-drawn Al wires annealed at high temperature.
The axial TEM images of the CPAWs and the AFWs were exhibited in Figure 4. The grains in the cold-drawn CPAWs and AFWs are elongated along the drawing direction (Figure 4a,d). When annealed at relatively low temperature (Figure 4b,e), the grains of the CPAWs and the AFWs remain elongated. However, as the annealing temperature increases to 250 ℃, the elongated grains for the CPAWs and the AFWs become wider and shorter.

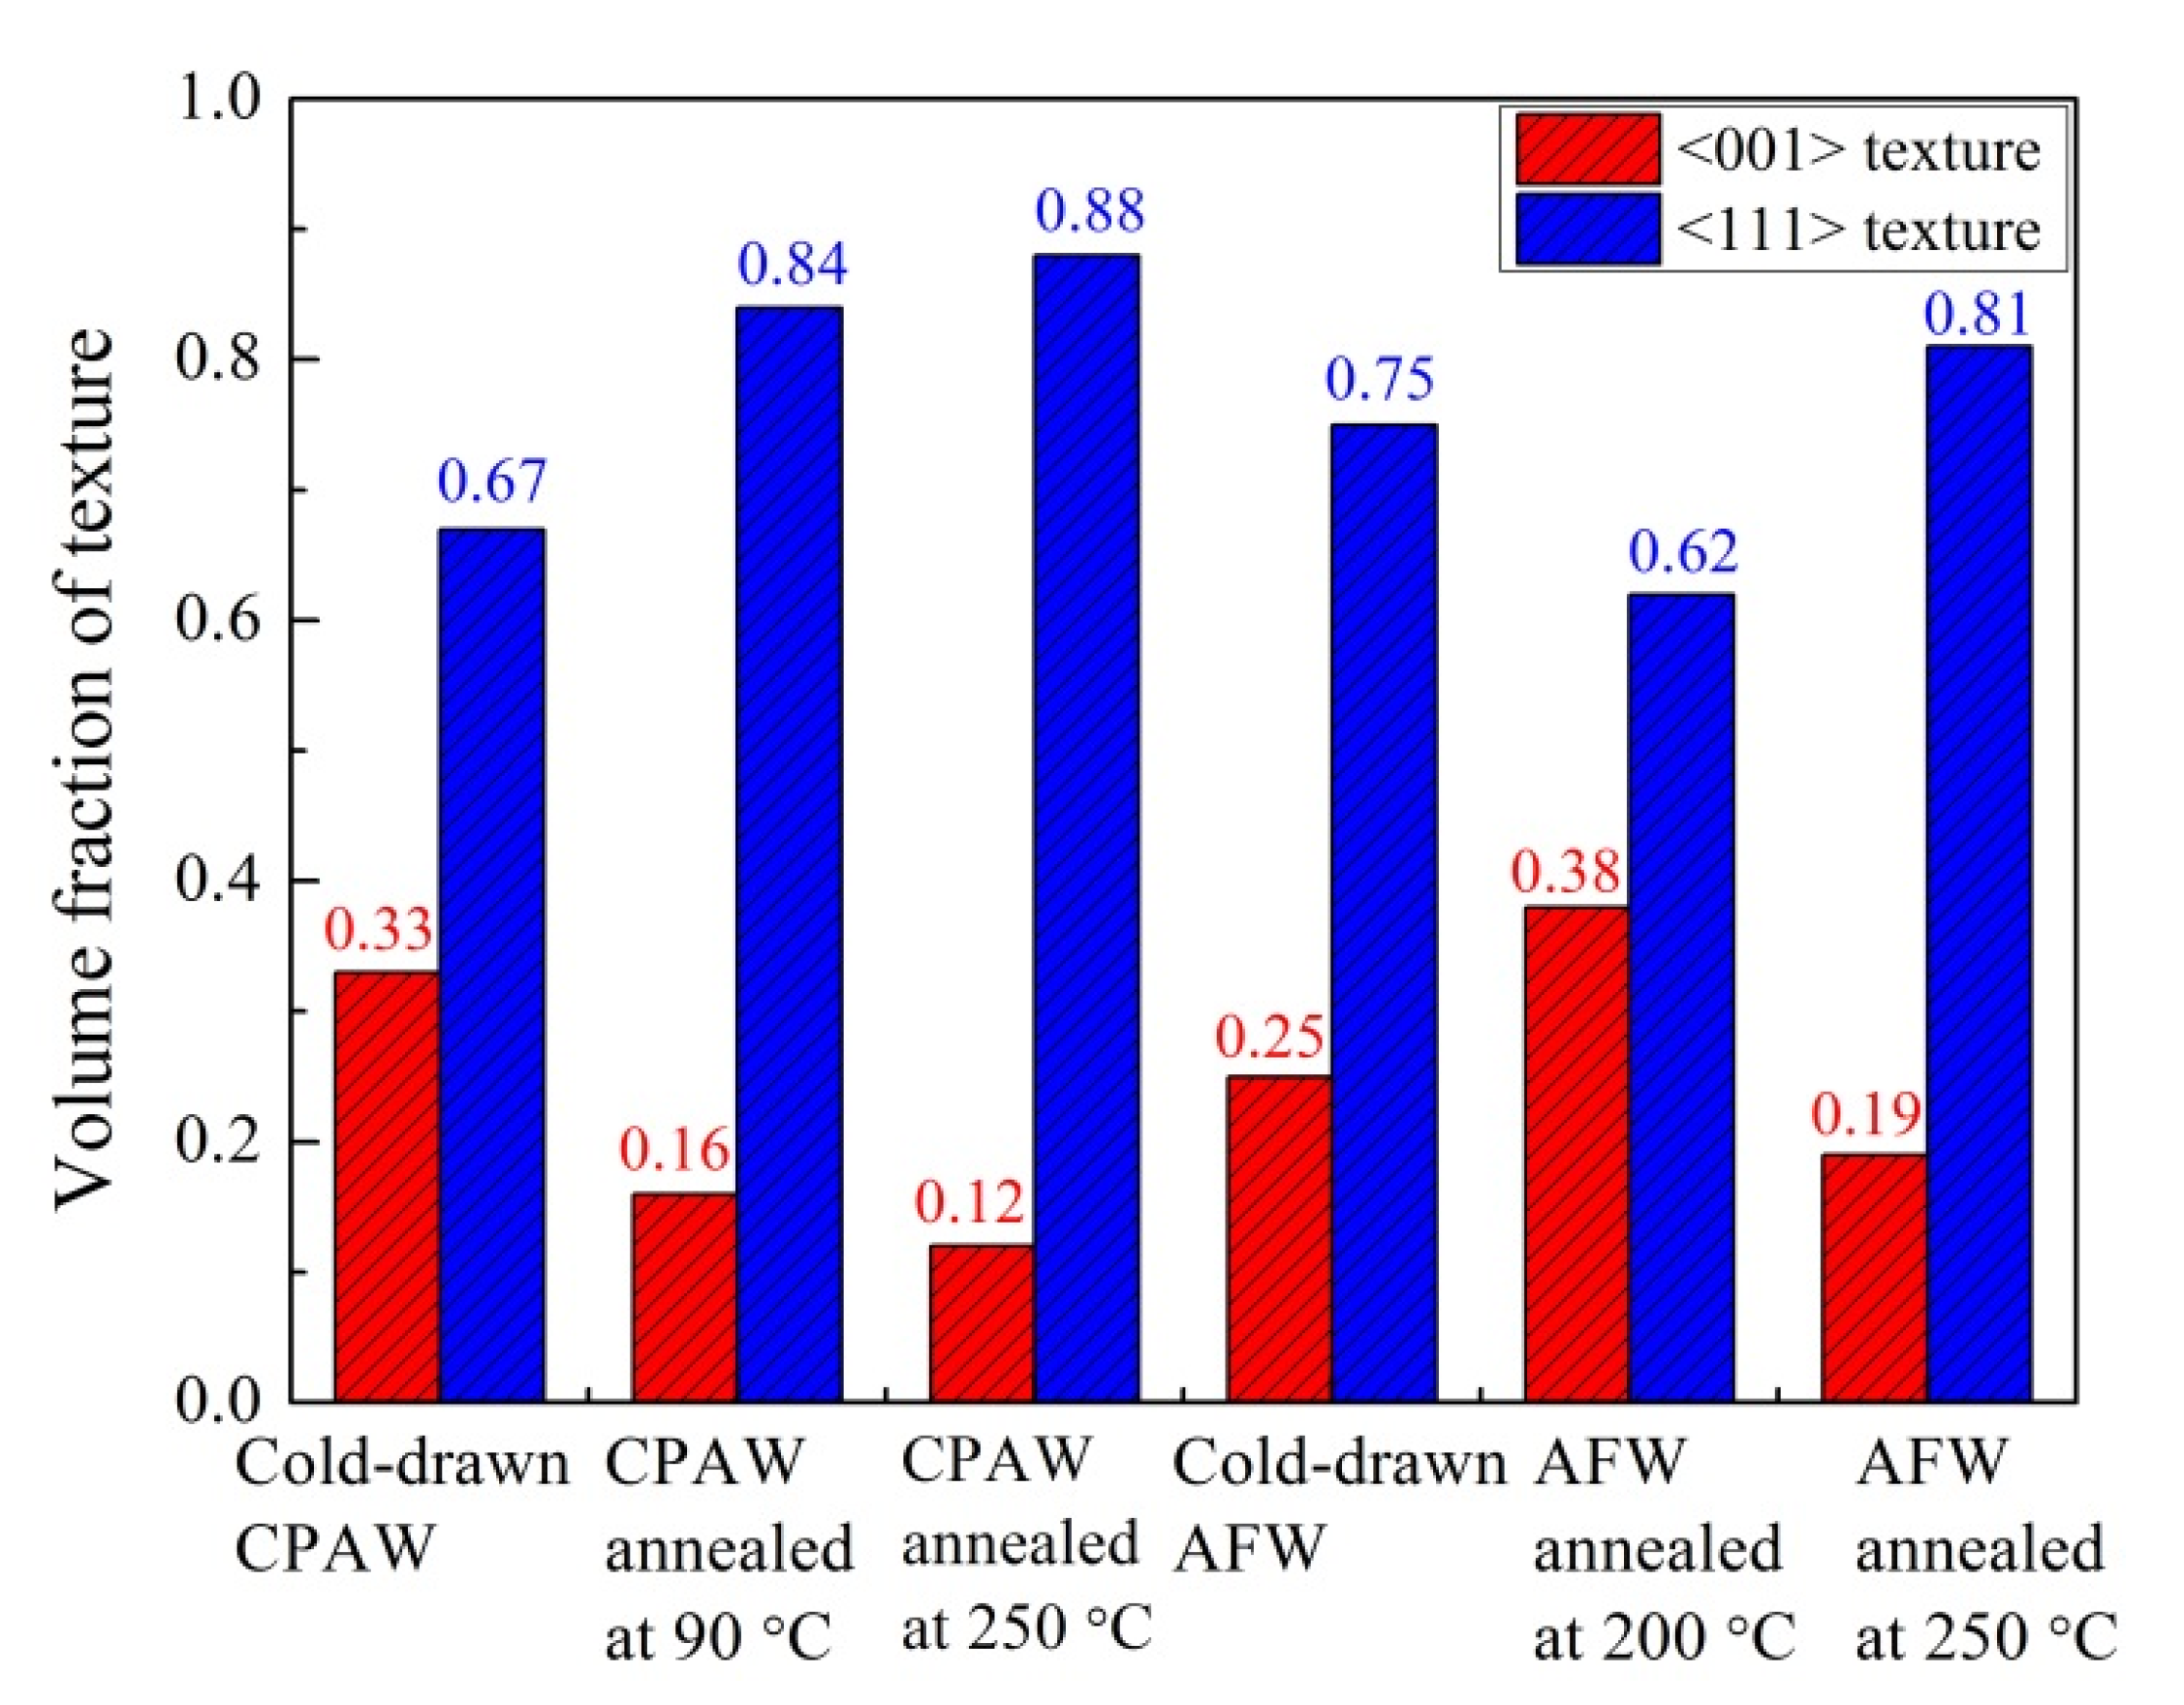
3.3.2. Electron Backscatter Diffraction (EBSD) Observations

Previous studies have shown that texture is a common microstructure of clod-drawn face-centered cubic metals, which could influence the mechanical properties [21,22,23]. Figure 5 gives the radial orientation distribution maps of the CPAWs and the AFWs. It can be seen that the orientations of the radial grains in the Al wires are <001> orientation and <111> orientation. Besides, the number of <111> oriented grains is more than that of <001> oriented grains. Therefore, both the cold-drawn Al wire and the annealed Al wire have a strong <111> texture and a relatively weak <001> texture. The texture component in this work is the same as that reported by others.
Equation (3) was used to calculate the volume fraction of texture to quantitatively display the texture distribution:
f < 111 > = S < 111 > S 0 ,
where f < 111 > is the volume fraction of the <111> texture; S < 111 > is the area of the <111> orientated grains and S 0 is the area fo the maps.
Figure 6 shows the calculated results. The volume fraction of <111> texture in the CPAWs ranges from ~0.6 to ~0.9, which is the same as that in the AFWs. As a result, the annealing treatment has little effect on the volume fraction of <111> texture.
Figure 7 shows the axial orientation distribution maps of the CPAWs and the AFWs. The axial orientation presents a random distribution without texture. Thus, the texture in the CPAWs and AFWs is fiber texture along the drawing direction. As shown in Figure 7, the grain is elongated along the axial direction, which is consistent with that observed by TEM (Figure 4). Therefore, the grain size should be characterized by radial grain size and axial grain size, which can be defined as grain width and grain length, respectively.
The grain width and the grain length of the CPAWs and the AFWs were measured on the basis of the radial TEM images and the axial orientation distribution maps, respectively. In this paper, all grain boundaries with the misorientation angle of more than 2° were used for statistics.
As shown in Figure 8a, the grain width of the cold-drawn AFWs (0.31 μm) is smaller than that of the cold-drawn CPAWs (0.42 μm). With further annealing, the grain widths of the CPAWs annealed at 90 °C and 250 °C were respectively measured to be 0.43 μm and 1.07 μm. While, the grain width of the AFWs annealed at 200 °C and 250 °C gradually increased to 0.39 μm and 1.02 μm. Obviously, with the increase of annealing temperature, the difference of grain width between the CPAWs and AFWs decreases gradually. Besides, it should be noted that the grain width of the AFW annealed at 200 °C is nearly the same as that of the CPAWs annealed at 90 °C, indicating that the grains in the AFW are more stable than those of the CPAW. For the CPAWs and AFWs, their grain length decreases with the increase of annealing temperature (Figure 8b). The grain lengths of the cold-drawn CPAWs, the CPAWs annealed at 90 °C, the CPAWs annealed at 250 °C, the cold-drawn AFWs, the AFWs annealed at 200 °C and the AFWs annealed at 250 °C were measured to be 8.99 μm, 8.82 μm, 6.67 μm, 4.22 μm, 4.42 μm and 3.37 μm. Obviously, the grain lengths of the CPAWs are about twice that of the AFWs, respectively. In general, the elongated grains of the annealed CPAWs are a little wider and much longer than those of the annealed AFWs.
On the basis of the above microstructure characterization, the texture components of the cold-drawn CPAWs, the annealed CPAWs, the cold-drawn AFWs and the annealed AFWs are nearly the same. In addition, for the CPAW annealed at 90 °C and the AFW annealed at 200 °C, their grain width and grain length remain unchanged. However, as the annealing temperature increases to 250 °C, the elongated grains in the CPAWs and the AFWs become wider and shorter. Besides, the obvious difference is that the grain lengths of the CPAWs are longer than those of the AFWs.

4. Discussion

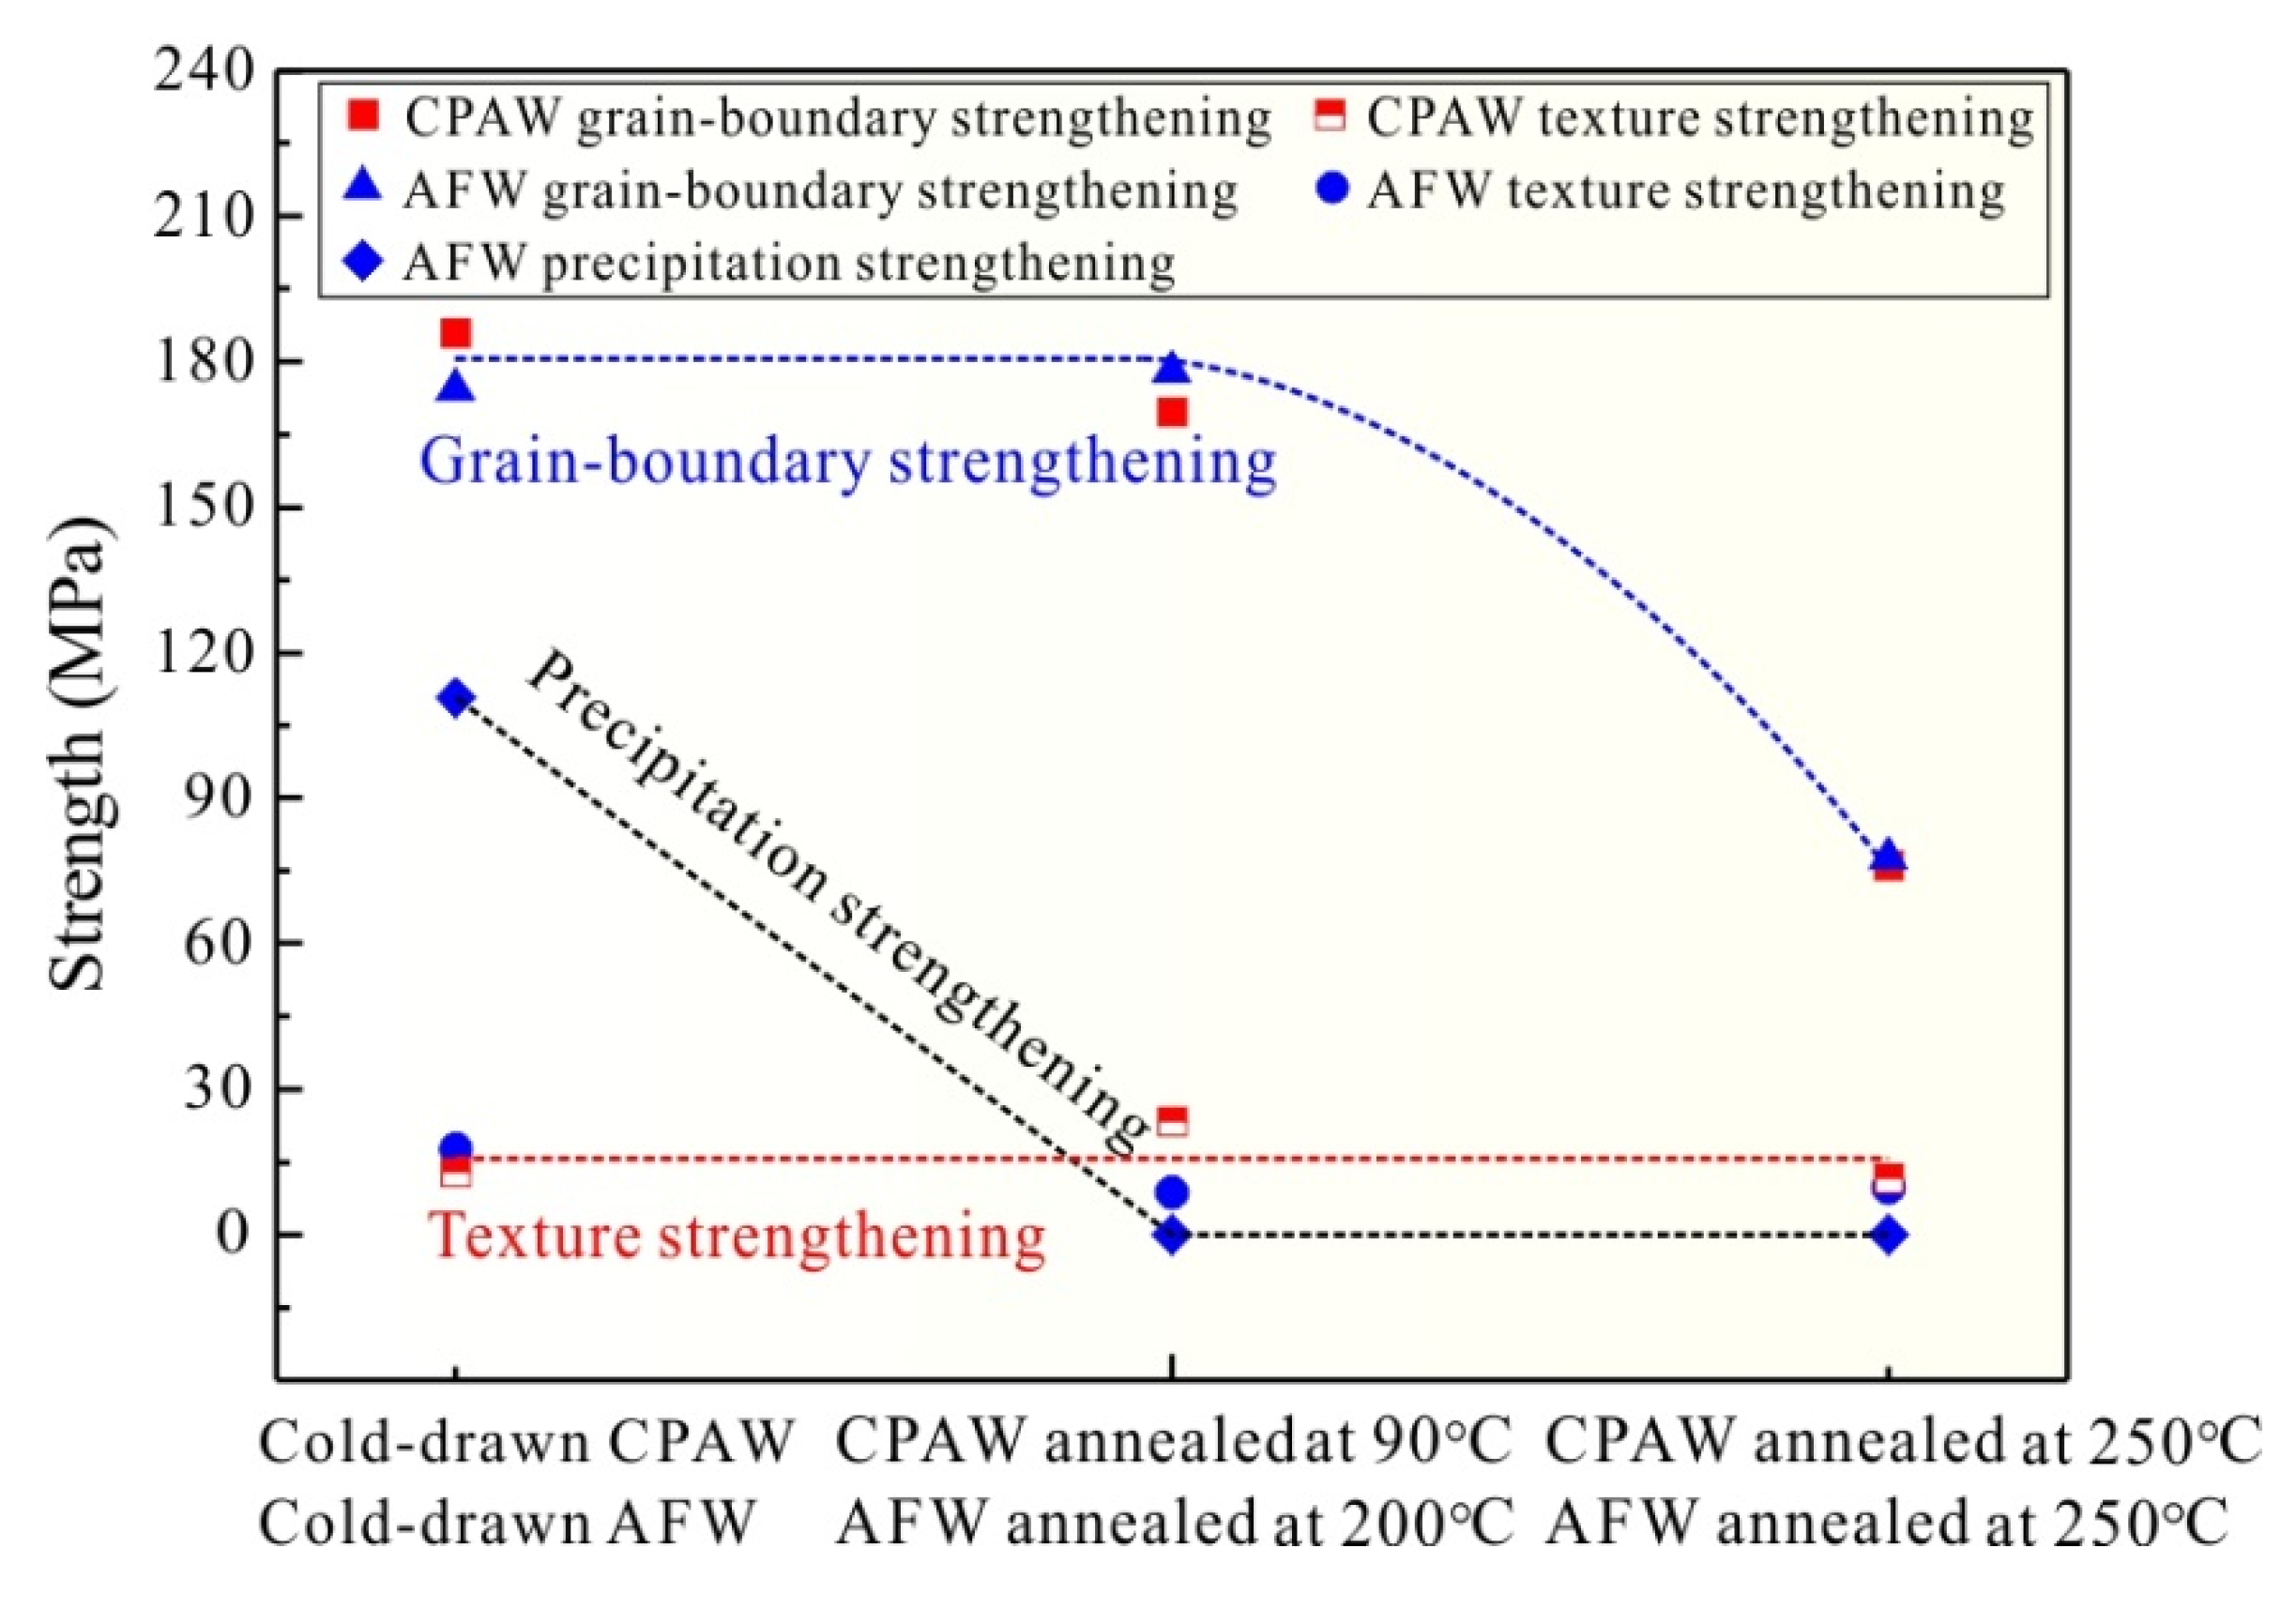
4.1. Strength Degradation Behavior

For the CPAWs and the AFWs, their strength decreases with the increase of annealing temperature. However, the strength degradation rate of the annealed AFWs is always higher than that of the annealed CPAWs. As a result, the strength degradation behavior of the AFW is different from that of the CPAW, which could provide the rules of microstructure design for Al wire with anti-degradation characterization.
The mechanisms behind the strength degradation behaviors of the CPAWs and the AFWs have been discussed in our previous papers [11,12]. Therefore, the evolution of strength of the CPAWs and the AFWs is briefly discussed in this work. As shown in Figure 3 and Figure 4, there are few dislocations observed in the CPAWs and in the AFWs. Therefore, the strength of CPAWs consists of the strength contributed by the grain-boundaries and the texture. In addition, the strength caused by the texture can be estimated by the following equations, which can be found in our previous works [11,12]:
M S = f < 001 > Ω < 001 > + f < 111 > Ω < 111 > ,
σ t = σ Y S ( 1 M 0 M S ) ,
where M S is the orientation factor of the CPAW, f < 001 > is the volume fraction of <001> texture, f < 111 > is the volume fraction of <111> texture, Ω < 001 > and Ω < 111 > are the Schmid factors of the <001> orientation and <111> orientation, which are equal to 0.408 and 0.272, respectively, σ t is the texture strengthening, σ Y S is the yield strength of the CPAW, M 0 = 3.06 is the mean orientation factor for polycrystalline Al with random orientation [24].
As a result, firstly, the strength induced by texture of the CPAWs can be calculated based on the statistical results corresponding to the volume fractions of <001> texture and <111> texture. Then, the grain-boundary strengthening of the CPAWs can also be obtained.
For the AFW, its yield strength contains the strength due to the dispersed nano-precipitates, the fine grans and the hard texture. The precipitation strengthening of the AFW can be calculated on the basis of the Orowan–Ashby equation [25,26]:
σ p = 0.13 M 0 G b L ln r b ,
where σ p is the precipitation strengthening, G is the shear modulus of Al (26.0 GPa), b is the Burgers vector of Al (0.286 nm) [24], r and L are the mean radius of the precipitate and the inter-precipitate distance.
Our previous work has shown that the average radius and the mean distance of the precipitates of the cold-drawn AFW are 5.2 nm and 77.5 nm, respectively [12]. Thus, the precipitation strengthening in the cold-drawn AFW is calculated to be 110.7 MPa. Then, the residual strength of the cold-drawn AFW caused by the texture strengthening and the grain-boundary strengthening can be achieved by the Equations (4) and (5). Our previous work has revealed that the precipitation strengthening of the AFWs annealed for 8 h at 200 and 250 °C can be ignored due to the serious growth of precipitates [12]. Thus, the texture and the grain-boundary offer the yield strength of the AFWs annealed at 200 and 250 °C, which can be calculated by the Equations (4) and (5).
Therefore, the evolution of strength caused by various strengthening mechanisms of the CPAWs and the AFWs can be calculated and shown in Figure 9. Obviously, the strength caused by grain-boundary strengthening of the cold-drawn CPAW, the AFW, the CPAW annealed at 90 °C and the AFW annealed at 200 °C is nearly constant. However, for the AFWs, the strength caused by the precipitation strengthening decreases obviously as the annealing temperature exceeds 200 °C. Besides, the strengths caused by texture strengthening of the CPAWs and the AFWs are almost the same. As a result, the higher strength degradation rate of the AFW as compared with that of the CPAW is due to the coalescence of precipitates. Additionally, the strength due to grain-boundary strengthening of the AFW and the CPAW decreases rapidly as the annealing temperature rises to 250 °C.
Consequently, the increase of grain width is the strength degradation mechanism for the annealed CPAWs. In contrast, for the AFWs, the coalescence of precipitates is the main reason for the decrease of strength when annealed at relatively low temperature, and the increase of grain width should be responsible for the loss of strength when annealed at relatively high temperature.

4.2. Evolution of Strength-Electrical Conductivity Relation

With the increasing annealing temperature, the increase of EC and the decrease of yield strength were observed both for the CPAWs and the AFWs. The difference is that the EC of the CPAW is always higher than that of the AFW when the yield strength of the CPAW is the same as that of AFW.
According to Matthiessen’s rule, the resistivity of the Al wire can be estimated by the following equation [27,28]:
ρ = ρ Al + ρ gb + ρ d + ρ vac + ρ s + ρ p ,
where ρ Al is the resistivity of the pure Al (2.655 × 10⁻⁸ Ω·m at room temperature); ρ gb , ρ d , ρ vac , ρ s and ρ p are the resistivities caused by grain boundaries, dislocations, vacancies, solute atoms and precipitates, respectively.
For the CPAW and the AFW, there is no dissolution and formation of precipitates during the annealing process. As a result, the resistivities of the precipitates and the solute atoms need not to be taken into account for the CPAWs and the AFWs. The recovery of defects including dislocations and vacancies in the cold-drawn CPAW and the cold-drawn AFW could lead to the decrease of resistivities and the increase of EC for the annealed CPAWs and the annealed AFWs. Additionally, the evolution of grains is also closely related to the change of EC. As shown in Figure 8a, the grain widths of the CPAWs and the AFWs obviously increase with the annealing temperature, which leads to the decrease of the fraction of grain boundary per unit volume. Furthermore, the grain lengths of the CPAWs and the AFWs slightly decrease with the annealing temperature. Therefore, the significant increase of grain width could reduce the probability of electron scattering during the current transmission, leading to the increase of EC. In addition, on the one hand, the grain lengths of the CPAWs annealed at 90 °C and annealed at 250 °C are about twice that of the AFWs annealed at 200 °C and annealed at 250 °C, respectively. Commonly, longer grains lead to higher EC. On the other hand, the resistivities of precipitates and solute atoms of the AFWs are higher than those of the CPAWs. As a result, the EC of the annealed CPAW is always higher than that of the annealed AFWs.
In addition to the grain size, the state of grain boundary also influences the EC of Al wires. Previously, Orlova et al. [18] studied the effect of grain boundary state on the resistivity of ultrafine grained commercially pure Al processed by HPT. The results show that the resistivity of non-equilibrium grain boundary is about 1.5 times of that of equilibrium grain boundary [18]. Figure 3 shows that the grain boundaries in the cold-drawn CPAW and the cold-drawn AFW are non-equilibrium grain boundaries. However, with the increase of annealing temperature, the non-equilibrium grain boundaries gradually transform into equilibrium grain boundaries, leading to the decrease of resistivities of grain boundaries. Thus, the transformation from non-equilibrium grain boundary to equilibrium grain boundary for the CPAWs and the AFWs during the annealing process could also result in the increase of EC without loss of strength.
Consequently, the recovery of defects and the significant increase of grain width are the main mechanisms for the increase of EC and the decrease of yield strength for the annealed CPAWs and the annealed AFWs. In addition, the coarsening of the precipitates at the grain boundary could purify the interior of the grains, leading to the increase of EC and the decrease of yield strength for the annealed AFWs.

4.3. Principle of Multi-Scale Microstructure Design for Anti-Degradation

From the above discussion, it can be found that the degradation behavior of the annealed Al wire is the decrease of strength and the increase of EC. Therefore, the anti-degradation design of Al wire should focus on improving the strength degradation resistance of Al wire by multi-scale microstructure design to spress the strength loss during the long-term service. For the annealed CPAWs, the growth of grain is the main mechanism for the strength degradation. While, the coalescence of precipitate and the growth of grain should be responsible for the loss of strength for the annealed AFWs. The obvious difference is that the grain growth of CPAW occurs at a temperature of more than 90 °C, while that of AFW occurs as the temperature exceeds 200 °C due to the pinning effect of grain boundaries caused by the precipitates in the AFW. Thus, the stability of grain boundary could be improved by introducing the precipitates at the grain boundary. Unfortunately, as the annealing temperature exceeds 200 °C, the coalescence of precipitate was observed in the AFW, resulting in the rapid loss of strength. As a result, the principle of microstructure design for anti-degradation of Al wire is introducing the heat-resistant precipitates at the grain boundaries.

5. Conclusions

The strength degradation behavior and the strength-electrical conductivity relation of the annealed CPAWs and the annealed AFWs were investigated in this work. The following conclusions can be drawn:
(1) With the increase of annealing temperature, the strength degradation rate of the AFWs is always higher than that of the CPAWs. In addition, the decrease of yield strength and the increase of EC were found in the CPAWs and the AFWs, which shows a linear trade-off relation.
(2) The grain widths of the CPAWs annealed at 90 and at 250 °C are respectively equal to those of the AFWs annealed at 200 and at 250 °C. When the temperature is over 90 °C, grain growth occurs in CPAW. However, for the annealed AFW, the grains begin to grow until the temperature exceeds 200 °C. Furthermore, the coalescence of precipitate was observed in the AFW as the temperature rises to 200 °C.
(3) The recovery of dislocations and the obvious increase of grain width lead to the decrease of strength and the increase of EC, which is the mechanism behind the trade-off relation between the strength and the EC for the annealed CPAWs and the annealed AFWs. Moreover, the coalescence of precipitate in the AFW leads to the obvious decrease of strength, which results in the higher strength degradation rate for the AFW as compared with that for the CPAW.
(4) The principle of microstructure design for anti-degradation of Al wire is introducing the heat-resistant precipitates at the grain boundaries to surprise the grain growth. As long as the ambient temperature is not high enough to force the precipitates coalescence, the material can be effectively anti-degradation.

Author Contributions

Conceptualization, R.L. and J.H.; methodology, H.L. and L.Q.; validation, H.M.; formal analysis, J.H. and Q.W.; investigation, J.H. and Q.W.; data curation, H.L.; writing—original draft preparation, R.L. and J.H.; writing—review and editing, Q.W., X.L. and Z.Z. All authors have read and agreed to the published version of the manuscript.

Funding

This work was financially supported by State Grid Corporation of China, 5211HD180007.

Conflicts of Interest

The authors declare no conflict of interest.

References

  1. Sauvage, X.; Bobruk, E.V.; Murashkin, M.Y.; Nasedkina, Y.; Enikeev, N.A.; Valiev, R.Z. Optimization of electrical conductivity and strength combination by structure design at the nanoscale in Al-Mg-Si alloys. Acta Mater. 2015, 98, 355–366. [Google Scholar] [CrossRef]
  2. Rhee, H.; Whittington, W.R.; Oppedal, A.L.; Sherif, A.R.; King, R.L.; Kim, H.-J.; Lee, C. Mechanical properties of novel aluminum metal matrix metallic composites: Application to overhead conductors. Mater. Des. 2015, 88, 16–21. [Google Scholar] [CrossRef]
  3. Li, R.; Chen, H.; Chen, C.; Zhu, H.; Wang, M.; Yuan, T.; Song, B. Selective laser melting of gas atomized Al-3.02Mg-0.2Sc-0.1Zr alloy powder: Microstructure and mechanical properties. Adv. Eng. Mater. 2018, 21, 1800650. [Google Scholar] [CrossRef]
  4. Luo, X.M.; Song, Z.M.; Li, M.L.; Wang, Q.; Zhang, G.P. Microstructural evolution and service performance of cold-drawn pure aluminum conductor wires. J. Mater. Sci. Technol. 2017, 33, 1039–1043. [Google Scholar]
  5. Zhu, Y.K.; Chen, Q.Y.; Wang, Q.; Yu, H.Y.; Li, R.; Hou, J.P.; Zhang, Z.J.; Zhang, G.P.; Zhang, Z.F. Effect of stress profile on microstructure evolution of cold-drawn commercially pure aluminum wire analyzed by finite element simulation. J. Mater. Sci. Technol. 2018, 34, 1214–1221. [Google Scholar] [CrossRef]
  6. Karabay, S. Modification of AA-6201 alloy for manufacturing of high conductivity and extra high conductivity wires with property of high tensile stress after artificial aging heat treatment for all-aluminium alloy conductors. Mater. Des. 2006, 27, 821–832. [Google Scholar] [CrossRef]
  7. Cui, X.; Cui, H.; Wu, Y.; Liu, X. The improvement of electrical conductivity of hypoeutectic Al-Si alloys achieved by composite melt treatment. J. Alloys Compd. 2019, 788, 1322–1328. [Google Scholar] [CrossRef]
  8. Karabay, S. Influence of AlB2 compound on elimination of incoherent precipitation in artificial aging of wires drawn from redraw rod extruded from billets cast of alloy AA-6101 by vertical direct chill casting. Mater. Des. 2008, 29, 1364–1375. [Google Scholar] [CrossRef]
  9. Hou, J.P.; Wang, Q.; Zhang, Z.J.; Tian, Y.Z.; Wu, X.M.; Yang, H.J.; Li, X.W.; Zhang, Z.F. Nano-scale precipitates: The key to high strength and high conductivity in Al alloy wire. Mater. Des. 2017, 132, 148–157. [Google Scholar] [CrossRef]
  10. Yuan, W.H.; Liang, Z.Y.; Zhang, C.Y.; Wei, L.J. Effects of La addition on the mechanical properties and thermal-resistant properties of Al–Mg–Si–Zr alloys based on AA 6201. Mater. Des. 2012, 34, 788–792. [Google Scholar] [CrossRef]
  11. Hou, J.P.; Chen, Q.Y.; Wang, Q.; Yu, H.Y.; Zhang, Z.J.; Li, R.; Li, X.W.; Zhang, Z.F. Effects of annealing treatment on the microstructure evolution and the strength degradation behavior of the commercially pure Al conductor. Mater. Sci. Eng. A 2017, 707, 511–517. [Google Scholar] [CrossRef]
  12. Hou, J.P.; Li, R.; Wu, X.M.; Yu, H.Y.; Zhang, Z.J.; Chen, Q.Y.; Wang, Q.; Li, X.W.; Zhang, Z.F. Microstructure evolution and strength degradation mechanisms of high-strength Al-Fe wire. J. Mater. Sci. 2018, 54, 5032–5043. [Google Scholar] [CrossRef]
  13. Hou, J.P.; Li, R.; Wang, Q.; Yu, H.Y.; Zhang, Z.J.; Chen, Q.Y.; Ma, H.; Wu, X.M.; Li, X.W.; Zhang, Z.F. Breaking the trade-off relation of strength and electrical conductivity in pure Al wire by controlling texture and grain boundary. J. Alloys Compd. 2018, 769, 96–109. [Google Scholar] [CrossRef]
  14. Hou, J.P.; Li, R.; Wang, Q.; Yu, H.Y.; Zhang, Z.J.; Chen, Q.Y.; Ma, H.; Li, X.W.; Zhang, Z.F. Origin of abnormal strength-electrical conductivity relation for an Al–Fe alloy wire. Materialia 2019, 7, 100403. [Google Scholar] [CrossRef]
  15. Valiev, R.Z.; Murashkin, M.Y.; Sabirov, I. A nanostructural design to produce high-strength Al alloys with enhanced electrical conductivity. Scr. Mater. 2014, 76, 13–16. [Google Scholar] [CrossRef]
  16. Miyajima, Y.; Komatsu, S.-Y.; Mitsuhara, M.; Hata, S.; Nakashima, H.; Tsuji, N. Change in electrical resistivity of commercial purity aluminium severely plastic deformed. Philos. Mag. 2010, 90, 4475–4488. [Google Scholar] [CrossRef]
  17. Medvedev, A.E.; Murashkin, M.Y.; Enikeev, N.A.; Valiev, R.Z.; Hodgson, P.D.; Lapovok, R. Optimization of strength-electrical conductivity properties in Al-2Fe alloy by severe plastic deformation and heat treatment. Adv. Eng. Mater. 2018, 20, 1700867. [Google Scholar] [CrossRef]
  18. Orlova, T.S.; Mavlyutov, A.M.; Bondarenko, A.S.; Kasatkin, I.A.; Murashkin, M.Y.; Valiev, R.Z. Influence of grain boundary state on electrical resistivity of ultrafine grained aluminium. Philos. Mag. 2016, 96, 2429–2444. [Google Scholar] [CrossRef]
  19. Mabuchi, M.; Ameyama, K.; Iwasaki, H.; Higashi, K. Low temperature superplasticity of AZ91 magnesium alloy with non-equilibrium grain boundaries. Acta Mater. 1999, 47, 2047–2057. [Google Scholar] [CrossRef]
  20. Zhou, F.; Liao, X.Z.; Zhu, Y.T.; Dallek, S.; Lavernia, E.J. Microstructural evolution during recovery and recrystallization of a nanocrystalline Al-Mg alloy prepared by cryogenic ball milling. Acta Mater. 2003, 51, 2777–2791. [Google Scholar] [CrossRef]
  21. Hou, J.P.; Wang, Q.; Yang, H.J.; Wu, X.M.; Li, C.H.; Li, X.W.; Zhang, Z.F. Microstructure evolution and strengthening mechanisms of cold-drawn commercially pure aluminum wire. Mater. Sci. Eng. A 2015, 639, 103–106. [Google Scholar] [CrossRef]
  22. Rajan, K.; Petkie, R. Microtexture and anisotropy in wire drawn copper. Mater. Sci. Eng. A 1998, 257, 185–197. [Google Scholar] [CrossRef]
  23. Zhang, X.; Wang, Z.; Zhou, Z.; Shao, J. Microstructure and mechanical property evolutions in Al-3.0 wt%Mg alloy wire drawing. Appl. Phys. A 2018, 124, 690. [Google Scholar] [CrossRef]
  24. Ma, K.; Wen, H.; Hu, T.; Topping, T.D.; Isheim, D.; Seidman, D.N.; Lavernia, E.J.; Schoenung, J.M. Mechanical behavior and strengthening mechanisms in ultrafine grain precipitation-strengthened aluminum alloy. Acta Mater. 2014, 62, 141–155. [Google Scholar] [CrossRef]
  25. Zhang, Z.; Chen, D.L. Consideration of Orowan strengthening effect in particulate-reinforced metal matrix nanocomposites: A model for predicting their yield strength. Scr. Mater. 2006, 54, 1321–1326. [Google Scholar] [CrossRef]
  26. Chen, X.; Tao, J.; Yi, J.; Liu, Y.; Li, C.; Bao, R. Strengthening behavior of carbon nanotube-graphene hybrids in copper matrix composites. Mater. Sci. Eng. A 2018, 718, 427–436. [Google Scholar] [CrossRef]
  27. Tian, L.; Anderson, I.; Riedemann, T.; Russell, A. Modeling the electrical resistivity of deformation processed metal-metal composites. Acta Mater. 2014, 77, 151–161. [Google Scholar] [CrossRef]
  28. Gao, W.; Sammes, N.M. An Introduction to Electronic and Ionic Materials, 1st ed.; World Scientific: Singapore, 1999. [Google Scholar]
Figure 1. The yield strength-temperature relation (a) and the strength degradation rate-temperature relation (b) of the annealed commercially pure Al wires (CPAWs) and the annealed Al-Fe wires (AFWs).
Applsci 10 02234 g001
Figure 2. The yield strength and the electrical conductivity of the commercially pure Al wires (CPAWs) and the Al-Fe wires (AFWs).
Applsci 10 02234 g002
Figure 3. The radial microstructures observed by TEM of (a) the cold-drawn CPAW, (b) the CPAW annealed at 90 °C for 8 h, (c) the CPAW annealed at 250 °C for 8 h, (d,g) the cold-drawn AFW, (e,h) the AFW annealed at 200 °C for 8 h, (f,i) the AFW annealed at 250 °C for 8 h.
Applsci 10 02234 g003
Figure 4. The axial microstructures observed by TEM of (a) the cold-drawn CPAW, (b) the CPAW annealed at 90 °C for 8 h, (c) the CPAW annealed at 250 °C for 8 h, (d) the cold-drawn AFW, (e) the AFW annealed at 200 °C for 8 h, (f) the AFW annealed at 250 °C for 8 h.
Applsci 10 02234 g004
Figure 5. The radial orientation distribution maps of (a) the cold-drawn CPAW, (b) the CPAW annealed at 90 °C for 8 h, (c) the CPAW annealed at 250 °C for 8 h, (d) the cold-drawn AFW, (e) the AFW annealed at 200 °C for 8 h, (f) the AFW annealed at 250 °C for 8 h.
Applsci 10 02234 g005
Figure 6. The volume fraction of <111> texture and <001> texture in the cold-drawn CPAW, the annealed CPAWs, the cold-drawn AFW and the annealed AFWs.
Applsci 10 02234 g006
Figure 7. The axial orientation distribution maps of (a) the cold-drawn CPAW, (b) the CPAW annealed at 90 °C for 8 h, (c) the CPAW annealed at 250 °C for 8 h, (d) the cold-drawn AFW, (e) the AFW annealed at 200 °C for 8 h, (f) the AFW annealed at 250 °C for 8 h.
Applsci 10 02234 g007
Figure 8. Grain widths (a) and grain lengths (b) of the cold-drawn CPAW, the annealed CPAWs, the cold-drawn AFW and the annealed AFWs.
Applsci 10 02234 g008
Figure 9. The strengths induced by the grain strengthening, the precipitates and the texture of the cold-drawn CPAW, the annealed CPAWs, the cold-drawn AFW and the annealed AFWs.
Applsci 10 02234 g009
Table 1. Chemical composition of commercially pure Al wires (CPAW) and Al-Fe wire (AFW).
SampleFeCuSiAl
AFW1.130.20.03Bal.
CPAWImpurity ≤ 0.4>99.60

