Article

In Search for the Missing Nitrogen: Closing the Budget to Assess the Role of Denitrification in Agricultural Watersheds

Department of Life Sciences and Biotechnology, University of Ferrara, Via L. Borsari 46, 44121 Ferrara, Italy
*
Author to whom correspondence should be addressed.
Appl. Sci. 2020, 10(6), 2136; https://doi.org/10.3390/app10062136
Submission received: 19 February 2020 / Revised: 12 March 2020 / Accepted: 14 March 2020 / Published: 21 March 2020
(This article belongs to the Special Issue Denitrification in Agricultural Soils)

Abstract

:
Although representing a paramount mechanism against nitrogen excess in agricultural landscapes, soil denitrification is still a largely unknown term in nitrogen balances at the watershed scale. In the present work, a comprehensive investigation of nitrogen sources and sinks in agricultural soils and waters was performed with the aim of gaining insights into the relevance of soil denitrification in a highly farmed sub-basin of the Po River delta (Northern Italy). Agricultural statistics, water quality datasets, and results of laboratory experiments targeting nitrogen fluxes in soils were combined to set up a detailed nitrogen budget along the terrestrial–freshwater continuum. The soil nitrogen budget was not closed, with inputs exceeding outputs by 72 kg N·ha−1·year−1, highlighting a potential high risk of nitrate contamination. However, extensive monitoring showed a general scarcity of mineral nitrogen forms in both shallow aquifers and soils. The present study confirmed the importance of denitrification, representing ~37% of the total nitrogen inputs, as the leading process of nitrate removal in heavily fertilized fine-texture soils prone to waterlogged conditions.

Graphical Abstract

1. Introduction

Nitrogen (N) pollution is a still unsolved global environmental issue and with multiple implications in terms of water quality deterioration, biodiversity loss, human health problems, global carbon-cycle alterations, and climate change [1,2,3]. Reactive N sources from intensive agriculture are recognized as one of the most serious threats in industrialized and emerging countries, determining eutrophication and groundwater nitrate (NO3) contamination [4,5,6]. However, uncertainty remains on processes and paths, since about 75% (range 40–95%) of the N load generated within worldwide catchments is assessed not to be delivered to terminal waterbodies, via river export, but internally retained [7,8,9]. This high retention capacity may mask both permanent (i.e., denitrification in soils and aquatic environments) and temporary removal processes (i.e., storage in the vadose zone–groundwater system). Denitrification, the microbial-mediated reduction of NO3 to di-nitrogen gas (N2) under anaerobic conditions, is globally considered the primary biogeochemical process via which mineral N is returned to the atmosphere [10,11,12]. Whether N is denitrified and lost to atmosphere as N2 or accumulates in the vadose zone and in groundwater [13,14] makes a huge difference in an environmental perspective and from the point of view of policymakers and stakeholders. Thus, assessing the fate of missing N is a major scientific challenge for defining codes of good agricultural practices and implementing effective management strategies aimed at protecting water quality in human-impacted watersheds.
N surplus from fertilizations in intensive agricultural systems usually promote NO3 leaching and accumulation in groundwater, especially in lowland areas where surface runoff is minimal due to the flat topography. On the other hand, rainfall or irrigation events and poor drainage are expected to promote denitrification in fertilized fine-textured soils by decreasing redox conditions and triggering the creation of anaerobic microsites prone to anaerobic respiration pathways [15,16,17]. The interesting question is to evaluate the net effect of these two potentially opposite features in agricultural-dominated watersheds. Due to the complexity of field measurements, soil denitrification is rarely addressed as the main focus of research in watershed N budgets, and it is generally estimated as a residual term, i.e., the unaccounted complement of the N balance, with a great deal of uncertainty [10]. However, whereas N inputs, outputs, and storages can be accurately quantified by using high-resolution local datasets, mass balance approach may provide a reliable estimate of denitrification at the catchment scale and a benchmark value for field measurements.
The aim of the present work was to evaluate the relative importance of soil denitrification in buffering N excess at the watershed scale in a deltaic, intensively cultivated, and irrigated sub-basin of the Po River plain, the Po di Volano-Sacca di Goro. This basin was selected as a case study for the following reasons: (1) the homogeneous cropping system, i.e., maize and winter cereal rotation in about two-thirds of the agricultural lands developing in a completely flat territory; (2) the N fertilization supplied almost exclusively as synthetic urea and ammonium nitrate; (3) the capillary network of canals distributing irrigation water in the spring–summer period; (4) the extensive information available on hydrogeological and microbial drivers regulating N processing and transport in surface waters [18,19], soil water [20,21], and groundwater [22,23].
Agricultural statistics, water quality data, and locally derived measurements of several N fluxes and pools were combined to set up a comprehensive and detailed N budget along the terrestrial–freshwater continuum. N imported and exported across the arable land, N stored in the shallow aquifer, and N loads conveyed and removed from the canal network were quantified. N loss by denitrification in agro-ecosystems was determined from the difference between inputs and all other output terms and validated with multiple findings gathered from previous studies in the area.

2. Materials and Methods
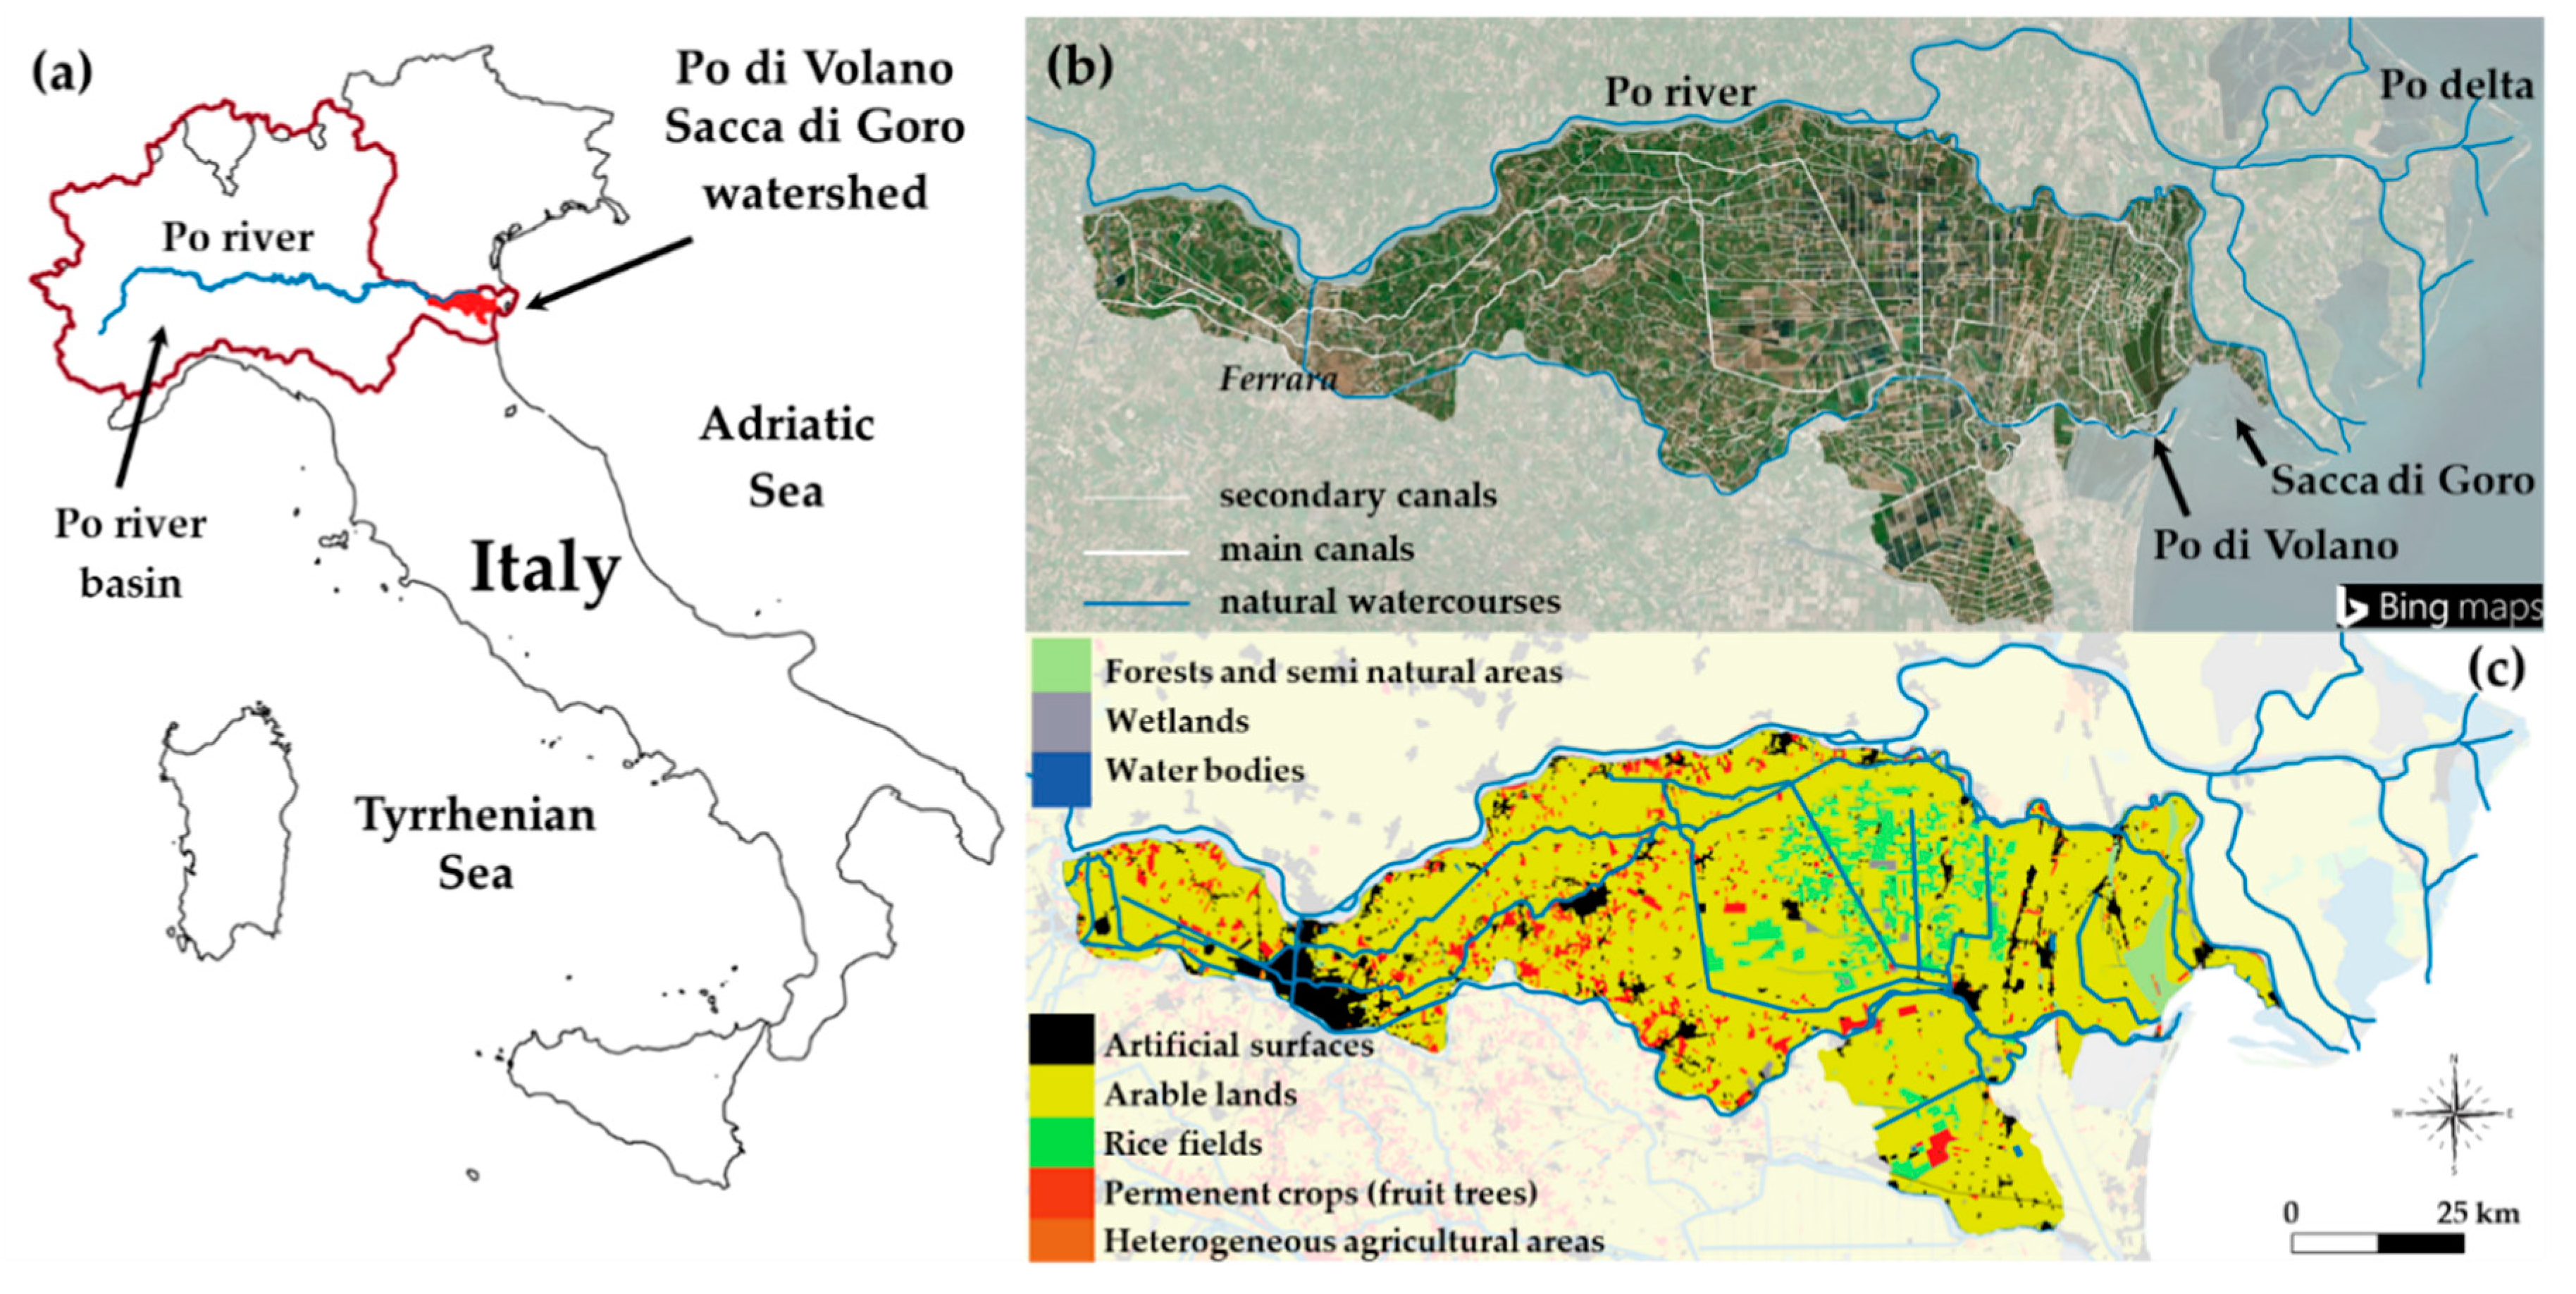
2.1. Study Area

The Po River catchment, the largest hydrographic system in Italy, covers about one-quarter of the national territory, and it is a strategic area for the national economy, accounting for ~40% of the Italian gross domestic product. The Po basin is one of the most densely populated and agriculturally exploited areas in Europe; thus, eutrophication and NO3 pollution of surface and groundwater are the most critical consequences in terms of water quality deterioration [24,25,26]. The Po di Volano-Sacca di Goro watershed (925 km2, Figure 1) is located in the terminal part of the Po basin, and it is a recently reclaimed deltaic territory included within the administrative borders of the Ferrara Province (Emilia-Romagna Region, Northeastern Italy). The basin covers an area extending from the city of Ferrara to the Adriatic Sea, and it is limited to the north by the Po River main course and to the south by the Po di Volano, an ancient branch of the Po River Delta, which is now an artificial canal that carries water to the Sacca di Goro Lagoon [27,28]. The climate is warm temperate (type Cfa, according to Köppen–Geiger classification) [29], with a mean wet deposition of ~600 mm·year−1 (late spring and autumn peaks), elevated humidity, low wind speed, minimum monthly mean air temperature of ~1 °C in January, and maximum monthly mean air temperature of ~25 °C in July [30]. From the late 1960s when the land reclamation was completed, the large availability of water for irrigation purposes and the completely flat topography of this territory favored the establishment of farming activity becoming increasingly mechanized, scarcely amended with livestock manure and almost exclusively subsidized with synthetic fertilizers, mostly in the form of urea and ammonium nitrate [31]. From the mid-1980s, the Sacca di Goro, a shallow eutrophic lagoon where the main economic activity is clam farming, suffered from summer anoxic crises and dystrophic outbreaks as a consequence of macroalgal blooms [30]. Under the European Nitrates Directive (91/676/EEC) and the European Water Framework Directive (2000/60/EC), the whole Po di Volano-Sacca di Goro watershed was designated as a nitrate-vulnerable zone from agricultural sources. Restrictions with regard to the timing and quantity of fertilizer application were put into practice in 2006 by the Water Protection Plan of Emilia-Romagna Region.
Agriculture is the dominant land use with ~80% of the watershed area classified as utilized agricultural land (UAA). Wheat is the main crop cultivated in the Po di Volano-Sacca di Goro watershed (29% of UAA), followed by maize (23%), industrial and horticultural crops (22%), rice (9%), fruit trees (8%), and feed crops (7%) (National Statistics Institution, Sixth Agricultural Census 2010; http://dati-censimentoagricoltura.istat.it). Artificial surfaces cover <10% of the watershed area (Emilia-Romagna land-use/land-cover database, 2008), and the urban planning scheme is spread with a relatively low population density concentrated in the city of Ferrara and other small towns.
Since this basin lies in a depressed area partially below the sea level, the system is automatically controlled by pumping stations and gates managed by the land reclamation authority, and the hydrological regime is artificially regulated by a dense network of canals serving for both drainage and irrigation. Irrigation water (40–50 × 106 m3·month−1 from April to September) is derived from the Po River through a series of mechanically controlled gates, and it feeds the surface water system formed by some west–east-oriented main canals and several smaller secondary canals, with an overall linear extension of 1780 km. Excess water is drained by the same canal network used for irrigation, delivered to the major collectors and for the most part discharged into the Po di Volano canal. From October to March, the canal network is kept empty and serves as flood control in case of intense rainfall.
Typical soils of the Po di Volano-Sacca di Goro watershed are Vertic Cambisols and Thionic Fulvisols and, following the World Reference Base for Soil Resources classification [32], the predominant soil textures are silty loam (45% of the watershed area), peat (24%), silty clay (18%), and sand (13%). According to the origin and texture of the soil matrix, organic matter content varies from <2% for silty loam to 28% for peat [33]. The shallow unconfined aquifer, whose thickness ranges between 2 and 7 m, is fed by rain infiltration and the surface water system; thus, the water table is usually very proximal to the ground surface [34].

2.2. N Budget in Agricultural Soils

The N budget in agricultural soils was estimated on an annual basis for five subsequent years (2006–2010) by integrating agricultural census data provided by local and national statistics authorities and experimental data (from both field monitoring activities and laboratory experiments) achieved in the framework of several national and international research projects performed in the study area during the last decade (Table 1). There is reason to believe that the N budget calculated for the five-year period 2006–2010 is relevant in the present day because, in the last decade, only minor variations occurred in crop areas and livestock densities in the Ferrara province and fertilization rates did not change appreciably. The adopted budgeting approach matches the methodology reported by de Vries and co-authors [35]. N inputs and outputs across the UAA of the Po di Volano-Sacca di Goro watershed were included in the following equation:
∆NSoil = (NMan + NFert + NFix + NDep_UAA) − (NHarv + NRunoff + NVol),
where NMan is N in livestock manure applied to the UAA, NFert is N in synthetic N fertilizers applied to UAA, NFix is N from biological fixation, NDep_UAA is atmospheric N deposition on the UAA, NHarv is N exported from the UAA by crop harvest, NRunoff is N lost in runoff water to surface waterbodies, and NVol is N lost to the atmosphere via ammonia (NH3) volatilization.
ΔN represents the sum of two terms, i.e., the N leaching to the shallow aquifer plus the N loss via denitrification along its way through the soil and the vadose zone. Due to difficulties in quantifying their relative magnitude at the watershed scale, the level of NO3 contamination in the unconfined aquifer was evaluated by taking into account the results from a two-year monitoring campaign in the study area. During 2010–2011, in the framework of an extensive monitoring of the whole Ferrara province, a network of 34 piezometers distributed throughout the agricultural soils of the Po di Volano-Sacca di Goro watershed was installed and sampled monthly to evaluate water table fluctuations and chemico-physical parameters of the shallow unconfined aquifer. Details about sampling sites and monitoring campaigns were reported by Mastrocicco and co-authors [36].
Along the investigated five-year period, the Po di Volano-Sacca di Goro watershed comprised 14 municipalities (area from <1 to 170 km2), totally or only partially included within the basin boundaries. N inputs and outputs were firstly calculated for each municipality, the smallest administrative unit at which agricultural and demographic statistics are usually available for the whole national territory. N budget terms at the municipality scale were corrected for the percentage of each municipality area included within the basin boundaries and then aggregated at the watershed level by geographic information system (GIS) analysis (QGIS software 2.18 https://www.qgis.org/it/site/). The area of each municipality included within the Po di Volano-Sacca di Goro watershed boundaries was calculated by clipping the shape-file of the Italian administrative boundaries (National Statistics Institution, 2010; https://www4.istat.it/it/archivio/24516) with the shape-file of the Po River sub-basins (geoportal of the Environmental Protection Agency of the Emilia-Romagna Region; https://www.arpae.it/dettaglio_generale.asp?id=1177&idlivello=1527). Budget calculations relied on simple equations converting agricultural census data into N fluxes, but the approach got its robustness from the use of high-spatial-resolution datasets, site-specific agronomic coefficients, and N cycling measurements gathered from the study area. Input, output, and the overall budget were expressed in units of mass per time (t N·year−1) and on a per-area basis, after normalization for the UAA (kg N·ha−1·yr−1).
N input from livestock manure (NMan) was calculated by means of (1) livestock density data (divided into eight major categories and 30 sub-categories according to type, age, and purpose), (2) live weight of each livestock category, and (3) N excretion rate of each livestock category corrected for the N amount volatilized as NH3 during animal housing and manure storage (DM 4 July 2006, decree of the Italian Ministry of Agricultural and Forest Policies about agronomic utilization disciplinary; Table S1, Supplementary Materials). Livestock data at the municipal level were acquired from the National Veterinary Information System of Livestock Registry and the National Statistics Institution (Table 1). Manure was assumed to be applied as fertilizer to agricultural land within the municipality where each farm was located.
N input from synthetic inorganic fertilizers (NFert) was calculated by means of (a) the surface of each crop category cultivated in the study area, and (b) local crop-specific fertilizer recommendations according to the soil types (Table S2, Supplementary Materials). Specific N application rates were retrieved from a detailed inventory conducted within the framework of the EC project EU-WATER (“Transnational integrated management of water resources in agriculture for the European WATER emergency control”, contract n. SEE/A/165/2.1/X). Municipal crop surfaces divided into the main soil types in which each crop category is cultivated were extracted from a high-resolution land-use map provided by the Agriculture Department of Ferrara Province (Table 1). Twenty crop categories were considered, accounting for more than 95% of the harvested surface in the whole basin.
N input from biological fixation (NFix) was calculated by means of (a) surface of each N-fixing crop type (alfalfa and soybean) and (b) areal rates of symbiotic N fixation. Rates of biological N fixation were estimated by multiplying the production per unit of surface (i.e., yield) by the N uptake coefficient of the harvested portions (Table S2, Supplementary Materials), corrected for a multiplicative factor expressing the ratio of total biomass produced to harvested biomass. According to Anglade and co-authors [37], values of 1.7 and 1.3 were used for alfalfa and soybean, respectively. Crop data, i.e., municipal surfaces and provincial yields for each crop type, were provided by the Agriculture Department of Ferrara Province.
Spatialized data on atmospheric N deposition on agricultural soils (NDep_UAA) were obtained by integrating annual wet deposition and average rainfall N content (inorganic oxidised N forms, i.e., nitrate plus nitrite, and organic N). Reduced inorganic N forms were not considered as they were already taken into account in the budget as local redeposited N after NH3 volatilization (see the following description of the budget item NVol). Indeed, deposition of reduced N likely reflects local recycling as NH3 is short-lived in the atmosphere [38]. For each year of the investigated period, rainfall data were recorded at seven weather stations homogeneously distributed across the watershed by the Hydro-Meteorological Service of the Environmental Protection Agency of the Emilia-Romagna Region (Table 1). N content of wet depositions was measured in 2008 on occasion of several relevant rainfall events (n = 51, rainfall intensity >3 mm), within the framework of the EC project EU-WATER. Four stations homogeneously distributed across the watershed and localized in agricultural areas representative of the four main soil types were sampled. As variability of rainfall N content among stations and sampling events was small, a constant average value of 0.5 mg N·L−1 was assigned to the average precipitation amount of each year within the study period (range 550–650 mm). The obtained areal rates of N deposition were in agreement with those adopted by the Italian Code of Good Agricultural Practices (DM 19 April 1999, decree of the Italian Ministry of Agricultural and Forest Policies) reporting a range of total N deposition in the Po River plain between 10 and 20 kg N·ha−1·year−1 with 45% on average in reduced inorganic N form.
N output from crop harvest (NHarv) was calculated by means of (a) surface of each crop type cultivated in the study area, (b) N uptake coefficient, and (c) yield of the harvested portion of each crop (Table S2, Supplementary Materials). For N-fixing crops, the N amount exported from agricultural land was assumed equal to that fixed in the above-ground biomass. As crop residues are usually left on the fields, N in crop residues was not accounted for as an output in the budget. Crop data, i.e., municipal surfaces and provincial yields for each crop type, were provided by the Agriculture Department of Ferrara Province, while crop N uptake coefficients were retrieved from a local inventory acquired within the framework of the Rural Development Program 2007–2013 of the Emilia-Romagna Region.
NRunoff to surface waters was estimated using the difference by computing a detailed N balance in the hydrological network of the Po di Volano-Sacca di Goro watershed, as described in Section 2.3.
N output from NH3 volatilization (NVol) of synthetic fertilizers was calculated by employing experimental data obtained in laboratory batch experiments [39]. Briefly, N loss via NH3 volatilization was measured after urea application on the four main soil types of the study area under the standard fertilization regime and simulating the in situ microclimate (i.e., wind speed, humidity, and air temperature). Total NH3 volatilization fluxes of 1.8%, 0.7%, 0.4%, and 0.2% of the average fertilization rate (240 kg N·ha−1) were obtained for sand, silty loam, peat and silty clay, respectively [39]. Due to low livestock density in the Po di Volano-Sacca di Goro watershed, measurements of N loss via NH3 volatilization following manure spreading are not available. After an exhaustive revision of the literature, volatilization factors of 13% and 33% were associated with spreading operations of chicken manure and other livestock manure [40,41,42], respectively. The employed volatilization factors were coherent to direct emission estimations performed in lowland areas of Northern Italy [38,43]. Due to the short NH3 life span in the atmosphere, a fraction of the volatilized N amount was considered redeposited within the area where it was emitted (60%) [41] and, as a consequence, only the remaining portion was treated as N output in the soil budget.

2.3. N Budget in the Hydrological Network

N inputs and outputs in the hydrological network of the Po di Volano-Sacca di Goro watershed were included in the following equation:
(NInflow + NUrb + NInd + NDep + NRunoff) = (NOutflow + NRem),
where NInflow is N load imported in the basin by the canal network, NUrb is N load from urban areas, NInd is N load from industrial areas, NDep is atmospheric deposition on surfaces other than agricultural soils, NRunoff is N lost in runoff water to surface waterbodies, NOutflow is N load exported from the basin by the canal network, and NRem is N removed by denitrification in the canal sediments.
N loads imported through the irrigation water (NInflow) and exported from the basin through the drainage water (NOutflow) were calculated combining discharge and N concentration datasets for the considered five-year period 2006–2010. Flow data were provided by the local water management authority (i.e., Consorzio di Bonifica Pianura di Ferrara) as daily and, in some cases, monthly volumes. Nitrogen species concentrations were measured at five stations (three for the inflow water and two for the outflow water, with frequency of sampling from monthly to fortnightly) located on the hydrological network of the Ferrara province and belonging to the official surface water monitoring network of the Emilia-Romagna Regional Agency for Environmental Protection (ARPAE). N loads were calculated by interpolating linearly the N species concentrations between two subsequent measurements [44,45]. This method was revealed to be suitable for nitrate load estimation in small lowland watercourses characterized by sudden changes in hydrological regime [31,46].
NRunoff from agricultural soils to surface waters was estimated using the difference after all the other budget items were quantified by combining statistics on human pressures and surface water quality datasets for the five-year period 2006–2010. N load generated from urban areas (NUrb) was calculated by multiplying the resident population of the municipalities included within the basin by the per capita production of 12.5 g N·day−1 [47] (Table 1). About 85% of the population is connected to wastewater treatment plants with a tertiary treatment for N removal via denitrification, reaching on average 75% of the incoming loads.
N load generated from industrial areas (NInd) was calculated by considering the number of workers in the different N-polluting industrial sectors and their specific N production coefficients [48]. Industrial N load was calculated as a mean of the years 2001 and 2011, the last years for which data on industrial activities were available at the municipality scale (Table 1). N input from atmospheric deposition on surfaces other than agricultural soils (NDep) was calculated by extending the areal rates of N deposition obtained as previously described in Section 2.2 to the total area of the basin with the exclusion of surfaces devoted to agriculture.
Soana and co-authors [49] previously estimated the current capacity to remove N via denitrification (NRem) of the whole canal network of the Po river lowland (18,500 km) by means of a detailed upscale of large datasets of field measurements. The contribution of the sole canal network belonging to the Po di Volano-Sacca di Goro (1780 km) was extracted by GIS analysis.

3. Results

The N budget in agricultural soils of the Po di Volano-Sacca di Goro watershed was not closed and it differed by less than 12% among the five years. N outputs (~8600 t N·year−1) amounted to ~63% of the N inputs (~13,600 t N·year−1), with a potential excess of ~5000 t N·year−1 (~37% of N inputs), equivalent to 72 kg N·ha−1·year−1 (Table 2). Only N input from livestock manure showed a constant decrease from 2006 to 2010 (overall ~15%), while, for all the other budget items, the variability from year to year was erratic and without a clear temporal trend. Synthetic fertilizers represented the major contribution to all the N imported to agricultural land, averaging at 72% of total N input at the basin level, followed by biological fixation (20%), while the remaining amount was almost equally divided between livestock manure and atmospheric deposition. The proportion among the N input terms at the watershed scale reflected a similar situation at the municipal level, with synthetic fertilizers being in absolute the biggest N source in all the considered municipalities (up to 180 kg N·ha−1·year−1), while biological fixation and livestock manure reached maximum values of 130 and 24 kg N·ha−1·year−1, respectively. Total N input in the municipalities of the studied area varied from 162 to 273 kg N·ha−1·year−1 with an average value of 194 kg N·ha−1·year−1 at the basin scale. N exported via crop harvest was the main output from agricultural soils among the three terms included in the budget, accounting for 95% of the sum of all items (Table 2). N lost to surface waters via runoff and N emitted to the atmosphere in the form of NH3 were comparable terms (municipal values peaking at 5 kg N·ha−1·year−1) but two orders of magnitude lower than the crop harvest (municipal values ranging from 108 to 160 kg N·ha−1·year−1). Three cereals, i.e., maize, wheat, and rice, accounted more than 65% of the total N removed in crop biomass from cultivated land. Total N output in the municipalities of the studied area varied from 110 to 163 kg N·ha−1·year−1 with an average value of 121 kg N·ha−1·year−1 at the basin scale.
Along the investigated five-year period, the water volumes entering into the canal network showed median NO3 concentrations of 1.70 and 2.80 mg N·L−1 in the irrigation and non-irrigation periods, respectively (Figure 2). Nitrate concentrations in water drained from the study basin were substantially lower with median values of 1.20 and 2.30 mg N·L−1 in the irrigation and non-irrigation periods, respectively. During the whole monitoring period, NO3 concentrations in the shallow aquifer were generally much lower than those measured in surface waters and similar between the irrigation and non-irrigation periods; median values never exceeded 0.1 mg N·L−1, and only in some transient occasions did NO3 concentrations peak at 4–5 mg N·L−1 (Figure 2). In all sites and sampling events, NO3 was constantly below the limit of 11.3 mg N·L−1, the maximum permissible concentration in drinking water according to the World Health Organization [50]. The concentrations were quite homogeneous at the watershed scale with only a few hot spots in correspondence to groundwater samples belonging to sandy soils.
The canal network imported ~420 t N annually, of which 88% occurred during the six-month period from April to September, when huge water volumes are withdrawn from the Po River to sustain irrigation practices. The annual N load exported to the Sacca di Goro lagoon accounted for ~740 t N, of which 66% occurred during the non-irrigation period (Figure 3). The study watershed hosts ~120,000 inhabitants and N loads from urban and industrial areas entering into the canal network were estimated at ~200 t N·year−1 and 67 t N·year−1, respectively. The greatest input term in the N budget of the hydrological network was the N load generated in upstream catchments and imported through the pumping stations. N loads from point sources (urban and industrial areas and atmospheric deposition on surfaces other than agricultural soils) accounted for <5% of the total inputs due to farming activity. N removal via denitrification in the canal network of the basin was estimated at ~390 t N·year−1 (Figure 3), of which ~75% occurred from April to September when canals were active for irrigation.

4. Discussion

The contribution of soil denitrification is rarely estimated experimentally, due to the difficulty of field measurements, which also makes it difficult to have enough spatial and temporal coverage to upscale the rates to the basin scale. It is also not accounted for indirectly, in N budgets at the basin scale, due to the difficulty in accounting for all the terms of the budget except denitrification. This is why the outcomes of the present work introduce some elements of novelty in the study of N dynamics in agricultural-dominated landscapes. The detailed N mass balance, performed both in the basin and in the hydrological network of the Po di Volano-Sacca di Goro watershed, and facilitated by the high homogeneity of the territory, of crops, and by the artificial regulation of the canal network, allowed isolating and estimating the relevance of soil denitrification.
In this basin, livestock densities are low, and cereals are the dominant crops, amended almost exclusively with synthetic fertilizers. NUE (nitrogen use efficiency), i.e., the proportion of all N inputs exported via crop harvest, reached ~60%, a value markedly higher than those calculated for other sub-basins of the Po river system characterized by higher availability of livestock manure and greater amounts of applied N that are potentially lost via leaching or runoff [25,51,52]. Synthetic fertilizers are more easily dosed and allow more accurately fulfilling crops’ N requirements without generating large excesses and losses in the environment. However, on the other hand, their use implies a rapid dissolution of highly soluble N forms, such as NO3, with increased risk of lateral or vertical transport. Since the investigated watershed is a recently reclaimed lowland, completely flat and with a slope mostly less than 0.05% [53], the proportion of soil N excess flowing into the canal network by surface runoff is a minor component of the N budget. On the contrary, groundwater NO3 pollution may be relevant, via vertical transport trough the vadose zone.
In lowland areas, the coexistence of intensive agricultural activities and a shallow water table further stresses the need for detailed investigations into the role of soil denitrification in attenuating NO3 pollution. The specific knowledge of key factors governing N transport and transformation pathways in agricultural areas are not yet fully clarified. Several studies highlighted that, in agricultural irrigated watersheds, the generation of large N loadings does not necessarily translate into high exports to terminal waterbodies or coastal zones [9,31,52], and they demonstrated the relevance of small human-made waterways as elective sites for N processing and removal [19,49,54]. In the investigated basin, N removal via denitrification within the canal network represents only a small flux in the whole N budget on annual basis. Although specific studies, performed in vegetated canals of the same basin, demonstrated that emergent vegetation increases circa 10-fold the denitrification capacity of the same canals deprived of vegetation, stands of Phragmites australis and Typha latifolia are maintained, at present, only in <5% of the total network length and are subjected to mowing at the beginning of the summer to preserve hydraulic performance [18,19,29]. On an annual basis, the watershed exports to the coastal zone nearly 77% more than the N load entering in the hydrological network from the Po river and basins located upstream. However, this amount (~320 t N·year−1), generated within the basin, is one order of magnitude lower than the missing N (~5000 t N·year−1) resulting from the calculation of the N soil budget. This N budget is conservative, since it does not account for sedimentary N export in drained peatlands, where a large N pool (mainly as ammonium) is accumulated [55] and surely contributes to the surface water N load. The outcome of the extensive monitoring campaign of the shallow aquifer, performed at the scale of the entire watershed, showed that no severe contamination by NO3 is present, with the exception of a few hot spots where concentrations peak at 4–6 mg N·L−1 on some transient occasions, in correspondence to sandy permeable soils, belonging to the coastal paleo-dunes and to the Po River paleo-channels. The very low NO3 concentrations support the evidence that no actual downward vertical N migration takes place and that effective microbial processes, faster compared to groundwater fluxes, buffer the excess NO3, preventing its accumulation in the shallow aquifer except in paleochannels. Nitrogen reactive forms were generally scarce, not only in waters, as here reported, but also in surficial soils, where only NO3 was found in the amount of 10–35 kg·ha−1·year−1, as demonstrated by repeated analytical campaigns [31,56]. Multiple findings reported in the present study exclude the relevance of accumulation in groundwater and in soils. About 37% of the N input is not accounted for in the considered N outputs from agricultural soils of the Po di Volano-Sacca di Goro basin. Thus, the fate of this missing N is driven by soil denitrification (i.e., the average unaccounted term of 72 kg N·ha−1·year−1 in the soil N budget), which is likely the leading process responsible for N excess attenuation. Denitrification occurs when three conditions are simultaneously fulfilled, i.e., hypoxia/anoxia, availability of NO3, and availability of an electron donor or an energy source for the heterotrophic denitrifying bacteria, mostly labile organic carbon [57,58]. In temperate regions, agricultural soils remain generally wet from the late autumn to the early spring and they are occasionally completely saturated after heavy rainfall events, in cases where the water table is proximal to the ground surface as in the lowland deltaic area of the Po river system. By affecting redox status, soil water content is considered a key driver for N removal via denitrification and the chance for creating anoxic microsites is higher in soils with low porosity (clayey and loamy soil) and greater water retention than in more permeable coarsely textured soils [17,59]. Thus, denitrification may be boosted in the soils of the studied basin, characterized by the fine texture, low hydraulic conductivity, flat topography, and shallow water table [22,34]. This is consistent with the outcomes of previous laboratory experiments demonstrating high NO3 consumption and correspondent N2 production in soil mesocosms under saturated conditions [21]. Moreover, pyrite oxidation could contribute to remove excess NO3 in reducing environments lacking organic carbon substrates [60].
In conclusion, the present study confirms the importance of denitrification, representing more than one-third of the total N inputs, as a crucial N sink in heavily fertilized fine-texture soils, prone to waterlogged conditions as a consequence of rainfall. The outcomes of black-box studies highlighting efficient N retention in agricultural watersheds support the need for spatially and temporally resolved measurements of denitrification to accurately take into account this process in explaining the fate of missing N. More work is required to perform denitrification estimates at spatial and temporal scales relevant to N pollution, suitable to be included in catchment modeling and management, especially in vulnerable areas to NO3.

Supplementary Materials

The following are available online at https://www.mdpi.com/2076-3417/10/6/2136/s1, Table S1: Livestock categories, live weights, and N excretion rates; Table S2: N fertilization, yield, and N uptake coefficient of the harvested portions of the main crops cultivated in the Po di Volano-Sacca di Goro watershed.

Author Contributions

Conceptualization, G.C. and E.S.; methodology, G.C. and E.S.; investigation, G.C. and F.V.; formal analysis, E.S.; writing—original draft preparation, E.S.; writing—review and editing, G.C.; visualization, E.S.; funding acquisition, G.C. and E.A.F. All authors read and agreed to the published version of the manuscript.

Funding

This research was funded by the Emilia-Romagna Region within the Rural Development Program (PSR) 2014–2020 (Measure 16.1.01—Operational Groups of the European Partnership for Agricultural Productivity and Sustainability), Project Ferrara Nitrates-Agricultural techniques to prevent nitrates pollution and for the organic matter conservation (https://ec.europa.eu/eip/agriculture/en/find-connect/projects/nitrati-ferrara-tecniche-agronomiche-la).

Acknowledgments

The authors thank the President, Luigi Fenati, and the Director, Marco Rivaroli, of the Navarra Foundation for Agriculture of Ferrara, for the long lasting and profitable collaboration. They also thank the President, Franco Dalle Vacche, and the Director, Eng. Mauro Monti, of the local water management authority (Consorzio di Bonifica Pianura di Ferrara) and the Emilia-Romagna Agency for Environmental Protection for the kind and profitable collaboration, and for having provided water flows data and water quality data, respectively.

Conflicts of Interest

The authors declare no conflicts of interest.

References

  1. Townsend, A.R.; Howarth, R.W.; Bazzaz, F.A.; Booth, M.S.; Cleveland, C.C.; Collinge, S.K.; Dobson, A.P.; Epstein, P.R.; Holland, E.A.; Keeney, D.R.; et al. Human health effects of a changing global nitrogen cycle. Front. Ecol. Environ. 2003, 1, 240–246. [Google Scholar] [CrossRef]
  2. Erisman, J.W.; Galloway, J.; Seitzinger, S.; Bleeker, A.; Butterbach-Bahl, K. Reactive nitrogen in the environment and its effect on climate change. Curr. Opin. Environ. Sustain. 2011, 3, 281–290. [Google Scholar] [CrossRef] [Green Version]
  3. Houlton, B.Z.; Almaraz, M.; Aneja, V.; Austin, A.T.; Bai, E.; Cassman, K.G.; Gassman, J.E.; Compton, E.A.; Davidson, J.W.E.; James, N.G.; et al. A world of cobenefits: Solving the global nitrogen challenge. Earth’s Future 2019, 7, 865–872. [Google Scholar] [CrossRef] [PubMed] [Green Version]
  4. Glibert, P.M.; Harrison, J.; Heil, C.; Seitzinger, S. Escalating worldwide use of urea—A global change contributing to coastal eutrophication. Biogeochemistry 2006, 77, 441–463. [Google Scholar] [CrossRef]
  5. Rivett, M.O.; Buss, S.R.; Morgan, P.; Smith, J.W.; Bemment, C.D. Nitrate attenuation in groundwater: A review of biogeochemical controlling processes. Water Res. 2008, 42, 4215–4232. [Google Scholar] [CrossRef]
  6. Leip, A.; Billen, G.; Garnier, J.; Grizzetti, B.; Lassaletta, L.; Reis, S.; Simpson, D.; Sutton, M.A.; de Vries, W.; Weiss, F.; et al. Impacts of European livestock production: Nitrogen, sulphur, phosphorus and greenhouse gas emissions, land-use, water eutrophication and biodiversity. Environ. Res. Lett. 2015, 10, 115004. [Google Scholar] [CrossRef]
  7. Howarth, R.; Swaney, D.; Billen, G.; Garnier, J.; Hong, B.; Humborg, C.; Johnes, P.; Morth, C.-M.; Marino, R. Nitrogen fluxes from the landscape are controlled by net anthropogenic nitrogen inputs and by climate. Front. Ecol. Environ. 2012, 10, 37–43. [Google Scholar] [CrossRef] [Green Version]
  8. Goyette, J.O.; Bennett, E.M.; Howarth, R.W.; Maranger, R. Changes in anthropogenic nitrogen and phosphorus inputs to the St. Lawrence sub-basin over 110 years and impacts on riverine export. Glob. Biogeochem. Cycles 2016, 30, 1000–1014. [Google Scholar] [CrossRef] [Green Version]
  9. Romero, E.; Garnier, J.; Billen, G.; Peters, F.; Lassaletta, L. Water management practices exacerbate nitrogen retention in Mediterranean catchments. Sci. Total Environ. 2016, 573, 420–432. [Google Scholar] [CrossRef] [Green Version]
  10. Seitzinger, S.; Harrison, J.A.; Böhlke, J.K.; Bouwman, A.F.; Lowrance, R.; Peterson, B.; Tobias, C.; Drecht, G.V. Denitrification across landscapes and waterscapes: A synthesis. Ecol. Appl. 2006, 16, 2064–2090. [Google Scholar] [CrossRef] [Green Version]
  11. Kulkarni, M.V.; Groffman, P.M.; Yavitt, J.B. Solving the global nitrogen problem: it’s a gas. Front. Ecol. Environ. 2008, 6, 199–206. [Google Scholar] [CrossRef]
  12. Wang, C.; Houlton, B.Z.; Dai, W.; Bai, E. Growth in the global N2 sink attributed to N fertilizer inputs over 1860 to 2000. Sci. Total Environ. 2017, 574, 1044–1053. [Google Scholar] [CrossRef] [PubMed]
  13. Ascott, M.J.; Gooddy, D.C.; Wang, L.; Stuart, M.E.; Lewis, M.A.; Ward, R.S.; Binley, A.M. Global patterns of nitrate storage in the vadose zone. Nat. Commun. 2017, 8, 1416. [Google Scholar] [CrossRef] [PubMed]
  14. Almaraz, M.; Wong, M.Y.; Yang, W.H. Looking back to look ahead: A vision for soil denitrification research. Ecology 2019, 101, e02917. [Google Scholar] [CrossRef] [PubMed] [Green Version]
  15. Hofstra, N.; Bouwman, A.F. Denitrification in agricultural soils: Summarizing published data and estimating global annual rates. Nutr. Cycl. Agroecosyst. 2005, 72, 267–278. [Google Scholar] [CrossRef]
  16. Törnqvist, R.; Jarsjö, J.; Thorslund, J.; Rao, P.S.C.; Basu, N.B.; Destouni, G. Mechanisms of basin-scale nitrogen load reductions under intensified irrigated agriculture. PLoS ONE 2015, 10, e0120015. [Google Scholar] [CrossRef] [Green Version]
  17. Barakat, M.; Cheviron, B.; Angulo-Jaramillo, R. Influence of the irrigation technique and strategies on the nitrogen cycle and budget: A review. Agric. Water Manag. 2016, 178, 225–238. [Google Scholar] [CrossRef]
  18. Pierobon, E.; Castaldelli, G.; Mantovani, S.; Vincenzi, F.; Fano, E.A. Nitrogen removal in vegetated and unvegetated drainage ditches impacted by diffuse and point sources of pollution. CLEAN–Soil Air Water 2013, 41, 24–31. [Google Scholar] [CrossRef]
  19. Castaldelli, G.; Soana, E.; Racchetti, E.; Vincenzi, F.; Fano, E.A.; Bartoli, M. Vegetated canals mitigate nitrogen surplus in agricultural watersheds. Agric. Ecosyst. Environ. 2015, 212, 253–262. [Google Scholar] [CrossRef]
  20. Castaldelli, G.; Colombani, N.; Vincenzi, F.; Mastrocicco, M. Linking dissolved organic carbon, acetate and denitrification in agricultural soils. Environ. Earth Sci. 2013, 68, 939–945. [Google Scholar] [CrossRef]
  21. Castaldelli, G.; Colombani, N.; Soana, E.; Vincenzi, F.; Fano, E.A.; Mastrocicco, M. Reactive nitrogen losses via denitrification assessed in saturated agricultural soils. Geoderma 2019, 337, 91–98. [Google Scholar] [CrossRef]
  22. Mastrocicco, M.; Colombani, N.; Castaldelli, G.; Jovanovic, N. Monitoring and modeling nitrate persistence in a shallow aquifer. Water Air Soil Pollut. 2011, 217, 83–93. [Google Scholar] [CrossRef]
  23. Colombani, N.; Mastrocicco, M.; Castaldelli, G.; Aravena, R. Contrasting biogeochemical processes revealed by stable isotopes of H2O, N, C and S in shallow aquifers underlying agricultural lowlands. Sci. Total Environ. 2019, 691, 1282–1296. [Google Scholar] [CrossRef]
  24. Martinelli, G.; Dadomo, A.; De Luca, D.A.; Mazzola, M.; Lasagna, M.; Pennisi, M.; Sacchi, E.; Saccon, P. Nitrate sources, accumulation and reduction in groundwater from Northern Italy: Insights provided by a nitrate and boron isotopic database. Appl. Geochem. 2018, 91, 23–35. [Google Scholar] [CrossRef]
  25. Viaroli, P.; Soana, E.; Pecora, S.; Laini, A.; Naldi, M.; Fano, E.A.; Nizzoli, D. Space and time variations of watershed N and P budgets and their relationships with reactive N and P loadings in a heavily impacted river basin (Po river, Northern Italy). Sci. Total Environ. 2018, 639, 1574–1587. [Google Scholar] [CrossRef]
  26. Malagó, A.; Bouraoui, F.; Pastori, M.; Gelati, E. Modelling Nitrate Reduction Strategies from Diffuse Sources in the Po River Basin. Water 2019, 11, 1030. [Google Scholar] [CrossRef] [Green Version]
  27. Cencini, C. Physical processes and human activities in the evolution of the Po delta, Italy. J. Coast. Res. 1998, 14, 774–793. [Google Scholar]
  28. Mikhailova, M.V. The hydrological regime and the peculiarities of formation of the Po river delta. Water Resour. 2002, 29, 370–380. [Google Scholar] [CrossRef]
  29. Peel, M.C.; Finlayson, B.L.; McMahon, T.A. Updated world map of the Köppen-Geiger climate classification. Hydrol. Earth Syst. Sci. Discuss. 2007, 4, 439–473. [Google Scholar] [CrossRef] [Green Version]
  30. Viaroli, P.; Giordani, G.; Bartoli, M.; Naldi, M.; Azzoni, R.; Nizzoli, D.; Ferrari, I.; Zaldívar Comenges, J.M.; Bencivelli, S.; Castaldelli, G.; et al. The Sacca di Goro lagoon and an arm of the Po River. In Estuaries. The Handbook of Environmental Chemistry; Wangersky, P.J., Ed.; Springer: Berlin/Heidelberg, Germany, 2006; Volume 5H, pp. 197–232. [Google Scholar]
  31. Castaldelli, G.; Soana, E.; Racchetti, E.; Pierobon, E.; Mastrocicco, M.; Tesini, E.; Fano, E.A.; Bartoli, M. Nitrogen budget in a lowland coastal area within the Po river basin (Northern Italy): Multiple evidences of equilibrium between sources and internal sinks. Environ. Manag. 2013, 52, 567–580. [Google Scholar] [CrossRef]
  32. IUSS Working Group WRB. World Reference Base for Soil Resources. In World Soil Resources Reports; FAO: Rome, Italy, 2006; p. 103. [Google Scholar]
  33. Mastrocicco, M.; Colombani, N.; Salemi, E.; Castaldelli, G. Numerical assessment of effective evapotranspiration from maize plots to estimate groundwater recharge in lowlands. Agric. Water Manag. 2010, 97, 1389–1398. [Google Scholar] [CrossRef]
  34. Mastrocicco, M.; Colombani, N.; Salemi, E.; Castaldelli, G. Reactive modeling of denitrification in soils with natural and depleted organic matter. Water Air Soil Pollut. 2011, 222, 205–215. [Google Scholar] [CrossRef]
  35. de Vries, W.; Leip, A.; Reinds, G.J.; Kros, J.; Lesschen, J.P.; Bouwman, A.F. Comparison of land nitrogen budgets for European agriculture by various modeling approaches. Environ. Pollut. 2011, 159, 3254–3268. [Google Scholar] [CrossRef] [PubMed]
  36. Mastrocicco, M.; Di Giuseppe, D.; Vincenzi, F.; Colombani, N.; Castaldelli, G. Chlorate origin and fate in shallow groundwater below agricultural landscapes. Environ. Pollut. 2017, 231, 1453–1462. [Google Scholar] [CrossRef] [PubMed]
  37. Anglade, J.; Billen, G.; Garnier, J.; Makridis, T.; Puech, T.; Tittel, C. Nitrogen soil surface balance of organic vs conventional cash crop farming in the Seine watershed. Agric. Syst. 2015, 139, 82–92. [Google Scholar] [CrossRef]
  38. Minoli, S.; Acutis, M.; Carozzi, M. NH3 emissions from land application of manures and N-fertilisers: A review of the Italian literature. Ital. J. Agron. 2015, 3, 5–24. [Google Scholar]
  39. Castaldelli, G.; Colombani, N.; Tamburini, E.; Vincenzi, F.; Mastrocicco, M. Soil type and microclimatic conditions as drivers of urea transformation kinetics in maize plots. Catena 2018, 166, 200–208. [Google Scholar] [CrossRef]
  40. Schilke-Gartley, K.L.; Sims, J.T. Ammonia volatilization from poultry manure-amended soil. Biol. Fertil. Soils 1993, 16, 5–10. [Google Scholar] [CrossRef]
  41. Asman, W.A. Factors influencing local dry deposition of gases with special reference to ammonia. Atmos. Environ. 1998, 32, 415–421. [Google Scholar] [CrossRef]
  42. Bussink, D.W.; Oenema, O. Ammonia volatilization from dairy farming systems in temperate areas: A review. Nutr. Cycl. Agroecosyst. 1998, 51, 19–33. [Google Scholar] [CrossRef]
  43. Arcara, P.G.; Gamba, C.; Bidini, D.; Marchetti, R. The effect of urea and pig slurry fertilization on denitrification, direct nitrous oxide emission, volatile fatty acids, water-soluble carbon and anthrone-reactive carbon in maize-cropped soil from the Po plain (Modena, Italy). Biol. Fertil. Soils 1999, 29, 270–276. [Google Scholar] [CrossRef]
  44. Kronvang, B.; Bruhn, A.J. Choice of sampling strategy and estimation method for calculating nitrogen and phosphorus transport in small lowland streams. Hydrol. Process. 1996, 10, 1483–1501. [Google Scholar] [CrossRef]
  45. Letcher, R.A.; Jakeman, A.J.; Calfas, M.; Linforth, S.; Baginska, B.; Lawrence, I. A comparison of catchment water quality models and direct estimation techniques. Environ. Model. Softw. 2002, 17, 77–85. [Google Scholar] [CrossRef]
  46. Chu, Y.; Salles, C.; Cernesson, F.; Perrin, J.L.; Tournoud, M.G. Nutrient load modelling during floods in intermittent rivers: An operational approach. Environ. Modell. Softw. 2008, 23, 768–781. [Google Scholar] [CrossRef]
  47. Provini, A.; Galassi, S.; Marchetti, R. Città Studi Edizioni, Torino. Appl. Ecol. 1998, 1216. (In Italian) [Google Scholar]
  48. Pagnotta, R.; Barbiero, G. Assessment of pollutants load in the coastal environment. Annali ISS 2003, 39, 3–10. (In Italian) [Google Scholar]
  49. Soana, E.; Bartoli, M.; Milardi, M.; Fano, E.A.; Castaldelli, G. An ounce of prevention is worth a pound of cure: Managing macrophytes for nitrate mitigation in irrigated agricultural watersheds. Sci. Total Environ. 2019, 647, 301–312. [Google Scholar] [CrossRef]
  50. World Health Organization—WHO. Guidelines for Drinking Water Quality, 3rd ed.; IWA Publishing: London, UK, 2004. [Google Scholar]
  51. Bartoli, M.; Racchetti, E.; Delconte, C.A.; Sacchi, E.; Soana, E.; Laini, A.; Longhi, D.; Viaroli, P. Nitrogen balance and fate in a heavily impacted watershed (Oglio River, Northern Italy): In quest of the missing sources and sinks. Biogeosciences 2012, 9, 361–373. [Google Scholar] [CrossRef] [Green Version]
  52. Pinardi, M.; Soana, E.; Laini, A.; Bresciani, M.; Bartoli, M. Soil system budgets of N, Si and P in an agricultural irrigated watershed: Surplus, differential export and underlying mechanisms. Biogeochemistry 2018, 140, 175–197. [Google Scholar] [CrossRef]
  53. Aschonitis, V.G.; Salemi, E.; Colombani, N.; Castaldelli, G.; Mastrocicco, M. Formulation of indices to describe intrinsic nitrogen transformation rates for the implementation of best management practices in agricultural lands. Water Air Soil Pollut. 2013, 224, 1489. [Google Scholar] [CrossRef]
  54. Goeller, B.C.; Febria, C.M.; McKergow, L.A.; Harding, J.S.; Matheson, F.E.; Tanner, C.C.; McIntosh, A.R. Combining tools from edge-of-field to in-stream to attenuate reactive nitrogen along small agricultural waterways. Water 2020, 12, 383. [Google Scholar] [CrossRef] [Green Version]
  55. Mastrocicco, M.; Giambastiani, B.M.S.; Colombani, N. Ammonium occurrence in a salinized lowland coastal aquifer (Ferrara, Italy). Hydrol. Process. 2013, 27, 3495–3501. [Google Scholar] [CrossRef]
  56. Mastrocicco, M.; Colombani, N.; Vincenzi, F.; Castaldelli, G. Complex interactions between fertilizers and subsoils triggering reactive nitrogen speciation in lowlands. CAJG 2018. Advances in Science, Technology & Innovation (IEREK Interdisciplinary Series for Sustainable Development). In Advances in Sustainable and Environmental Hydrology, Hydrogeology, Hydrochemistry and Water Resources; Chaminé, H., Barbieri, M., Kisi, O., Chen, M., Merkel, B., Eds.; Springer: Cham, Germany, 2019; pp. 133–135. [Google Scholar] [CrossRef]
  57. Tiedje, J.M. Ecology of Denitrification and Dissimilatory Nitrate Reduction to Ammonium. In Biology of Anaerobic Microorganisms; Zehnder, A.J.B., Ed.; Wiley and Sons: New York, NY, USA, 1988; pp. 179–244. [Google Scholar]
  58. Wallenstein, M.D.; Myrold, D.D.; Firestone, M.; Voytek, M. Environmental controls on denitrifying communities and denitrification rates: Insights from molecular methods. Ecol. Appl. 2006, 16, 2143–2152. [Google Scholar] [CrossRef]
  59. Barton, L.; McLay, C.D.A.; Schipper, L.A.; Smith, C.T. Annual denitrification rates in agricultural and forest soils: A review. Soil Res. 1999, 37, 1073–1094. [Google Scholar] [CrossRef]
  60. Jessen, S.; Postma, D.; Thorling, L.; Müller, S.; Leskelä, J.; Engesgaard, P. Decadal variations in groundwater quality: A legacy from nitrate leaching and denitrification by pyrite in a sandy aquifer. Water Resour. Res. 2017, 53, 184–198. [Google Scholar] [CrossRef]
Figure 1. Study area: (a) location of the Po di Volano-Sacca di Goro watershed in Italy, (b) hydrographic network, and (c) map of land use/land cover (source of vector data: Emilia-Romagna Region geoportal, http://geoportale.regione.emilia-romagna.it/it; on-line Bing™ Aerial map background, Baselayer for QGIS, www.bing.com/maps).
Applsci 10 02136 g001
Figure 2. Nitrate concentrations in water imported and exported by the canal network and in the shallow aquifer of the Po di Volano-Sacca di Goro watershed. The central horizontal line in the box is the median, the top and bottom boxes are the 25th and 75th percentiles, and the whiskers are the 10th and 90th percentiles. Outliers are shown as open circles.
Applsci 10 02136 g002
Figure 3. Schematic showing the N fluxes in the soil–water system of the Po di Volano-Sacca di Goro watershed. N input to agricultural soils: livestock manure (NMan), synthetic fertilizers (NFert), biological fixation (NFix), and atmospheric deposition (NDep_UAA). N output from agricultural soils: crop harvest (NHarv), ammonia volatilization (NVol), leaching to the shallow unconfined aquifer (NAqu), N lost in runoff water (NRunoff), and denitrification (NDen). N input to the canal network: N load imported by the canal network (NInflow), atmospheric N deposition on surfaces other than agricultural soils (NDep), N load from urban areas (NUrb), N load from industrial areas (NInd), and NRunoff. N output from the canal network: N load exported from the basin (NOutflow) and N removed by denitrification in the canal sediments (NRem). All terms are expressed in t N·year−1 (standard deviation is reported in brackets). NInflow and NOutflow are also reported by splitting the contribution of the irrigation period (from April to September) and the non-irrigation period (from October to March).
Applsci 10 02136 g003
Table 1. Sources of statistical data and coefficients used for the calculations of N budget in agricultural soils and waters of the Po di Volano-Sacca di Goro watershed.
Budget ItemData Type Sources
Livestock manure (NMan)Livestock density National Veterinary Information System of Livestock Registry (Annual Statistics, 2006–2009; https://www.vetinfo.it/j6_statistiche/#/), National Statistics Institution (6th Agricultural Census, 2010; http://dati-censimentoagricoltura.istat.it)
Animal live weights of N excretion ratesDM 07/04/2006, decree of the Italian Ministry of Agricultural and Forest Policies about agronomic utilization disciplinary
Synthetic fertilizers (NFert)Crop-specific fertilizer recommendationsEU-WATER project http://www.eu-water.eu/
Utilized agricultural area by crop categoriesAgriculture Department of Ferrara Province
Biological N fixation (NFix)Utilized agricultural area by crop categoriesAgriculture Department of Ferrara Province
Crop yields, N uptake coefficientsAgriculture Department of Ferrara Province, Rural Development Program 2007–2013 of the Emilia-Romagna Region
Atmospheric deposition (NDep_UAA, NDep)Rainfall dataHydro-Meteorological Service of the Environmental Protection Agency of the Emilia-Romagna Region (ARPA-SIMC meteorological databases 2006–2010; https://simc.arpae.it/dext3r/)
Rainfall N contentEU-WATER project (http://www.eu-water.eu/)
Utilized agricultural area, total basin areaAgriculture Department of Ferrara Province
Crop harvest (NHarv)Utilized agricultural area by crop categoriesAgriculture Department of Ferrara Province
Crop yields, N uptake coefficientsAgriculture Department of Ferrara Province, Rural Development Program 2007–2013 of the Emilia-Romagna Region
Ammonia volatilization (NVol)Loss of the N supplied by synthetic fertilizersExperimental data for the study area from Reference [39]
Loss of the N supplied by livestock manureLiterature data from References [38,40,41,42,43]
N load imported and exported by the canal network (NInflow, NOutflow)Flow dataConsorzio di Bonifica Pianura di Ferrara
N concentration dataEmilia-Romagna Regional Agency for Environmental Protection (https://www.arpae.it/index.asp?idlivello=112)
N load from urban areas (NUrb)Resident populationNational Statistics Institution (Annual Statistics, 2006–2010; http://demo.istat.it/)
N production coefficientLiterature data from Reference [47]
N load from industrial areas (NInd)Number of workers in N polluting industrial sectorsNational Statistics Institution (8th and 9th Industrial Census, 2001 and 2011; http://dati.istat.it)/
N production coefficientsLiterature data from Reference [48]
N removed by denitrification in the canal sediments (NRem)Denitrification rates in vegetated and unvegetated canalsExperimental data for the study area from Reference [49]
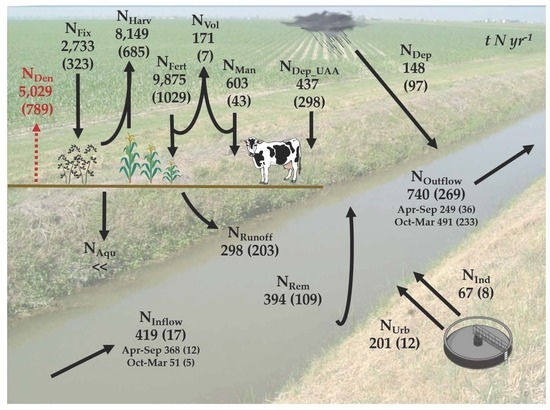
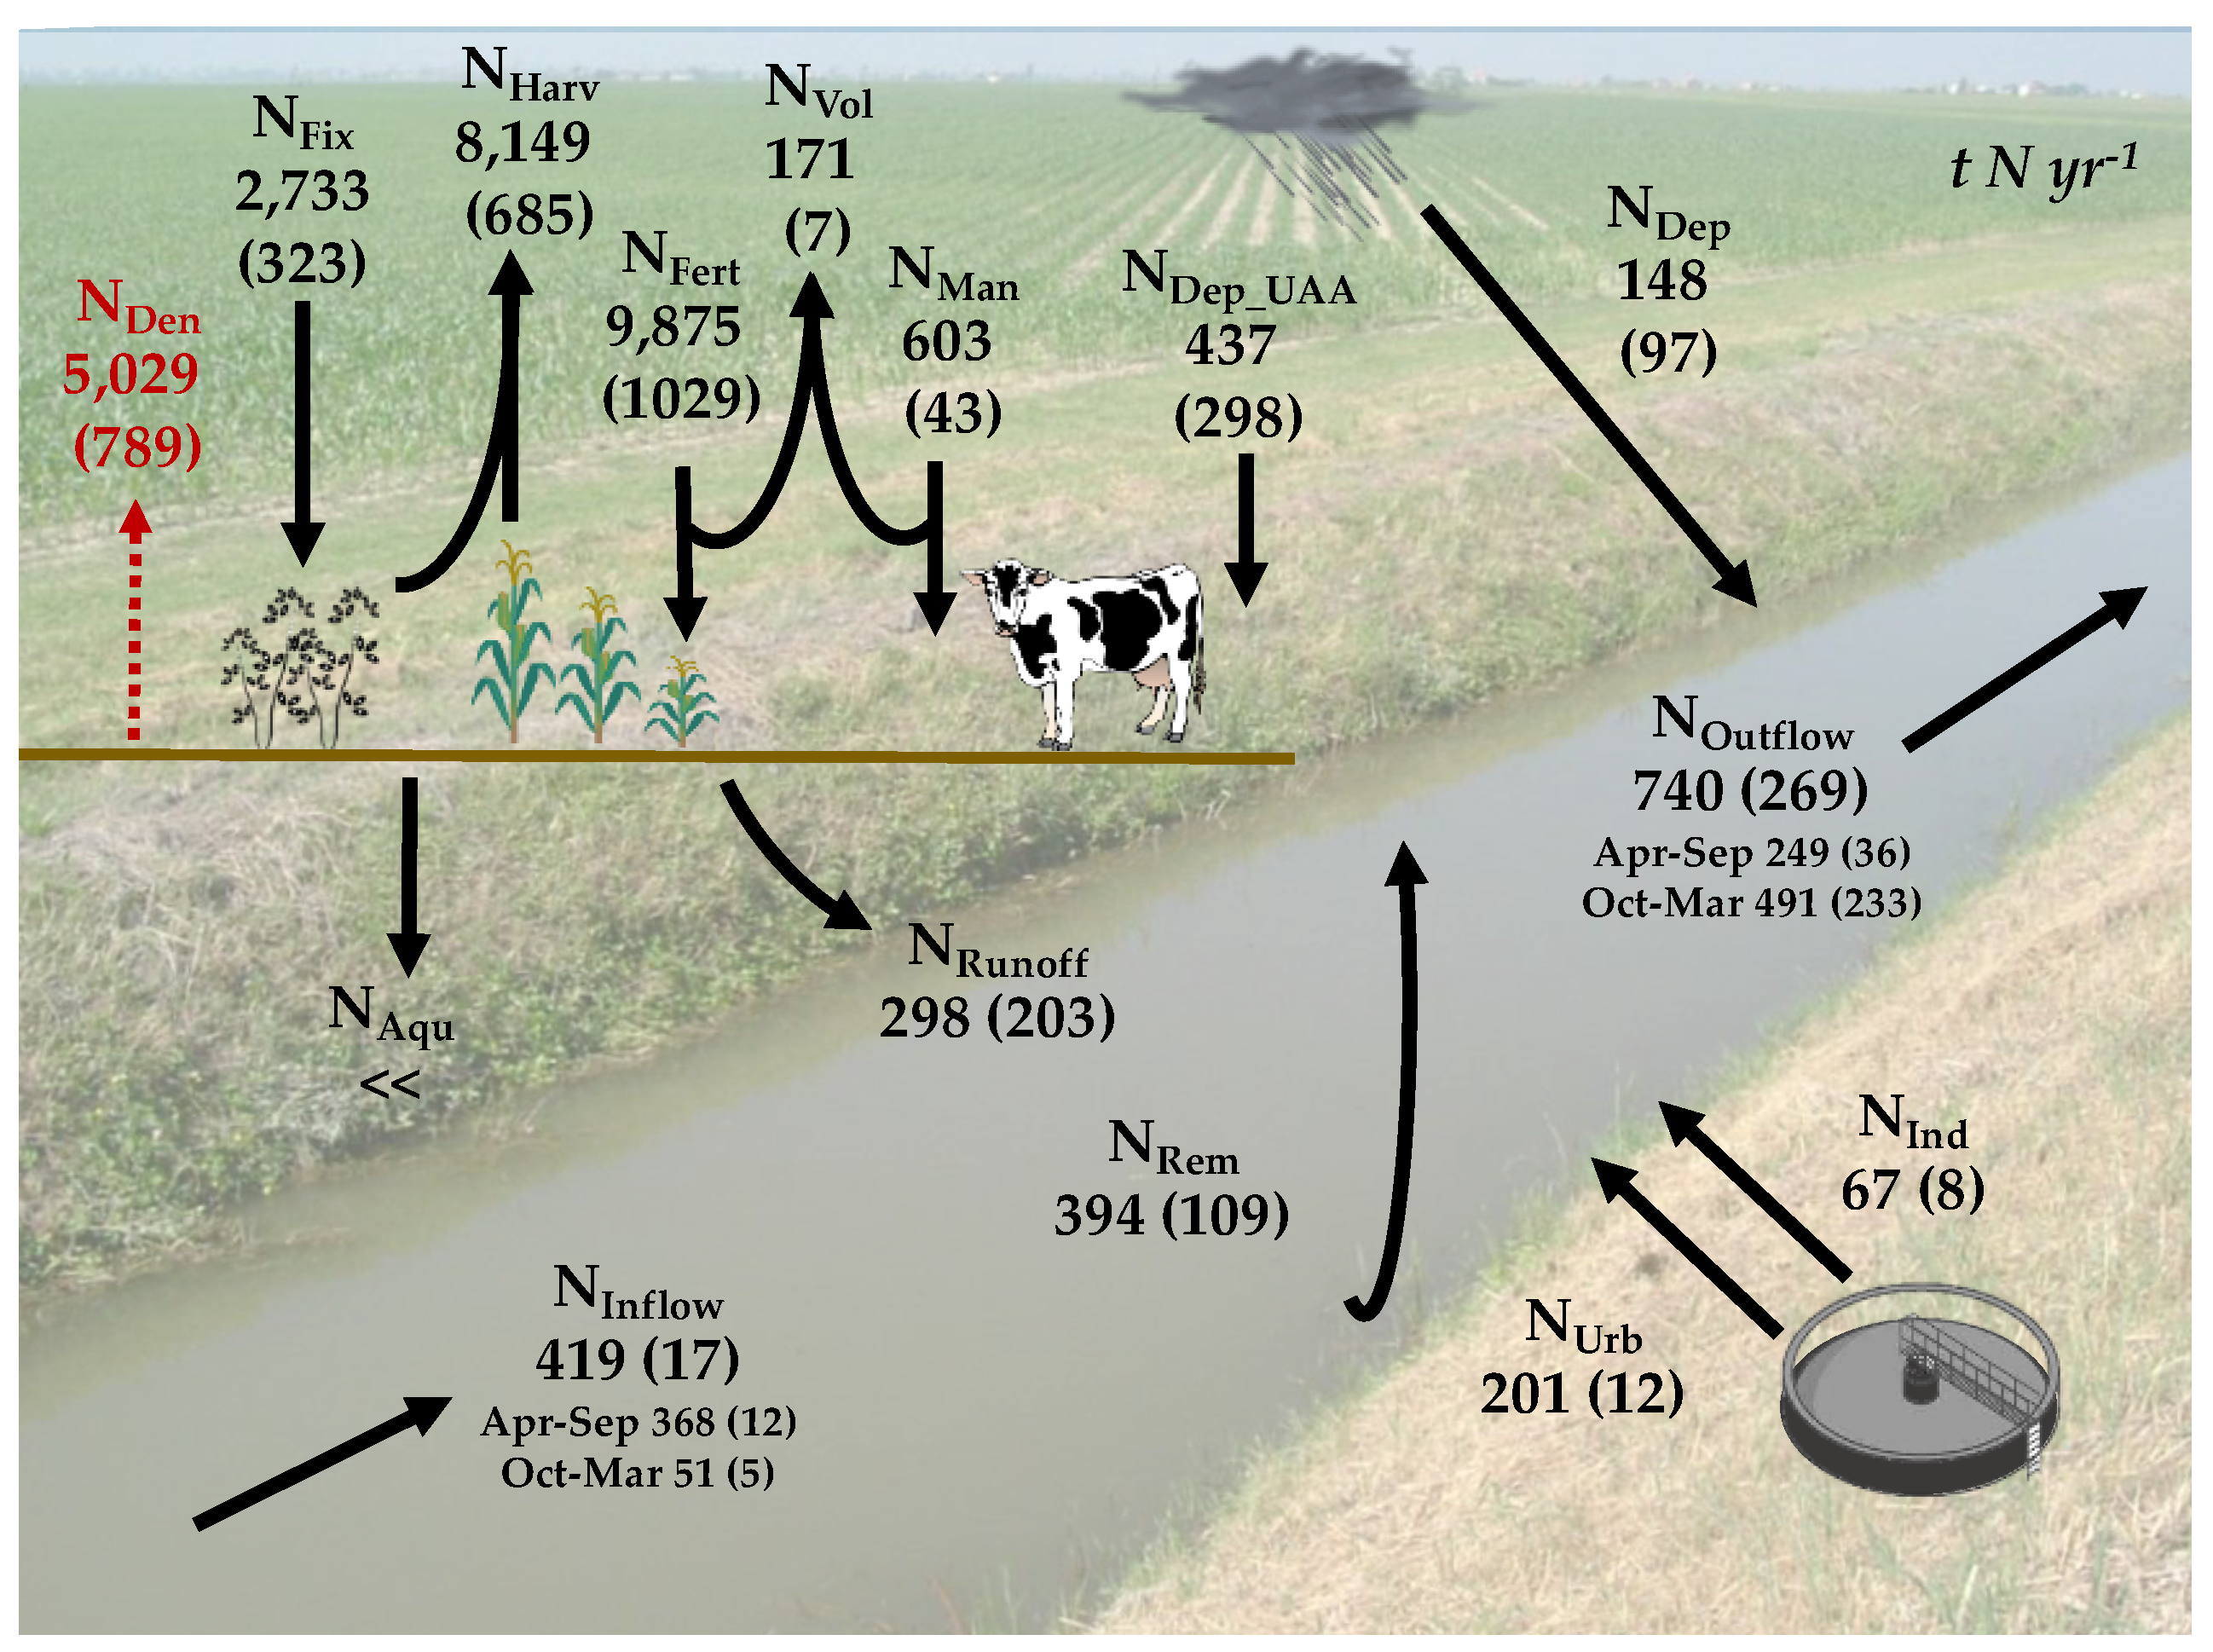
Table 2. Nitrogen budget in the agricultural soils of the Po di Volano-Sacca di Goro watershed (average of the five-year period 2006–2010; standard deviation is reported in brackets). Budget items are expressed as tons of N imported or exported per year (t N·year−1) in the whole area and normalized for the utilized agricultural area (kg N·ha−1·year−1). The percentage of each input or output with respect to the total is also reported.
Po di Volano-Sacca di Goro WatershedN Budget%
t N·year−1kg N·ha−1·year−1
INPUT
Livestock manure (NMan)603 (43)9 (1)5
Synthetic fertilizers (NFert)9875 (1029)140 (12)72
Biological fixation (NFix)2733 (323)39 (5)20
Atmospheric deposition (NDep_UAA)437 (298)6 (4)3
Σ input13,648 (987)194 (10)
OUTPUT
Crop harvest (NHarv)8149 (685)116 (9)95
NH3 volatilization (NVol)171 (7)2 (1)2
N lost in runoff water (NRunoff)298 (203)4 (2)3
Σ output8618 (749)121 (10)
ΔNSoil = Σ input − Σ output5029 (789)72 (11)

