Article

Photoplethysmographic Prediction of the Ankle-Brachial Pressure Index through a Machine Learning Approach

by
David Perpetuini
1,*,
Antonio Maria Chiarelli
1,
Daniela Cardone
1,
Sergio Rinella
2,
Simona Massimino
2,
Francesco Bianco
3,
Valentina Bucciarelli
3,
Vincenzo Vinciguerra
4,
Giorgio Fallica
4,
Vincenzo Perciavalle
2,5,
Sabina Gallina
1,3 and
Arcangelo Merla
1
1
Institute for Advanced Biomedical Technologies, Department of Neuroscience and Imaging, University G. D’Annunzio of Chieti-Pescara, Via Luigi Polacchi 13, 66100 Chieti, Italy
2
Physiology Section, Department of Biomedical and Biotechnological Sciences, University of Catania, Via Santa Sofia 97, 95123 Catania, Italy
3
Institute of Cardiology, University G. D’Annunzio of Chieti-Pescara, Via Dei Vestini 5, 66100 Chieti, Italy
4
STMicroelectronics, ADG R&D, Stradale Primosole 50, 95121 Catania, Italy
5
Department of Sciences of Life, Kore University, Viale delle Olimpiadi, 94100 Enna, Italy
*
Author to whom correspondence should be addressed.
Appl. Sci. 2020, 10(6), 2137; https://doi.org/10.3390/app10062137
Submission received: 13 February 2020 / Revised: 14 March 2020 / Accepted: 19 March 2020 / Published: 21 March 2020

Abstract

:
Cardiovascular disease is a leading cause of death. Several markers have been proposed to predict cardiovascular morbidity. The ankle-brachial index (ABI) marker is defined as the ratio between the ankle and the arm systolic blood pressures, and it is generally assessed through sphygmomanometers. An alternative tool for cardiovascular status assessment is Photoplethysmography (PPG). PPG is a non-invasive optical technique that measures volumetric blood changes induced by pulse pressure propagation within arteries. However, PPG does not provide absolute pressure estimation, making assessment of cardiovascular status less direct. The capability of a multivariate data-driven approach to predict ABI from peculiar PPG features was investigated here. ABI was measured using a commercial instrument (Enverdis Vascular Explorer, VE-ABI), and it was then used for a General Linear Model estimation of ABI from multi-site PPG in a supervised learning framework (PPG-ABI). A Receiver Operating Characteristic (ROC) analysis allowed to investigate the capability of PPG-ABI to discriminate cardiovascular impairment as defined by VE-ABI. Findings suggested that ABI can be estimated form PPG (r = 0.79) and can identify pathological cardiovascular status (AUC = 0.85). The advantages of PPG are simplicity, speed and operator-independency, allowing extensive screening of cardiovascular status and associated cardiovascular risks.

1. Introduction

Cardiovascular acute events, such as infarctions and strokes, are major causes of death [1], and they often occur asymptomatically without an evident pre-existing cardiovascular disease [1]. Prevention of such events is challenging, and it is focused on the evaluation of markers that are indicative of asymptomatic arteriosclerosis [2]. Among the different predictors of cardiovascular morbidity and mortality, the ankle-brachial index (ABI) is commonly utilized. ABI is defined as the ratio between the systolic pressures at the ankle and at the arm [3,4]. This index is commonly used in clinical practice to support diagnosis of peripheral arterial disease in the lower limbs [5], and it is considered an indicator of generalized arteriosclerosis [6]. ABI < 0.9 is suggestive of peripheral arterial disease (PAD) [6], whereas ABI > 1.4 is associated with increased risk of stroke and heart failure [7]. In order to guarantee the reproducibility and standardization of ABI in clinical applications, measurement guidelines have been established [8]. The Doppler method is considered the gold-standard procedure for ABI estimation [8]. The procedure consists in measuring the systolic blood pressure employing a Doppler sensor and a pressure cuff. The pressure is detected at the brachial and pedidia arteries after a rest period of about 10 minutes in the supine position. By convention, the cuff must be placed before at the right arm, then at the right leg, at the left leg and finally at the left arm. After placing the probes’, the cuff is inflated to a pressure 20 mmHg above the expected systolic blood pressure to produce an arterial occlusion. Once the artery is occluded, the Doppler signal disappears. The cuff is then slowly deflated (1 mmHg/sec) and the pressure at which the signal reappears is the systolic pressure. The same procedure is repeated for all the four measurement sites in a sequential manner [8]. This test is long and requires skilled operators.
These features limit the use of this technique in clinical practice. In order to overcome these drawbacks, alternative methods based on oscillometric pressure measurements have been developed and validated [9]. It was demonstrated that the oscillometric procedure is equivalent to the gold-standard Doppler approach in terms of precision, but it is significantly faster, automatic, objective and it does not require a well-trained operator [9,10,11,12]. However, this procedure still requires supra-systolic cuff occlusion, which may cause distress to the subject, and it may not provide reliable results in patients who suffer of masked and white coat hypertension [13]. Alternatively, photoplethysmography (PPG) could be an effective method for cardiovascular assessment, for example, in ABI evaluation.
PPG is a low-cost optical technique able to detect blood volume oscillations in peripheral arteries induced by pulse wave propagation from the heart [14,15,16]. PPG is widely used in medical devices for monitoring oxygen saturation through the evaluation of pulse-related intensity modulation at different light wavelengths (e.g., pulse oximeters). PPG instrumentation is equipped with light sources in the near infrared (NIR) spectral range, where hemoglobin is the main chromophore and a photodetector that collects the transmitted or back-scattered light from the biological tissue. Variations in light intensity recorded by the detector are indicative of the periodic changes in blood volume caused by expanding and contracting arteries in response to the pulse pressure wave. PPG measurement can be performed in transmission (e.g., on fingers to assess arterial oxygen saturation and pulse wave [17]) and in back-reflection modality [18]. In this second modality, the light source and detector are placed on the same surface at a few centimeters, allowing to investigate major arteries on large body sites (e.g., brachial and tibial arteries). In fact, thanks to the high diffusion and low absorption of light in tissues, back-reflection modality allows to collect signal with a depth sensitivity of few centimeters from the investigation surface. This procedure is, for example, commonly employed for measuring hemodynamic oscillations in the cortical layers directly from the scalp; these oscillations are known to be associated with neuronal activity [19].
Whereas multiwavelength PPG can estimate arterial oxygen saturation (i.e., pulse oximetry), single wavelength PPG can be indicative of vascular status. In fact, although PPG is a volumetric measurement, thanks to the strict relation between blood volume and pressure, it has been extensively demonstrated that it is possible to evaluate parameters indicative of arterial stiffness from single-wavelength PPG signal features. In particular, the pulse wave velocity (PWV), the velocity of propagation of pressure wave through the arterial tree, is known to be monotonically associated with arterial stiffening and it can be estimated from PPG measurements performed at two different body locations [20,21]. Furthermore, by using amplitudes of distinctive peaks of PPG second derivative, it is possible to compute a metric defined as ageing index (AGI) [22,23], which is highly sensitive to vascular ageing. Moreover, PPG allows to estimate the augmentation index (AI) in similarity with pressure measurements [24,25]. However, PPG evaluates changes in local blood volume, and simple substitution of absolute pressures with PPG metrics is not always a feasible procedure. For example, ABI is computed from absolute pressures, and it clearly cannot be directly evaluated from PPG. However, more complex approaches, such as data-driven multivariate statistical procedures (i.e., machine learning [26]) could be suitable to derive a model of ABI from PPG signal features. The model can be obtained through supervised learning [27], i.e., it can be derived from available PPG and ABI data, without interpretation of the underlying complex physiology involved. The only assumption of the procedure is the existence of a physiological association between PPG and ABI, and this assumption can be tested a-posteriori through the generalization performance of the model. Among machine learning approaches, linear models such as the general linear model (GLM) [28,29,30] are preferable, thanks to their simple application and robustness.
In this study, the feasibility of predicting ABI from multisite PPG features employing a linear machine learning procedure (i.e., GLM) was investigated. ABI was measured using a commercially available instrument (Enverdis Vascular Explorer, VE) [31,32], which is able to measure the ankle and brachial pressures. GLM was then employed in a supervised learning approach [27] to link different features extracted from the PPG signals at the ankle and at the arm with ABI estimated using the Vascular Explorer (VE-ABI). This analysis was performed to obtain an ABI prediction from PPG (PPG-ABI). Finally, a receiver operating characteristic (ROC) [33] analysis was performed to test the capability of PPG-ABI to discriminate cardiovascular disease assuming VE-ABI as the gold-standard.

2. Materials and Methods

2.1. Participants

A total of 73 volunteers (Male/Female: 40/33, age ranging from 20 to 70 years old, mean age: 45 years, standard deviation: 16 years) were enrolled in the study and tested at the University of Catania. The participants did not take medications, coffee or energy drinks before the experiment. The study was performed in agreement with the ethical standards of the Helsinki Declaration and approved by the Human Board Review and Ethical Committee of the local university. All the participants signed informed consent and could withdraw from the test at any time.
Demographic and general clinical information was acquired. Specifically, information about age, body mass index (BMI), gender and smoking habit were gathered.

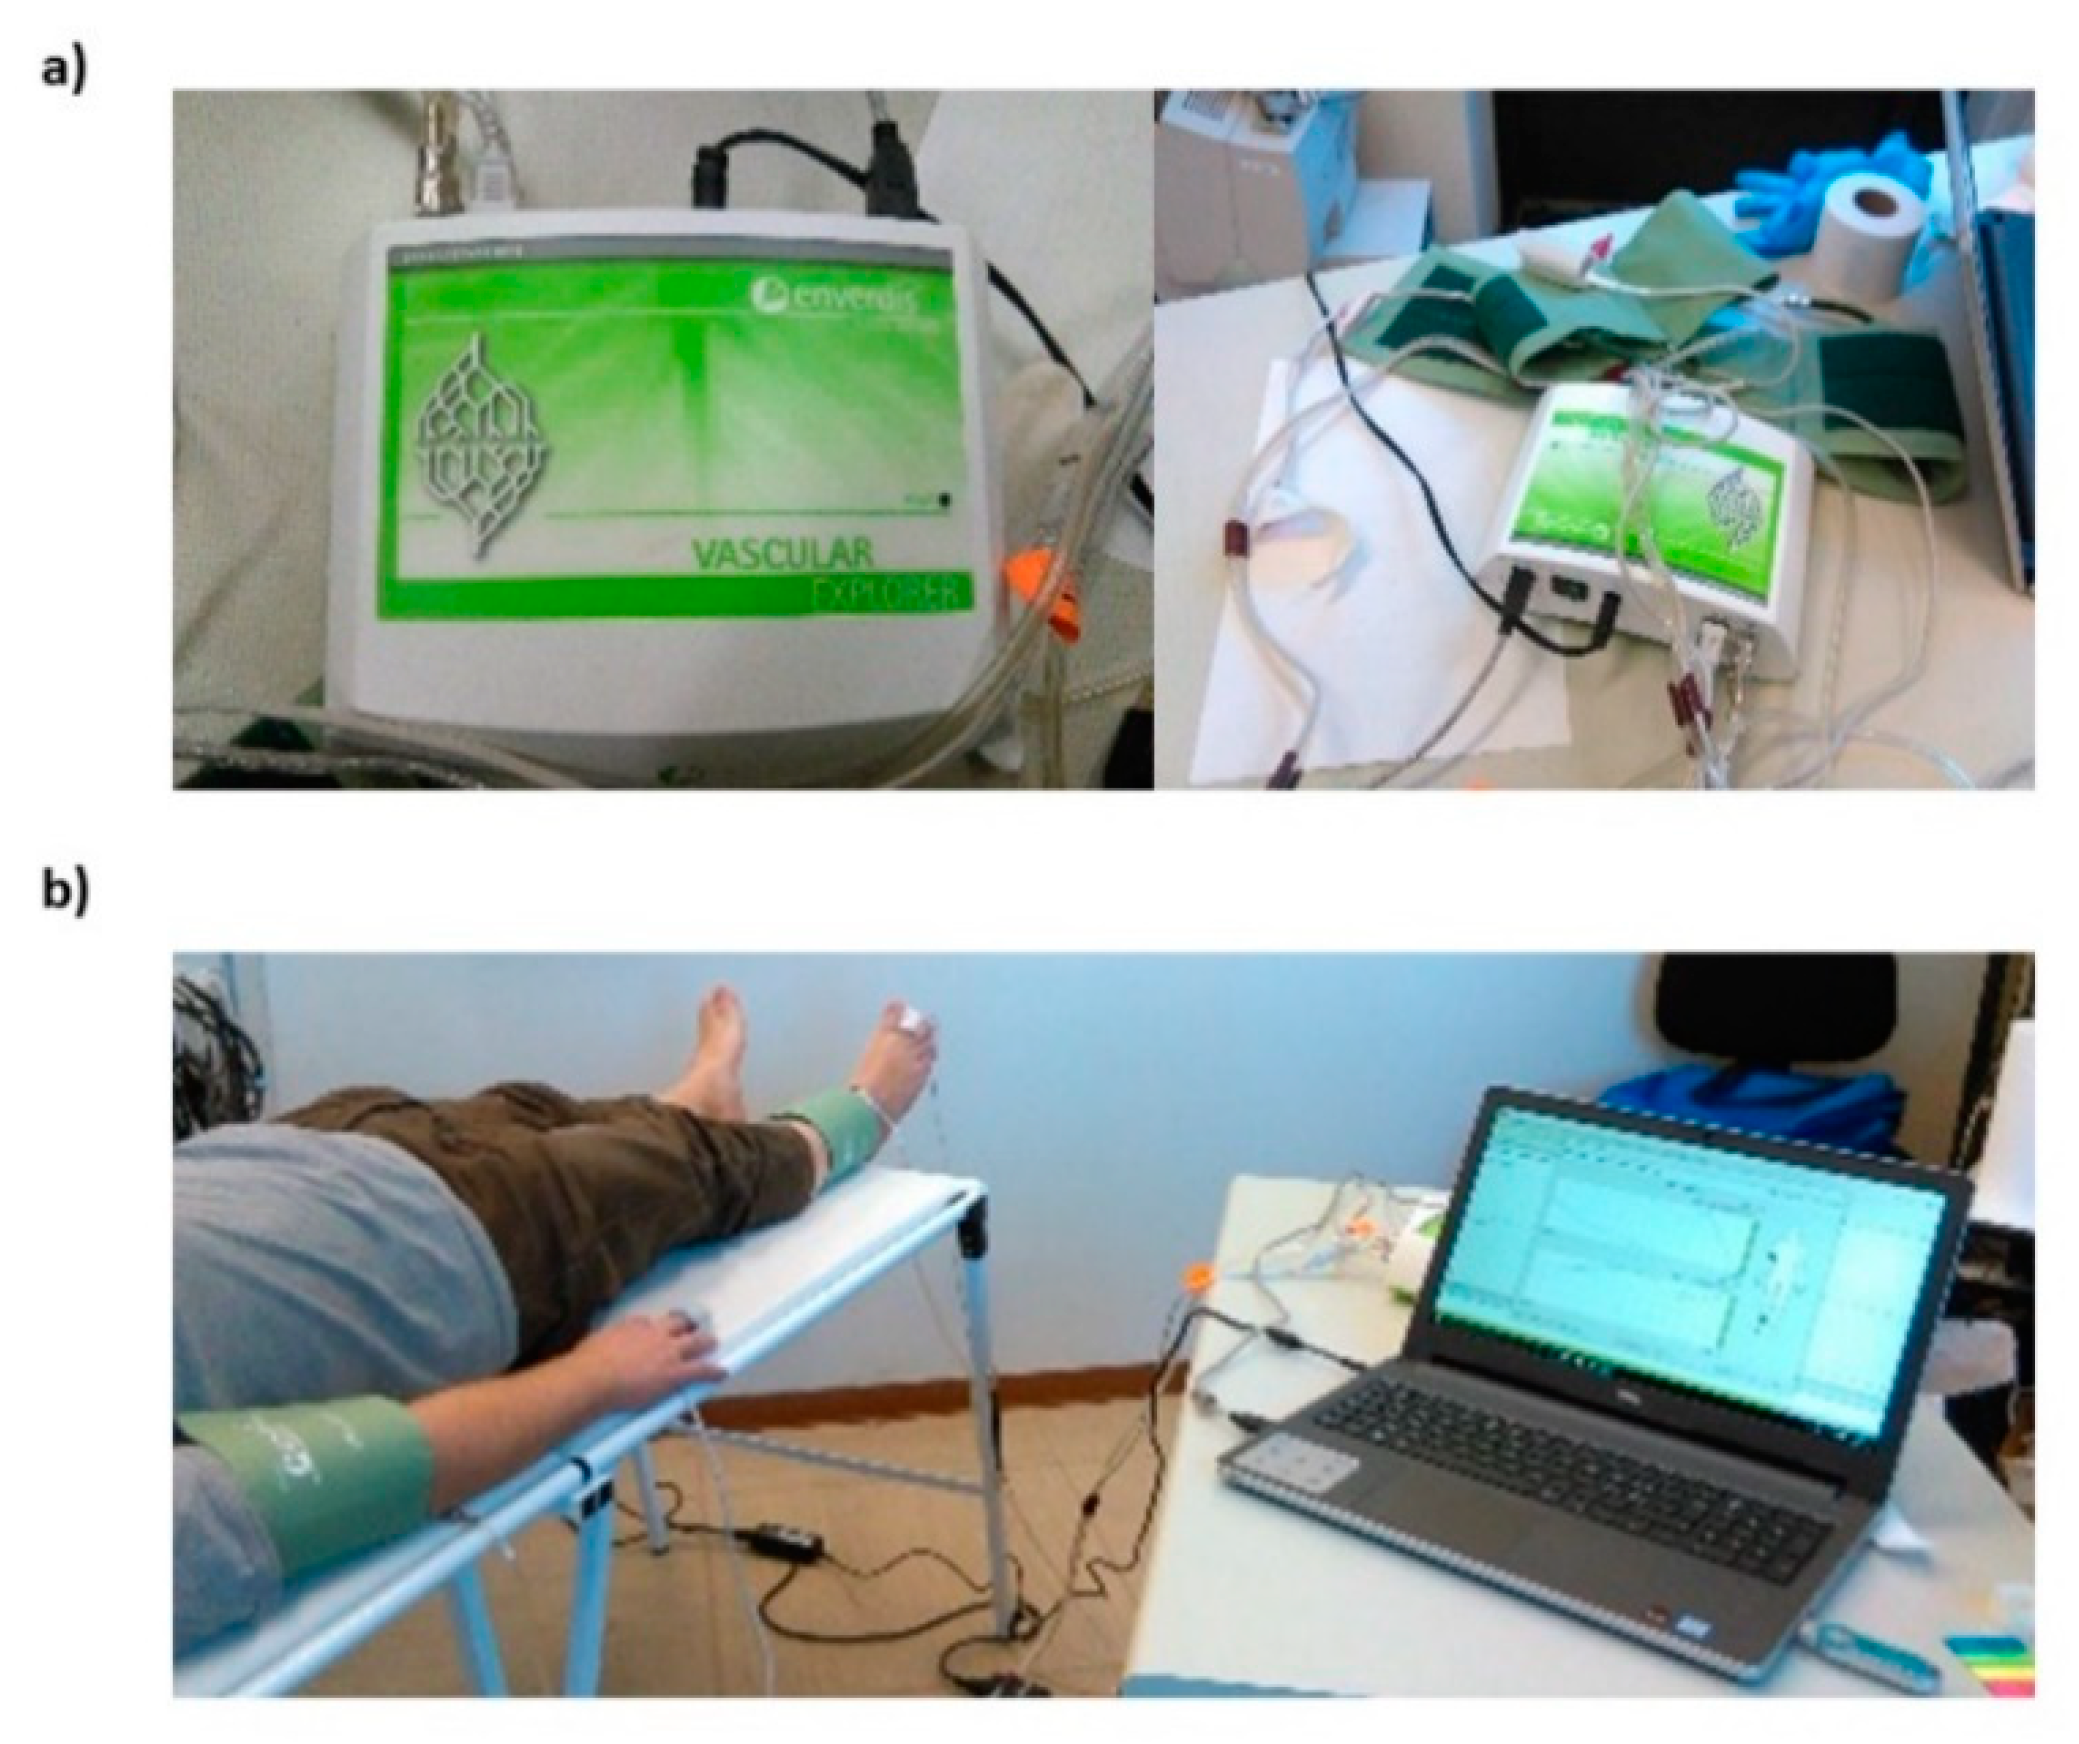
2.2. Vascular Explorer ABI Measurements

The standard procedure to measure ABI employing the Enverdis Vascular Explorer device (VE, Figure 1a) was performed. The participants were requested to lay in the supine position, and the cuffs were placed over the brachial artery and immediately proximal to the malleoli. The optical probes, provided by VE, were placed on the index finger of the hand and on the second finger of the foot (Figure 1b). The sensors and the cuffs were located on the left side and then on the right side of each participant.

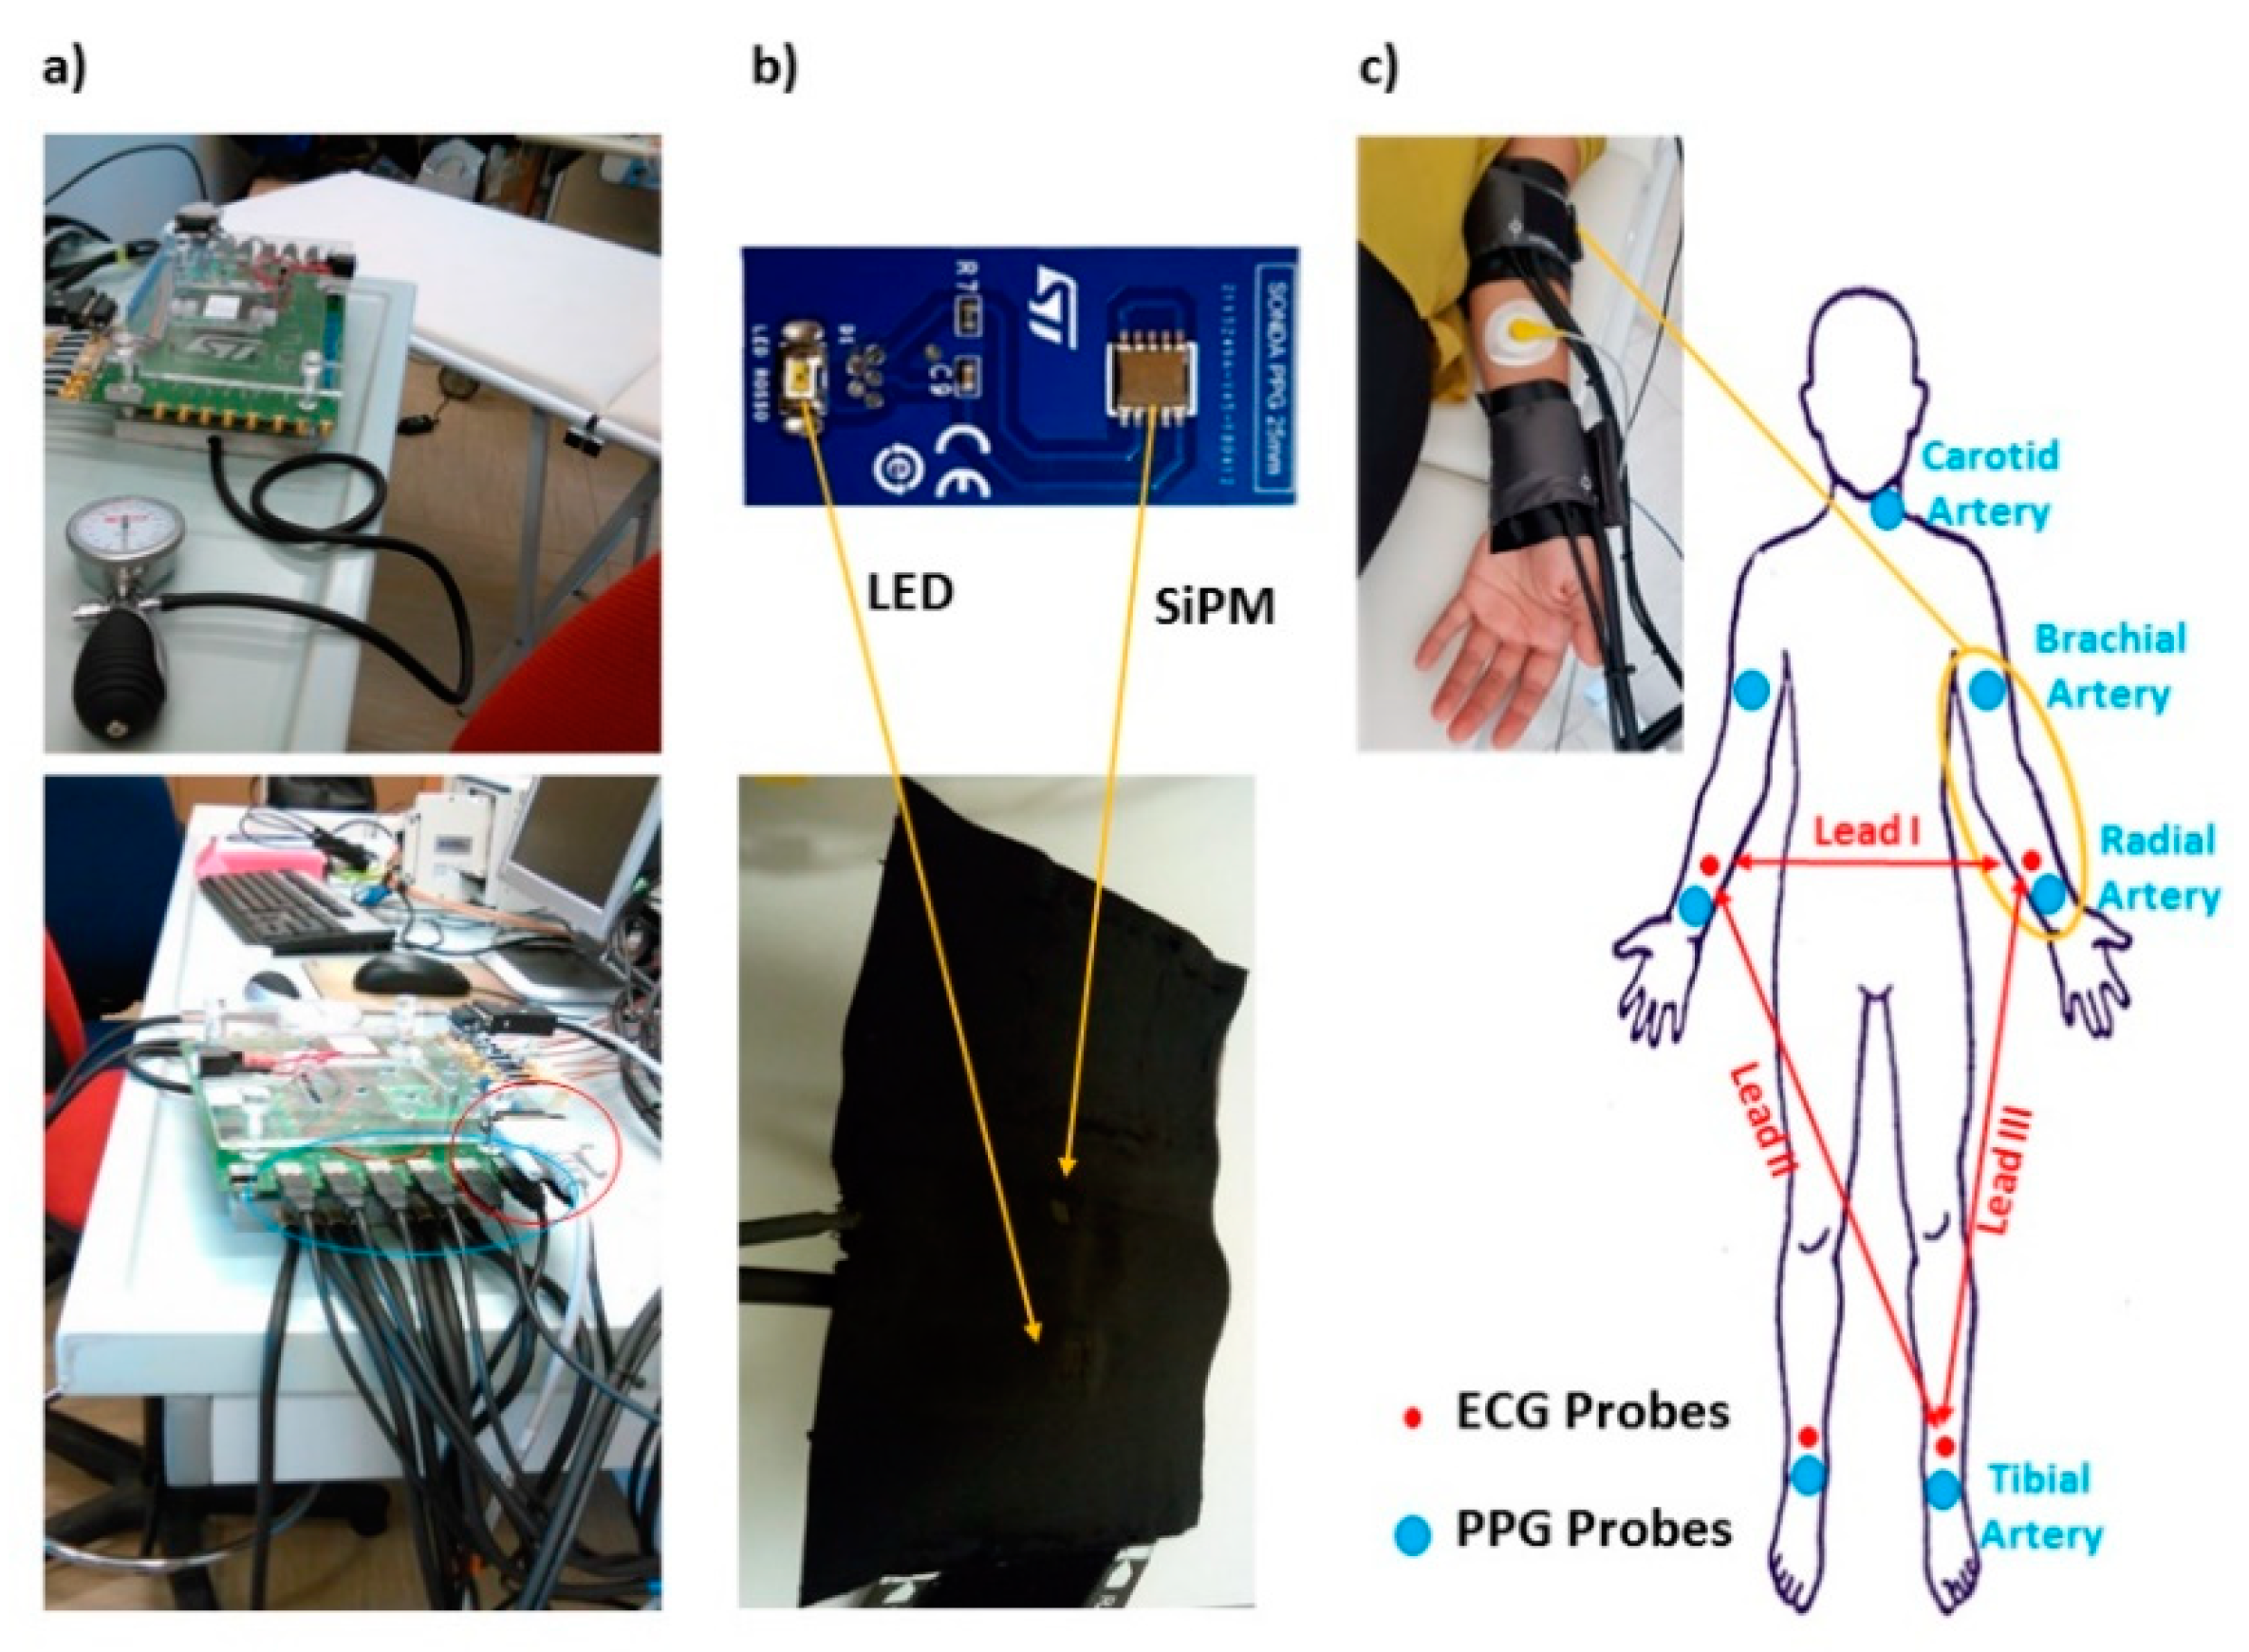
2.3. Photoplethysmographic (PPG) and Electrocardiographic (ECG) Recordings

Photoplethysmographic data were acquired with a home-made multi-channel system [34,35,36] (Figure 2a) equipped with 7 PPG probes. Each probe was composed of a light emitting diode at 940 nm of wavelength (SMC940 LED, Roithner Laser Technik, Vienna, Austria) and a photodetector based on large area n-on-p silicon photomultiplier (SiPM) [37,38] produced at STMicroelectronics (Catania, Italy). The source and the detector were located in a back-scattering configuration with an inter-optode distance of 4 cm (Figure 2b). The sampling frequency was set at 1 kHz.
The sensors were held in place using custom-built probes equipped with pressurized cuffs (Figure 2b), which provided a small pressure (60 mmHg) to support the optical coupling between the sensors and the skin without inducing supra-diastolic vascular occlusion.
A total of 7 available probes were placed on the left carotid artery, on the brachial arteries, on the radial arteries and immediately proximal to the malleoli investigating the tibial arteries. The elevated number of probes allowed to simultaneously perform the measurements on the two body sides (right and left). The system also permitted to synchronously acquire ECG (Lead I, Lead II and Lead III; Figure 2c) [39] at the same sample frequency of 1 kHz. The locations of PPG probes and ECG electrodes is reported in Figure 2c.
During the experiment, the subjects laid supine on a medical cot. PPG and ECG data were recorded for 30 s.

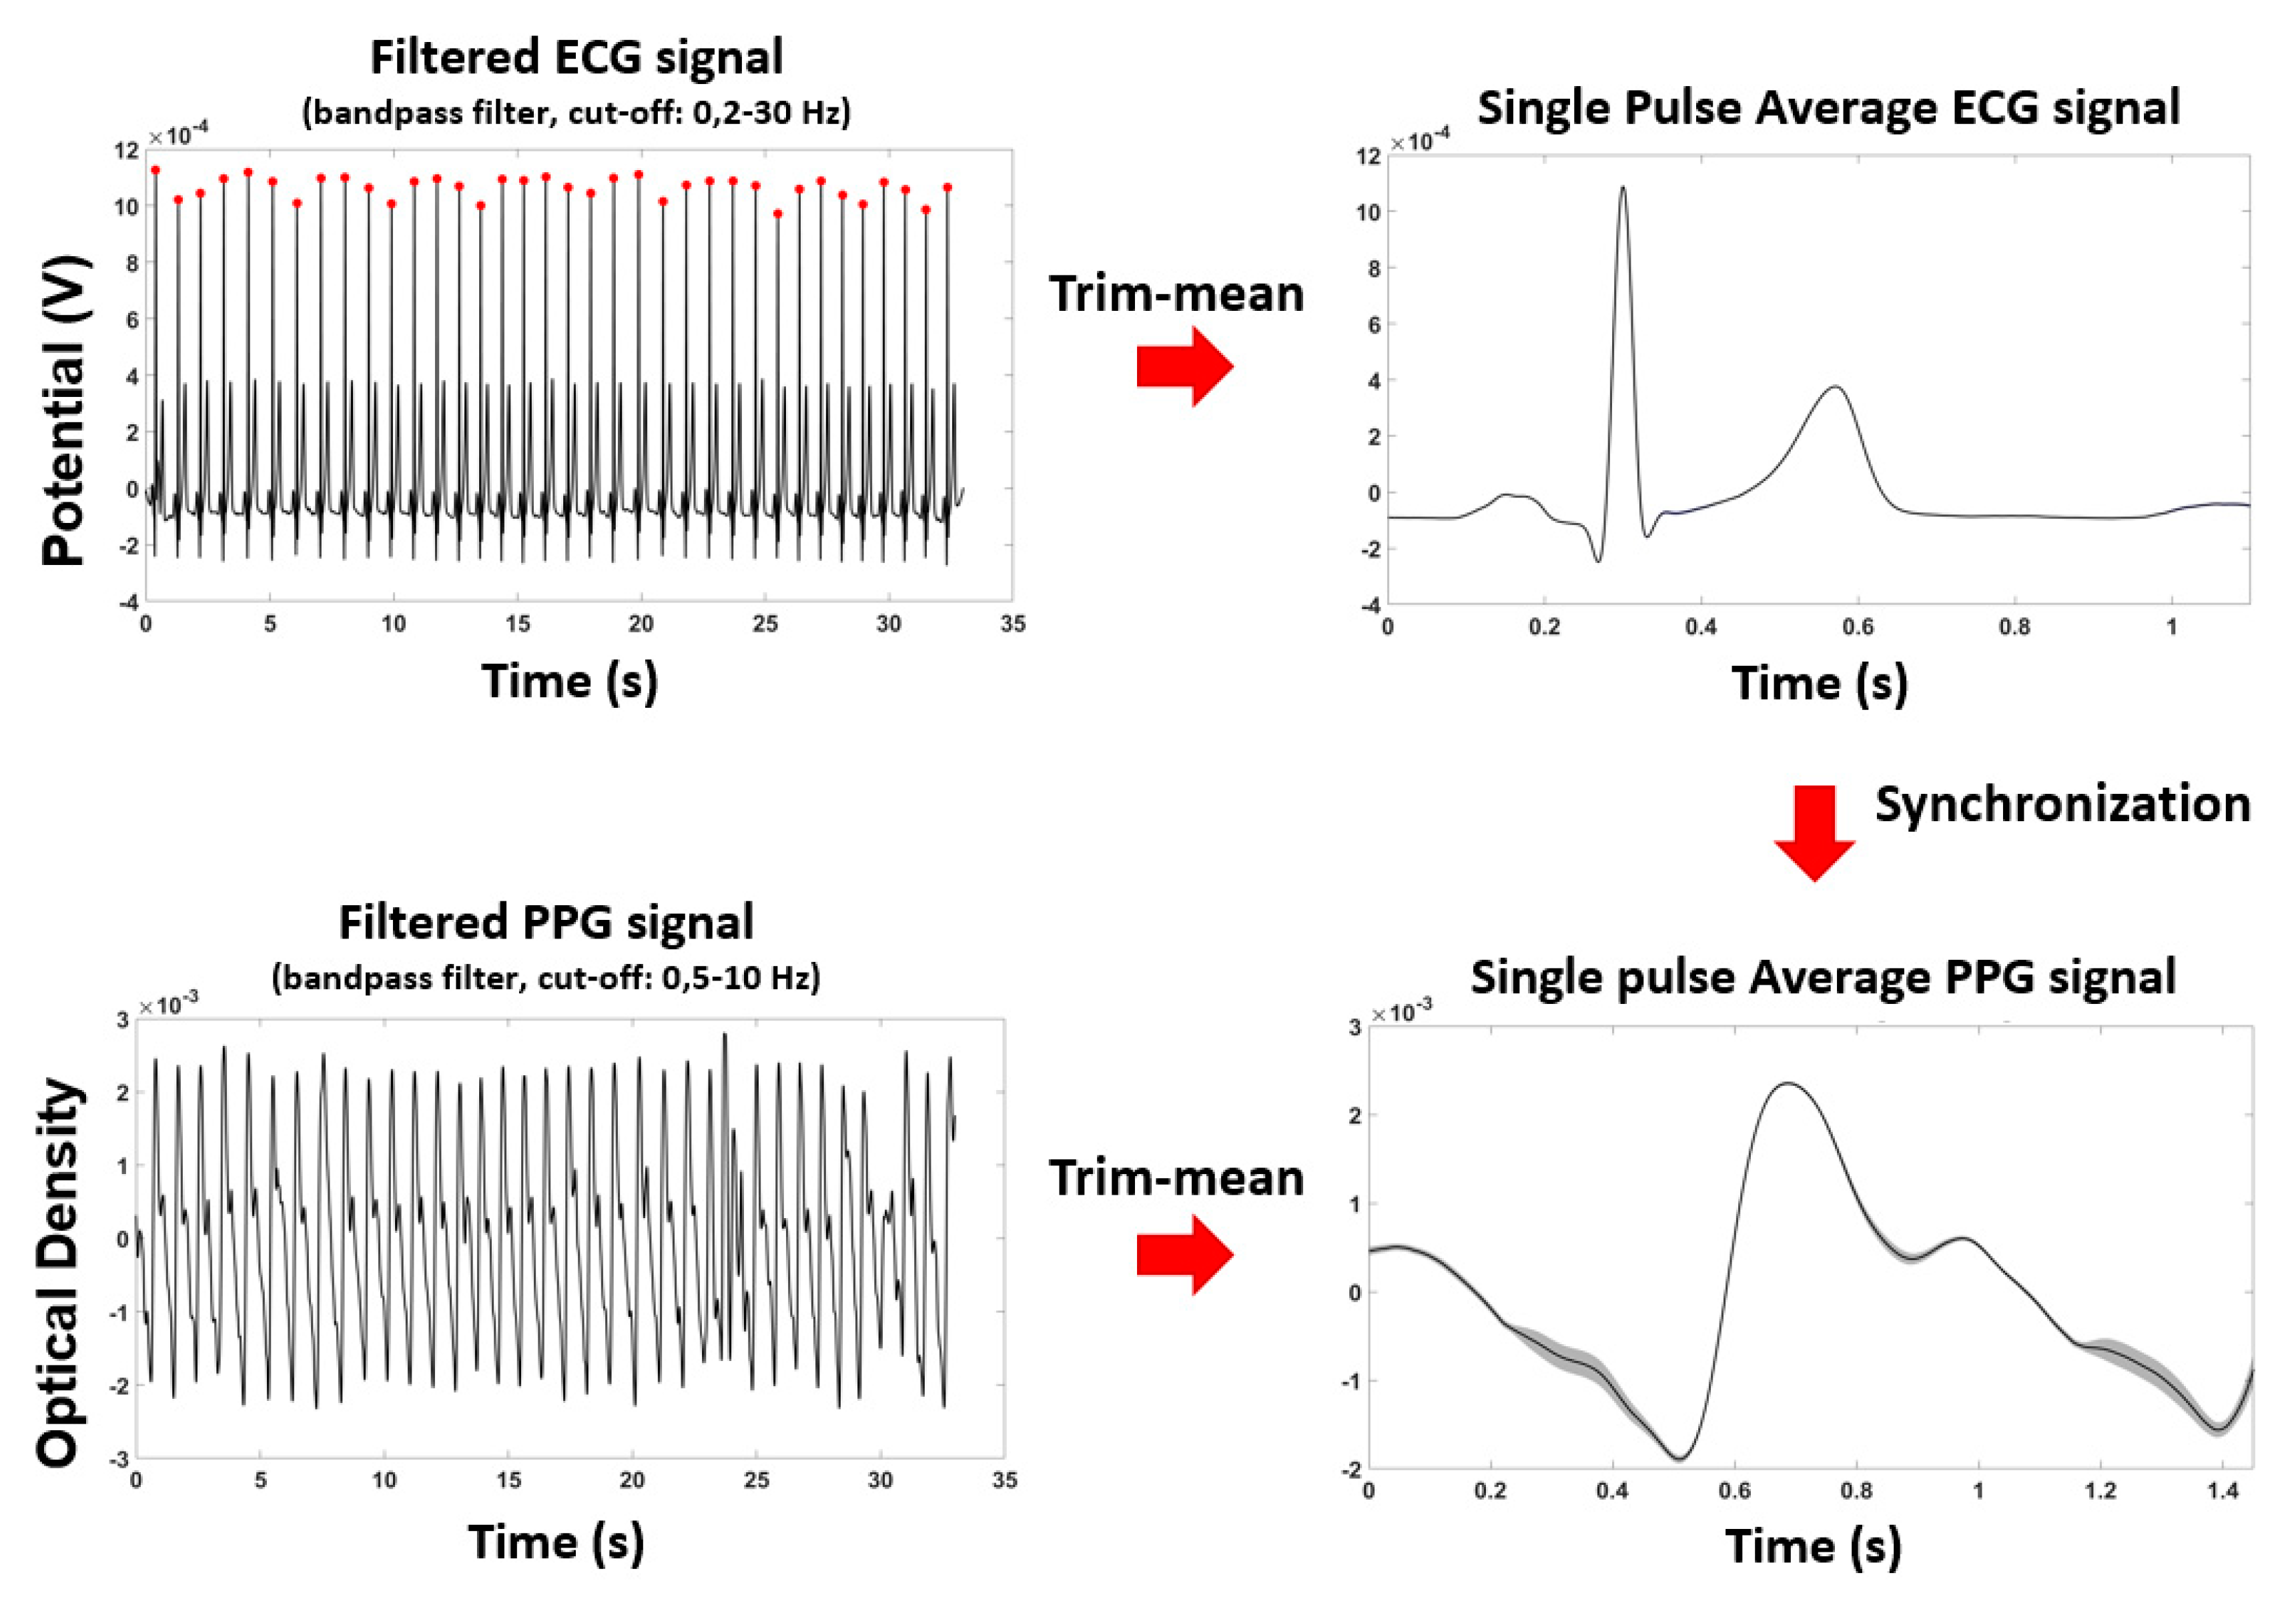
2.4. Photoplethysmographic (PPG) and Electrocardiographic (ECG) Signals Pre-Processing

Raw PPG signals from brachial and tibial arteries were converted into optical densities (OD) according to the equation [37,40]:
OD = ln ( I ( t ) / I o )
where I(t) is the time dependence of the recorded signal intensity and I o is its average value.
Raw OD and ECG were downsampled by a factor of 10, down to 100 Hz, and filtered employing zero-lag, 4th order, band-pass Butterworth digital filters. For the PPG data, the cut-off frequencies were set at 0.2 Hz and 10 Hz; the ECG data cut-off frequencies were set at 0.2 Hz and 50 Hz. The R-wave peaks identification was performed by considering the local maxima on a filtered and normalized (z-scored) Lead I ECG signals, defining some constraints (minimum value of the peak: 3; interpeak distance: 600 ms). This procedure provided an accuracy in the R-peaks identification of 100%. Single pulse PPG was estimated for the brachial and tibial locations in a time window from 0.3 s prior to 1.5 s after the R-wave peak. The duration of the time-window of 1.8 s allowed to investigate a large range of pulsation frequencies (down to a minimum value of ~30 beats/min). In order to exclude possible noisy periods of PPG signal from the analysis, a trim-mean approach for the evaluation of the average signal was applied by excluding single pulses with at least a value below or above the 25th or 75th percentile of the sample population. Thanks to the high-quality of the signals and the reduced presence of motion artifacts, the described analysis guaranteed a stable estimation of the pulse average PPG. Figure 3 reports the preprocessing steps and an example of pulse average ECG and PPG and associated standard errors (shaded areas), showing the high signal to noise ratio of the recordings.

2.5. Ankle-Brachial Index (ABI) Prediction by Means of Machine Learning (General Linear Model, GLM)

Machine learning was utilized to predict ABI relying on features extracted from average brachial and tibial PPG pulses. Specifically, a GLM was trained on the ABI estimated by the VE (VE-ABI) through a supervised learning procedure.
The GLM explains a dependent variable (e.g., ABI) as a weighted sum of one or more predictor variables (e.g., PPG features) plus an unknown error term, in order to evaluate the extent of the contribution of the predictors to the variability observed in the dependent variable. The weights (βs) of the model can be trained on the experimental data and, after training on a normalized dataset, they are informative of the strength of the relation between the predictors and the predicted variable. The GLM can be expressed as [28]:
Y = Xβ + ε
where
  • Y = n × 1 column vector representing the dependent variable (e.g., VE-ABI)
  • X = n × p design matrix where each column represents an independent variable of length n (e.g., PPG features);
  • β = p × 1 column vector of weights of each predictor, indicating the strength of the association with Y;
  • ε = n × 1 column vector of the residual error
The optimization of the parameters βs (training), generally based on a least square approach and performed on normalized (z-scored) variables, provides information regarding the amount of variance of the dependent variable that could be explained by each independent variable. A total of 7 independent variables (features of the PPG signals), supposedly sensitive to cardiovascular status [41], were chosen for the analysis, namely:
  • Maximum amplitude of the PPG ODs evaluated at brachial and tibial arteries (2 features, labelled MaxArm and MaxAnkle);
  • Diastole to systole slope of the PPG signal at brachial and tibial arteries (2 features, labelled SlopeArm and SlopeAnkle) evaluated as:
    S l o p e = S y s t o l i c   p e a k D i a s t o l i c   f o o t t i m e   S y s t o l i c   p e a k t i m e   D i a s t o l i c   f o o t
  • Time delay of the diastolic foot of PPG with respect to ECG R-peak at brachial and tibial arteries (2 features, labelled TDArm and TDAnkle);
  • Ratio of an estimate of the systolic blood pressure at the ankle and at the brachial artery derived from PPG signals according to [42] (1 feature, labelled Ankle-Arm), evaluated as:
    Ankle - Arm = 184.3 1.329 · H e a r t R a t e b p m + 0.0848 T D a n k l e 184.3 1.329 · H e a r t R a t e b p m + 0.0848 T D a r m
Importantly, not only PPG features intuitively directly associated to pressure features employed in ABI computations were taken into account in the regression problem (such as the maximum amplitudes), but also other features that could be sensitive to the cardiovascular status (such as the heartrate, PPG slope and timing).
The features were normalized (z-scored) before GLM computation. Left and right metrics were considered as independent samples in the GLM regression problem, hence resulting in a sample size of 146 (73 participants × 2 body sites, left and right).
Because of the multivariate (7 regressors) GLM approach, in-sample performance of the procedure did not reliably estimate the out-of-sample performance. The generalization capabilities of the procedure were thus assessed through cross-validation. Specifically, a leave-one-subject-out cross-validation was performed [43]. This cross-validation procedure consisted in leaving one subject (specifically its left and right measurements) out of the regression and in estimating the predicted output value on the given subject using the other participants as training set of the GLM model. This procedure was iterated for all the subjects, and the further statistical analysis were performed on the out-of-training-sample estimation of ABI from PPG. Such metric was labelled PPG-ABI. Since there were significant gender differences in the VE-ABI, the same procedure was performed again by separating the total sample by gender and an assessment of the difference in performance was evaluated.

2.6. Statistical Analysis
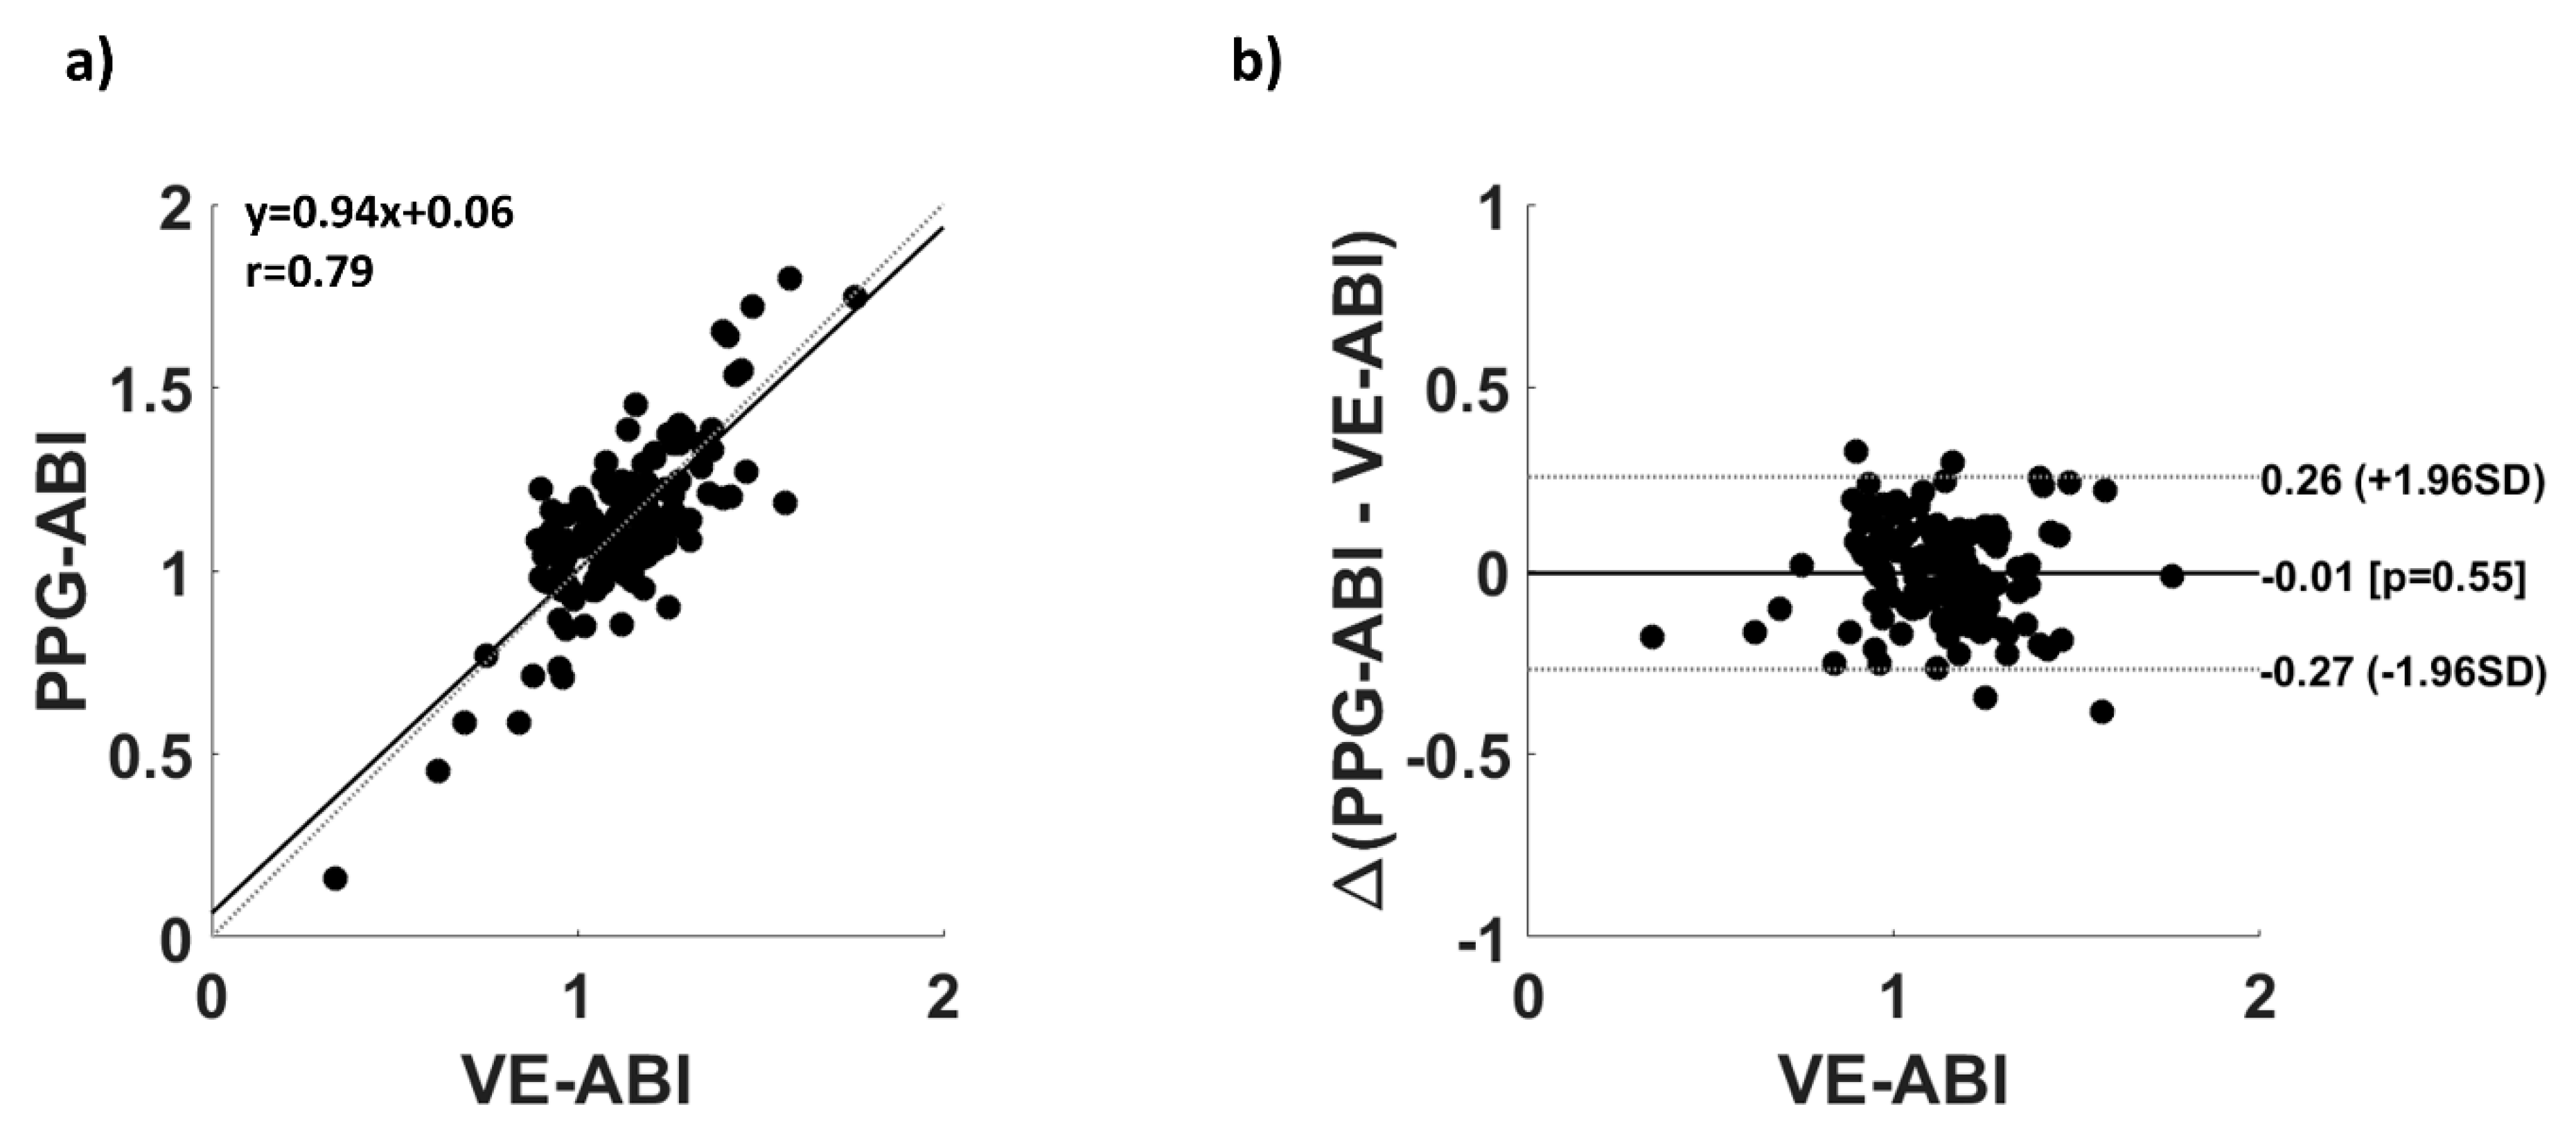
Statistical evaluation and comparison between demographic and clinical variables were performed using paired t-test and correlation (Spearman) analysis. VE-ABI and PPG-ABI were compared relying on paired t-test, correlation (Spearman) analysis and Bland–Altman Plot.
Paired t-test [44] assessed the presence of a bias in the PPG-ABI estimation with respect to VE-ABI, and the correlation [45] characterized the relationship between the two variables.
The Bland–Altman plot [46,47] is a method that allows to graphically compare two measurement methods. The difference (or alternatively the ratios) between the two estimations is plotted against the averages or against one of the two methods which is considered the gold standard [48]. Horizontal lines in the graph represent the mean difference and the limits of agreement, defined as the interval of 1.96 times the standard deviation around the mean difference. In this study, VE-ABI was assumed as the gold standard; thus, the difference between PPG-ABI and VE-ABI was plotted against VE-ABI.
Finally, a Receiver Operating Characteristic (ROC) [33] analysis was performed to assess the sensitivity and specificity of PPG-ABI to impaired cardiovascular status. Participants with VE-ABI < 0.9 and VE-ABI > 1.4 were labelled as pathological (label = 1), whereas participants with VE-ABI ≥ 0.9 and VE-ABI ≤ 1.4 were classified as healthy (label = 0). In the study sample, 13 participants showed VE-ABI < 0.9 and 11 participants exhibited VE-ABI > 1.4, with an overall number of 24 participants showing pathological ABI (ABI < 0.9 or ABI > 1.4). The multivariate classification performance of PPG-ABI was compared to the univariate performance of single PPG features.

3. Results

Demographic and clinical variables were correlated with VE-ABI. For numerical variables, a small but significant correlation between age and VE-ABI (r = 0.17, p = 0.04) was found, whereas no significant correlation was found between BMI and VE-ABI (r = −0.02, p = 0.83). For binary variables we found a significant difference in VE-ABI as a function of gender (males vs. females, t = 2.25, df = 144, p = 0.03) and smoking habit (smokers vs. non-smokers, t = 2.32, df = 144, p = 0.02).
For the GLM analysis, the average cross-validated weights (βs) associated to the different PPG features and their associated statistics are reported in Table 1.
Figure 4 reports the comparison between VE-ABI and PPG-ABI. Figure 4a shows the correlation between PPG-ABI and VE-ABI (r = 0.79; p = ~0), whereas Figure 4b reports the Bland–Altman plot analysis of the same variables. The t-test between the VE-ABI and PPG-ABI did not show significant difference (t = −0.07; df = 145; p = 0.55), indicating the absence of bias in VE-ABI estimation. The root mean square error (RMSE) of the estimation was 0.13. Importantly, the correlation of the multivariate estimation, i.e., PPG-ABI, with VE-ABI (r = 0.79) was statistically superior to the univariate correlations (vs. r = 0.08, z = 8.38, p = ~0 for MaxArm; vs. r = 0.18, z = 7.52, p = ~0 for MaxAnkle; vs. r = 0.11, z = 8.13, p = ~0 for SlopeArm; vs. r = 0.26, z = 6.81, p = ~0 for SlopeAnkle; vs. r = −0.19, z = 7.43, p = ~0 for TDArm; vs. r = −0.35, z = 5.97, p = ~0 for TDAnkle; vs. r = 0.62, z = 2.93, p = 2 × 10⁻³ for Ankle-Arm).
Since statistical differences in VE-ABI as a function of gender were found, and the sample numerosity in the male and female group was comparable, the cross-validated GLM approach was performed again by separating the two groups. This analysis was performed to assess if the prediction capabilities of the multivariate model was different as a function of gender. The PPG-ABI vs. VE-ABI correlations obtained for the different groups were r = 0.69 for males and r = 0.61 for females; this difference in correlation was not statistically significant (z = 0.82, p = 0.21).
Figure 5 reports the ROC of PPG-ABI, estimated employing the whole sample population, in assessing cardiovascular risk (0.9 ≤ VE-AB I≤ 1.4 vs. 0.9 VE-ABI < 0.9 or VE-ABI > 1.4). A ROC area under the curve (AUC) of 0.85 was found.
At a specific threshold, an accuracy of 88%, a sensitivity of 75% and a specificity 91% were obtained. The confusion matrix is reported in Table 2.
The AUC retrieved with a multivariate approach (AUC = 0.85) was significantly different [49] from the AUCs obtained employing univariate analysis from standalone PPG features (vs. AUC = 0.46, z = 4.80, p = ~0 for MaxArm; vs. AUC = 0.51, z = 4.12, p = 3.8 × 10⁻⁵ for MaxAnkle; vs. AUC = 0.32, z = 7.12, p = ~0 for SlopeArm; vs. AUC = 0.37, z = 6.21, p = ~0 for SlopeAnkle; vs. AUC = 0.36, z = 6.38, p = ~0 for TDArm; vs. AUC = 0.35, z = 6.56, p = ~0 for TDAnkle; vs. AUC = 0.52, z = 3.99, p = 6.7 × 10⁻⁵ for Ankle-Arm).

4. Discussion

Because of the high incidence of acute cardiovascular insults, the identification of asymptomatic cardiovascular impairment and its associated risks is of great importance, and it should be extensively performed. Several markers of cardiovascular risk have been identified, such as ABI. ABI is considered highly indicative of arteriosclerosis and vascular disease of the lower limbs. ABI is estimated as the ratio between the brachial and the tibial systolic blood pressure, and this ratio is considered pathological when its value is particularly low (ABI < 0.9) or particularly high (ABI > 1.4). Direct ABI estimation requires measurements of systolic pressures employing pressure sensors and supra-systolic cuff occlusion. This procedure can be time consuming, operator-dependent and stressful for the patient. PPG can be employed to estimate cardiovascular status. However, defining an intuitive and direct formula linking PPG to ABI is poorly feasible, and other approaches have to be investigated. In this study, the possibility of employing a data-driven machine learning approach to predict ABI from PPG was explored. PPG features, extracted from brachial and tibial arteries and known to be associated to cardiovascular status and arterial pressure, were used as independent variables in a linear multivariate regression (i.e., GLM) that was trained through a supervised learning approach to infer ABI. A leave-one-subject-out cross-validation approach was used to estimate the accuracy of the predictive model on a novel dataset, providing an unbiased estimation of the algorithm performance (generalization). The correlation between predicted ABI (estimated from PPG features, PPG-ABI) and gold-standard ABI (estimated through a validated procedure, VE-ABI) of r = 0.79 (p = ~0) suggested good performances of the model. Importantly, the multivariate machine learning approach performed better than all the univariate regressions, including the PPG feature that was best correlated with VE-ABI (z = 3.71, p = 2.08 × 10⁻⁴).
Notably, a significant contribution to the VE-ABI variance was obtained for PPG temporal (TDAnkle) and amplitude (MaxAnkle) features measured at the ankle. These results suggest that the ankle could be an ideal location for PPG measurements. PPG temporal features are associated to PWV, which can be accurately inferred from particularly distal measurement such as those performed at the ankle. For such a reason, temporal PPG features evaluated at the ankle might be expected to significantly contribute to ABI prediction. However, amplitude PPG features generally tends to be poorly reliable and are not useful for quantitative physiological parameters estimation. Nonetheless, significant ABI prediction capabilities were obtained for the MaxAnkle parameter, depicting the stability and reliability of measuring PPG at the ankle. The null results obtained for the MaxArm parameter instead suggest less reliable estimation of PPG amplitude at the arm.
As suggested by Bland–Altman plot, the errors in estimation of PPG-ABI with respect to VE-ABI were distributed within the 95% confidence interval, showing a good correspondence of the two methods without clear outliers. Moreover, in order to test the capability of PPG-ABI to evaluate cardiovascular impairment and risk, a ROC analysis of PPG-ABI for the classification of pathological ABI, as defined by the gold standard procedure of VE, was performed (i.e., a ROC curve for evaluating the PPG-ABI ability to correctly identify VE-ABI < 0.9 or VE-ABI > 1.4). The AUC was 0.85, and at a defined threshold, an accuracy of 88% was obtained. This analysis showed a good ability of PPG-ABI to discriminate between the physiological and pathological population, with better performance than univariate analysis.
Interestingly, small but significant differences in VE-ABI as a function of gender and smoking status were found. Since a sufficient similarity in male and female sample size was available, possible differences in the algorithm performance as a function of gender were evaluated. However, no statistical differences in the prediction performance were found. It should be noted that this finding might be driven by the decreased sample numerosity when separating the subjects in two groups. Since the smoking population was too small (only 17 smokers), no multivariate analysis as a function of smoking habit was performed. Further studies could be performed on this topic.
Anyhow, further studies should be also performed to increase the overall sample size of the population. In fact, machine learning approaches rely on data-driven analysis that might drastically increase their performances with large sample sizes. Increasing the sample size could decrease a possible in-sample overfitting effect of the regressor/classifier. In particular, it is fundamental to enroll more pathological participants in order to balance the numerosity of the classes and to perform a more reliable classification.
Moreover, it would be worth to increase the number of regressors or to investigate more complex non-linear machine learning approaches (such as Deep Learning, [50]) in ABI prediction from PPG features. However, both these solutions could introduce an overfitting effect in the learning procedure from the data which could be avoided by employing large sample sizes. Thus, further studies with substantial sample population are necessary to investigate this aspect.
Finally, it can be noticed that, apart from the Arm-Ankle metric, the highest β corresponded to the time delay of the diastolic foot of PPG with respect to ECG R-peak at the tibial arteries. A feature associated to timing, hence speed, of the pulse wave was a highly predicting metric; this finding confirmed the complex relation between differential volumetric measurements of PPG and absolute pressure measurements.
The advantages of employing PPG signals instead of pressure measurements rely on the short-lasting and simplicity of the procedure, important features in clinical practice. Moreover, recordings are completely operator-independent, do not require a high specialized operator, and, importantly, they do not need supra-systolic cuff occlusion. All these characteristics might allow extensive screening which, given the incidence and the vague prodromal signs of cardiovascular insult, would be essential in medical practice.

5. Conclusions

In this paper, the feasibility of employing a machine learning approach in predicting ABI from brachial and tibial PPG recordings was investigated. The machine learning approach provided good correspondence between prediction, i.e., PPG-ABI, and the gold-standard procedure for ABI estimation, i.e., VE-ABI. This novel method of estimating ABI from PPG signals through a machine learning procedure would allow to evaluate the cardiovascular status in short time, non-invasively, and avoiding supra-systolic occlusion, possibly making ABI estimation a standard clinical practice for cardiovascular status screening and cardiovascular risk assessment.

Author Contributions

Conceptualization, D.P., A.M.C., F.B., S.G., V.B., S.R., S.M., V.P., G.F., A.M.; methodology, D.P., A.M.C., D.C., S.R., S.M., F.B., V.B., S.G., V.P.; hardware, G.F., V.V.; software: D.P., D.C., A.M.C., G.F.; formal analysis, D.P., A.M.C., G.F.; writing—original draft preparation, D.P.; writing—review and editing, D.P., A.M.C.; supervision, A.M., S.G., V.P., G.F.; project administration, A.M., G.F.; funding acquisition, V.V., A.M. All authors have read and agreed to the published version of the manuscript.

Funding

This research was partially funded by grant H2020, ECSEL-04-2015-Smart Health, grant n. 692470, Advancing Smart Optical Imaging and Sensing for Health (ASTONISH).

Conflicts of Interest

The authors declare no conflict of interest.

References

  1. Heald, C.L.; Fowkes, F.G.R.; Murray, G.D.; Price, J.F. Risk of mortality and cardiovascular disease associated with the ankle-brachial index: Systematic review. Atherosclerosis 2006, 189, 61–69. [Google Scholar] [CrossRef] [PubMed]
  2. Breen, P.P.; Jayarathna, T.; Gargiulo, G.D. Live Demonstration: Morphic Sensor for Diagnosis of Peripheral Vascular Disease. In Proceedings of the 2019 IEEE Biomedical Circuits and Systems Conference (BioCAS), Nara, Japan, 17–19 October 2019. [Google Scholar]
  3. Zheng, Z.-J.; Sharrett, A.R.; Chambless, L.E.; Rosamond, W.D.; Nieto, F.J.; Sheps, D.S.; Dobs, A.; Evans, G.W.; Heiss, G. Associations of ankle-brachial index with clinical coronary heart disease, stroke and preclinical carotid and popliteal atherosclerosis:: The Atherosclerosis Risk in Communities (ARIC) Study. Atherosclerosis 1997, 131, 115–125. [Google Scholar] [CrossRef]
  4. Winsor, T. Influence of arterial disease on the systolic blood pressure gradients of the extremity. Am. J. Med. Sci. 1950, 220, 117–126. [Google Scholar] [CrossRef] [PubMed]
  5. McDermott, M.M.; Liu, K.; Greenland, P.; Guralnik, J.M.; Criqui, M.H.; Chan, C.; Pearce, W.H.; Schneider, J.R.; Ferrucci, L.; Celic, L. Functional decline in peripheral arterial disease: Associations with the ankle brachial index and leg symptoms. JAMA 2004, 292, 453–461. [Google Scholar] [CrossRef] [PubMed] [Green Version]
  6. Raman, P.G.; Thakur, B.S.; Mathew, V. Ankle brachial index as a predictor of generalized atherosclerosis. J. Assoc. Phys. India 2001, 49, 1074–1077. [Google Scholar]
  7. Resnick Helaine, E.; Lindsay Robert, S.; McDermott Mary, M.; Devereux Richard, B.; Jones Kristina, L.; Fabsitz Richard, R.; Howard Barbara, V. Relationship of high and low ankle brachial index to all-cause and cardiovascular disease mortality. Circulation 2004, 109, 733–739. [Google Scholar] [CrossRef] [Green Version]
  8. Victor, A.; Criqui Michael, H.; Pierre, A.; Allison Matthew, A.; Creager Mark, A.; Diehm, C.; Fowkes, F.; Gerry, R.; Hiatt William, R.; Björn, J.; et al. Measurement and interpretation of the ankle-brachial index. Circulation 2012, 126, 2890–2909. [Google Scholar]
  9. MacDougall, A.M.; Tandon, V.; Rn, M.P.W.; Wilson, T.W. Oscillometric measurement of the ankle-brachial index. Can. J. Cardiol. 2008, 24, 49–51. [Google Scholar] [CrossRef] [Green Version]
  10. Beckman, J.A.; Higgins, C.O.; Gerhard-Herman, M. Automated oscillometric determination of the ankle–brachial index provides accuracy necessary for office practice. Hypertension 2006, 47, 35–38. [Google Scholar] [CrossRef]
  11. Ramanathan, A.; Conaghan, P.J.; Jenkinson, A.D.; Bishop, C.R. Comparison of ankle-brachial pressure index measurements using an automated oscillometric device with the standard doppler ultrasound technique. ANZ J. Surg. 2003, 73, 105–108. [Google Scholar] [CrossRef]
  12. Herráiz-Adillo, Á.; Martínez-Vizcaíno, V.; Cavero-Redondo, I.; Álvarez-Bueno, C.; Garrido-Miguel, M.; Notario-Pacheco, B. Diagnostic accuracy study of an oscillometric ankle-brachial index in peripheral arterial disease: The influence of oscillometric errors and calcified legs. PLoS ONE 2016, 11, e0167408. [Google Scholar] [CrossRef]
  13. Kario, K.; Thijs, L.; Staessen, J.A. Blood pressure measurement and treatment decisions: Masked and white-coat hypertension. Circul. Res. 2019, 124, 990–1008. [Google Scholar] [CrossRef]
  14. Challoner, A.V.J. Photoelectric plethysmography for estimating cutaneous blood flow. Non Invasive Physiol. Meas. 1979, 1, 125–151. [Google Scholar]
  15. Georgieva-Tsaneva, G.; Gospodinova, E.; Gospodinov, M.; Cheshmedzhiev, K. Portable sensor system for registration, processing and mathematical analysis of ppg signals. Appl. Sci. 2020, 10, 1051. [Google Scholar] [CrossRef] [Green Version]
  16. Liu, S.-H.; Wang, J.-J.; Chen, W.; Pan, K.-L.; Su, C.-H. Classification of photoplethysmographic signal quality with fuzzy neural network for improvement of stroke volume measurement. Appl. Sci. 2020, 10, 1476. [Google Scholar] [CrossRef] [Green Version]
  17. Rusch, T.L.; Sankar, R.; Scharf, J.E. Signal processing methods for pulse oximetry. Comput. Biol. Med. 1996, 26, 143–159. [Google Scholar] [CrossRef]
  18. Gratton, E.; Fantini, S.; Franceschini, M.A.; Gratton, G.; Fabiani, M. Measurements of scattering and absorption changes in muscle and brain. Philos. Trans. R. Soc. Lond. Ser. B Biol. Sci. 1997, 352, 727–735. [Google Scholar] [CrossRef]
  19. Croce, P.; Zappasodi, F.; Merla, A.; Chiarelli, A.M. Exploiting neurovascular coupling: A Bayesian sequential Monte Carlo approach applied to simulated EEG fNIRS data. J. Neural Eng. 2017, 14, 046029. [Google Scholar] [CrossRef]
  20. Allen, J. Photoplethysmography and its application in clinical physiological measurement. Physiol. Meas. 2007, 28, R1. [Google Scholar] [CrossRef] [Green Version]
  21. Lin, Y.; Song, Z.; Yimin, Y. Study of pulse wave velocity noninvasive detecting instrument based on radial artery and finger photoplethysmography pulse wave. In Proceedings of the 2008 International Symposium on Intelligent Information Technology Application Workshops, Shanghai, China, 21–22 December 2008; pp. 705–708. [Google Scholar]
  22. Huotari, M.; Vehkaoja, A.; Määttä, K.; Kostamovaara, J. Photoplethysmography and its detailed pulse waveform analysis for arterial stiffness. J. Struct. Mech. 2011, 44, 345–362. [Google Scholar]
  23. Otsuka, T.; Kawada, T.; Katsumata, M.; Ibuki, C.; Kusama, Y. Independent determinants of second derivative of the finger photoplethysmogram among various cardiovascular risk factors in middle-aged men. Hypertens. Res. 2007, 30, 1211. [Google Scholar] [CrossRef] [Green Version]
  24. Pilt, K.; Meigas, K.; Ferenets, R.; Temitski, K.; Viigimaa, M. Photoplethysmographic signal waveform index for detection of increased arterial stiffness. Physiol. Meas. 2014, 35, 2027. [Google Scholar] [CrossRef] [Green Version]
  25. Gonzalez, R.; Manzo, A.; Delgado, J.; Padilla, J.M.; Trénor, B.; Saiz, J. A computer based photoplethysmographic vascular analyzer through derivatives. In Proceedings of the 2008 Computers in Cardiology, Bologna, Italy, 14–17 September 2008; pp. 177–180. [Google Scholar]
  26. Chiarelli, A.M.; Bianco, F.; Perpetuini, D.; Bucciarelli, V.; Filippini, C.; Cardone, D.; Zappasodi, F.; Gallina, S.; Merla, A. Data-driven assessment of cardiovascular ageing through multisite photoplethysmography and electrocardiography. Med. Eng. Phys. 2019, 73, 39–50. [Google Scholar] [CrossRef]
  27. Mcauliffe, J.D.; Blei, D.M. Supervised topic models. In Proceedings of the Advances in Neural Information Processing Systems, Montreal, Canada, 3–8 December 2008; pp. 121–128. [Google Scholar]
  28. Monti, M.M. Statistical analysis of fMRI time-series: A critical review of the GLM approach. Front. Hum. Neurosci. 2011, 5, 28. [Google Scholar] [CrossRef] [Green Version]
  29. Perpetuini, D.; Cardone, D.; Filippini, C.; Chiarelli, A.M.; Merla, A. Modelling impulse response function of functional infrared imaging for general linear model analysis of autonomic activity. Sensors 2019, 19, 849. [Google Scholar] [CrossRef] [Green Version]
  30. Chiarelli, A.M.; Romani, G.L.; Merla, A. Fast optical signals in the sensorimotor cortex: General Linear Convolution Model applied to multiple source–detector distance-based data. NeuroImage 2014, 85, 245–254. [Google Scholar] [CrossRef]
  31. Betge, S.; Kretzschmar, D.; Figulla, H.-R.; Lichtenauer, M.; Jung, C. Predictive value of the augmentation index derived vascular age in patients with newly diagnosed atherosclerosis. Heart Vessel. 2017, 32, 252–259. [Google Scholar] [CrossRef] [Green Version]
  32. McEniery, C.M.; Hall, I.R.; Qasem, A.; Wilkinson, I.B.; Cockcroft, J.R.; Investigators, A. Normal vascular aging: Differential effects on wave reflection and aortic pulse wave velocity: The Anglo-Cardiff Collaborative Trial (ACCT). J. Am. Coll. Cardiol. 2005, 46, 1753–1760. [Google Scholar] [CrossRef] [Green Version]
  33. Zweig, M.H.; Campbell, G. Receiver-operating characteristic (ROC) plots: A fundamental evaluation tool in clinical medicine. Clin. Chem. 1993, 39, 561–577. [Google Scholar] [CrossRef]
  34. Vinciguerra, V.; Ambra, E.; Maddiona, L.; Romeo, M.; Mazzillo, M.; Rundo, F.; Fallica, G.; di Pompeo, F.; Chiarelli, A.M.; Zappasodi, F. PPG/ECG Multisite Combo System Based on SiPM Technology. In Convegno Nazionale Sensori; Springer: Catania, Italy, 2018; pp. 353–360. [Google Scholar]
  35. Perpetuini, D.; Chiarelli, A.M.; Maddiona, L.; Rinella, S.; Bianco, F.; Bucciarelli, V.; Gallina, S.; Perciavalle, V.; Vinciguerra, V.; Merla, A. Multi-Site Photoplethysmographic and Electrocardiographic System for Arterial Stiffness and Cardiovascular Status Assessment. Sensors 2019, 19, 5570. [Google Scholar] [CrossRef] [Green Version]
  36. Perpetuini, D.; Chiarelli, A.M.; Vinciguerra, V.; Vitulli, P.; Rinella, S.; Cardone, D.; Bianco, F.; Perciavalle, V.; Gallina, S.; Fallica, G. Integrated multi-channel PPG and ECG system for cardiovascular risk assessment. Proceedings 2019, 27, 8. [Google Scholar] [CrossRef] [Green Version]
  37. Chiarelli, A.M.; Libertino, S.; Zappasodi, F.; Mazzillo, M.C.; Di Pompeo, F.; Merla, A.; Lombardo, S.A.; Fallica, G.P. Characterization of a fiber-less, multichannel optical probe for continuous wave functional near-infrared spectroscopy based on silicon photomultipliers detectors: In-vivo assessment of primary sensorimotor response. Neurophotonics 2017, 4, 035002. [Google Scholar] [CrossRef] [Green Version]
  38. Vinciguerra, V.; Ambra, E.; Maddiona, L.; Oliveri, S.; Romeo, M.F.; Mazzillo, M.; Rundo, F.; Fallica, G. Progresses towards a processing pipeline in photoplethysmogram (PPG) based on SiPMs. In Proceedings of the 2017 European Conference on Circuit Theory and Design (ECCTD), Catania, Italy, 4–6 September 2017; pp. 1–5. [Google Scholar]
  39. Moeinzadeh, H.; Assad, J.; Bifulco, P.; Cesarelli, M.; O’Loughlin, A.; Shugman, I.M.; Gargiulo, G.D. Einthoven Unipolar Leads: Towards a better understanding of Wilson Central Terminal. In Proceedings of the 2019 International Conference on Electrical Engineering Research & Practice (ICEERP), Sydney, Australia, 24–28 November 2019; pp. 1–4. [Google Scholar]
  40. Chiarelli, A.M.; Maclin, E.L.; Low, K.A.; Mathewson, K.E.; Fabiani, M.; Gratton, G. Combining energy and Laplacian regularization to accurately retrieve the depth of brain activity of diffuse optical tomographic data. J. Biomed. Opt. 2016, 21, 36008. [Google Scholar] [CrossRef] [Green Version]
  41. Schultz-Ehrenburg, U.; Blazek, V. Value of quantitative photoplethysmography for functional vascular diagnostics. Skin Pharmacol. Physiol. 2001, 14, 316–323. [Google Scholar] [CrossRef]
  42. Lazazzera, R.; Belhaj, Y.; Carrault, G. A new wearable device for blood pressure estimation using photoplethysmogram. Sensors 2019, 19, 2557. [Google Scholar] [CrossRef] [Green Version]
  43. Vehtari, A.; Gelman, A.; Gabry, J. Practical Bayesian model evaluation using leave-one-out cross-validation and WAIC. Stat. Comput. 2017, 27, 1413–1432. [Google Scholar] [CrossRef] [Green Version]
  44. Hsu, H.; Lachenbruch, P.A. Paired t test. In Wiley Encyclopedia of Clinical Trials; Wiley: Hobeken, NJ, USA, 2007; pp. 1–3. [Google Scholar]
  45. Cohen, P.; West, S.G.; Aiken, L.S. Applied Multiple Regression/Correlation Analysis for the Behavioral Sciences; Psychology Press: East Sussex, UK, 2014; ISBN 1-135-46825-7. [Google Scholar]
  46. Bland, J.M.; Altman, D. Statistical methods for assessing agreement between two methods of clinical measurement. Lancet 1986, 327, 307–310. [Google Scholar] [CrossRef]
  47. Dewitte, K.; Fierens, C.; Stöckl, D.; Thienpont, L.M. Application of the Bland–Altman plot for interpretation of method-comparison studies: A critical investigation of its practice. Clin. Chem. 2002, 48, 799–801. [Google Scholar] [CrossRef]
  48. Krouwer, J.S. Why Bland–Altman plots should use X, not (Y + X)/2 when X is a reference method. Stat. Med. 2008, 27, 778–780. [Google Scholar] [CrossRef]
  49. Hanley, J.A.; McNeil, B.J. The meaning and use of the area under a receiver operating characteristic (ROC) curve. Radiology 1982, 143, 29–36. [Google Scholar] [CrossRef] [Green Version]
  50. LeCun, Y.; Bengio, Y.; Hinton, G. Deep learning. Nature 2015, 521, 436–444. [Google Scholar] [CrossRef]
Figure 1. (a) Pictures of the Enverdis Vascular Explorer device; (b) example of the Vascular Explorer probes and cuffs placement on a participant.
Applsci 10 02137 g001
Figure 2. (a) Homemade multi-channel Photoplethysmographic (PPG) and Electrocardiographic (ECG) system; (b) PPG probe composed by a light emitting diode at 940 nm of wavelength and a silicon photomultiplier (SiPM) detector; (c) example of PPG probes and ECG electrode placement on a subject arm and schematic locations of the PPG probes and ECG electrodes on a body template.
Applsci 10 02137 g002
Figure 3. Preprocessing steps for ECG and PPG signals and an example of pulse average ECG and PPG and their standard errors (shaded areas), showing the small variability of the signals.
Applsci 10 02137 g003
Figure 4. (a) Correlation plot of PPG-ABI and VE-ABI; (b) Bland–Altman plot of PPG-ABI and VE-ABI.
Applsci 10 02137 g004
Figure 5. ROC of PPG-ABI in assessing cardiovascular risk (0.9 ≤ VE-ABI ≤ 1.4 vs. 0.9 VE-ABI < 0.9 or VE-ABI > 1.4).
Applsci 10 02137 g005
Table 1. Average cross-validated β-values and relative t-scores and p-values estimated through general linear model (GLM) in ankle-brachial index (ABI) prediction.
Normalized (z-scored) Regressorβ-Valuet-Statp-Value
MaxArm0.030.4380.662
MaxAnkle0.172.5260.013
SlopeArm0.020.3290.743
SlopeAnkle0.141.9410.054
TDArm0.09−1.2700.206
TDAnkle−0.20−2.5590.012
Ankle-Arm0.517.782~0
Table 2. Confusion matrix obtained for a specific threshold of PPG-ABI in predicting pathological VE-ABI.
PositiveNegativeTOT
CountsPathological ABI18624
Normal ABI11111122
%Pathological ABI7525100
Normal ABI991100

