Article

Application of Raman Spectroscopy for Characterizing Synthetic Non-Metallic Inclusions Consisting of Calcium Sulphide and Oxides

1
Process Metallurgy Research Unit, University of Oulu, P.O. Box 4300, FI–90014 Oulu, Finland
2
Nano and Molecular Systems Research Unit (NANOMO), University of Oulu, P.O. Box 4300, FI–90014 Oulu, Finland
*
Author to whom correspondence should be addressed.
Appl. Sci. 2020, 10(6), 2113; https://doi.org/10.3390/app10062113
Submission received: 25 February 2020 / Revised: 11 March 2020 / Accepted: 12 March 2020 / Published: 20 March 2020
(This article belongs to the Special Issue Imaging and Characterization of Applied Materials)

Abstract

:
The presence of non-metallic inclusions (NMI) such as sulphides and oxides may be detrimental to the control of the steel casting process and product quality. The need for their identification and characterization is, therefore, urgent. This study uses time-gated Raman spectroscopy for the characterization of synthetic duplex oxide-sulphide phases that contain CaS and the oxide phases of Al2O3, CA, C12A7, C3A, and MgO·Al2O3 (MA). Binary phase samples of CaS–MA, C3A–CaS, C12A7–CaS, Al2O3–CaS, and MA–CaS were prepared with varying phase contents. The relative intensities of the Raman peaks were used to estimate the samples’ phase content. For a quantitative estimation, linear regression calibration models were used to evaluate the change in phase content in the samples. The most suitable Raman peak ratios had mean absolute error (MAE) values ranging from 3 to 7 wt. % for the external validation error, and coefficients of determination (R2) values between 0.94 and 0.98. This study demonstrated the use of Raman spectroscopy for the characterization of the calcium sulphide, magnesium aluminate spinel, Al2O3, and calcium aluminate phases of CA, C3A, and C12A7 in a duplex oxide-sulphide system, and it offers potential for inclusion characterization in steel.

1. Introduction

The calcium treatment for aluminum-killed steels is commonly used to modify non-metallic inclusion (NMI) such as Al2O3 to less detrimental inclusions [1,2]. The main aim of the modification of inclusions is the control and transformation of the solid inclusions into fully or partially liquid inclusions by changing their chemical or phase composition. Calcium treatment of Al-killed steels can be used to obtain calcium aluminate inclusions with lower liquidus temperature compared to the steel melt. The use of calcium treatment to achieve more liquid inclusions has the potential to control castability challenges such as submerged entry nozzle (SEN) clogging [3,4] at casting temperatures. The preferred inclusions are either low-melting calcium aluminate inclusions such as C12A7 or C3A and CA, which may be present in partial liquid inclusions [5,6]. However, the occurrence of solid CA2 and CA6 phases should be avoided [5].
Although calcium treatment plays a role in modifying high melting point inclusions, with low Al2O3 activity in the inclusions, elemental sulphur can react with calcium to form CaS inclusions. They are solid at casting temperatures and can be very detrimental to the steel quality [7,8]. For example, studies conducted by researchers [7,8,9] have demonstrated that CaS can be found in steel samples from billet [8] and hot-rolled plates [7]. Additionally, Abdelaziz et al. in 2009 [9] suggested that the formation of CaS may be largely associated with the addition of Ca to liquid steel.
The amount of calcium aluminate phases, such as C12A7, CA, C3A, and calcium sulphides, generally depends on the calcium and sulphur contents, the activity of the aluminum, and the temperature of the molten steel [6]. Therefore, the study of calcium aluminate and sulphide inclusions has received much attention, with various characterization techniques, such as SEM-EDS (scanning electron microscopy-energy dispersive X-ray spectroscopy [7,8], confocal scanning laser microscopy (CSLM) [10], and others [3], used to understand the transformation and control measures for inclusions. Using Raman spectroscopy presents a potential characterization technique for inclusion studies. The utilization of Raman spectroscopy as a characterization technique may perform better than conventional methods when comparing the duration for sample preparation and the acquisition of measurement results.
Additionally, phases such as Al2O3, MgO∙Al2O3, C12A7, CA, C3A, and CaS have been measured and demonstrated to be Raman active [11,12,13,14,15]. Furthermore, Raman spectroscopy is found to be applicable in various research fields for quantitative and qualitative analysis [16], including some studies already done on synthetic [17,18] and actual [19] inclusion phase studies. However, spectroscopic techniques like Raman spectroscopy have not been used in detail to study duplex oxide-sulphide inclusions like C12A7-CaS, C3A-CaS, and CA-CaS. These duplex oxide-sulphides have been demonstrated by researchers [20,21,22] to be present in some steel samples. Other inclusions could also be possible, for example, Al2O3–CaS and MgAl2O4–CaS, which could be the intermediate product during calcium treatment [23,24].
The authors’ previous studies focused on the use of Raman spectroscopy for characterizing calcium-aluminate (CaO-Al2O3) inclusions [17] and calcium aluminate–spinel (MgAl2O4) [18] in a binary system. However, these studies were limited to only oxides, and the application of Raman spectroscopy for characterizing potential detrimental sulphide inclusions such as CaS associated with oxides were not studied. Furthermore, the literature [25] has suggested that free CaS is rarely observed compared with CaS associated with modified calcium aluminate inclusions that may be partly liquid by characterizing steel samples from plant trials with varying calcium additions. The above studies [20,21,22,23,24,25] show the need to characterize duplex oxide-sulphide inclusions.
This study examined the applicability of Raman spectroscopy to characterize synthetic duplex oxide-sulphide inclusions consisting of calcium aluminate, the sulphide binary phases of CA–CaS, C12A7–CaS, and C3A–CaS. Additionally, characterization of Al2O3–CaS and MgO∙Al2O3–CaS samples was studied.

2. Materials and Methods

2.1. Material

The chemicals used for this study were aluminum oxide (Al2O3), calcium oxide (CaO), monocalcium aluminate CaO∙Al2O3 (CA), calcium sulphide (CaS), and aluminate spinel, MgO∙Al2O3 (MA). The chemical powders had a purity that ranged from 99.7% to 99.9% and were all obtained from Alfa Aesar.

2.2. Methods

Sample Preparation

C3A and C12A7 phases were prepared from aluminum oxide (Al2O3) and calcium oxide (CaO) powders, based on the CaO/Al2O3 ratios within a CaO–Al2O3 binary system. Sample pellets were prepared and sintered in a chamber furnace at a temperature of 1350 °C, and the process was repeated to achieve C3A and C12A7 phase samples.
The required proportions of the phases (C12A7, CA, C3A, Al2O3, CaS, and MgO∙Al2O3) were used to prepare the synthetic binary phase samples. Thorough mixing was carried out to ensure that the binary phase samples were homogenous. Sintering at a higher temperature is unsuitable for preparing the synthetic phase samples because CaS is very sensitive to heat. Careful mixing was therefore carried out several times to achieve homogenous samples. The homogeneity of the prepared binary samples was verified using both X-ray diffraction (XRD) and X-ray fluorescence (XRF) analysis by measuring replicates of the same sample.

2.3. Analytical Techniques

XRD and XRF were both used to verify the prepared samples to estimate the phase weight percentage and for elemental composition analysis.

2.3.1. X-ray Diffraction (XRD)

The XRD instrument used for the sample phase identification in this study was the Rigaku SmartLab 9 KW model. The instrument setup included a Cu source lamp with 45 kV and 200 mA settings (9 kW rotating anode) and Bragg–Brentano para-focusing geometry (300 mm goniometer) and had an acquisition speed of 3 degrees per min with 0.02 degrees per step. Other features were 5-degree Soller slits used on both sources and a 10-mm limiting slit located at the source side of the samples in standard glass holders and on the analyser side.

2.3.2. X-ray Fluorescence (XRF)

The University of Oulu’s Centre for Material Analysis provided XRF to conduct an elemental analysis on the prepared samples to estimate the elemental composition. The XRF instrument used for this study is Panalytical, with a maximum power of 4 kW, Axios Max model, with a setup consisting of an X-ray generator Rh tube. SuperQ was the analysis software used for elemental analysis.

2.3.3. Raman Spectroscopy

Raman spectroscopy is a vibrational spectroscopic analytical technique that operates on a principle based on an inelastic scattering of monochromatic light which creates a change in energy to study the vibrational and rotational modes of the excited molecules of a sample [26,27]. This change in energy in a sample during Raman spectroscopy measurement is considered a characteristic of the vibrational modes of the molecule in the material. The Raman spectrum thus acquired from a sample is regarded as the fingerprint of the individual component present in the sample.
The Raman spectrum obtained from a sample has some features, such as peak intensity, peak or shift (band) position, and full width at half maximum (FWHM), which provide information concerning the components in the material measured with Raman spectroscopy. For example, the Raman shift (band) position illustrates the material’s phase or stoichiometric content, while the peak intensity (I) or area shows the sample’s phase component concentration. The use of Raman spectroscopy as a characterization technique has also gained application in various fields, such as medicine, steelmaking for slag studies [16], and other research sectors.
A TimeGated® Raman spectrometer (TG532 M1) supplied by TimeGated Instruments Ltd., Oulu, Finland was used in this study. Some of the device’s features include a spectrometer equipped with a pulsed laser of 532 nm, with a pulse width of 150 picosecond (ps) and a fiber-coupled frequency range from 40 to 100 kHz. The instrument setup also had a probe head made of 200 µm collection fibre with a spot size of 1 mm, a laser with a spectral width of less than 0.1 nm, a complementary metal oxide semiconductor (CMOS) single-photon avalanche diode (SPAD) CMOS-SPAD array detector, a Photonics RPB532 w/105 µm excitation fibre, a fibre-coupled spectrograph, and delay electronics.
The Raman spectroscopy measurements were made at ambient conditions with a wavenumbers range of 100–1100 cm−1, a spectra acquisition time of 1–3 min, and a resolution of 10 cm−1. Each sample was measured five times with the Raman spectroscopy, with mixing done (for homogeneity) on the same after each measurement. A rotating sample holder stage to obtain an average spectrum for each batch of the measured sample was used. These steps were considered to ensure good repeatability and to reduce the effect of sample inhomogeneity. The Raman data used for this study was obtained from the averaged signal of five measurements per sample. The Raman spectra obtained from each sample were relatively stable; therefore, the variability of the Raman signal in the Raman data within each sample measured was found insignificant. The pre-processing software package provided by TimeGated Instrument treated the signal with the background subtraction. The time-gated Raman spectroscopy (TimeGated®) used for this study was designed for effective fluorescence suppression compared to conventional Raman spectroscopy.

2.4. Calibration Model

The study used a calibration model to establish a relationship between different Raman peak ratios and the samples’ phase content. The calibration model was used to examine variance in the phase content in a sample by using the total Raman spectrum to describe the relative intensities of the peaks present in the Raman spectrum. A calibration feature candidate for this study is expressed as:
x c = I k ( I n + I k ) ,
where Ik is the intensity for the Raman shift k, xc is the calibration feature candidate, and In represents the intensity corresponding to the Raman shift n. The use of relative intensities treats the signal similarly as does the unit normalization, and thus additional normalization was not carried out. The average mean absolute error (MAE) was calculated using 4N repetitions for the cross-validation and a detailed description of how the calibration model identification and the selection process were conducted can be found in [18].

3. Results and Discussion

3.1. Reference Data

Figure 1 and Figure 2 illustrate some examples of XRD spectra for binary samples of MA–CaS and CaS–Al2O3, prepared for phase identification and measured with an XRD instrument. Figure 1 represents XRD spectra for selected samples for CaS–MA, where (i), (ii), and (iii) correspond to the 20%, 60%, and 80% phase fractions of CaS in the sample. Similarly, Figure 2 also shows Al2O3–CaS, where (a), (b), and (c) correspond to the 20%, 60%, and 80% phase fractions of CaS in the sample. To further examine and verify the samples’ component, XRF measurements were made for elemental compositional analysis.
These two analytical techniques were considered in this study as complementary methods, where XRD provided information concerning individual phase weight percentage in the sample, and XRF for estimating the elemental composition of the prepared samples [28]. Table 1 and Table 2 illustrate some examples of binary samples (MA–CaS and CaS–Al2O3) used to establish a relationship between the initial sample composition and composition by XRD and XRF analysis. The XRD and XRF data were obtained from the samples where the phases estimated based on elemental analysis from XRF were compared with the phase weight percentages for the samples’ XRD composition. Table 1 shows the values for the initial sample composition, XRD, and XRF analysis for MA–CaS, and Table 2 represents a binary sample for Al2O3–CaS, which served as a comparison for initial sample composition and XRD and XRF results.

3.2. Analysis of Phase Content Based on Raman Spectra

The main Raman band (shift) identified from the Raman spectroscopy measurements for each specified phase used to prepare the samples was compared with previous studies [11,12,13,14,15]. Table 3 shows the Raman shift or band (cm−1) for measured samples in this work and the published reference materials. Figure 3 illustrates the Raman spectra for the initial phases used to prepare the binary samples.
The observations made for the samples measured with Raman spectroscopy show that a change in phase content in the binary samples system may have a corresponding effect on the relative intensity of the peaks. They are presented in Figure 4, Figure 5, Figure 6, Figure 7 and Figure 8. Section 2.3.3 briefly describes the information that can be obtained from the intensity of a Raman peak for Raman spectroscopy measurements. Figure 4, Figure 5, Figure 6, Figure 7 and Figure 8 are, therefore, used to qualitatively explain how the relative intensity of the peaks associated with a specific phase can be used to estimate the particular phase content present in the samples.

3.2.1. CA–CaS and MgO∙Al2O3 (MA)–CaS Samples

The Raman spectra shown in Figure 4 are for samples containing CaS and magnesium aluminate (MA) spinel, and are used to explain how a change in a sample’s phase content can affect the relative Raman intensity. Figure 4 shows that an increment in the CaS phase fraction in the MA–CaS samples showed a corresponding rise in the Raman shift (band) within a region of 157–162 cm−1. This increase in intensity within this Raman shift region relates to when the phase content for CaS increased, because the most intense peak for this phase was around 157 cm−1. Additionally, for the MA–CaS samples, an increase in the MA phase content showed a corresponding increase in the Raman shift in the region of 410–420 cm−1 and can be attributed to this phase, because the most intense Raman shift located at 412 cm−1 was a Raman peak feature associated with the MA phase.
Figure 5 presents the Raman spectra obtained from the binary samples consisting of CA and CaS, where it can be observed that an increase in the CA phase fraction had Raman spectra, illustrating an increase in peak intensity in the region of 520–524 cm−1. CA’s most intense Raman shift (band) was observed at approximately 524 cm−1, and the Raman peak within the range of 520–524 cm−1 only increased with a corresponding increase in the phase fraction of CA in the CA–CaS samples. Furthermore, an increase in the CA phase content illustrated a characteristic feature, with the appearance of a peak shoulder in the 545–549 cm1 region. Varying the phase content in the CA–CaS samples provided a similar observation to the one made in Figure 4, where an increment in the phase fraction of CaS demonstrated a rising peak intensity in the Raman shift in the region of 157–162 cm−1.

3.2.2. C12A7–CaS and C3A–CaS Samples

Figure 6 and Figure 7 show the Raman spectra for binary samples for the calcium aluminate phases of C12A7, C3A, and calcium sulphide (CaS). Figure 6 presents the samples that contain CaS and C12A7, showing that when the phase fraction of C12A7 in the sample increased, a corresponding increase in the Raman shift in the region of 517–520 cm−1 was observed. This rise in intensity may be associated with the increasing phase fraction of C12A7, because the most intense Raman peak for this phase was located around 517 cm−1.
For the samples comprising C3A and CaS, an increase in the peak intensity within the Raman shift in the region of 756–765 cm−1 could also be observed. This may be related to the increase in the phase content of C3A. The peak within the Raman shift in the region of 756–766 cm−1 also increased when the phase fraction of C3A in the sample increased. These phenomena can also be observed in Figure 7 for the C3A–CaS samples. Additionally, the most intense peak for C3A in this study was located at approximately 766 cm−1. The comparison between the change in phase fraction for CaS and relative Raman intensity for the spectra presented in Figure 6 for C12A7–CaS and Figure 7 for C3A–CaS all showed that an increase in CaS content corresponded to an increase in the Raman shift in the region of 157–162 cm−1.
For the CaS–Al2O3 samples, the Raman spectra shown in Figure 8 demonstrate that a change in the phase fraction of Al2O3 resulted in a relative Raman shift in the region of 420–425 cm−1. A similar trend in the effect of change on CaS for CaS–Al2O3 can be observed in the Raman spectra shown in Figure 8 compared with Figure 4, Figure 5, Figure 6 and Figure 7. Therefore, based on Figure 4, Figure 5, Figure 6, Figure 7 and Figure 8, the Raman spectroscopy measurements made for the binary samples of MA–CaS, CA–CaS, CaS–C12A7, CaS–C3A, and CaS–Al3O3 provided qualitative information for estimating the individual phase content for a given binary sample.

3.3. Calibration Model for Quantitative Estimation

The individual phases present in the binary samples system were estimated using linear calibration models to establish the relationship between the relative intensities of the Raman shift (band) and the phase fractions. The sample phase content or fraction analyzed using XRD for phase identification and XRF for elemental evaluation were used as the dependent variable for the calibration model. Furthermore, the average values of the coefficient of determination, the mean absolute error values (MAE) and the relative stabilities of the calibration variable candidates were estimated as presented in Table 4, Table 5, Table 6, Table 7 and Table 8. The relationship between the relative stabilities of the calibration variable and the mean absolute error values (MAE) is shown in Figures 9, 11, 13, 15 and 17. Section 2.3 provides a detailed description of how these parameters were evaluated.

3.3.1. CA–CaS Sample

Table 4 shows the results for CA–CaS samples, where the relative intensity ratio for CaS at 157 cm−1 and at 524 cm−1 for CA gave the highest linear regression coefficient of determination value and the lowest mean absolute error value was better than the other peak ratios. The peak ratio of 157/524 also provided generally better relative stability estimated values, as illustrated in Figure 9. A calibration curve constructed between the relative intensity ratios of the measured phase fractions for CaS in the CA–CaS samples is presented in Figure 10. Therefore, based on the evaluations for CA–CaS shown in Figure 9 and Figure 10 and Table 4, the relative intensity ratio, between 157 cm−1 for CaS and 524 cm−1 for CA, demonstrated the most suitable Raman peaks for a phase content analysis of binary CA–CaS samples. Additionally, these peaks, according to Figure 5, were the phases’ most intense peaks.

3.3.2. MgO∙Al2O3 (MA)–CaS Samples

Table 5 shows estimated values for the coefficient of determination and mean absolute error (MAE) relative stability for samples of MA–CaS. The ratio of the intensities for Raman shifts at 412 cm−1 for MA, and at 157 cm−1 for CaS, showed a better coefficient of determination (R2), and the lowest MAE value. Figure 11 also demonstrates from the relative stability analysis that a relative intensity ratio between 157 cm−1 and 412 cm−1 performed better than the other peaks used in this study. A linear regression constructed between a relative intensity of 412/157 cm−1 and a phase fraction for MA in the MA–CaS system is presented in Figure 12. In this study, the most intense Raman peaks at 416 cm−1 for MA and 157 cm−1 for CaS were the most suitable peaks for Raman spectroscopy quantitative analysis for samples containing only MA–CaS.

3.3.3. C12A7–CaS Samples

According to the analysis presented in Table 6, C12A7–CaS binary samples that indicated a peak intensity ratio for the Raman peak at 517 cm−1 for C12A7 and 416 cm−1 for MA were the most suitable selection in this study, compared to the other identified peaks ratios. The coefficient of determination values and the MAE for a peak ratio of 517/157 were the best values. Additionally, the ratio of the suggested peaks (517/157) with better values in Table 6 can be observed as the most intense Raman peaks for C12A7 and CaS, as illustrated in the previous figure (Figure 6), showing the Raman spectra for C12A7–CaS samples. Furthermore, Figure 13 may explain how the stability of the Raman shift ratio 517/157 performed, compared to other Raman peaks ratios.
Therefore, using a relative intensity ratio of 517/157 for the C12A7–CaS samples provided a potential indicator for the analysis phase fraction changes in C12A7–CaS samples, based on the C12A7/CaS ratio. Figure 14 shows a linear regression plot between the phase content for C12A7 as a function of the relative intensities of 517/157 for C12A7–CaS samples.

3.3.4. C3A–CaS and Al2O3–CaS

Table 7 and Table 8 provide estimated values for binary samples of C3A–CaS and Al2O3–CaS, respectively. In Table 7, the ratio of the intensities of Raman shifts at 756 cm−1 for C3A, and 416 cm−1 for MA, for samples of C3A–CaS had the best coefficient of determination, and better MAE values. Similarly, Table 8 shows that the intensities for a Raman shift at 157 cm−1 for CaS, and 420 cm−1 for Al2O3, had the best value for the coefficient of determination values, with the lowest MAE compared to the other peaks’ ratios for these phases. Figure 15 and Figure 16 also indicate that for all the Raman shift (peaks) identified for CaS, C3A, and Al2O3, the relative stability of the peak ratios for the most intense peaks performed better. Therefore, based on this study, the most intense Raman peaks ratio for C3A–CaS and CaS–Al2O3 with a Raman peak at 756 cm−1 for C3A, Al2O3 at 416 cm−1, and CaS at 157 cm−1 was shown to be most suitable for the quantitative parameters for these samples. Figure 17 and Figure 18 illustrate a linear regression constructed between the relative intensity and phase fraction for C3A in C3A–CaS and the relative intensity and phase fraction for CaS in CaS–Al2O3, respectively.

3.4. Potential Limitations of the Study

The use of Raman spectroscopy as a characterization technique potentially has0020some disadvantages. For example, the delay in response to the detection system and variation in incident laser power may induce measurement noise and decrease the repeatability of the measurements. In addition, the effect of fluorescence could affect the quality of the measured Raman spectra for sensitive samples. However, the samples used for this study were not fluorescence sensitive. Sample inhomogeneity could also contribute to the total error.

3.5. Potential Practical Applications

Depending on the total composition of molten steel, deoxidation regime, and inclusion modification procedure, for example, via calcium treatment, duplex oxide-sulphide inclusions such as CaS–CA, CaS–C12A7, and CaS–Al2O3, can be formed in the steel melt. This study contributes to the applicability of Raman spectroscopy to non-metallic inclusion characterization with a current focus on how to quantify duplex oxide-sulphide inclusions. The most suitable Raman peak ratios for the study exhibited values for a mean absolute error (MAE) for the full data set ranging between 6.23 and 8.87 wt. % and that of the coefficient of determination (R2) between 0.94 and 0.98 for synthetic phases of C12A7, Al2O3, CA, C3A, and MgO∙Al2O3.
This study, therefore, offers the prospect of applying Raman spectroscopy to estimate duplex oxide-sulphide, and combined with previous studies [15,16], to characterize inclusions found in steel samples, because the steel matrix is known to be Raman inactive. Additionally, the potential use of Raman spectroscopy will lead to reduced sample preparation and characterization times and can complement existing steel cleanliness analysis techniques. It is noteworthy that future studies could consider using Raman spectroscopy for a multiphase analysis consisting of three or more phases such as CaS, calcium aluminates, and spinel, because industrial steel samples can contain multiphase inclusions.

4. Conclusions

This study showed that Raman spectroscopy can be used as an analytical technique to estimate phase fractions for a mixture of duplex oxide-sulphide phases. The study can, therefore, be summarized as follows:
  • Raman intensity peak ratios between the values of 157 cm−1 for CaS, 412 cm−1 for MgO∙Al2O3 (MA), 766 cm−1 for C3A, 517 cm−1 for C12A7, and 420 cm−1 for Al2O3 were identified as most suitable for quantifying the binary samples in this study.
  • The linear regression constructed between the relative intensity and phase fraction provided a relatively good coefficient of determination (R2) value, approximately averaged at R2 = 0.96.
  • The calibration model error was assessed in terms of mean absolute error (MAE) with an average value of 7.22 wt. % determined for the full data, and relatively good stability for the most intense Raman peaks for the phases for the set of the studied binary samples.
  • This study presented the prospect of using Raman spectroscopy to characterize inclusions containing CaS.

Author Contributions

Conceptualization, F.G., T.A., M.A., Q.S, and T.F.; Methodology, F.G., T.A., M.A., Q.S., T.V.; software, T.V., and F.G., validation, T.V., and F.G.; formal analysis, F.G; resources, M.H., and T.F.; writing—original draft preparation, F.G.; writing—review and editing, F.G., T.A., M.A., Q.S, T.V., and T.F.; supervision, T.F., M.H., and M.A.; project administration, M.H.; funding acquisition, M.H., and T.F. All authors have read and agreed to the published version of the manuscript.
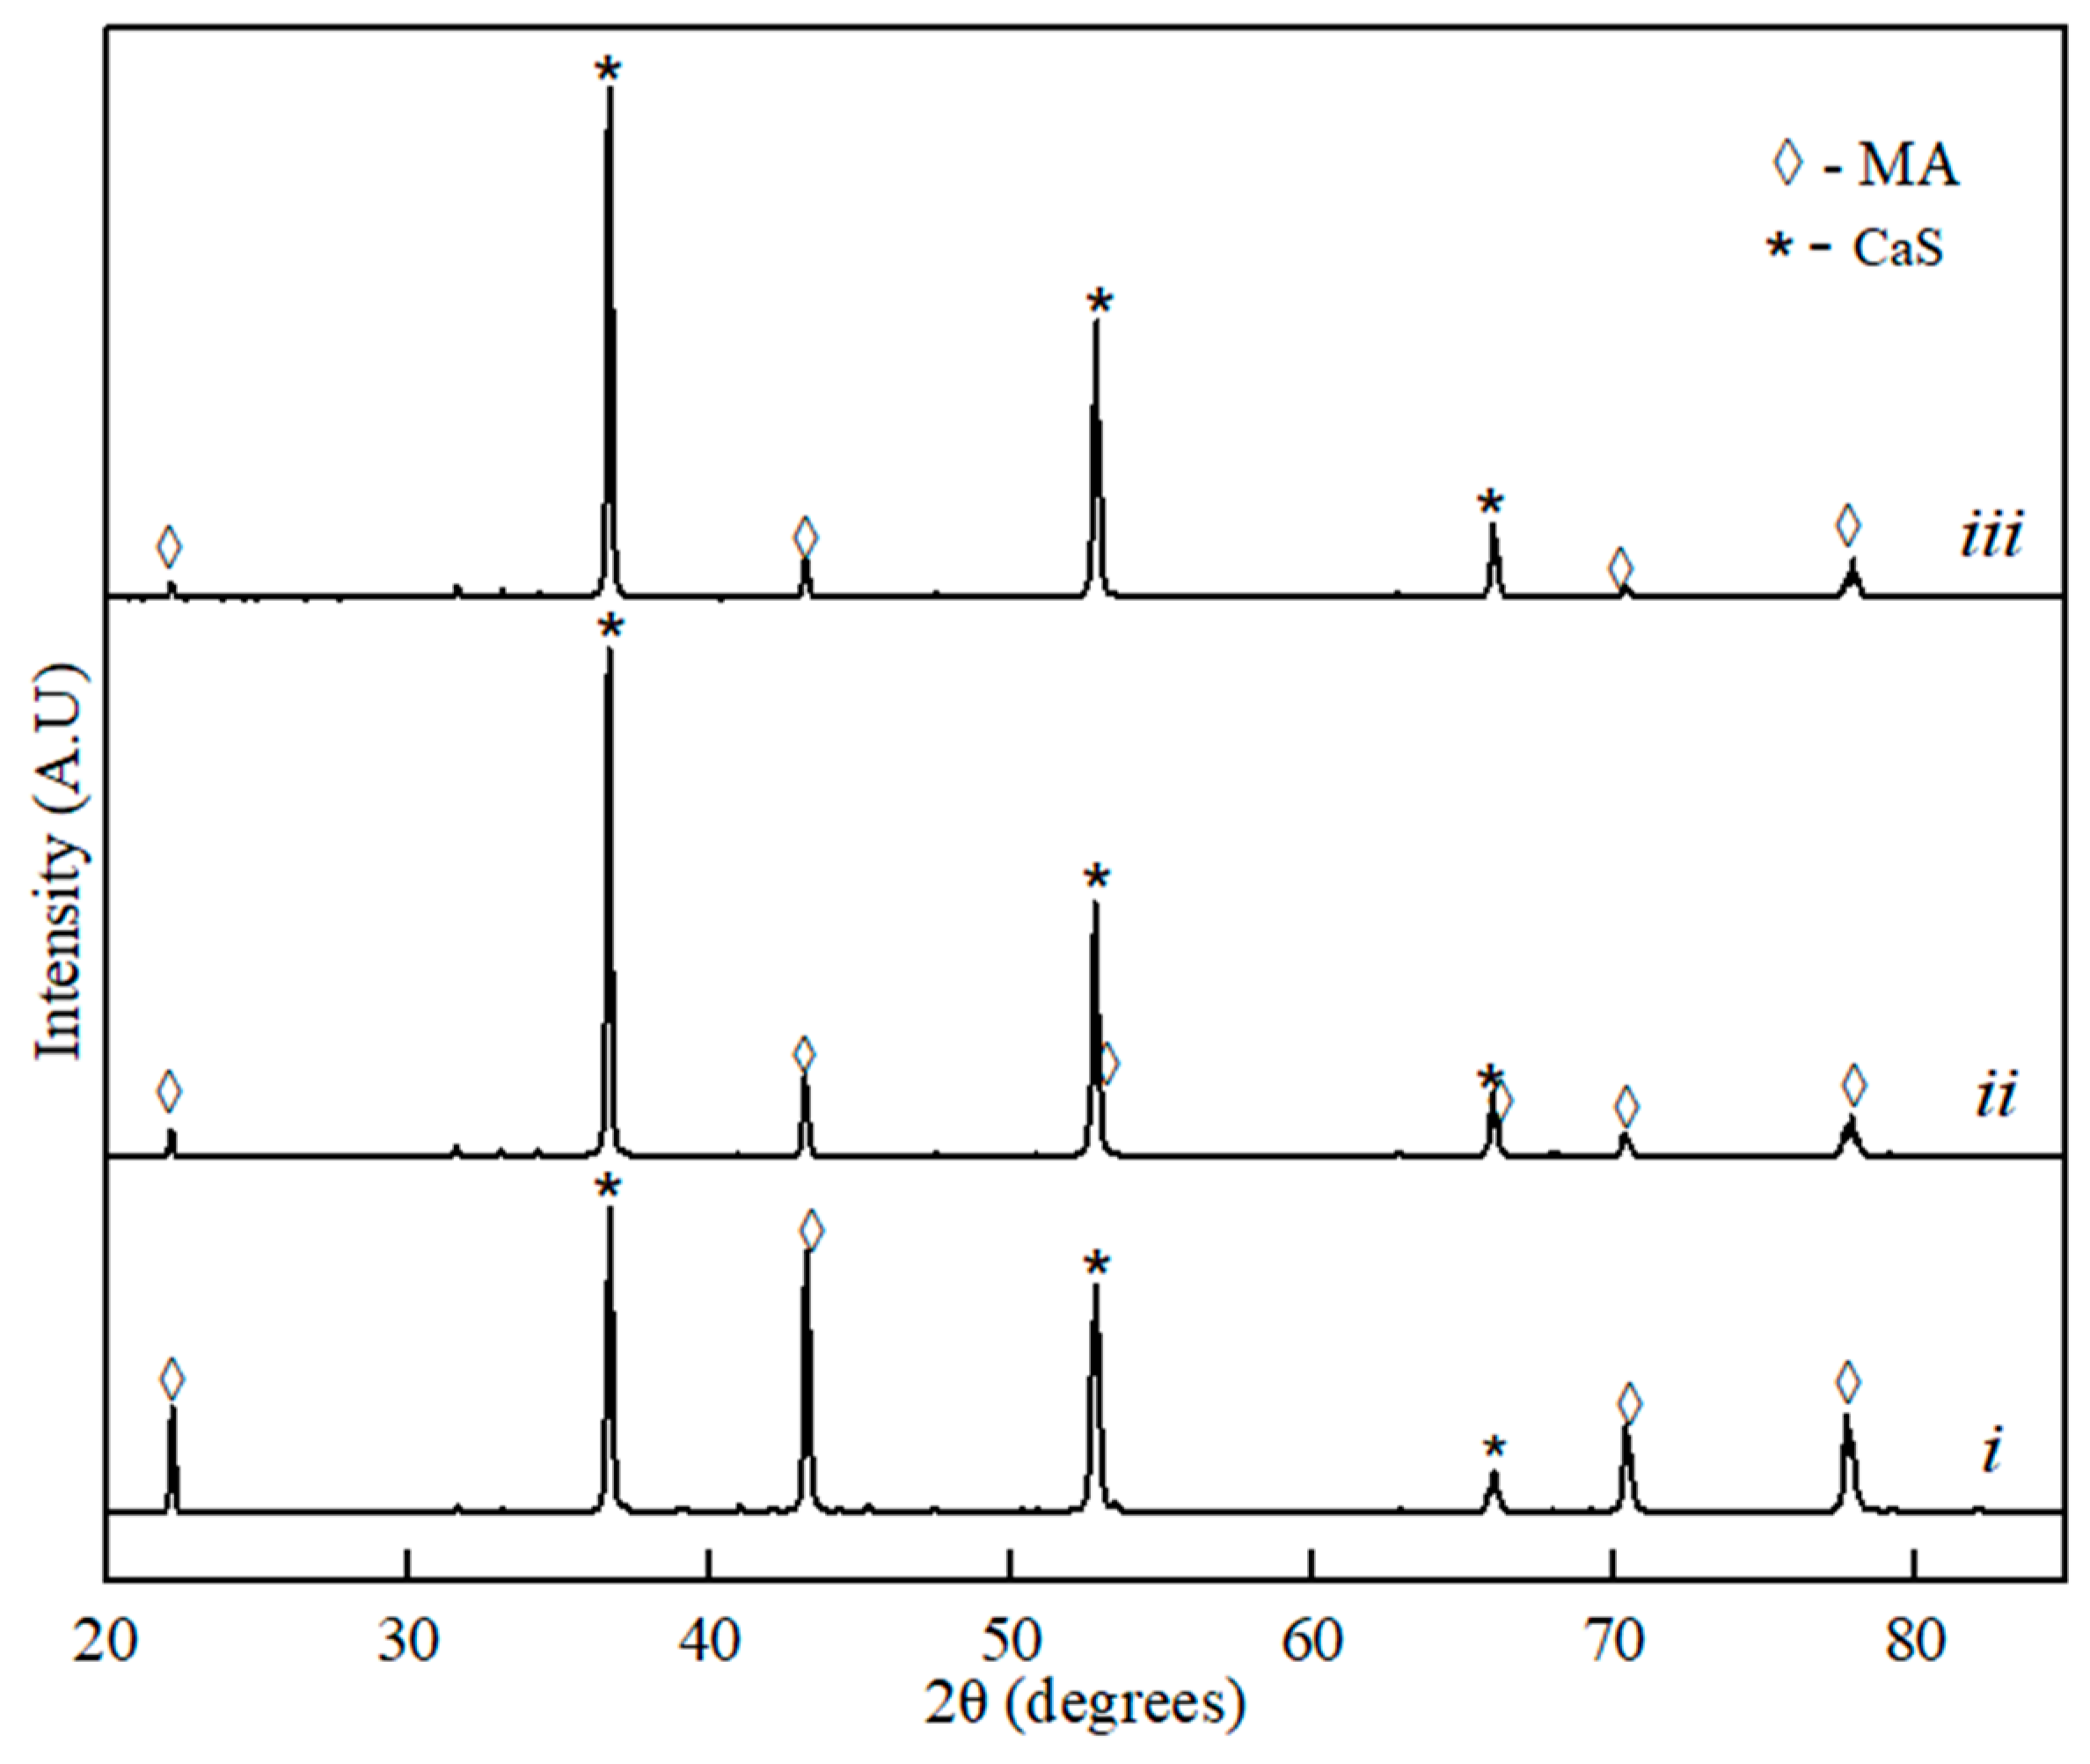
Funding

Research is funded due I4Future doctoral program funded by the European Union’s H2020 under the Marie Skłodowska-Curie grant agreement No. 713606 and the Academy of Finland Profilation Project (Academy of Finland, No. 311934).

Acknowledgments

The authors of this study wish to acknowledge the support of the I4Future doctoral program funded by the European Union’s H2020 under the Marie Skłodowska-Curie grant agreement No. 713606 and the Academy of Finland Profilation Project (Academy of Finland, No. 311934).

Conflicts of Interest

The authors wish to declare no conflict of interest.

References

  1. Tervo, H.; Kaijalainen, A.; Pikkarainen, T.; Mehtonen, S.; Porter, D. Effect of impurity level and inclusions on the ductility and toughness of an ultra-high-strength steel. Mater. Sci. Eng. 2017, 697, 184–193. [Google Scholar] [CrossRef]
  2. Pires, J.C.S.; Garcia, A. Modification of oxide inclusions present in aluminium-killed low carbon steel by addition of calcium. Rem Rev. Esc. Minas 2004, 57, 183–189. [Google Scholar] [CrossRef]
  3. Zhang, L.; Thomas, B.G. State of the Art in Evaluation and Control of Steel Cleanliness. ISIJ Int. 2003, 43, 271–291. [Google Scholar] [CrossRef] [Green Version]
  4. Xu, Z.Y.; Liu, J.H.; He, Z.J.; Pang, Q.H. Study on clogging mechanism of submerged entry nozzle of steel 38CrMoAl. Metalurgija 2018, 57, 79–82. [Google Scholar]
  5. Sun, S.; Waterfall, S.; Strobl, N.; Liao, D.; Holdridge, D. Inclusion control with Ca treatment to improve castability of low carbon Aluminum-killed steel. In Proceedings of the 8th International Symposium on High-Temperature Metallurgical Processing, San Diego, CA, USA, 26 February–2 March 2017; p. 347. [Google Scholar]
  6. Choudhary, S.K.; Ghosh, A. Thermodynamic Evaluation of Formation of Oxide—Sulfide Duplex Inclusions in Steel. ISIJ Int. 2008, 48, 1552–1559. [Google Scholar] [CrossRef] [Green Version]
  7. Zhao, D.; Li, H.; Bao, C.; Yang, J. Inclusion evolution during modification of alumina inclusions by calcium in liquid steel and deformation during hot rolling process. ISIJ Int. 2015, 55, 2115–2124. [Google Scholar] [CrossRef] [Green Version]
  8. Gollapalli, V.; Rao, M.B.V.; Karamched, P.S.; Borra, C.R.; Roy, G.G.; Srirangam, P. Modification of oxide inclusions in calcium-treated Al-killed high sulphur steels. Ironmak. Steelmak. 2019, 46, 663–670. [Google Scholar] [CrossRef] [Green Version]
  9. Abdelaziz, S.; Megahed, G.; El-Mahallawi, I.; Ahmed, H. Control of Ca addition for improved cleanness of low C, Al killed steel. Ironmak. Steelmak. 2009, 36, 432–441. [Google Scholar] [CrossRef]
  10. Wang, Y.; Sridhar, S.; Valdez, M. Formation of CaS on Al2O3-CaO inclusions during solidification of steels. Metall. Mater. Trans. B 2002, 33, 625–632. [Google Scholar] [CrossRef]
  11. Thapa, J.; Liu, B.; Woodruff, S.D.; Chorpening, B.T.; Buric, M.P. Raman scattering in single-crystal sapphire at elevated temperatures. Appl. Opt. 2017, 56, 8598. [Google Scholar] [CrossRef]
  12. Avril, C.; Malavergne, V.; Caracas, R.; Zanda, B.; Reynard, B.; Charon, E.; Bobocioiu, E.; Brunet, F.; Borensztajn, S.; Pont, S.; et al. Raman spectroscopic properties and Raman identification of CaS–MgS–MnS–FeS–Cr2FeS4 sulfides in meteorites and reduced sulfur-rich systems. Meteor Planet Sci. 2013, 48, 1415–1426. [Google Scholar] [CrossRef]
  13. Torréns-Martín, D.; Fernández-Carrasco, L.; Martínez-Ramírez, S.; Ibáñez, J.; Artús, L.; Matschei, T. Raman spectroscopy of anhydrous and hydrated calcium aluminates and sulfoaluminates. J. Am. Ceram. Soc. 2013, 96, 3589–3595. [Google Scholar] [CrossRef] [Green Version]
  14. Dash, S.; Sahoo, R.K.; Das, A.; Bajpai, S.; Debasish, D.; Singh, S.K. Synthesis of MgAl2O4 spinel by thermal plasma and its synergetic structural study. J. Alloys Compd. 2017, 726, 1186–1194. [Google Scholar] [CrossRef]
  15. Neuville, D.R.; Henderson, G.S.; Cormier, L.; Massiot, D. The structure of crystals, glasses, and melts along the CaO-Al2O3 join: Results from Raman, Al L- and K-edge X-ray absorption, and 27Al NMR spectroscopy. Am. Mineral. 2010, 95, 1580–1589. [Google Scholar] [CrossRef]
  16. Joo Park, H. Structure—Property Relationship of CaO-MgO-SiO 2 Slag: Quantitative Analysis of Raman Spectra. Metall. Mater. Trans. B 2013, 44, 938–947. [Google Scholar] [CrossRef]
  17. Gyakwaa, F.; Aula, M.; Alatarvas, T.; Vuolio, T.; Shu, Q.; Huttula, M.; Fabritius, T. Applicability of Time-Gated Raman Spectroscopy in the Characterisation of Calcium-Aluminate Inclusions. ISIJ Int. 2019, 59, 1846–1852. [Google Scholar] [CrossRef]
  18. Gyakwaa, F.; Aula, M.; Alatarvas, T.; Vuolio, T.; Shu, Q.; Huttula, M.; Fabritius, T. Characterisation of Binary Phase Mixtures of Magnesium- Aluminate Spinel and Calcium-Aluminates Using Time-Gated Raman Spectroscopy. ISIJ Int. 2020, 60, 5. [Google Scholar] [CrossRef] [Green Version]
  19. Li, S.; Hihara, L.H. Identification of inclusions in carbon steels using micro-Raman spectroscopy. J. Raman Spectrosc. 2017, 48, 137–142. [Google Scholar] [CrossRef]
  20. Feng Bai, X.; Hui Sun, Y.; Mei Chen, R.; Min Zhang, Y.; Fan Cai, Y. Formation and thermodynamics of CaS-bearing inclusions during Ca treatment in oil casting steels. Int. J. Miner. Metall. Mater. 2019, 26, 573–587. [Google Scholar]
  21. Tang, H.Y.; Wang, Y.; Wu, T.; Li, J.S.; Yang, S.F. Characteristics analysis of inclusion of 60Si2Mn–Cr spring steel via experiments and thermodynamic calculations. Ironmak. Steelmak. 2017, 44, 377–388. [Google Scholar] [CrossRef]
  22. Guo, J.; Cheng, S.; Cheng, Z.; Xin, L. Thermodynamics for precipitation of CaS bearing inclusion and their deformation during rolling process for Al-killed Ca-treated steel. Steel Res. Int. 2013, 84, 545–553. [Google Scholar] [CrossRef]
  23. Verma, N.; Pistorius, P.C.; Fruehan, R.J.; Potter, M.S.; Oltmann, H.G.; Pretorius, E.B. Calcium modification of spinel inclusions in aluminum-killed steel: Reaction steps. Metall. Mater. Trans. B 2012, 43, 830–840. [Google Scholar] [CrossRef]
  24. Verma, N.; Pistorius, P.C.; Fruehan, R.J.; Potter, M.; Lind, M.; Story, S.R. Transient inclusion evolution during modification of alumina inclusions by calcium in liquid steel: Part II. Results and discussion. Metall. Mater. Trans. B. 2011, 42, 720–729. [Google Scholar] [CrossRef]
  25. Geldenhuis, J.M.A.; Pistorius, P.C. Minimisation of calcium additions to low carbon steel grades. Ironmak. Steelmak. 2000, 27, 442–449. [Google Scholar] [CrossRef]
  26. Edwards, H.G.M. Modern Raman Spectroscopy—A Practical Approach; John Wiley and Sons: Chichester, UK, 2005; p. 210. [Google Scholar]
  27. Loudon, R. The Raman Effect in Crystals. Adv. Phys. 2001, 50, 813–864. [Google Scholar] [CrossRef]
  28. Yellepeddi, R.; Bapst, A.; Bonvin, D. Applications of an Integrated XRF-XRD Spectrometer. J. Phys. IV Colloq. 1996, 6, 781–788. [Google Scholar] [CrossRef]
Figure 1. XRD spectra for the binary sample of MgO∙Al2O3 (MA)–CaS: (i) 20% of CaS, (ii) 60% of CaS, and (iii) 80% of the CaS phase component.
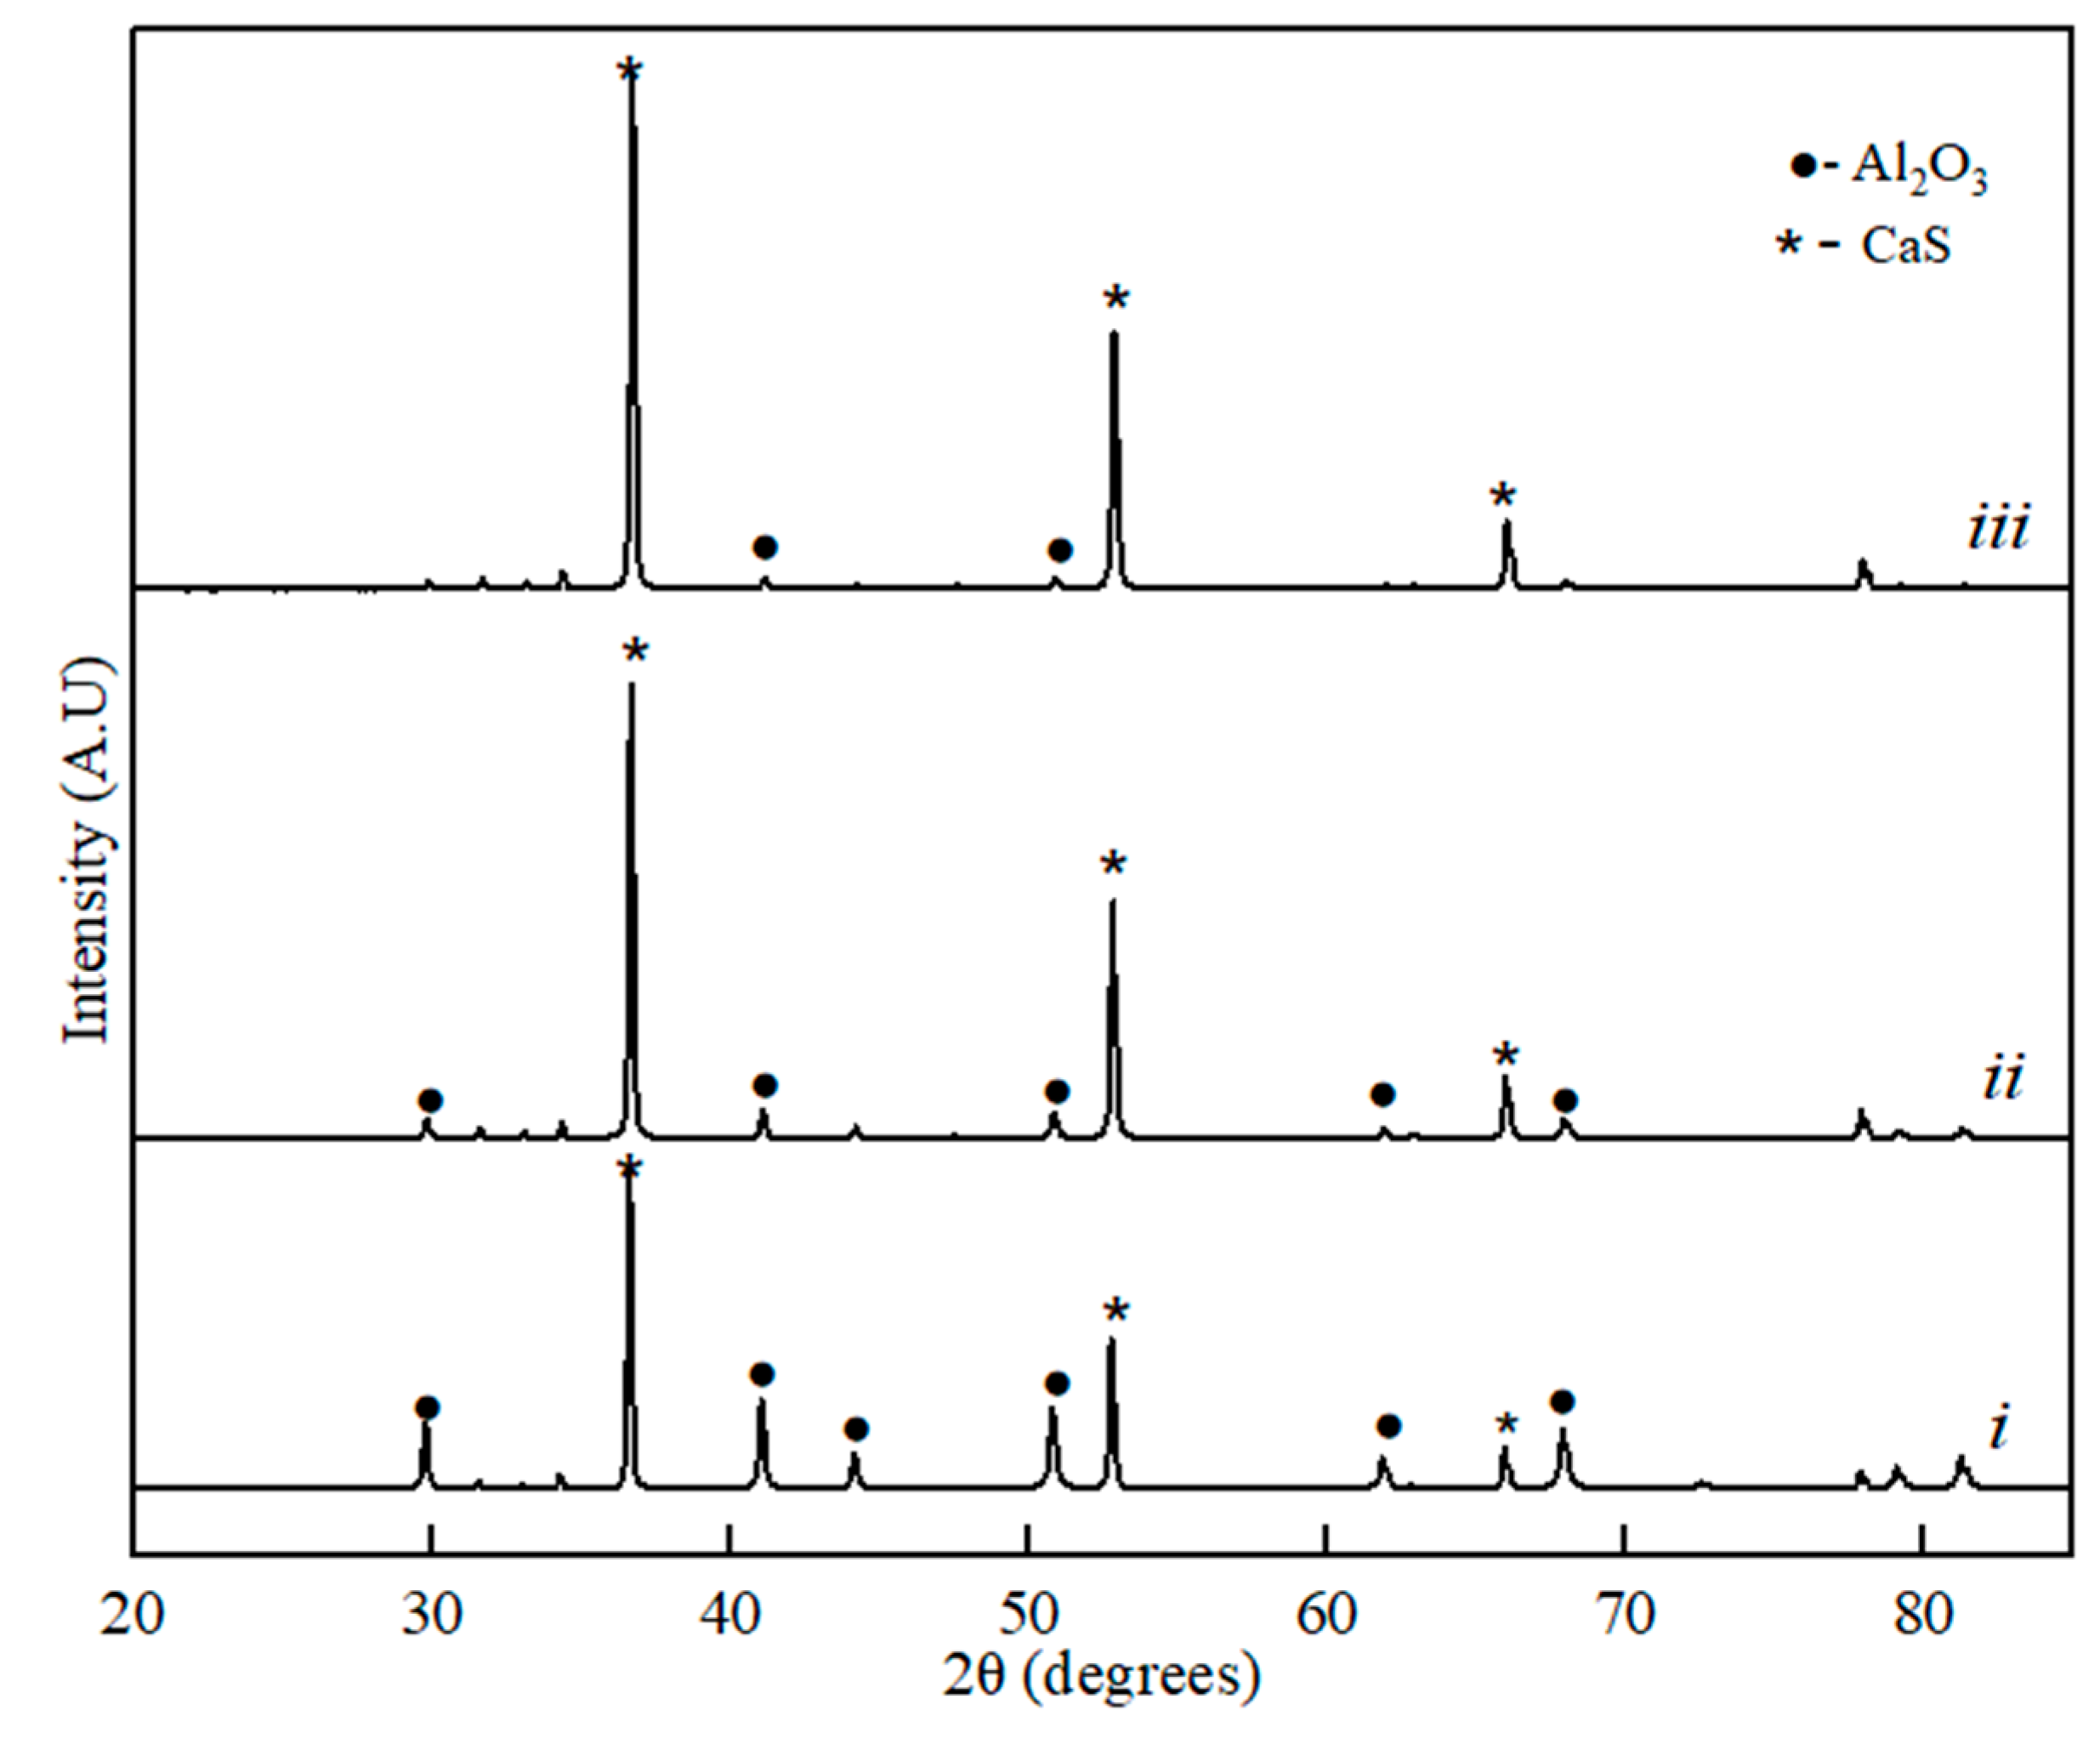
Applsci 10 02113 g001
Figure 2. XRD spectra for the binary sample of CaS-Al2O3: (i) 20% of CaS, (ii) 60% of CaS, and (iii) 80% of the CaS phase component.
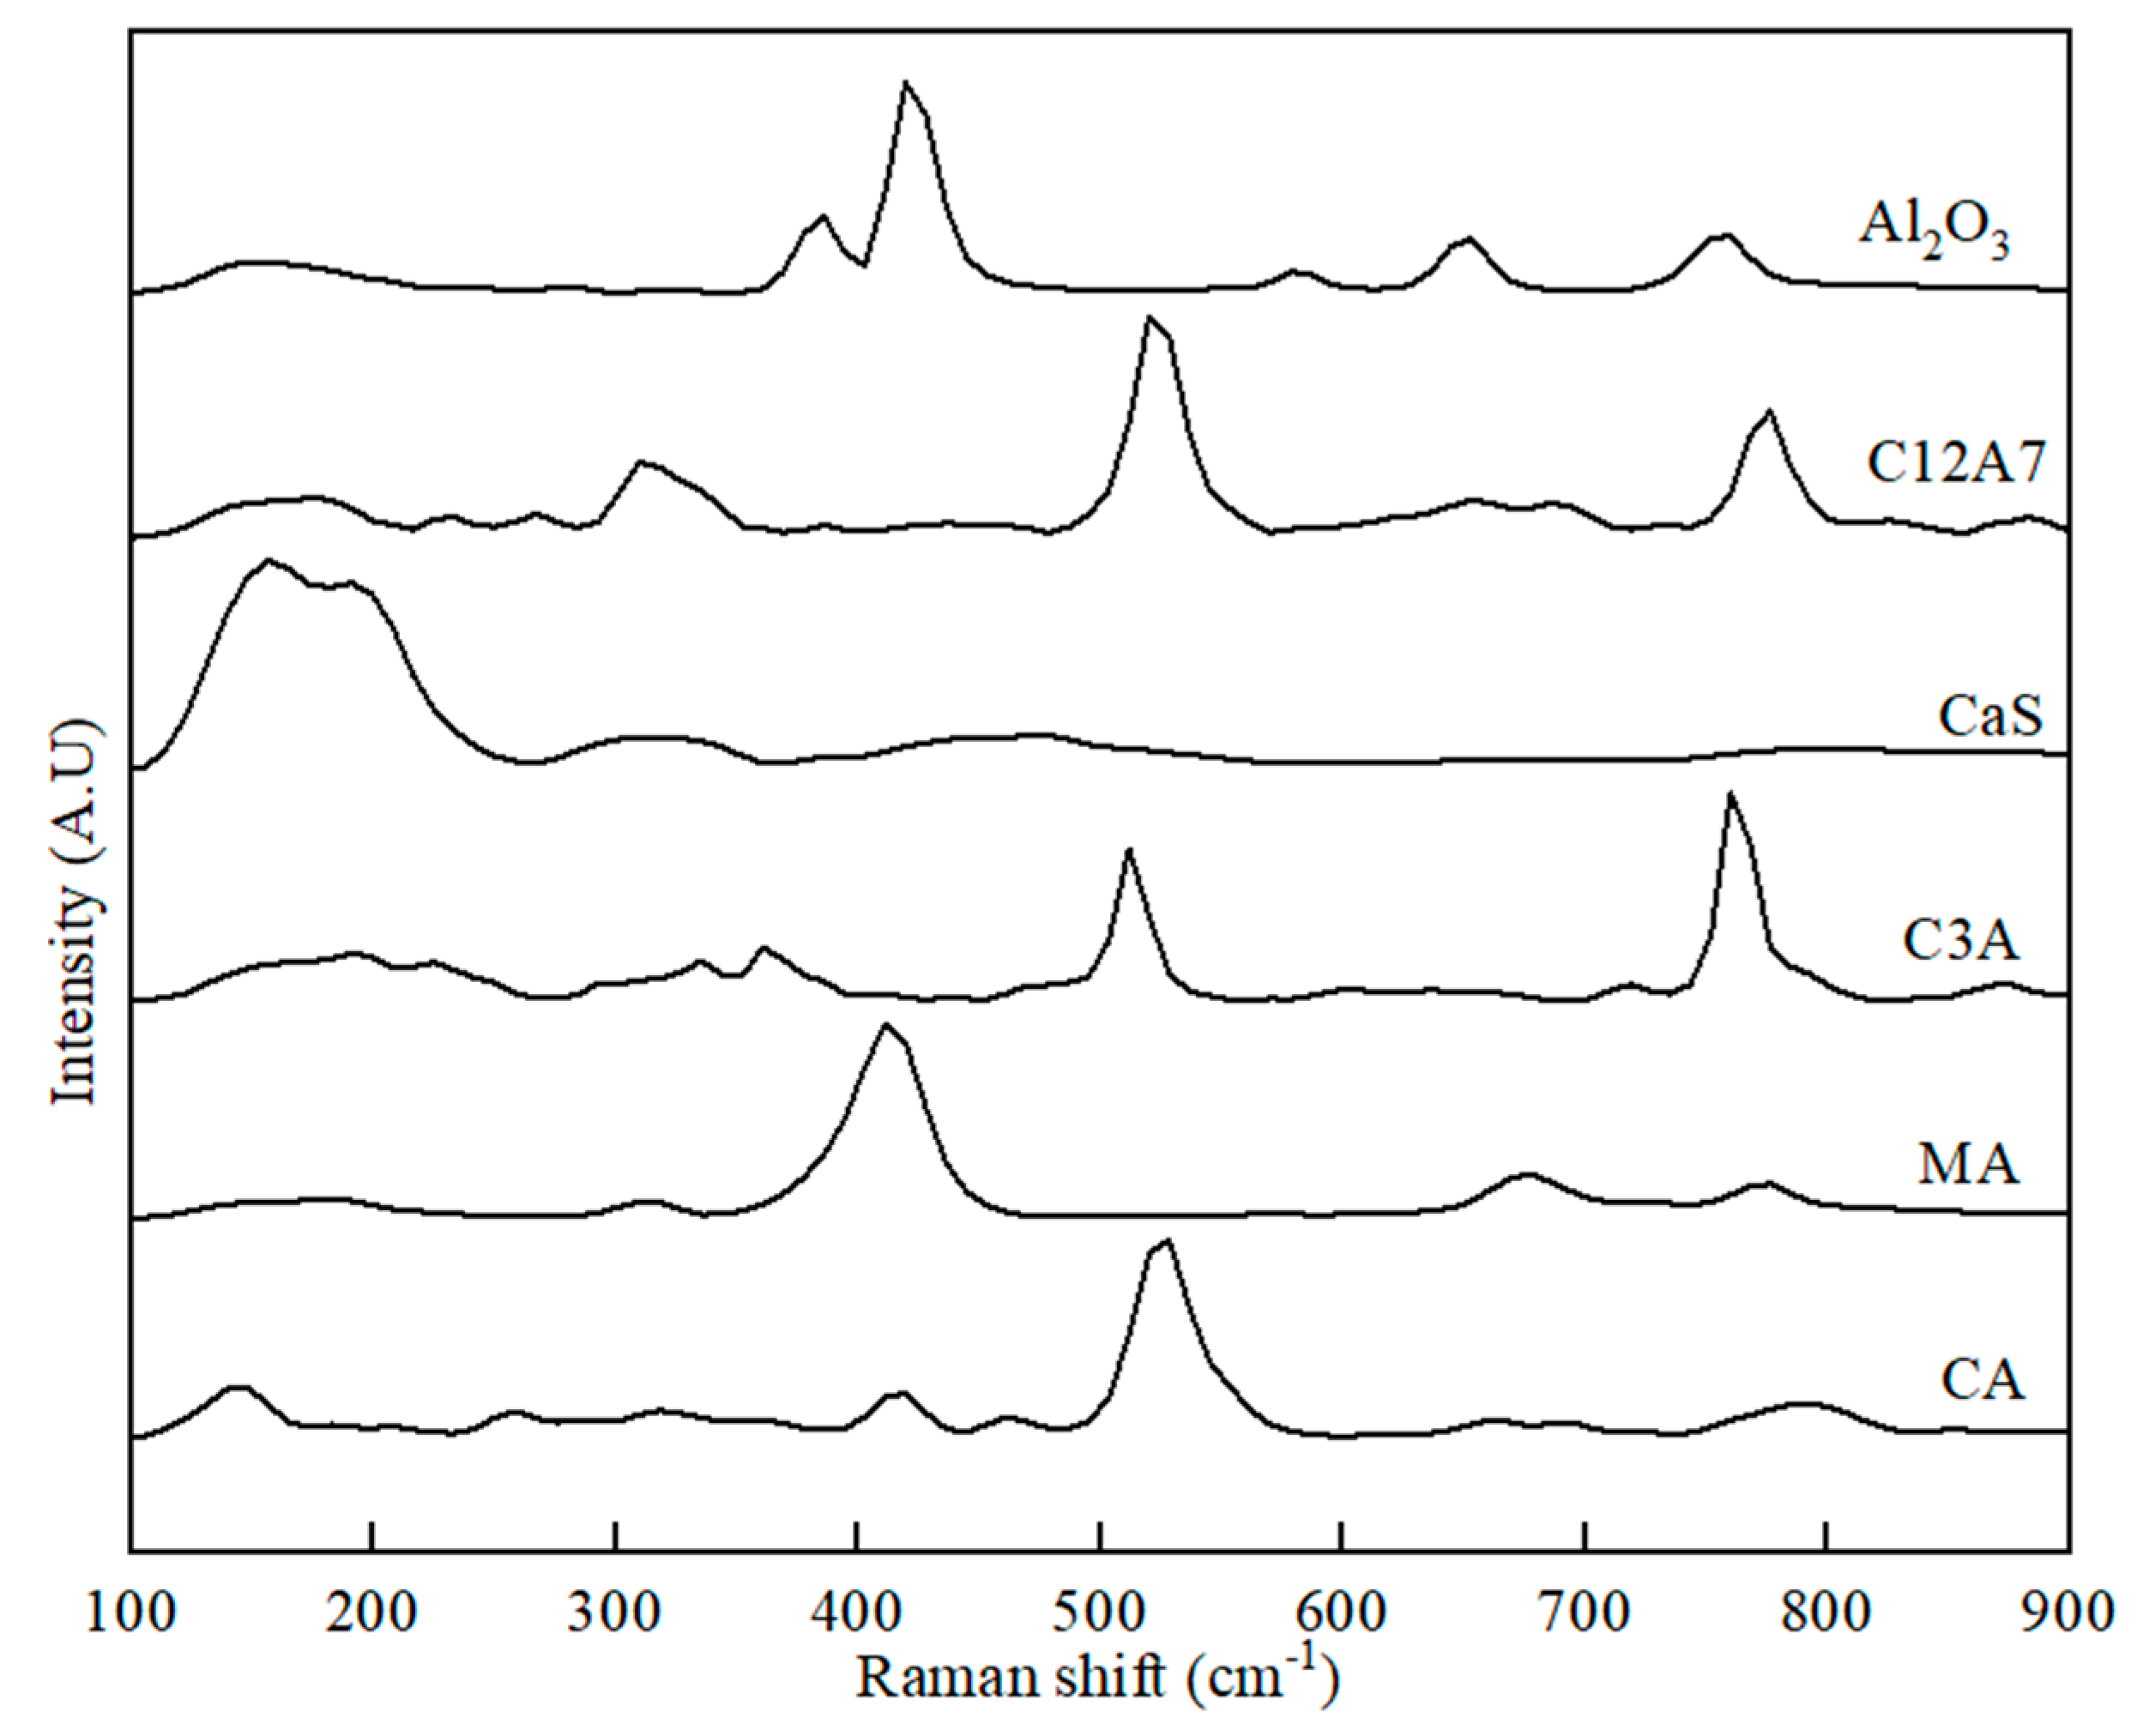
Applsci 10 02113 g002
Figure 3. Raman spectra for initial phases of Al2O3, C12A7, CaS, C3A, MA, and CA used for preparing the binary phase samples.
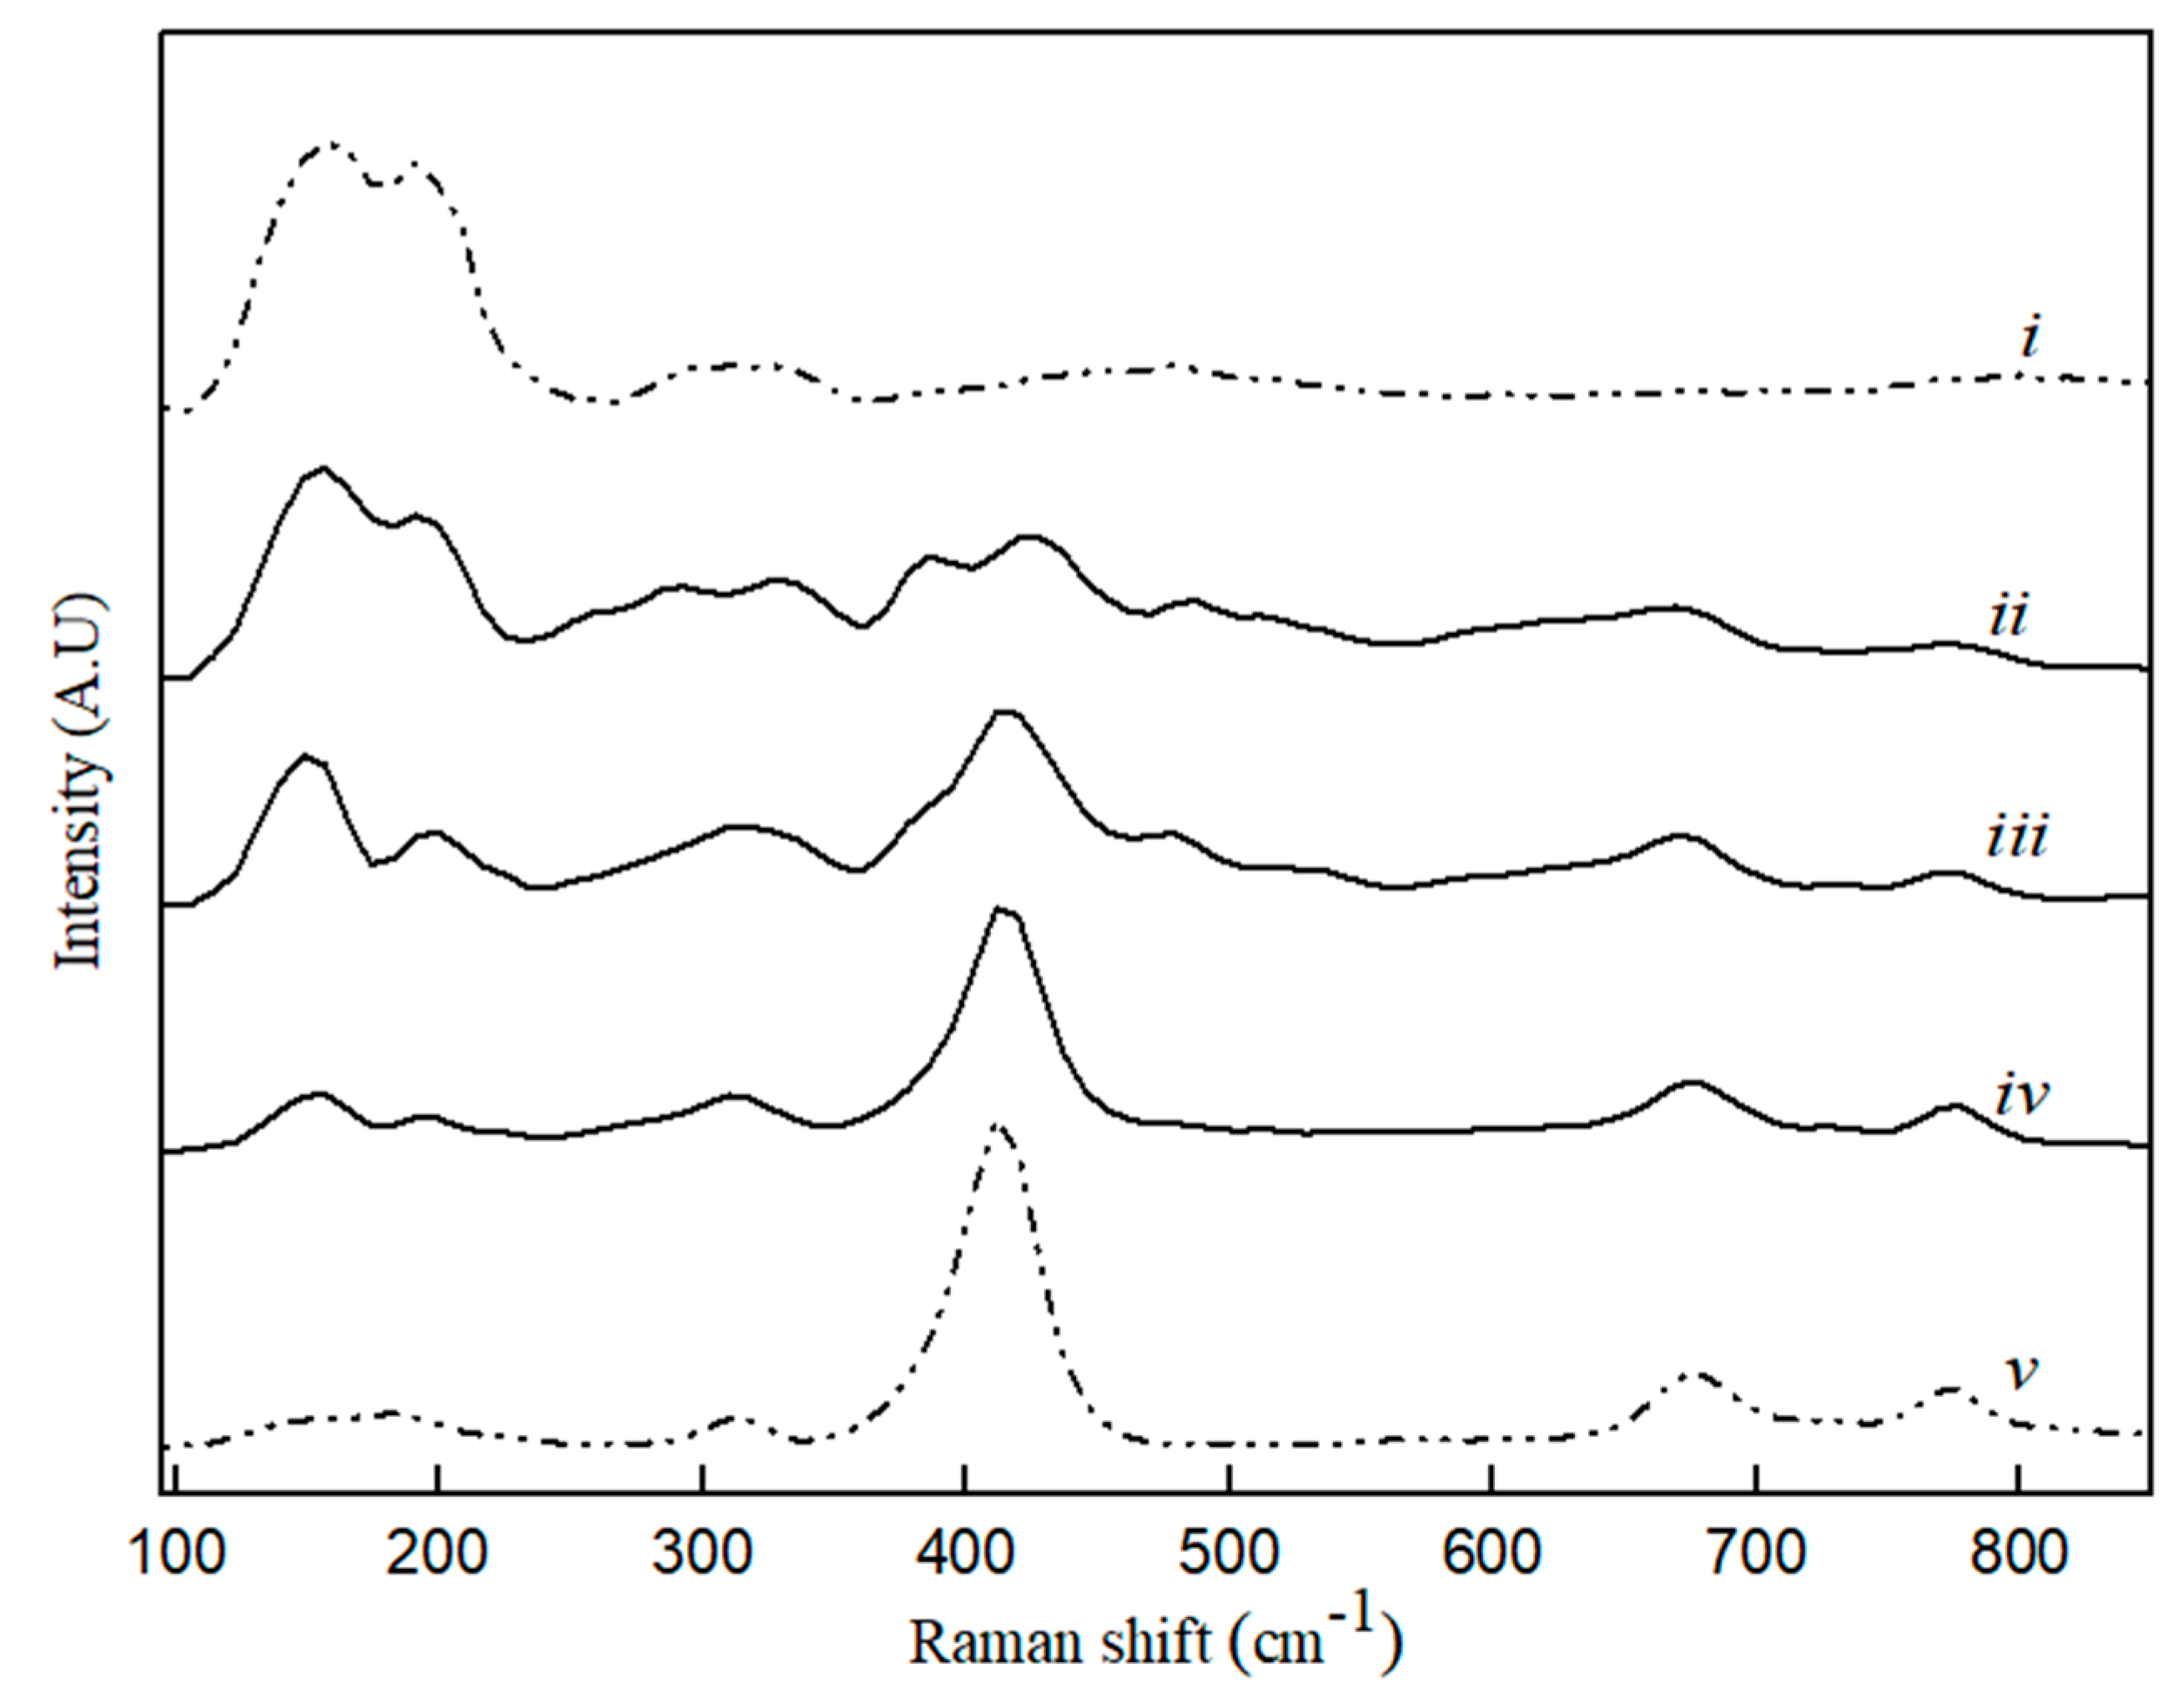
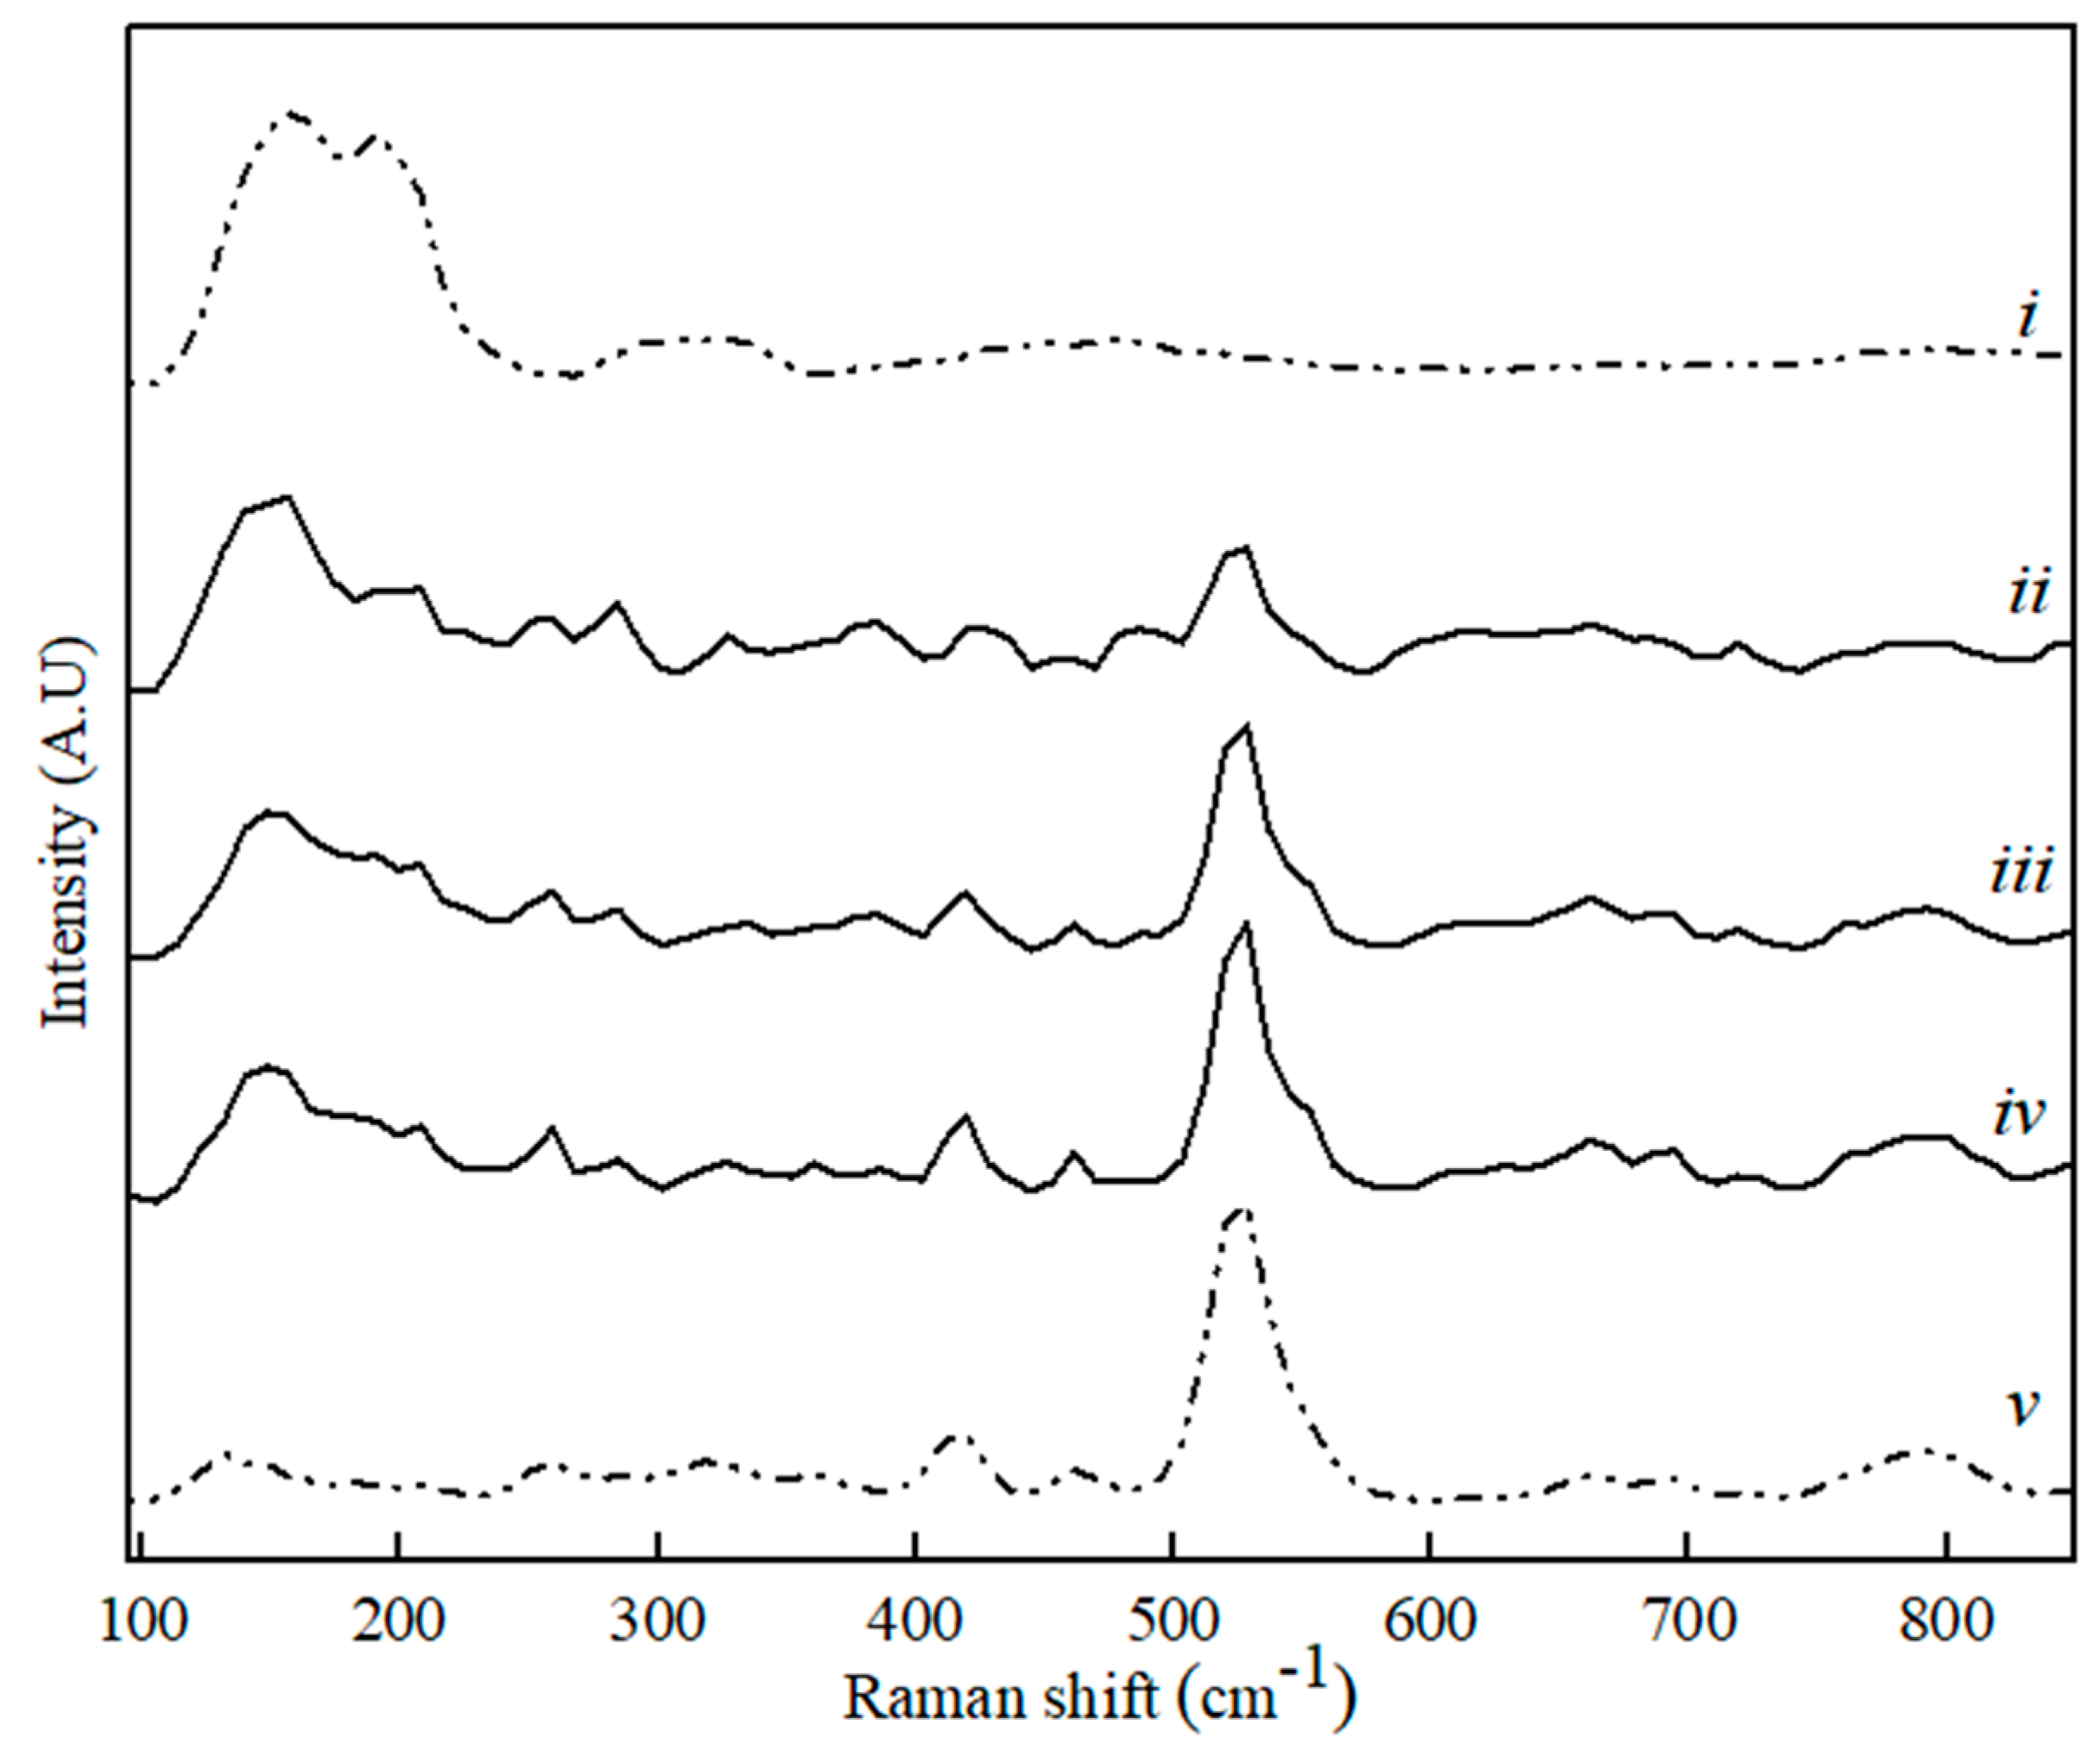
Applsci 10 02113 g003
Figure 4. Raman spectra for CaS (i), MA (v) and binary MA–CaS phase sample with CaS content, where (ii) 80 wt. %, (iii) 60 wt. %, and (iv) 20 wt. %.
Applsci 10 02113 g004
Figure 5. Raman spectra for CaS (i), CA (v) and binary CA–CaS phase sample with CaS content, where (ii) 80 wt. %, (iii) 60 wt. %, and (iv) 20 wt. %.
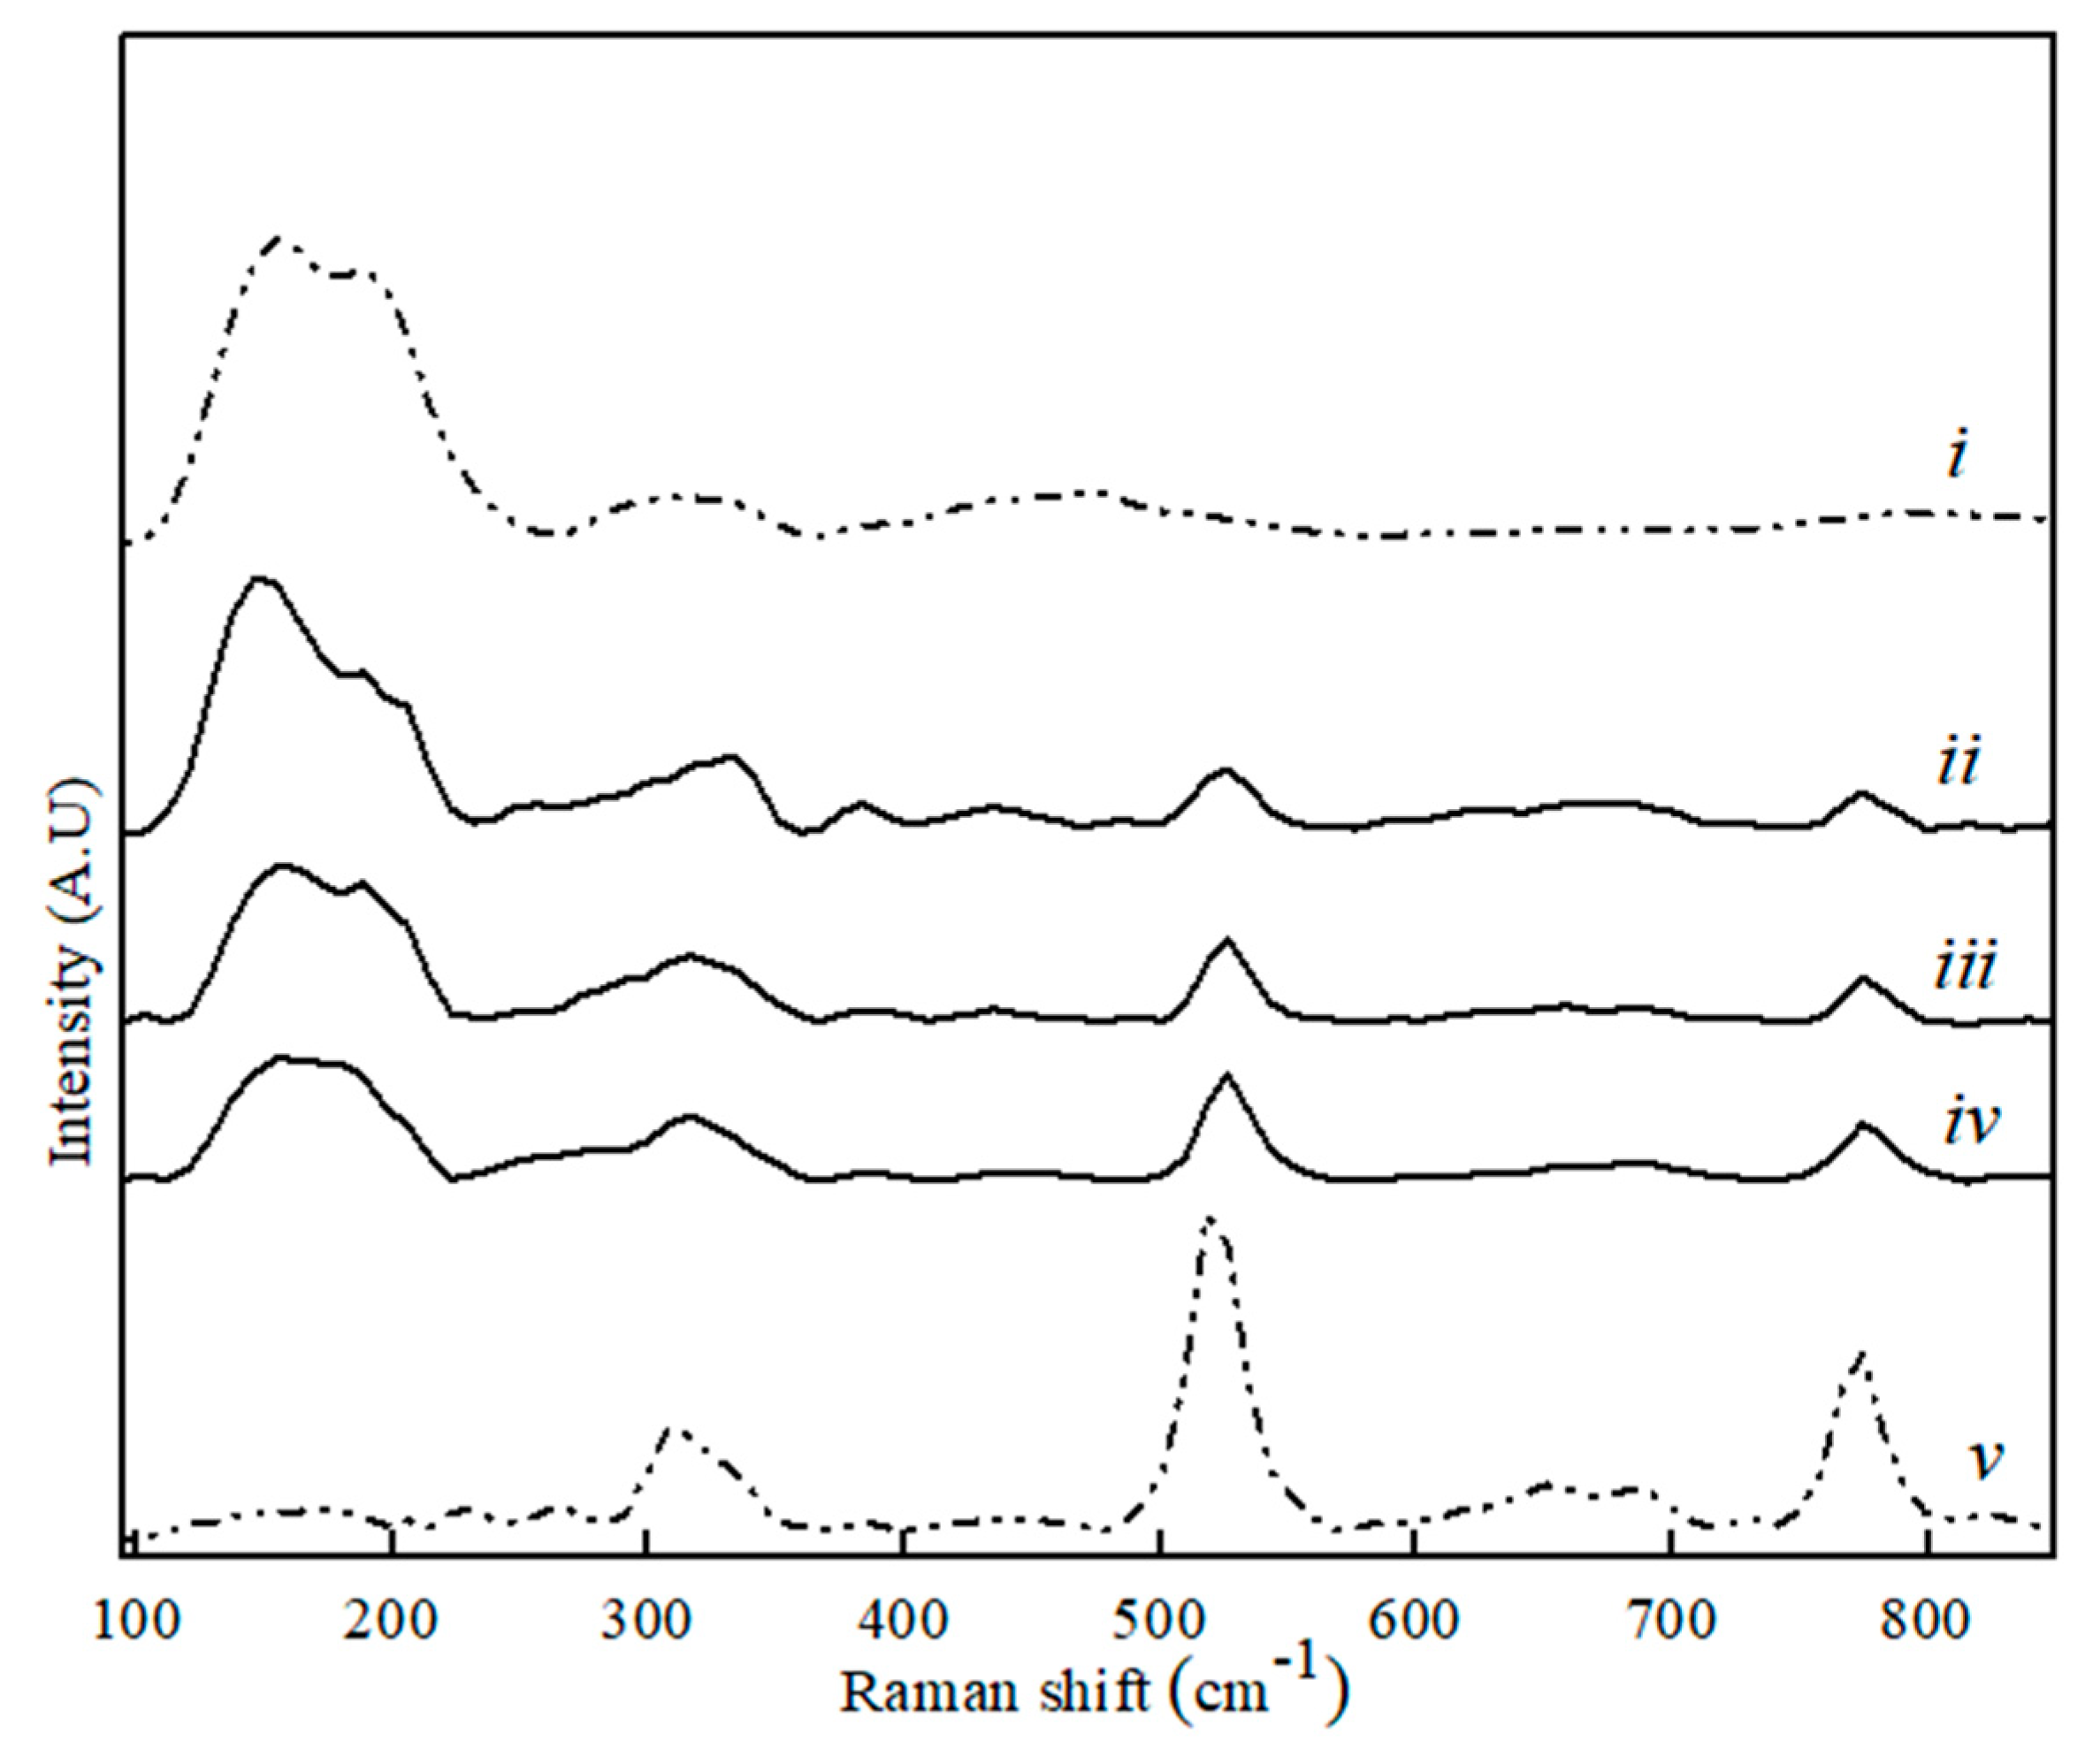
Applsci 10 02113 g005
Figure 6. Raman spectra for CaS (i), C12A7 (v) and binary CaS–C12A7 phase sample with CaS content, where (ii) 80 wt. %, (iii) 60 wt. %, and (iv) 20 wt. %.
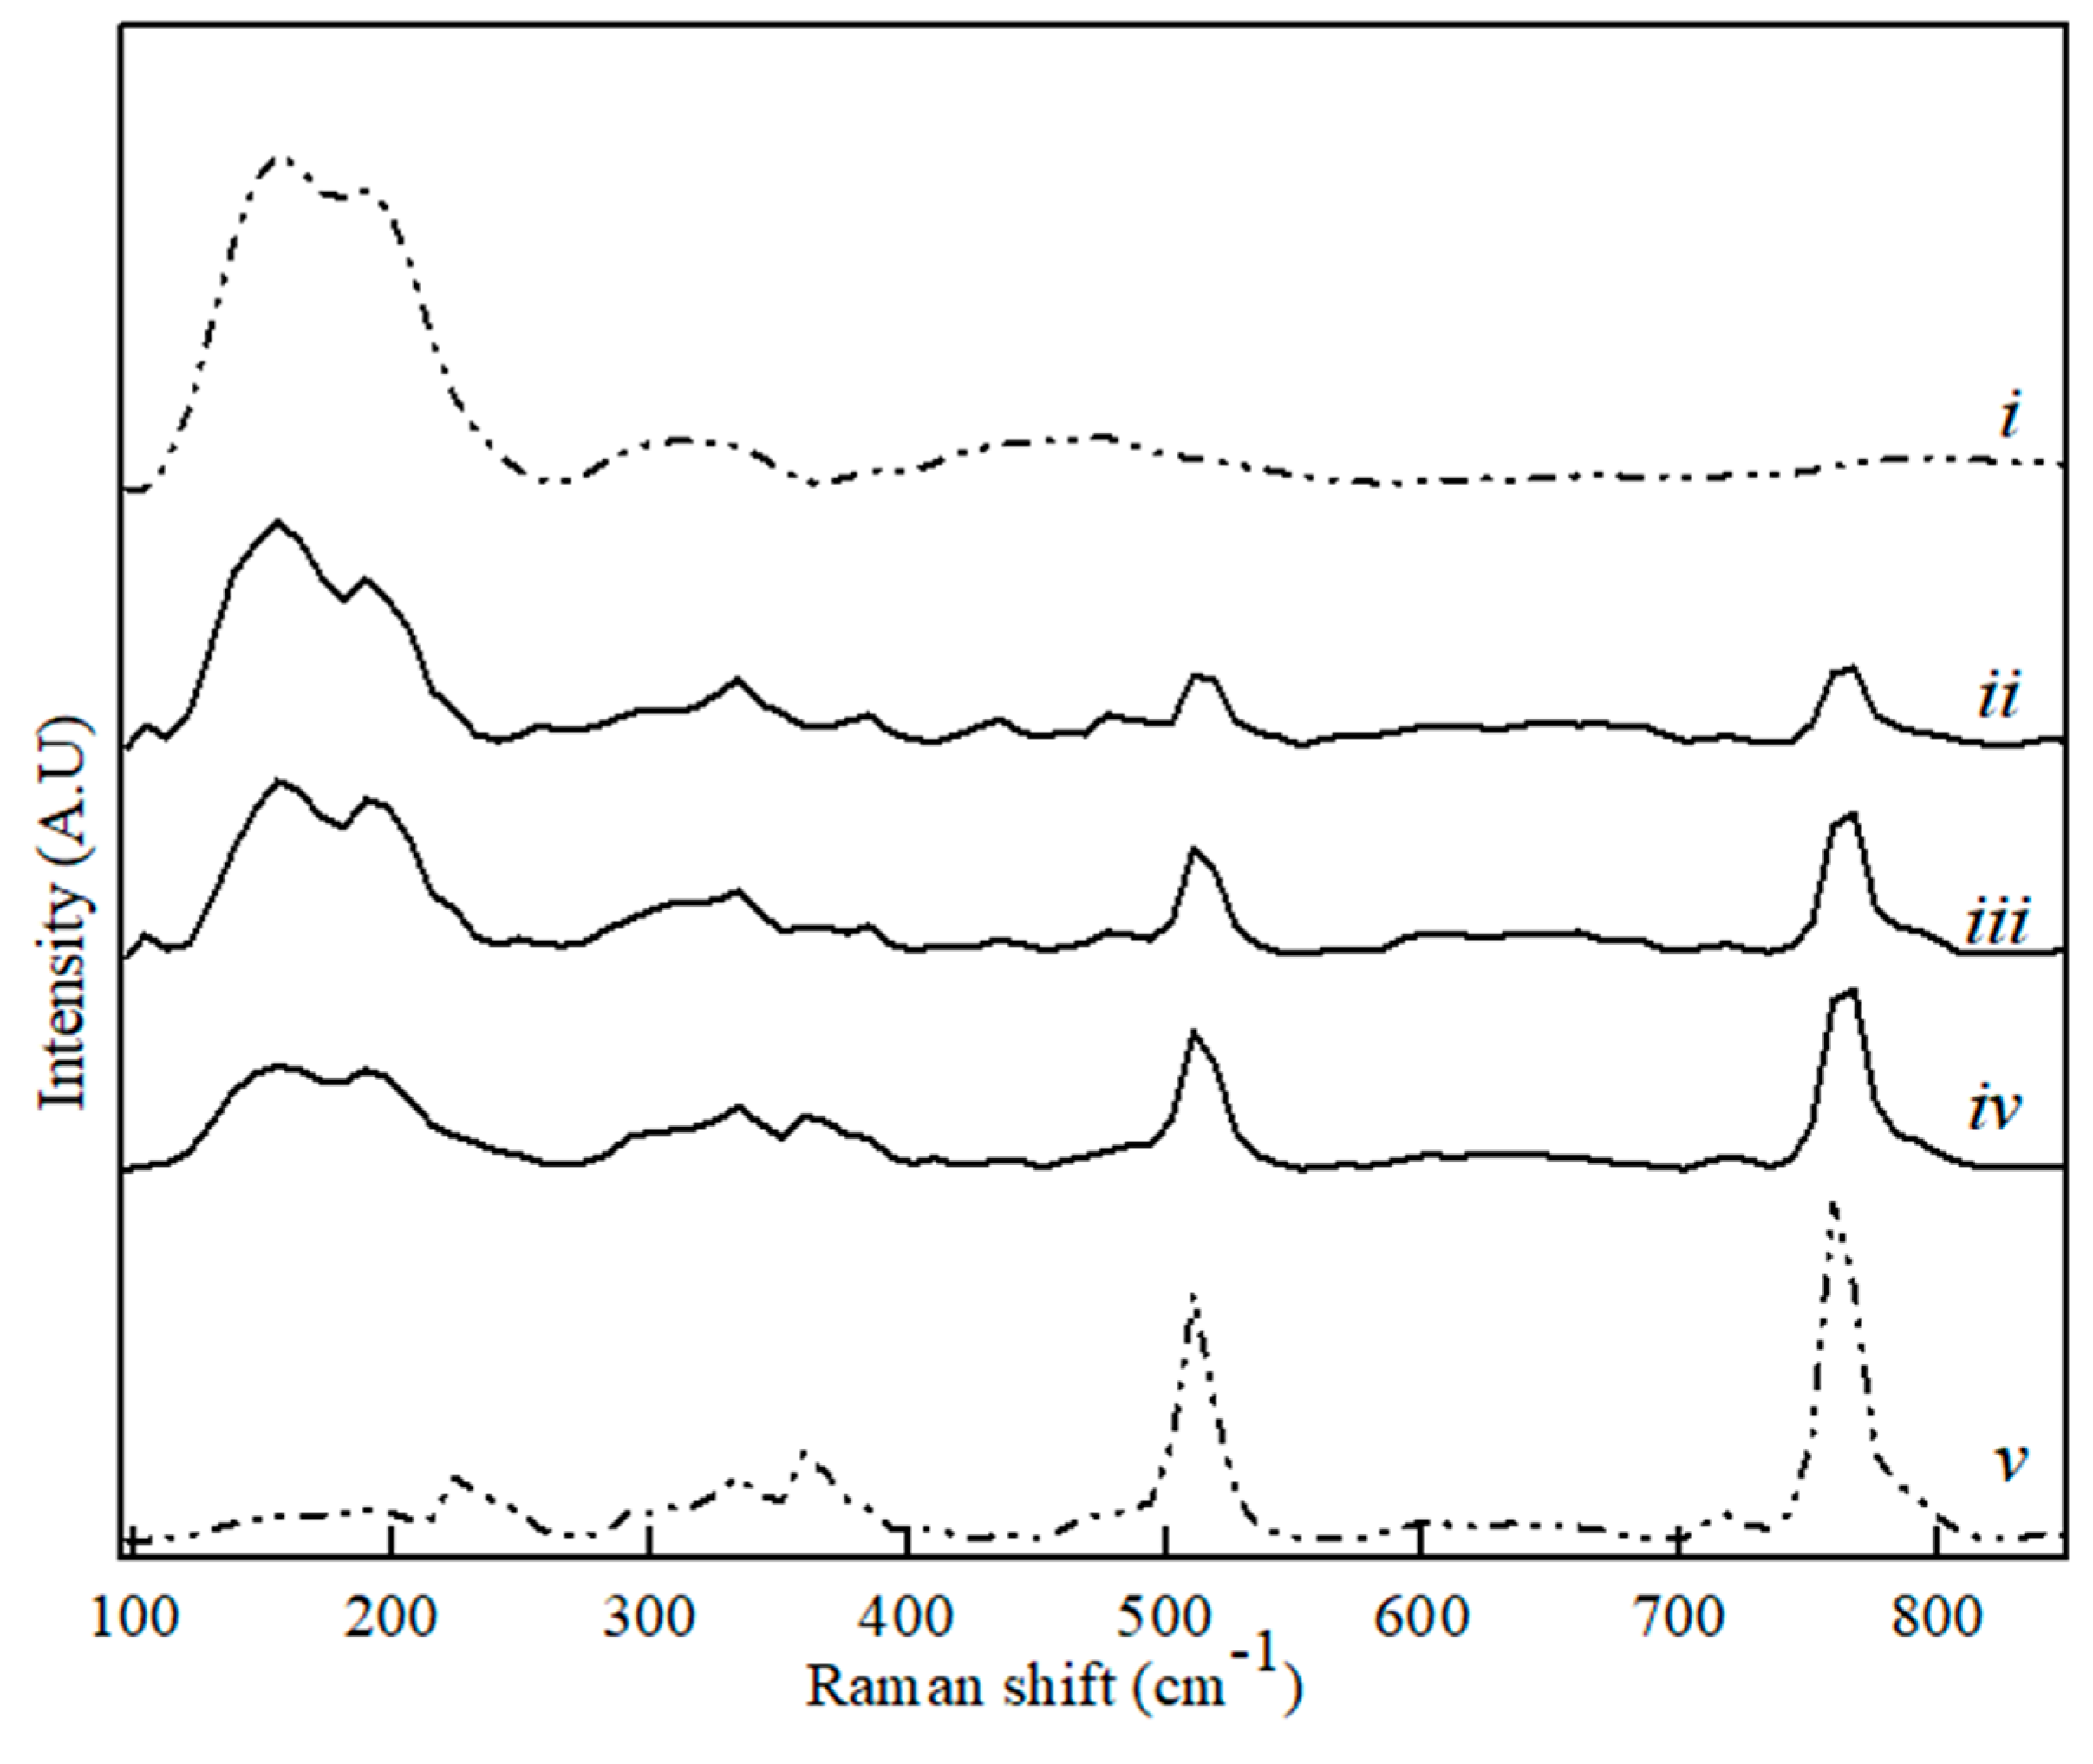
Applsci 10 02113 g006
Figure 7. Raman spectra for CaS (i), C3A (v) and binary CaS–C3A phase sample with CaS content, where (ii) 80 wt. %, (iii) 60 wt. %, and (iv) 20 wt. %.
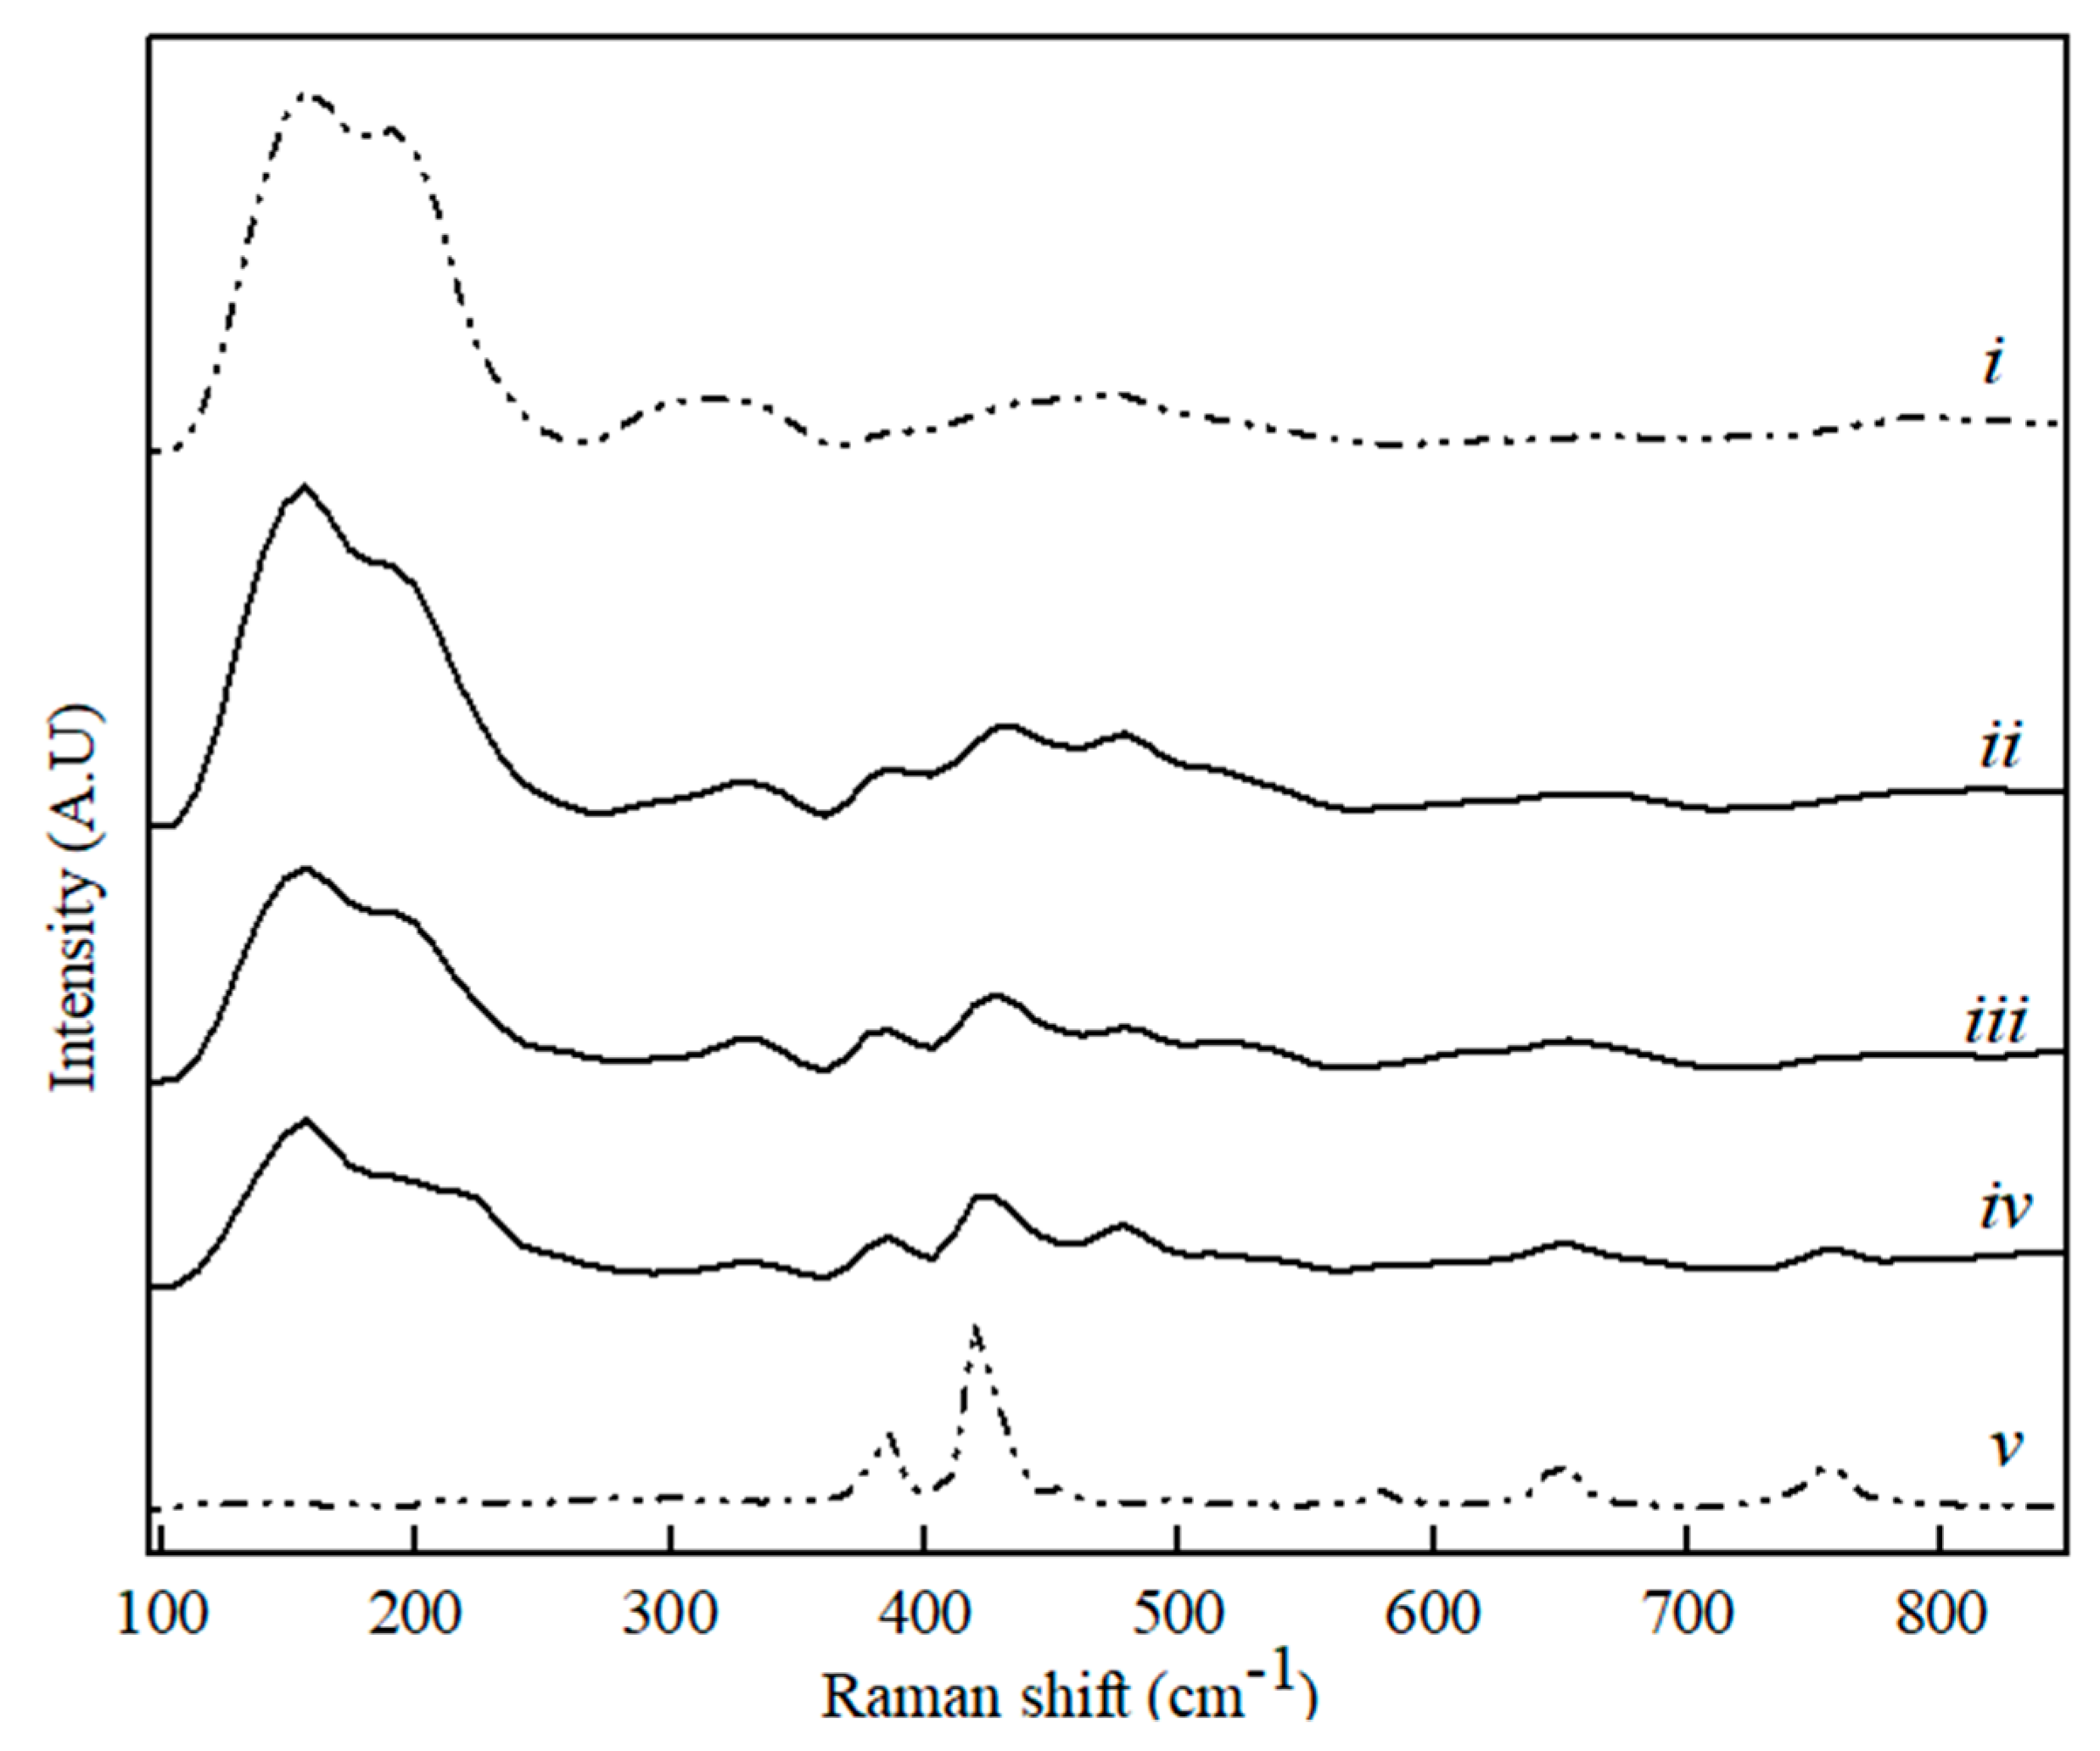
Applsci 10 02113 g007
Figure 8. Raman spectra for CaS (i), Al2O3 (v) and binary CaS–Al2O3 phase sample with CaS content, where (ii) 80 wt. %, (iii) 60 wt. %, and (iv) 20 wt. %.
Applsci 10 02113 g008
Figure 9. Evaluation of relative stabilities (Si) of the calibration variable candidates and mean absolute error values obtained for training and validation sets for CaS–CA.
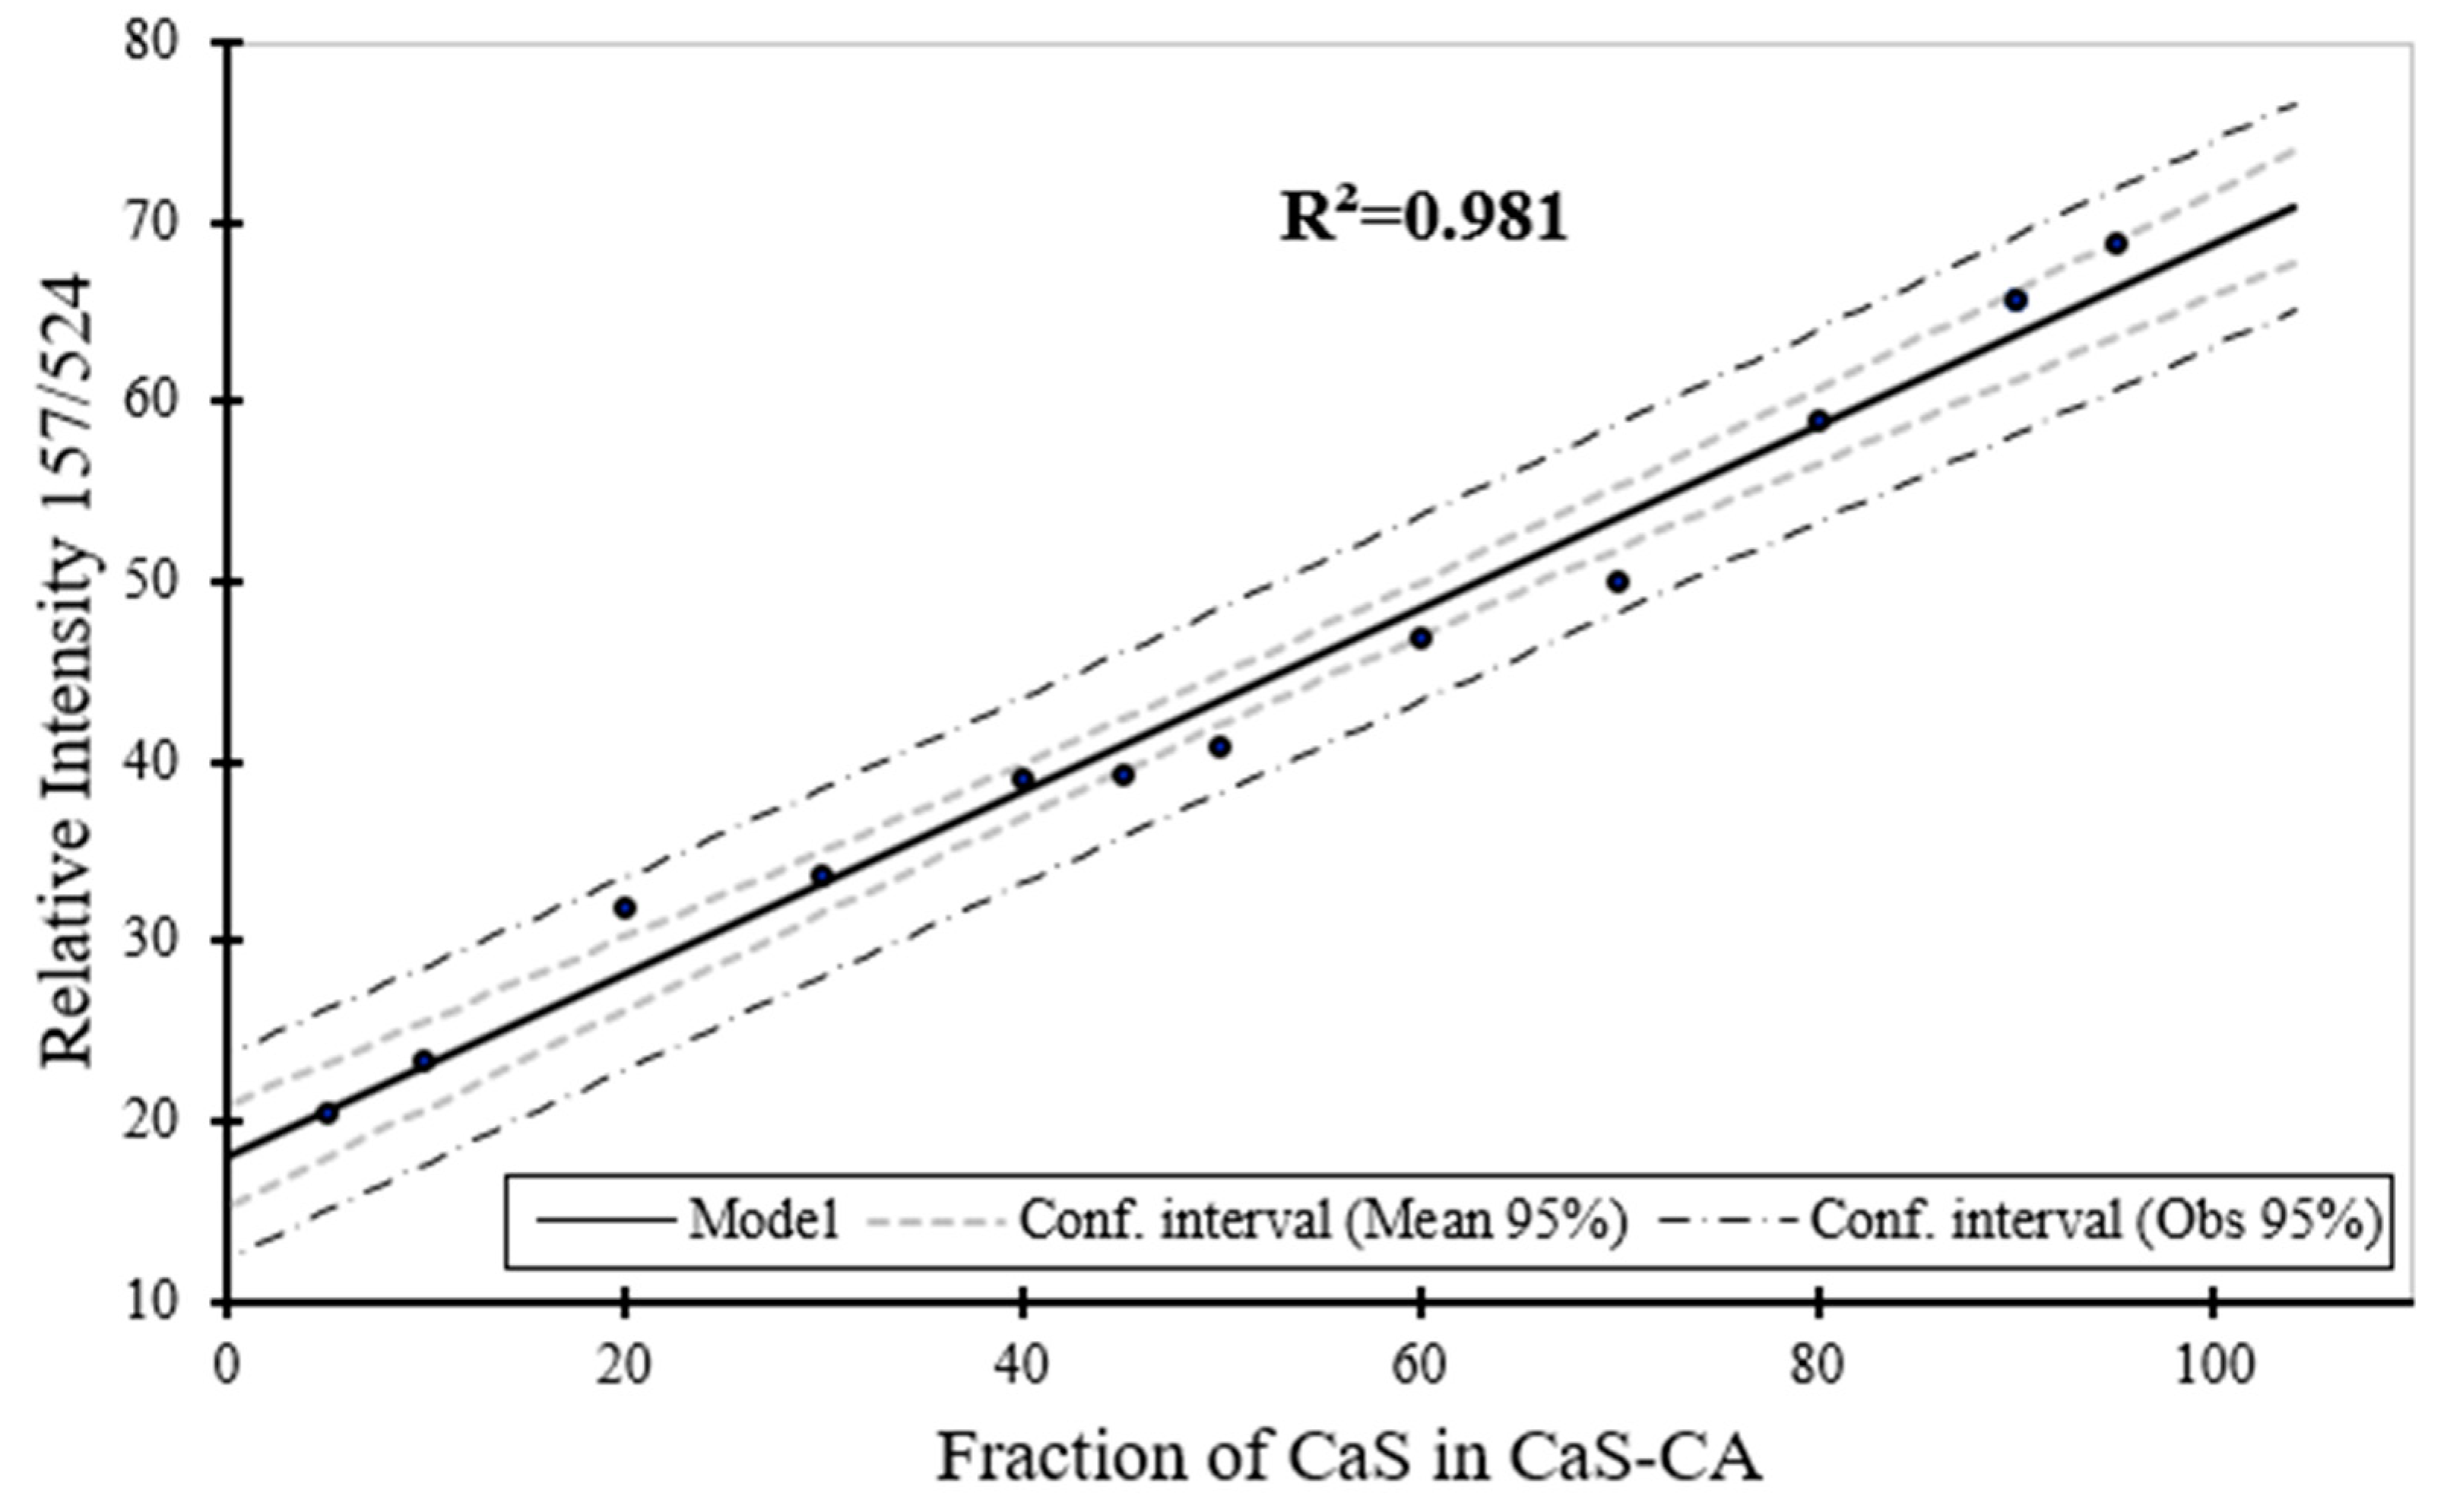
Applsci 10 02113 g009
Figure 10. Raman spectroscopy estimation for the phase content (wt. %) for CaS as a function of the phase content of CaS in CaS–CA sample.
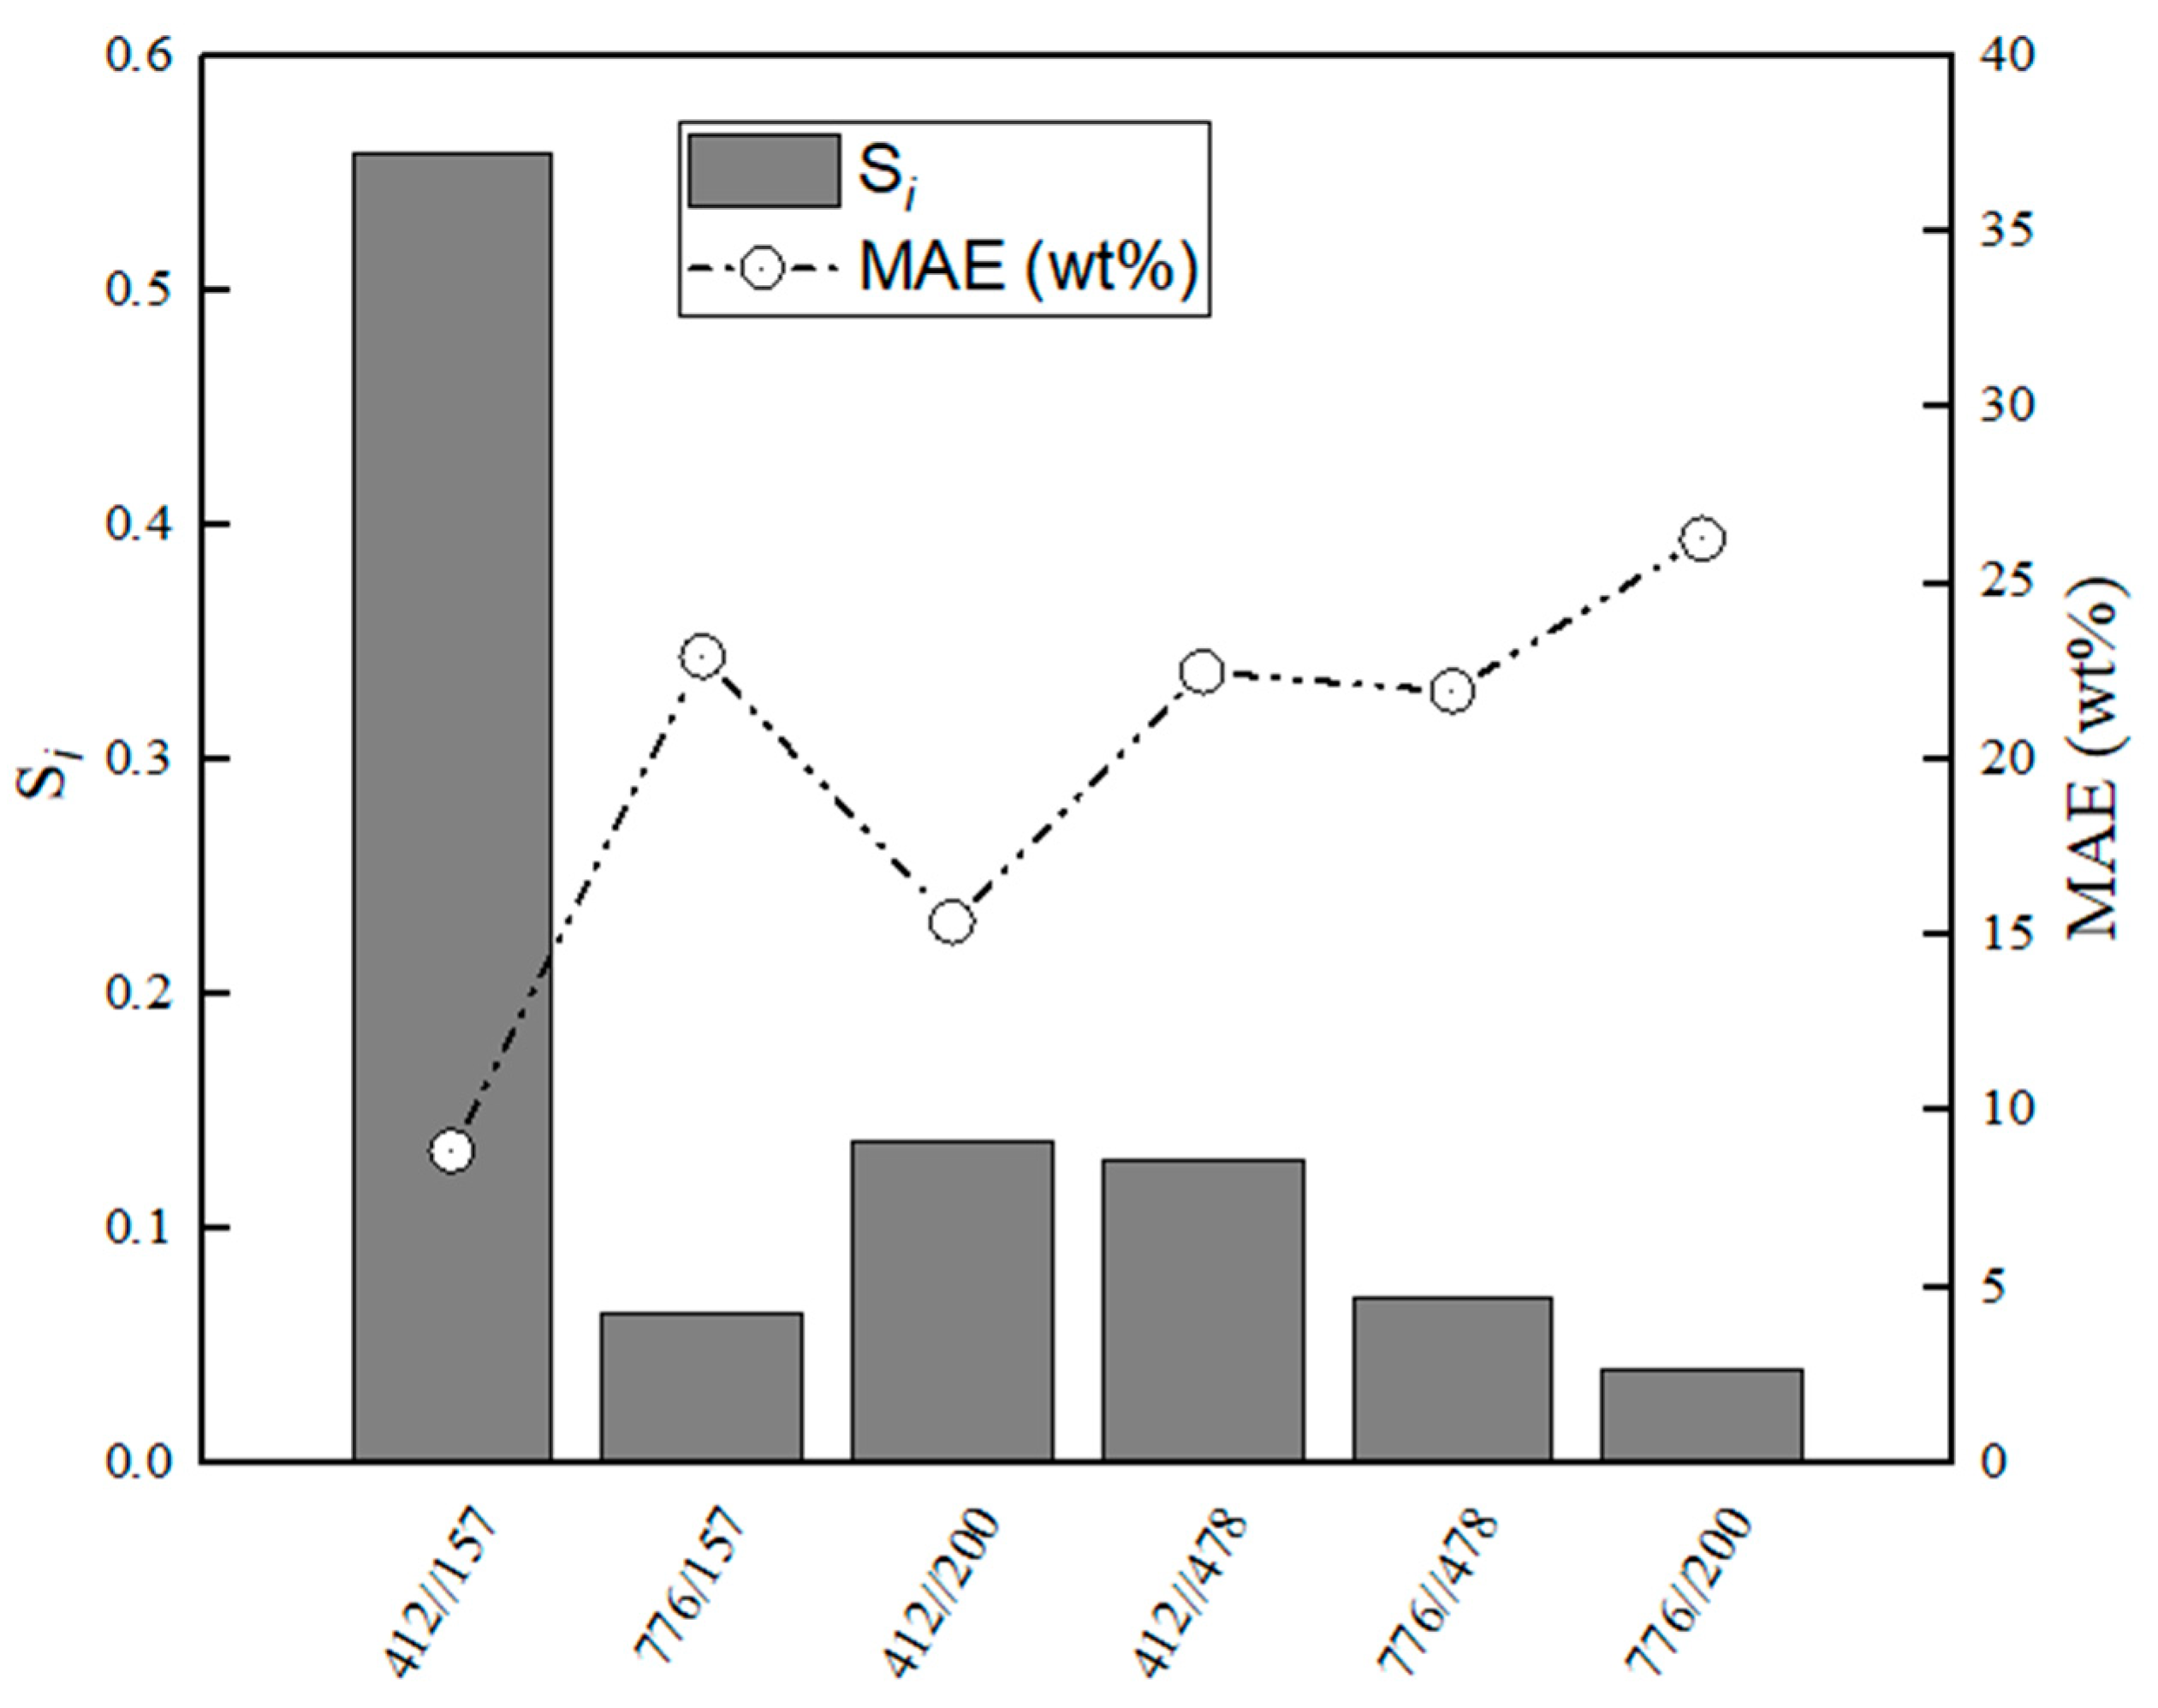
Applsci 10 02113 g010
Figure 11. Evaluation of relative stabilities (Si) of the calibration variable candidates and mean absolute error values obtained for training and validation sets for MA–CaS.
Applsci 10 02113 g011
Figure 12. Raman spectroscopy estimation for the phase content (wt. %) for MA as a function of the phase content of MA in MA–CaS sample.
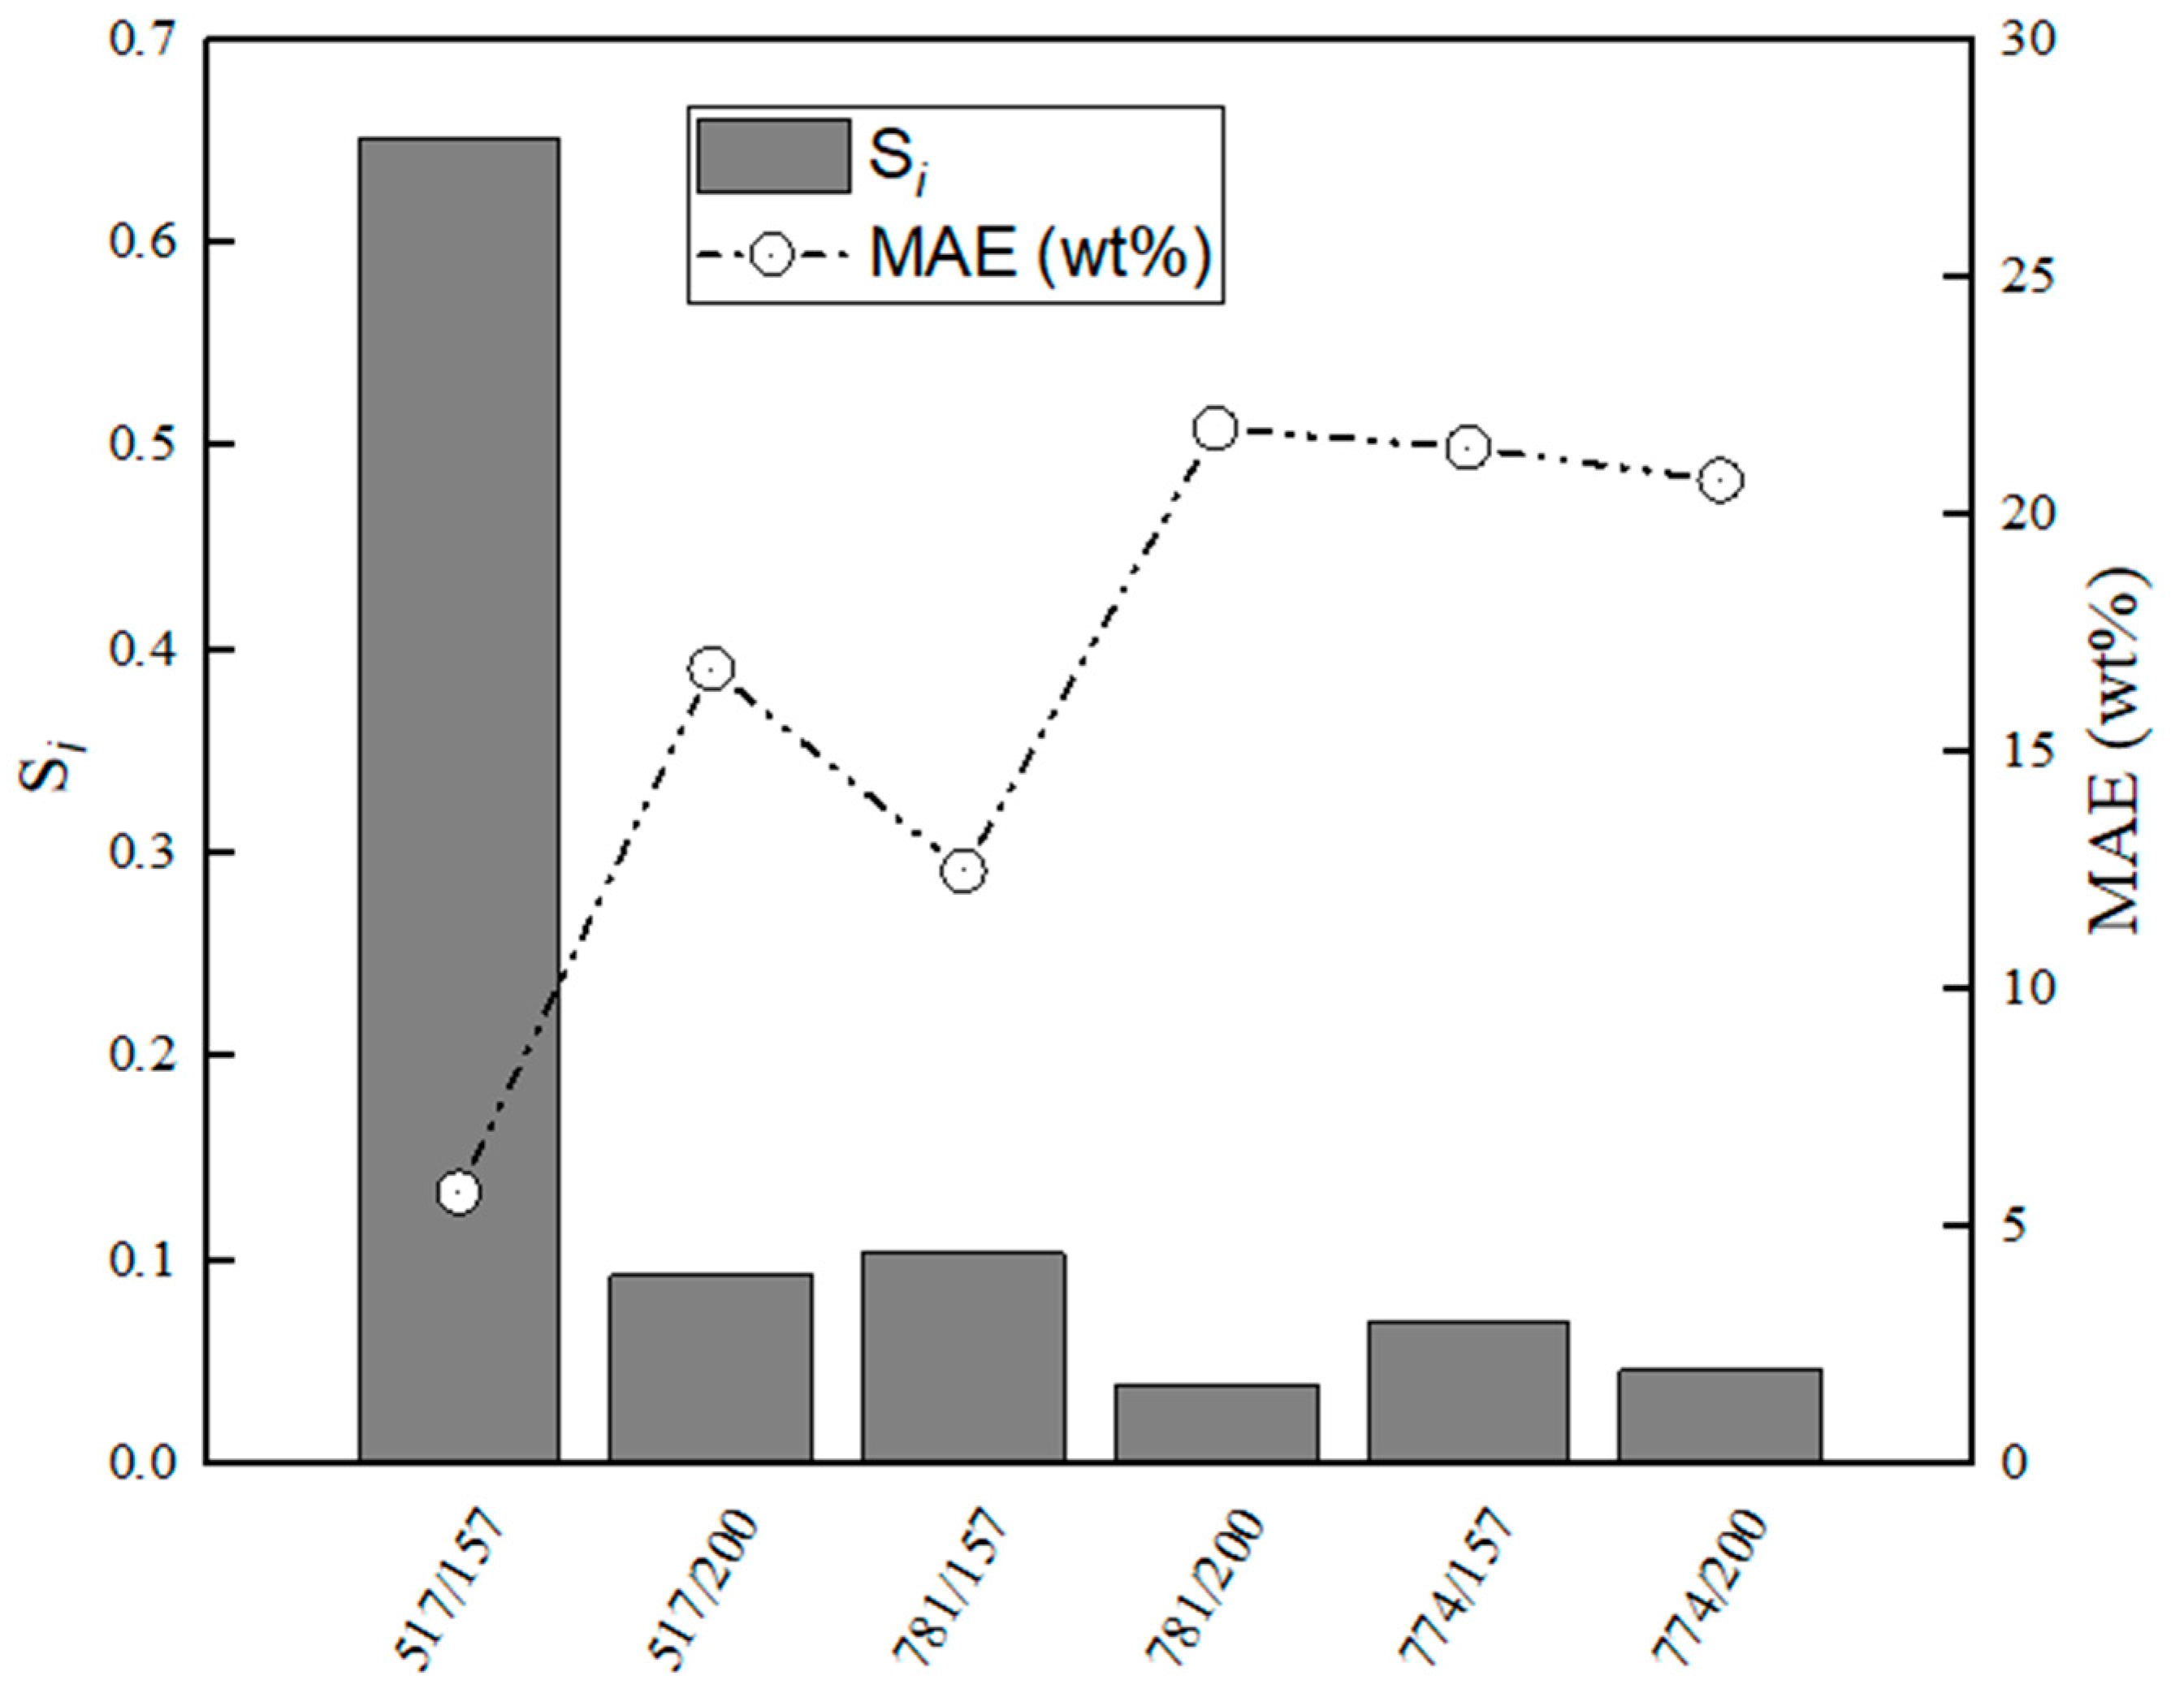
Applsci 10 02113 g012
Figure 13. Evaluation of relative stabilities (Si) of the calibration variable candidates and mean absolute error values obtained for training and validation sets for C12A7–CaS.
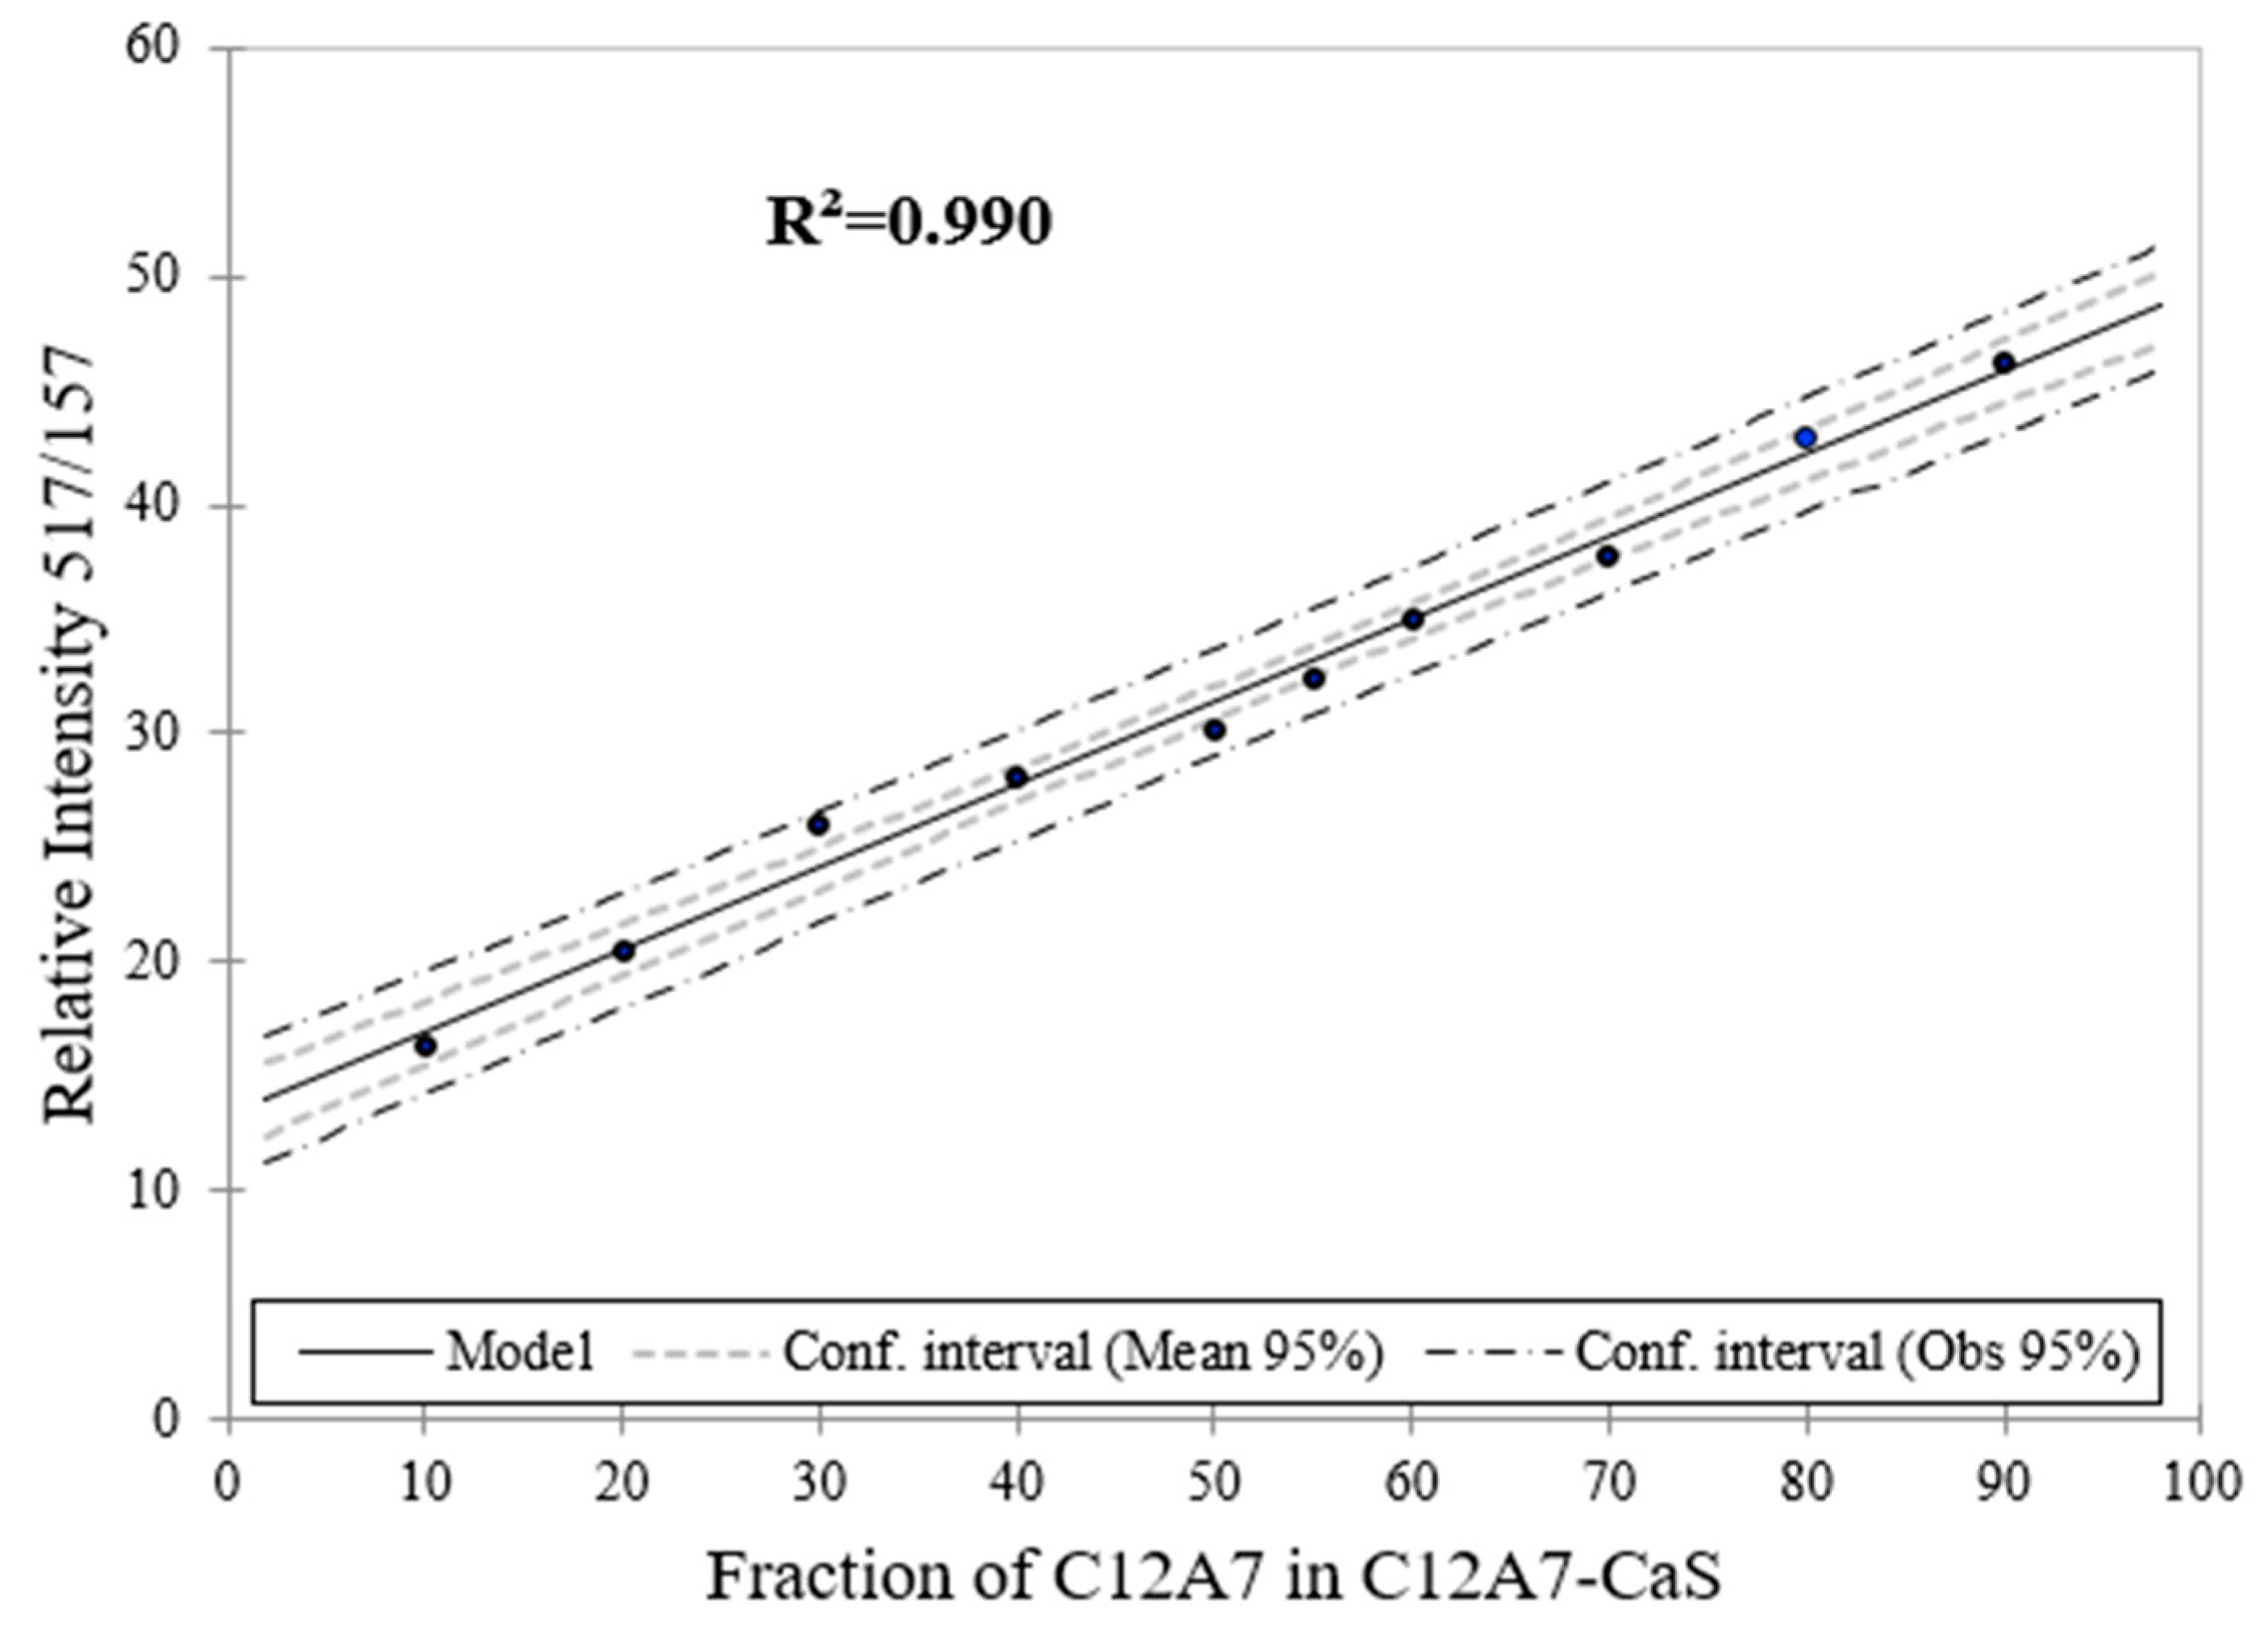
Applsci 10 02113 g013
Figure 14. Raman spectroscopy estimation for the phase content (wt. %) for C12A7 as a function of the phase content of C12A7 in C12A7–CaS sample.
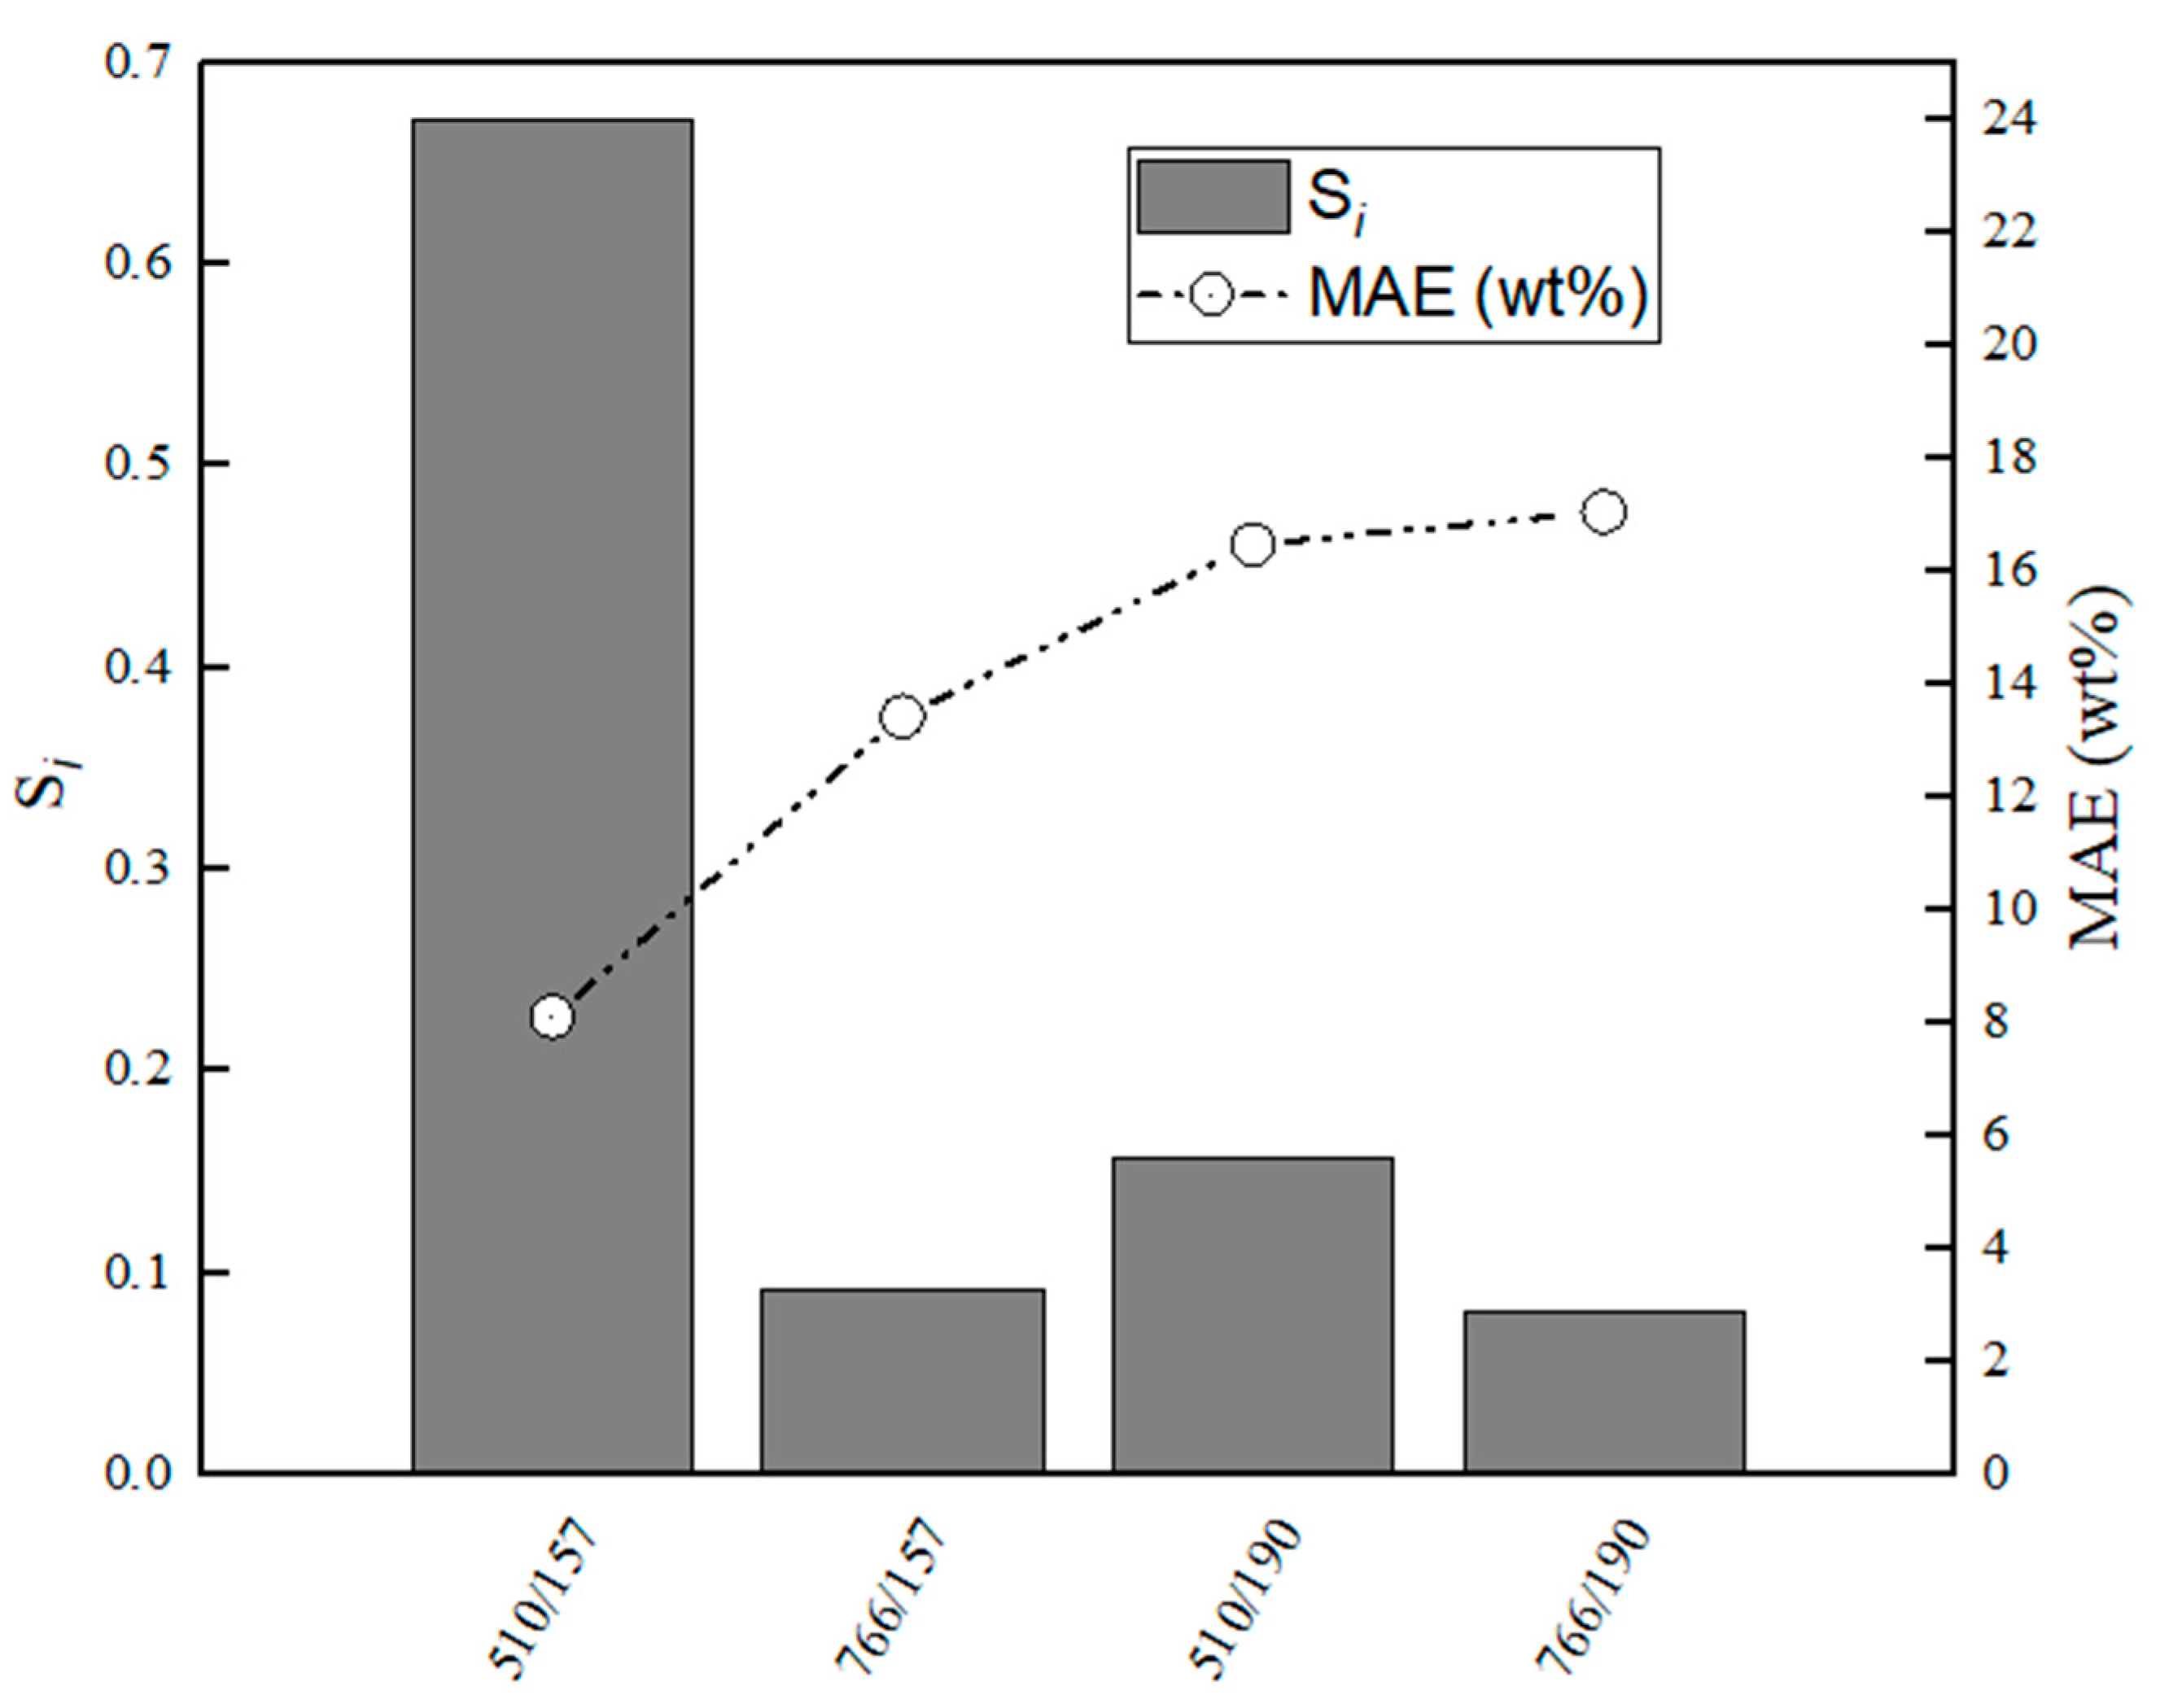
Applsci 10 02113 g014
Figure 15. Evaluation of relative stabilities (Si) of the calibration variable candidates and mean absolute error values obtained for training and validation sets for C3A–CaS.
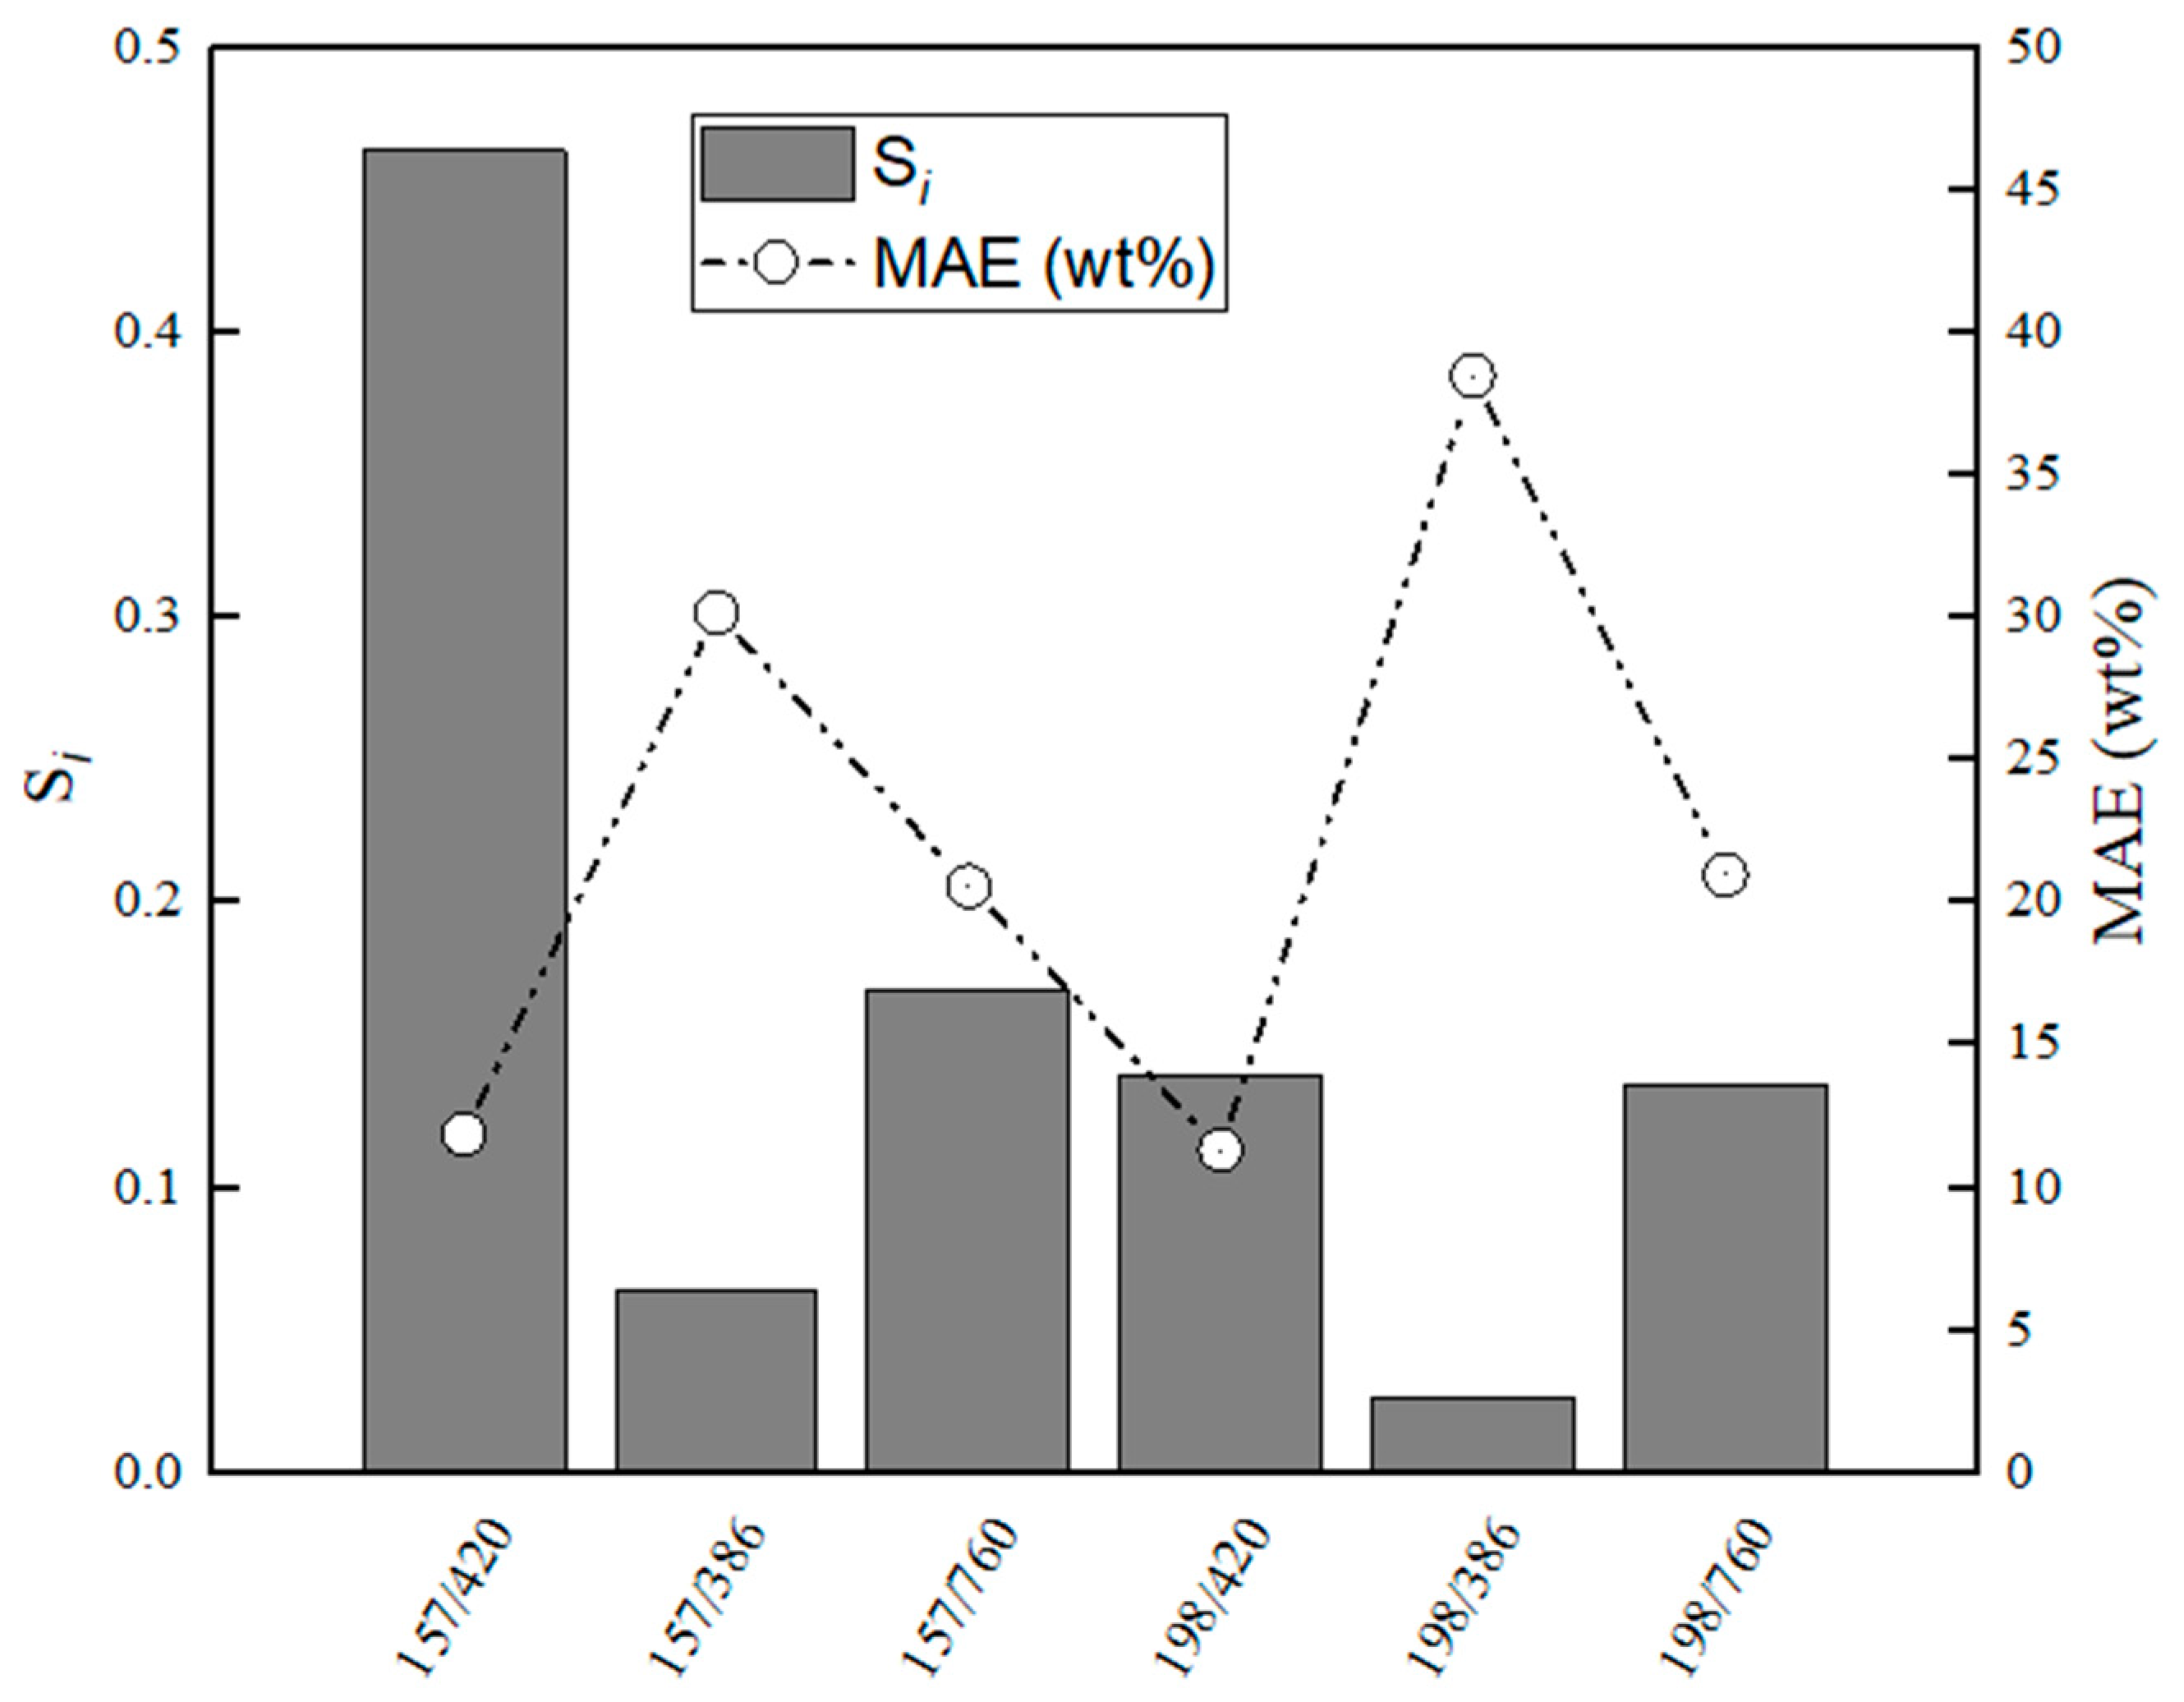
Applsci 10 02113 g015
Figure 16. Evaluation of relative stabilities (Si) of the calibration variable candidates and mean absolute error values obtained for training and validation sets for CaS–Al2O3.
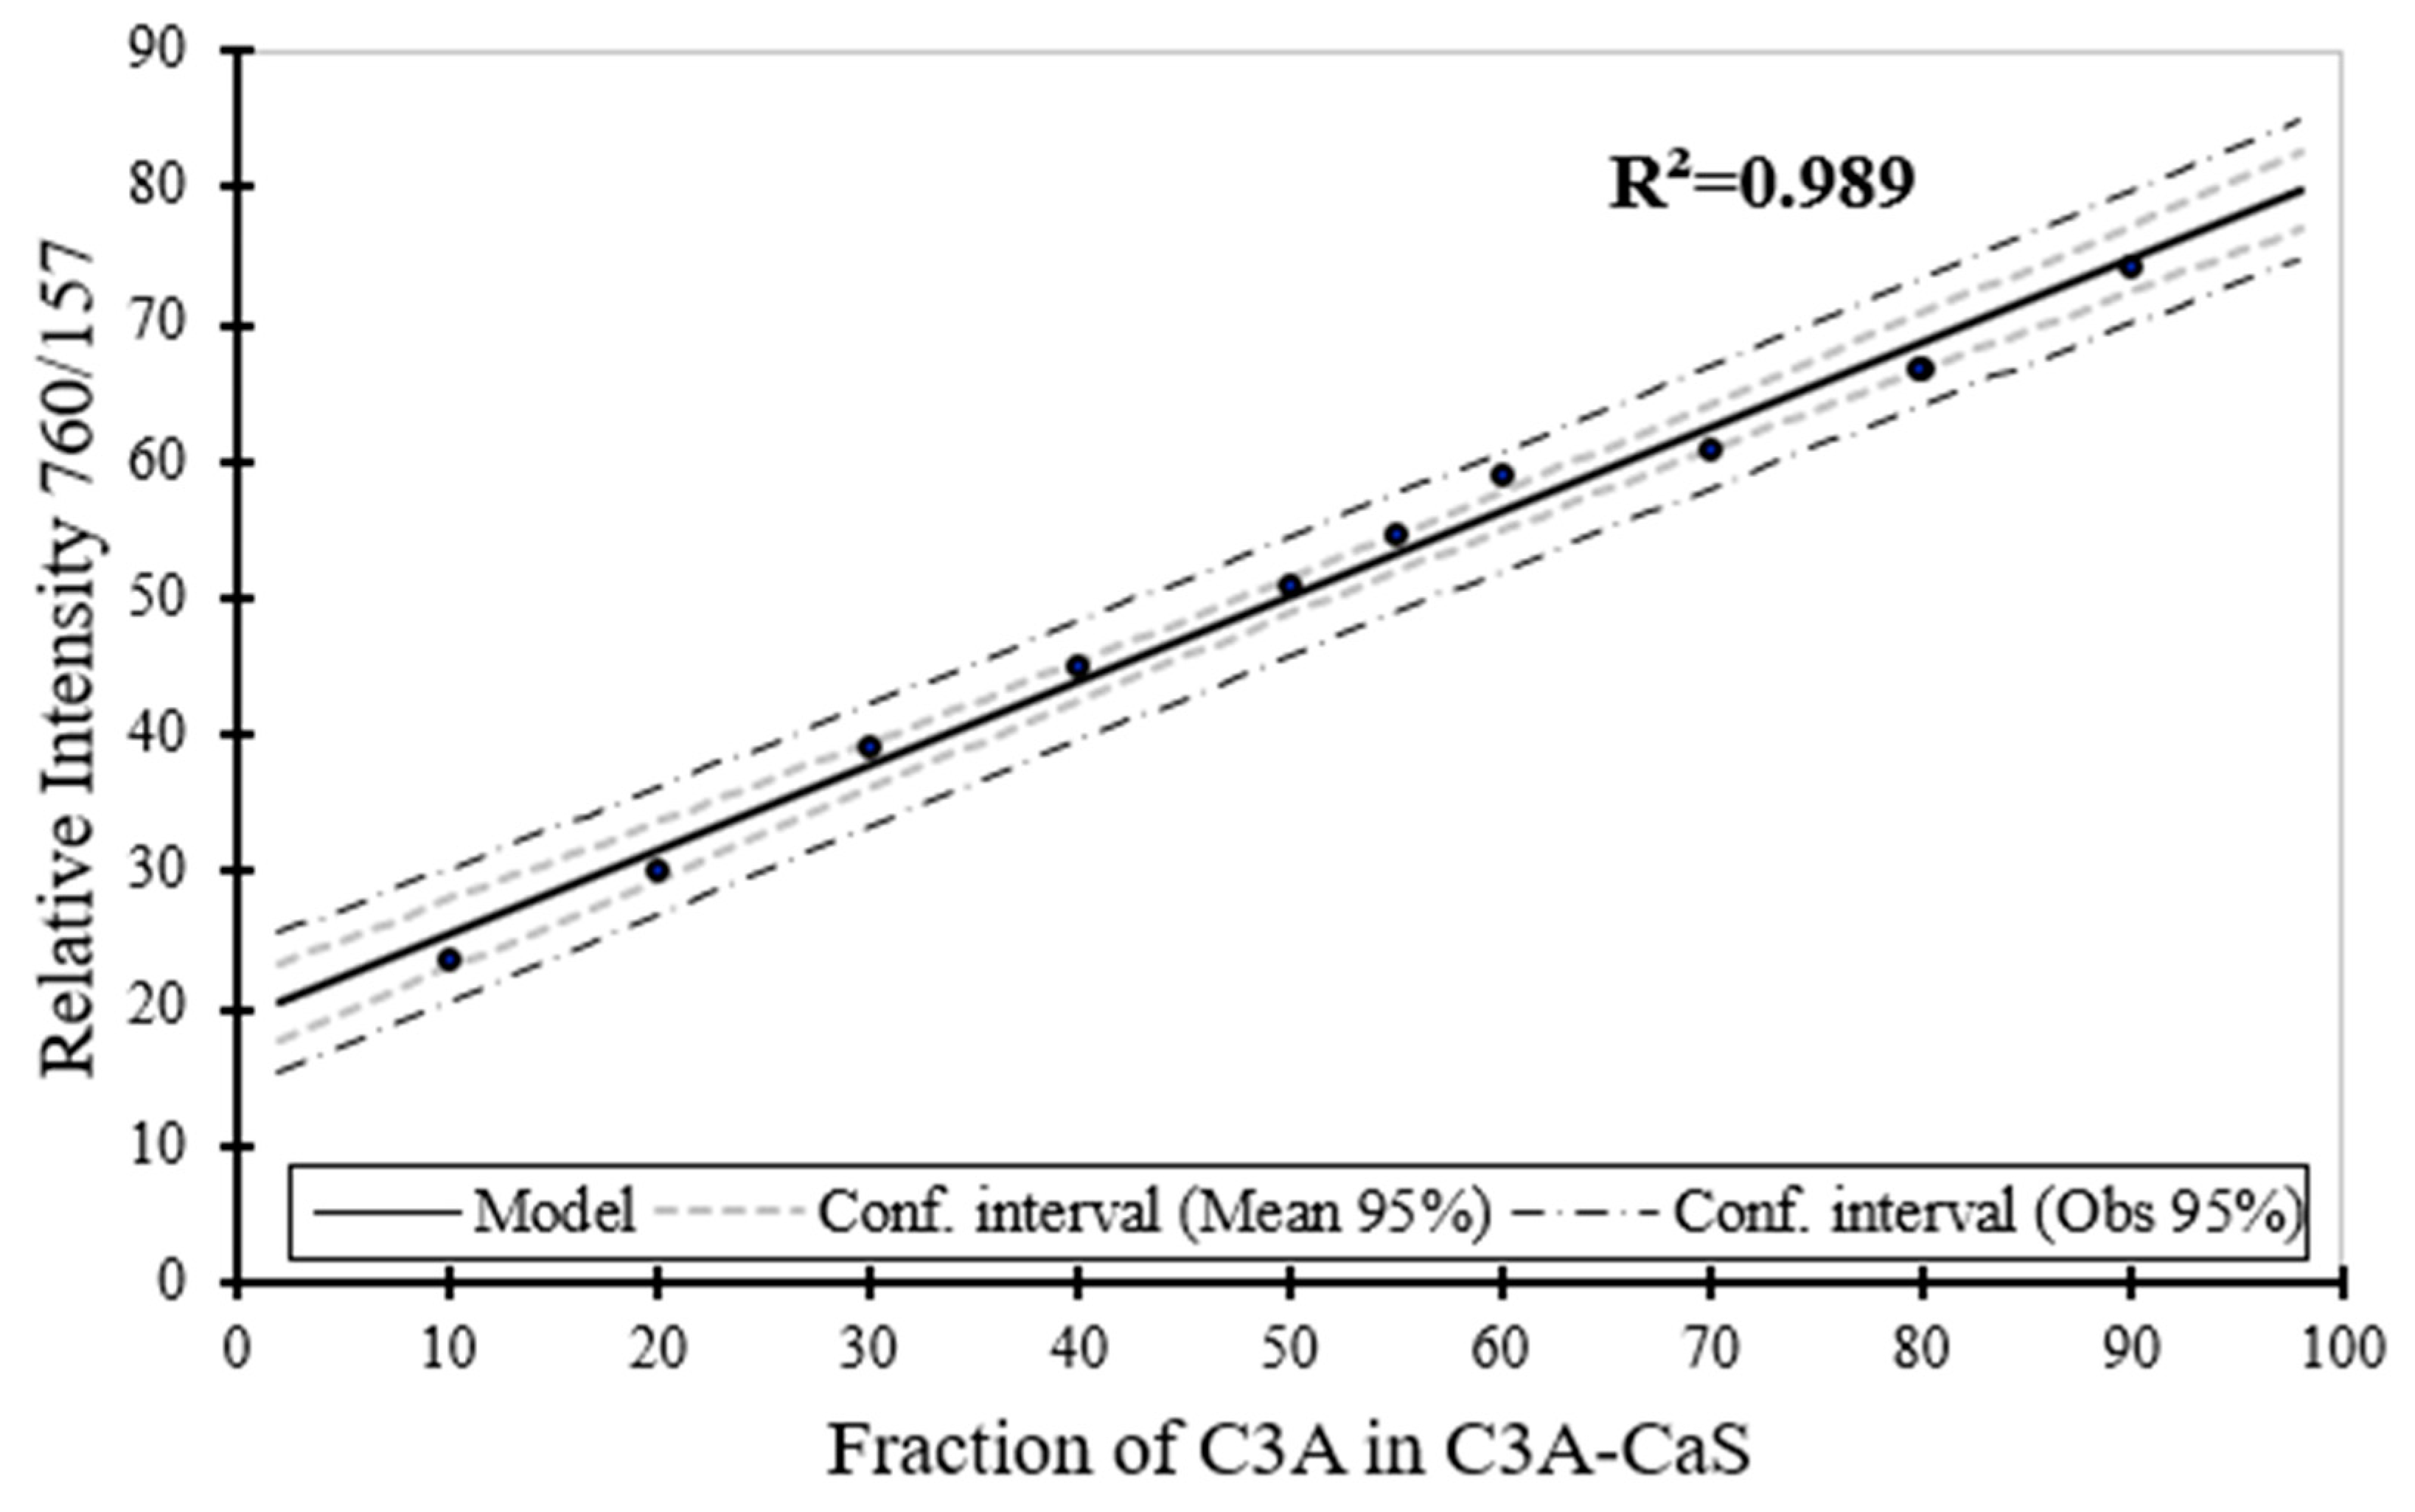
Applsci 10 02113 g016
Figure 17. Raman spectroscopy estimation for the phase content (wt. %) for MA as a function of the phase content of MA in C3A–CaS sample.
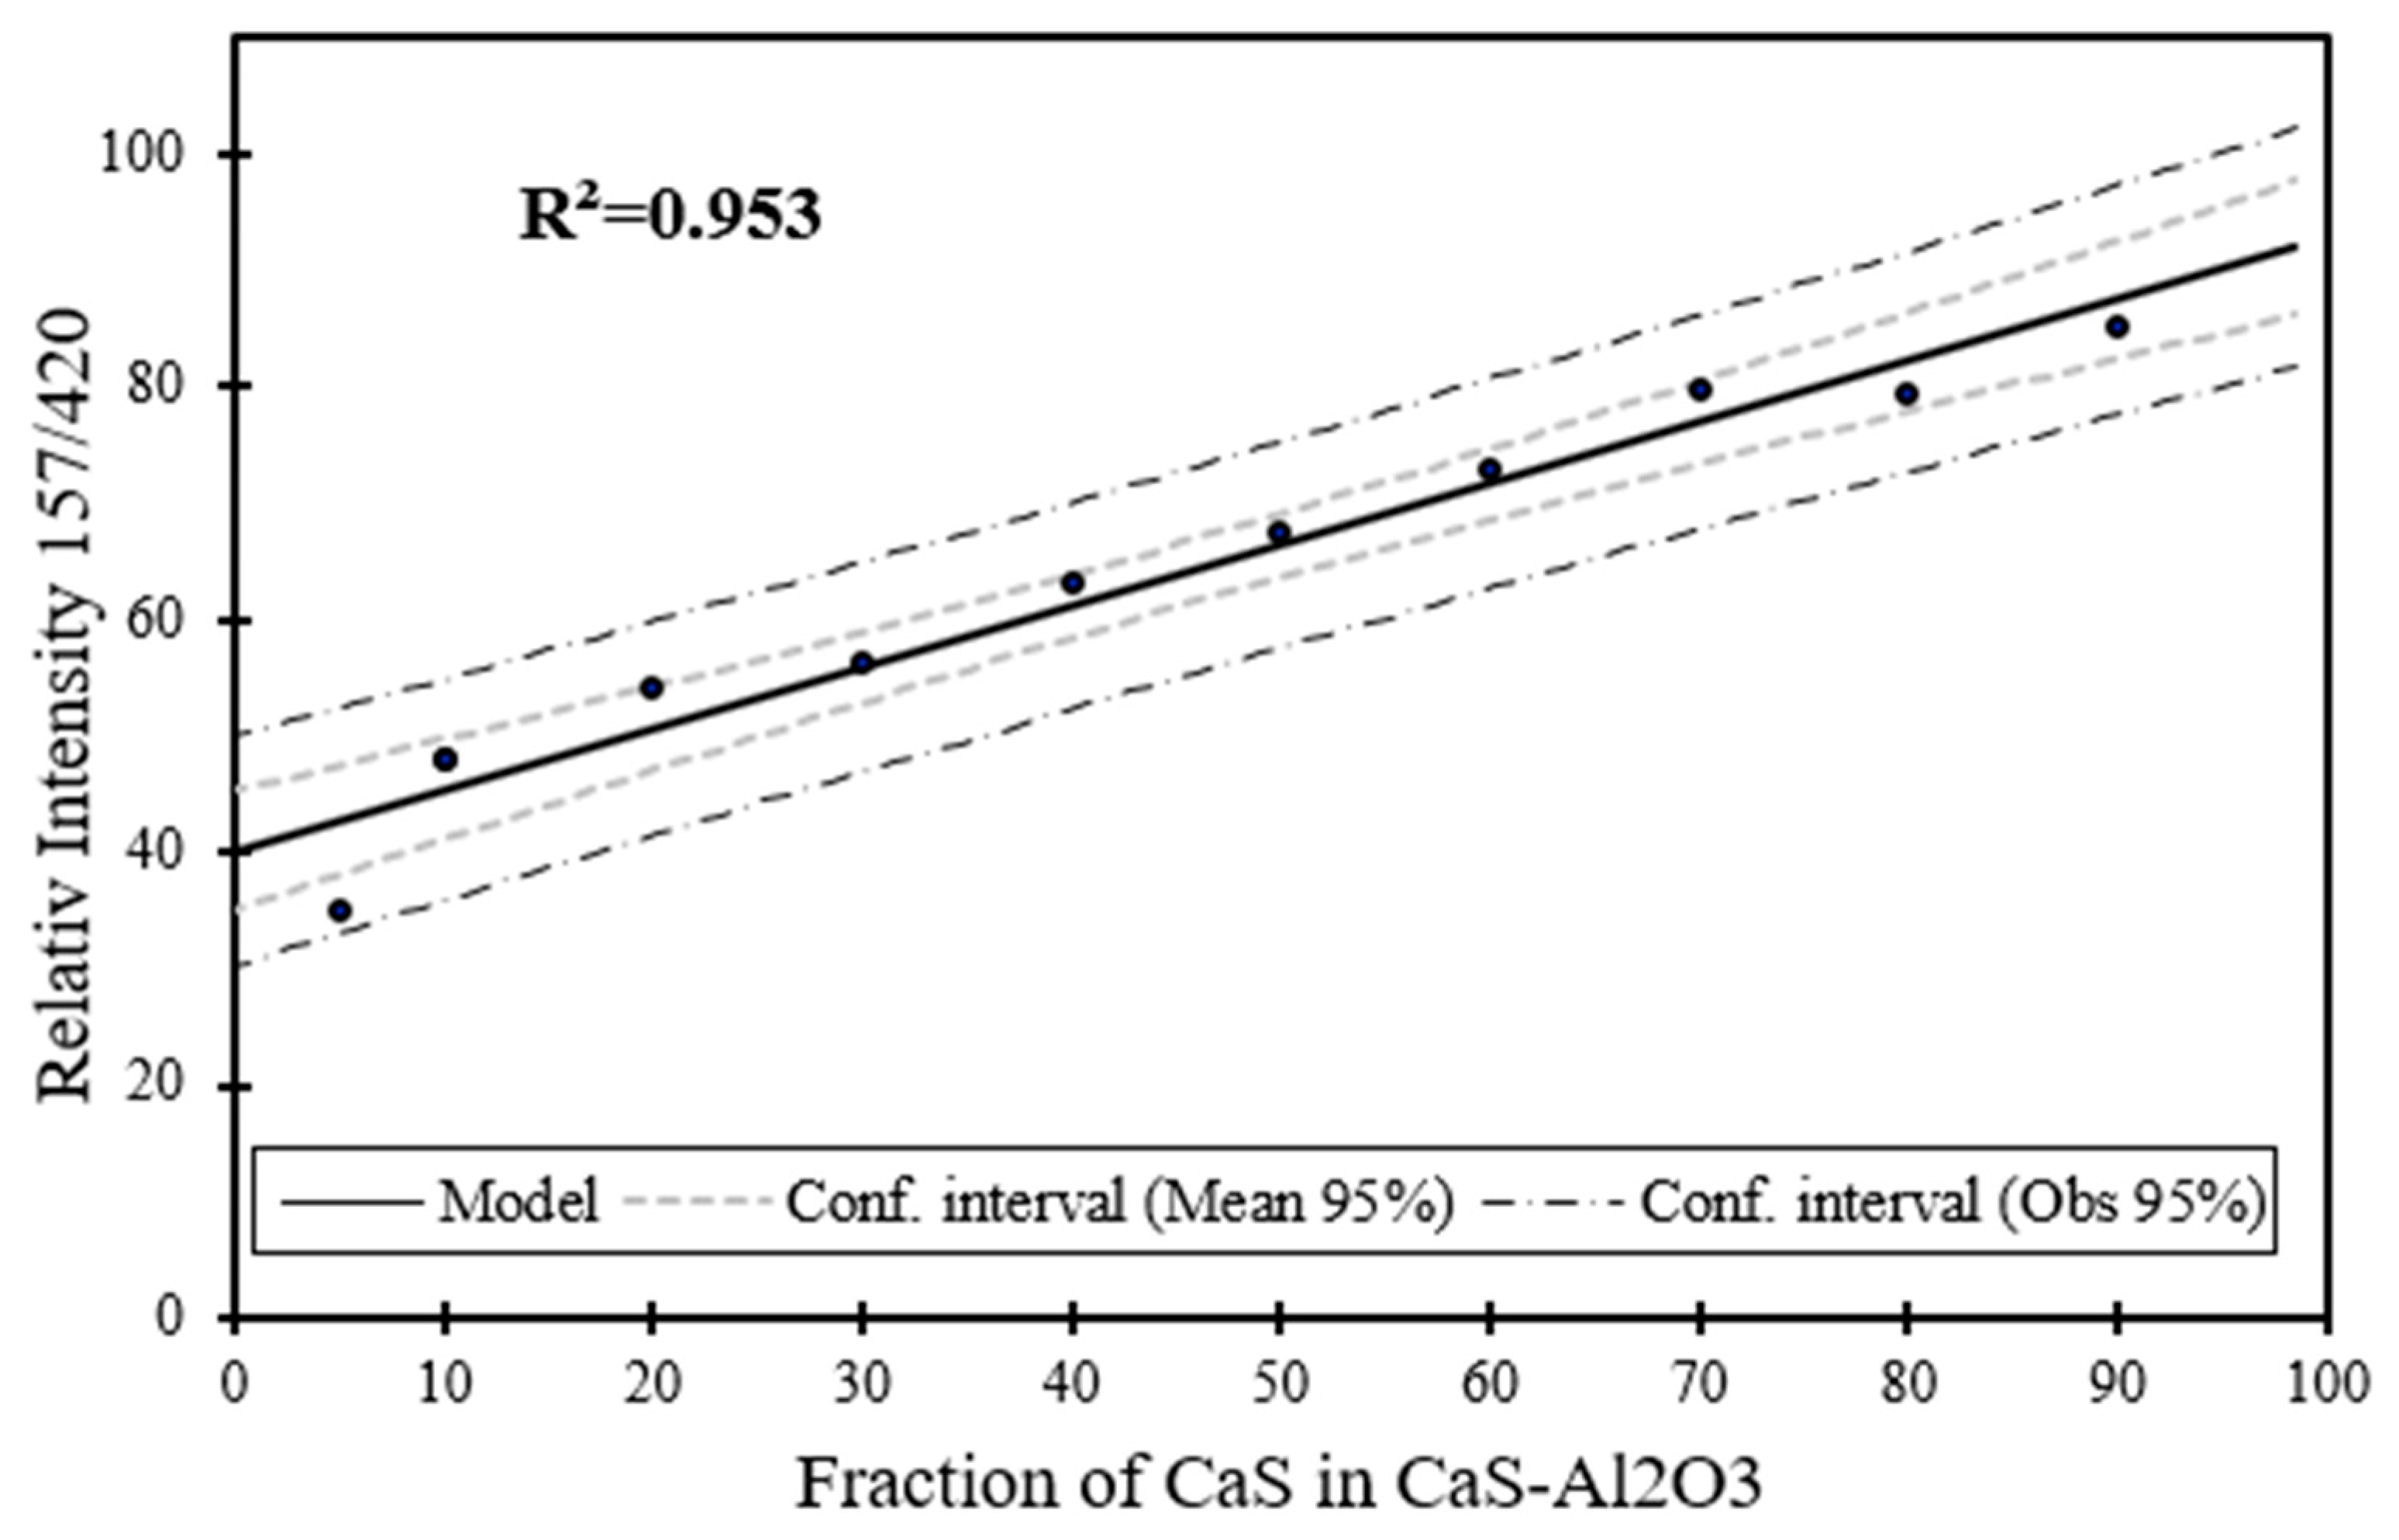
Applsci 10 02113 g017
Figure 18. Raman spectroscopy estimation for the phase content (wt. %) for MA as a function of the phase content of MA in CaS–Al2O3 sample.
Applsci 10 02113 g018
Table 1. Initial sample composition, XRD and XRF analyses for binary calcium sulphide-aluminate spinel phases of MgO∙Al2O3 (MA)–CaS.
Initial Phase Composition (wt%)XRD Phase Composition (wt%)XRF Calculated Phase Composition (wt%) and Elemental Data
MgO∙Al2O3CaSMgO∙Al2O3CaSMgO∙Al2O3CaSCaSAlMg
901091987137.277.0333.2712.68
80208416762413.2912.6327.7711.22
30703466316943.7835.027.973.70
20802575217938.4830.8611.635.17
1090128879351.9441.552.311.30
Table 2. Initial sample composition, XRD and XRF analyses for binary aluminum oxide-calcium sulphide phases of Al2O3–CaS.
Initial Phase Composition (wt%)XRD Phase Composition (wt%)XRF Calculated Phase Composition (wt%) and Elemental Data
Al2O3CaSAl2O3CaSAl2O3CaSCaSAl
1090892158546.8137.448.16
20801882247642.0833.6612.66
30702872346636.2629.0118.23
60405842574323.5518.8330.41
70307228693117.2813.8236.38
901091989116.285.0246.95
Table 3. Reference and measured Raman shift (cm−1) for starting phases of CA, CaS, C12A7, C3A, Al2O3, and MgO∙Al2O3 (where s is strong, m is medium, and w is weak).
PhaseMeasured Peaks [Raman Shift, cm−1]Reference [Raman Shift, cm−1]Reference
CaS156–160 s, 190–200 m, 478 w160 s, 185 m, 215 (±15), 485 (±10) w[12]
C12A7517 s, 781 m, 314 m312–333 m, 516–517 m, 772 m, 779 m[13,15]
C3A766 s, 512 m,756–760 s, 506–508 m[13,15]
Al2O3420 s, 386 m, 760 m413–420 s, 375–382 m, 748–751 m[11]
MgO∙Al2O3412 s, 674 m, 773 m409–412 s, 767–772 m, 666–674 m[14]
Table 4. Evaluation of the coefficient of determination (R2) and mean absolute error (MAE) for the prediction and validation between the phase content and relative intensity of the Raman peaks and phase content for CaS–CA.
Training DataValidation
PhasesRelative IntensityMean (R2)Mean (MAE)Mean (R2)Mean (MAE)Sum MAERelative Stability
CaS-CA157/5240.973.490.983.717.200.48
CaS-CA157/7900.926.080.936.1212.200.15
CaS-CA200/5240.945.300.945.5010.800.17
CaS-CA200/7900.839.270.849.4918.760.07
CaS-CA478/5240.7511.720.7612.1223.840.05
CaS-CA478/7900.849.220.849.3618.580.07
Table 5. Evaluation of the coefficient of determination (R2) and mean absolute error (MAE) for the prediction and validation between the phase content and relative intensity of the Raman peaks and phase content for MA–CaS.
Training DataValidation
PhasesRelative IntensityMean (R2)Mean (MAE)Mean (R2)Mean (MAE)Sum MAERelative Stability
MA-CaS412//1570.964.350.964.528.870.56
MA-CaS776/1570.7211.000.7211.9222.920.06
MA-CaS412//2000.877.530.877.8415.370.14
MA-CaS412//4780.7611.010.7711.4722.480.13
MA-CaS776//4780.7510.650.7411.2921.940.07
MA-CaS776//2000.6312.680.6213.5726.260.04
Table 6. Evaluation of the coefficient of determination (R2) and mean absolute error (MAE) for the prediction and validation between the phase content and relative intensity of the Raman peaks and phase content for C12A7–CaS.
Training DataValidation
PhasesRelative IntensityMean (R2)Mean (MAE)Mean (R2)Mean (MAE)Sum MAERelative Stability
C12A7-CaS517/1570.982.760.982.965.720.98
C12A7-CaS517/2000.848.030.848.7216.754.44
C12A7-CaS781/1570.906.060.906.4312.491.54
C12A7-CaS781/2000.7510.490.7211.3121.803.78
C12A7-CaS774/1570.7610.300.8011.1021.404.78
C12A7-CaS774/2000.779.550.7711.1620.715.73
Table 7. Evaluation of the coefficient of determination (R2) and mean absolute error (MAE) for the prediction and validation between the phase content and relative intensity of the Raman peaks and phase content for C3A-CaS.
Training DataValidation
PhasesRelative IntensityMean (R2)Mean (MAE)Mean (R2)Mean (MAE)Sum MAERelative Stability
C3A-CaS510/1570.964.030.974.078.100.67
C3A-CaS766/1570.886.500.886.9213.420.09
C3A-CaS510/1900.877.720.868.7416.460.16
C3A-CaS766/1900.858.070.828.9717.040.08
Table 8. Evaluation of the coefficient of determination (R2) and mean absolute error (MAE) for the prediction and validation between the phase content and relative intensity of the Raman peaks and phase content for CaS- Al2O3.
Training DataValidation
PhasesRelative IntensityMean (R2)Mean (MAE)Mean (R2) Mean (MAE)Sum MAERelative Stability
CaS- Al2O3157/4200.945.650.956.2311.880.46
CaS- Al2O3157/3860.5814.680.5915.4930.170.06
CaS-Al2O3157/7600.829.720.8310.8620.580.17
CaS-Al2O3198/4200.915.490.905.8411.330.14
CaS-Al2O3198/3860.3818.500.4019.9938.490.03
CaS-Al2O3198/7600.809.880.8211.1020.980.14

