Article

Pneumatically Actuated Microfluidic Platform for Reconstituting 3D Vascular Tissue Compression

1
Department of Mechanical and Aerospace Engineering, Seoul National University, Seoul 151-742, Korea
2
Bioengineering, Seoul National University, Seoul 151-742, Korea
*
Author to whom correspondence should be addressed.
Appl. Sci. 2020, 10(6), 2027; https://doi.org/10.3390/app10062027
Submission received: 21 January 2020 / Revised: 26 February 2020 / Accepted: 3 March 2020 / Published: 17 March 2020
(This article belongs to the Special Issue Biomaterials and Biofabrication)

Abstract

:
In vivo, blood vessels constitutively experience mechanical stresses exerted by adjacent tissues and other structural elements. Vascular collapse, a structural failure of vascular tissues, may stem from any number of possible compressive forces ranging from injury to tumor growth and can promote inflammation. In particular, endothelial cells are continuously exposed to varying mechanical stimuli, internally and externally, resulting in blood vessel deformation and injury. This study proposed a method to model biomechanical-stimuli-induced blood vessel compression in vitro within a polydimethylsiloxane (PDMS) microfluidic 3D microvascular tissue culture platform with an integrated pneumatically actuated compression mechanism. 3D microvascular tissues were cultured within the device. Histological reactions to compressive forces were quantified and shown to be the following: live/dead assays indicated the presence of a microvascular dead zone within high-stress regions and reactive oxygen species (ROS) quantification exhibited a stress-dependent increase. Fluorescein isothiocyanate (FITC)-dextran flow assays showed that compressed vessels developed structural failures and increased leakiness; finite element analysis (FEA) corroborated the experimental data, indicating that the suggested model of vascular tissue deformation and stress distribution was conceptually sound. As such, this study provides a powerful and accessible in vitro method of modeling microphysiological reactions of microvascular tissues to compressive stress, paving the way for further studies into vascular failure as a result of external stress.

1. Introduction

In vivo, many cells in the human body continuously experience various mechanical stimuli. For example, endothelial cells (ECs) in blood vessels are exposed to varying mechanical stimuli, internally and externally. Mechanical stress causes EC phenotype alternation, vascular cytoskeletal remodeling, and disease progression [1]. Solid stress has a directional component as tissues have different structural characteristics depending on the location and orientation. The interactions between blood vessel networks and external solid stress remains comparatively under-investigated despite their importance to the fundamental understanding of many pathological conditions.
Recent advancements in microfluidic microfabrication technologies have demonstrated the feasibility of generating in vitro vascular network models within microfluidic stromal and endothelial cell co-culture chips [2,3,4]. These microfluidic platforms successfully generated perfusable vascular lumina with in-vivo-like tissue features, junction protein expression, and barrier functions.
While pre-existing vascular tissue culture platforms have achieved reliable vasculature generation, to date, there has been minimal research using a biomechanical approach based on a microfluidic device that is used for inducing biomechanical stresses on a vascular network within a controlled microfluidic setting.
Quake valves are pneumatic microvalves made with polydimethylsiloxane (PDMS). These monolithic and elastomeric valves are easy to fabricate and can be utilized in flow control and microfluidic metering [5]. Several studies have incorporated Quake valves or pneumatically actuated valves to facilitate cell co-culture in both isolated and interacting culture environments by regulating the opening and closing of channels [6,7,8,9]. Yap et al. adopted Quake valves as a means of applying mechanical stress to mildly stretch the axons cultured in a microfluidic device [10]. The results showed similar responses to in vivo models, approving Quake valves as a reliable source of biomechanical stress.
In this study, we proposed a novel multilayer microfluidic platform that incorporates a 3D perfusable in vitro blood vessel to mimic biomechanical stress in the range of 0.5 psi to 2.5 psi by utilizing Quake valves. Live/dead assays, reactive oxygen species (ROS) levels, and vascular permeability assays characterized the vascular tissue states within the compression platform. Experimental observations showed stress-dependent histological reactions of cell death, ROS level increases, and increased vascular leakiness in gradients that corroborated with the finite element analysis (FEA) models of stress distribution, indicating that the experimental and theoretical models of stress propagation within the in vitro vasculature was sound. These results emphasize the importance of solid-stress-induced blood vessel compression on vascular physiological and pathological conditions and suggest that controlling biomechanical stress can be an important factor in controlling vascular abnormalities.

2. Results and Discussion

2.1. Microfluidic Chip Design and Experimental Design

Previous studies generated perfusable microvessel networks in a microfluidic device through the co-culture of human umbilical vein endothelial cells (HUVECs) and stromal cells (lung fibroblasts (LFs)) [2]. Endothelial cell sprouts induced by stromal cells resulted in end-to-end perfusible lumina, allowing for uninterrupted fluid flow through the vessel networks. While the single-layer design can reconstitute three-dimensional vessel networks and induce interstitial flow, it cannot induce biomechanical stress in the generated vascular network. The proposed platform included an additional layer to incorporate a pneumatic actuation chamber, allowing for the exertion of compressive forces on the vascular channel (Figure 1A,B).
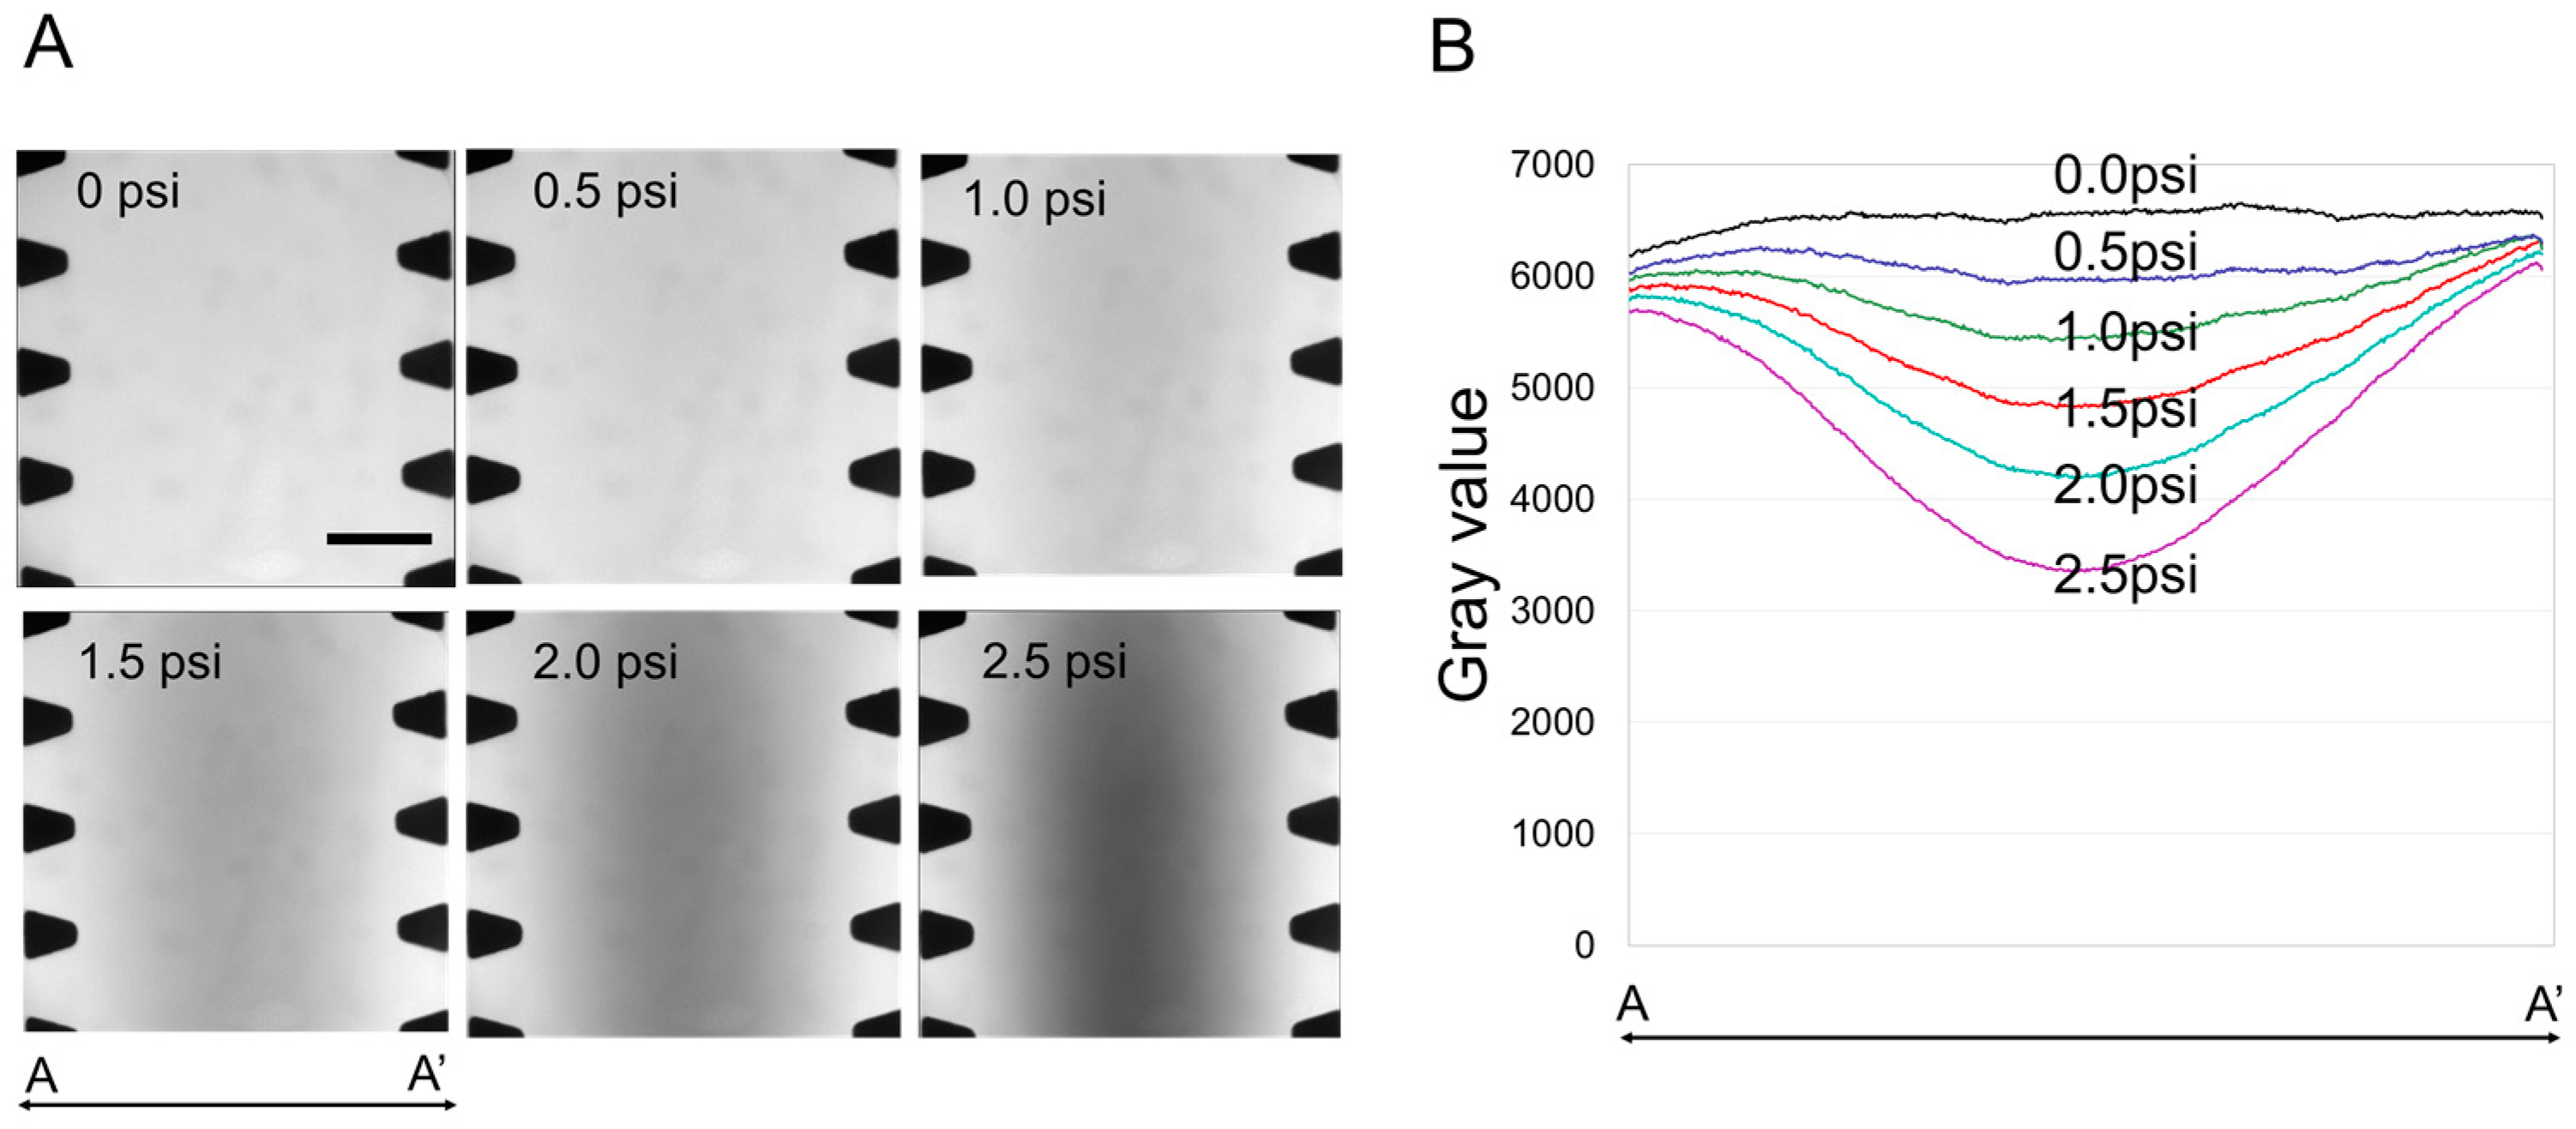
The microfluidic chip components were fabricated through soft-lithographed PDMS. The microfluidic chip was composed of an air channel and cell culture compartments. In the cell culture layer, the chip consisted of five parallel channels; a central channel, two stromal cell culture channels, and two media channels. All channels were 800 μm wide and 70 μm in height (Figure 1C). One hundred micrometer micropost gaps facilitated the compartmentalization of stromal and endothelial culture channels during initial fluid and cell patterning, allowing for vasculogenic endothelial organization. The PDMS membrane between the air channel and cell culture layer was 70 μm high (Figure 1D–F) and was actuated using a CellASIC pump (Merck KGaA, Darmstadt, Germany) (Figure 1A). Induced air pressures were held for one minute for each experimental test condition (Figure 1G,H). Prior to testing on live microvascular tissues, the compression mechanism was tested on a channel filled with a 0.5 mg/mL FITC-dextran suspension in Phosphate-Buffered Saline (PBS). Increases in pressure resulted in a decrease of fluorescence along the sagittal axis of the channel, corresponding to the displacement of beads with the PDMS membrane deflection (Figure 2A,B). In the absence of applied pressure, the fluorescence intensity was uniform throughout the channel. The decreased fluorescence profile indicates the gap between the deflected PDMS membrane and glass substrate, and the decrease in fluorescence represents the deflection of the PDMS membrane in accordance with an increasing applied pressure.

2.2. Finite Element Analysis Model of a Compressed Blood Vessel

The deformation of the PDMS membrane and blood vessel were simulated using an FEA model to validate the experimental measurements and to analyze and predict the deformation of the PDMS membrane and blood vessel (Figure S1). FEA was used to model the deflection of the PDMS membrane via increasing the pressure of the pump channel (Figure 3A,B, Movie S1). As the pressure increased, contact occurred between the bottom surface of the PDMS membrane and the upper surface of the blood vessel (Figure 3C, Movie S2). Additional pressure resulted in an increased compressive force on the glass from the deflected membrane, forming a hard contact. These contacts were termed “surface to surface” contact conditions in ABAQUS simulations.
As a proof of concept, we analyzed the stress and strain distribution along a blood vessel channel cross-section using FEA. The PDMS membrane deformation from the air pressure induced a corresponding blood vessel deformation due to the displacement. Stresses exerted upon the blood vessels within this model are expected to correspond to the biomechanical stresses associated with the blood vessel compression and failure, and as such, the stress distribution of stress within a given blood vessel is crucial to the understanding of stress-induced vessel failure.
For the purpose of simulation simplicity, the pre-actuation gap between the PDMS membrane and the topmost layers of the vascular tissues was assumed to be 10 μm. In this model, contact between the PDMS and upper surface of blood vessel occurred from 0.1 psi. As the pressure increased, the lower portions of the blood vessels made hard contact with the glass substrate. At 1.6 psi, the upper and lower blood vessels were compressed together in a self-contact region, after which, the self-contact region expanded in area with additional pressure (Figure 3D).
The rate of stress increase from 0 psi to 1.0 psi was relatively small, but increased significantly after 1.5 psi. At the early stage of deformation, the topmost layers of the vascular tissue merely contacted the PDMS membrane. Additional pressure caused the PDMS to further deform and compress the tissues against the rigid glass substrate. The maximum observed stress level of 5.54MPa occurred at 1.6 psi, after which, the self-contact area sustained the maximum stress level until 2.5 psi (Figure 3C,D).

2.3. The Effect of Compressive Stress on a 3D Perfusable Microvessel Network

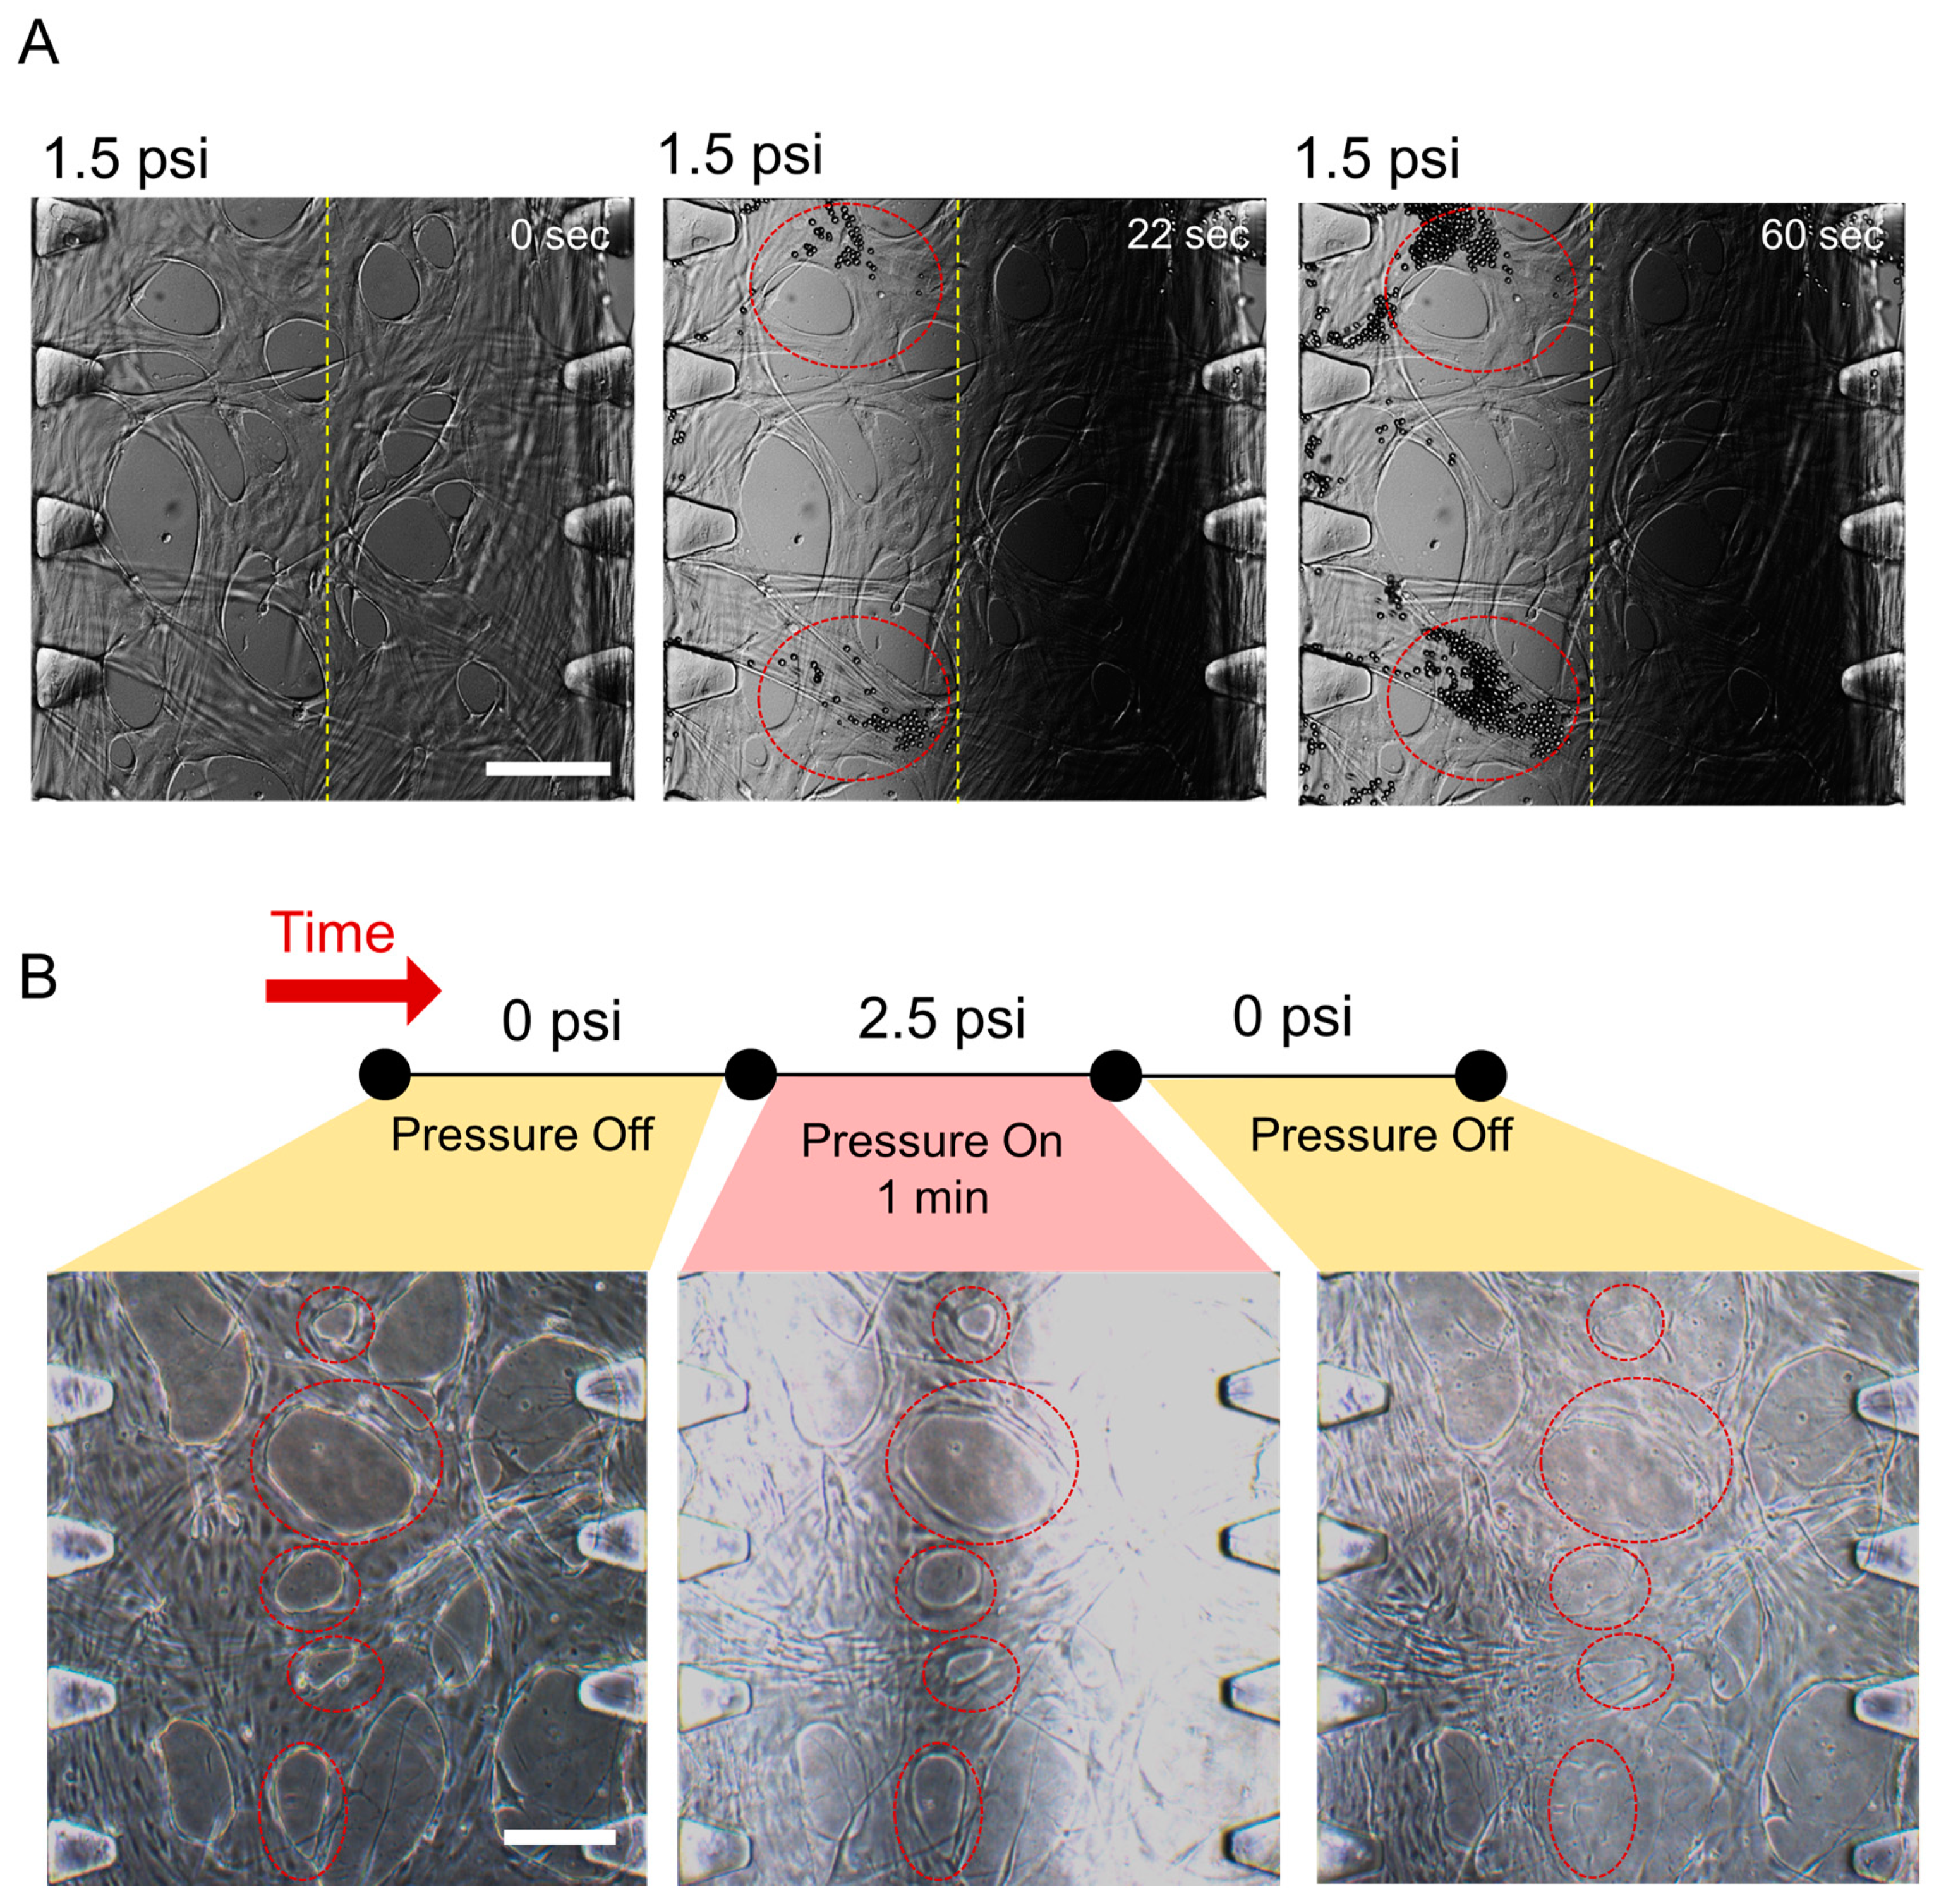
To demonstrate the compression of perfusable microvessel networks in vitro, the vessels were perfused with a 7-µm suspension of microbeads. Minute differentials between the culture media reservoirs (≈40 µL) generated a hydrostatic pressure-gradient-induced interstitial flow, which carried beads through the entire network. When 1.5 psi was applied to the central channel, the network collapsed and did not permit microbeads to pass through the compressed area, instead causing the microbeads to aggregate in the center of the vascular network (Figure 4A, Movie S3). After releasing the applied pressure, microbeads resumed their flow through the vessels. Smooth and continuous vessel boundaries were easy to observe in the control (0.0 psi), but were difficult to distinguish after exposure to 2.5 psi (Figure 4B).
It is hypothesized that blood vessel compression reduces tumor perfusion and therefore the supply of oxygen and nutrients. The formation of the necrotic center is thought to be caused by the limited oxygen and nutrient supply since both are essential for tumor progression. This paradox has raised questions about the role of blood vessel progression and solid stress in cancer progression [11,12]. Blood vessel compression can also exclude tumor sites from the systemic administration of therapeutic cancer drugs, reducing the accessibility of cancer drugs to the target cancerous cells [13,14]. Damaged vascular tissues also exhibit flow-constrictive phenomena through the increased expression of pro-coagulant factors, such as pro-thrombin, or pro-inflammatory factors [15]. Constriction can also potentially model hypertensive vasculature since hypertensive endothelial cells exhibit prolonged periods of vasoconstriction [16]. The conjunctiva, a thin and watery membrane that coats the eye, contains many small capillaries that can burst and cause hemorrhages that appear as red patches on the whites of the eye. While the majority of subconjunctival hemorrhages occur ideopathically, many cases result from external compressive pressures.
Overall, compression-induced vascular pathogenesis is a common vehicle of vascular disease, and the proposed platform may prove useful for further understanding of the mechanisms of mechanical compression and vascular tissue perfusability and disease.

2.4. The Effect of Compressive Stress on Endothelial Cell Viability

Post-treatment vascular tissue viability was partially characterized through a live/dead assay. The cell viability remained largely unchanged from 0 psi to 1.5 psi, and decreased dramatically between 1.5 psi and 2.0 psi. At pressures exceeding 2.0 psi, cellular “dead zones” began to form along the sagittal axis of the channel center, following the path of the PDMS membrane (Figure 5). Dead zones increased in area with further increases in pressure. The presence of the dead zone between 2.0 psi and 2.5 psi corroborated with the ABAQUS simulation, which indicated a hard contact between the PDMS and glass (Figure 3C,D).
Tissues are known to deform and lyse under significant exposure to mechanical stress [17]. From 0 psi to 1.5 psi, few cells died (cell viability 0.0 psi: 98.6% ± 0.5%, 0.5 psi: 97.9% ± 1.0%, 1.0 psi: 96.3% ± 0.7% and 1.5 psi: 96.3% ± 1.3%). From 2.0 psi to 2.5 psi, the viability decreased to 66.9% ± 7.6% and 40.3% ± 7.4%, respectively, indicating that vascular networks were biomechanically damaged due to the compressive stress (Figure S2).
To confirm that direct contact between the PDMS membrane, vascular network, and glass substrate severely damaged the endothelial cells, further viability testing was done through Calcein-AM staining. Calcein-AM, a cell-permeant dye, is used as a means of assessing cell survival. In living cells, nonfluorescent Calcein-AM metabolizes into cell-bound fluorescent calcein by cytosolic esterases. The absence of calcein fluorescence, which indicated the absence of living cells, was observed in 2.0 psi and 2.5 psi conditions due to the vascular network damage or death caused by compressive stress.
Additionally, since we introduced Calcein-AM dye into the media channels, the endothelial cells located at the lateral side of the center channel had a higher chance of interacting with Calcein-AM dye compared with the middle of the center channel. Therefore, the Calcein-AM channels showed a dimmer center compared with the boundary.

2.5. The Effect of Solid Stress on Reactive Oxygen Species Generation

Reactive oxygen species (ROS) are highly reactive oxygen-containing molecules generated as a byproduct of cellular metabolism [18]. Healthy cells regulate ROS levels and prevent oxidative stress by managing homeostatic antioxidant mechanisms, such as the catalysis of peroxides into water by superoxide dismutase. Under unfavorable conditions, cells may exhibit diminished ROS removal capabilities, leading to oxidative-stress-induced damage and even death [19]. Common diseases caused by elevated ROS levels include cardiovascular diseases, pulmonary disorders, and diabetes, which are all related to endothelial dysfunction. In the case of diabetes, increased ROS production with reduced oxygen consumption results in damage to endothelial cells [20]. A microfluidic device introduced by Chin et al. investigated the endothelial monolayer under pulsatile shear stress and showed that the effects of shear stress on endothelial cells and ROS levels are critical for mimicking the functionalities of endothelial cells in vitro [21].
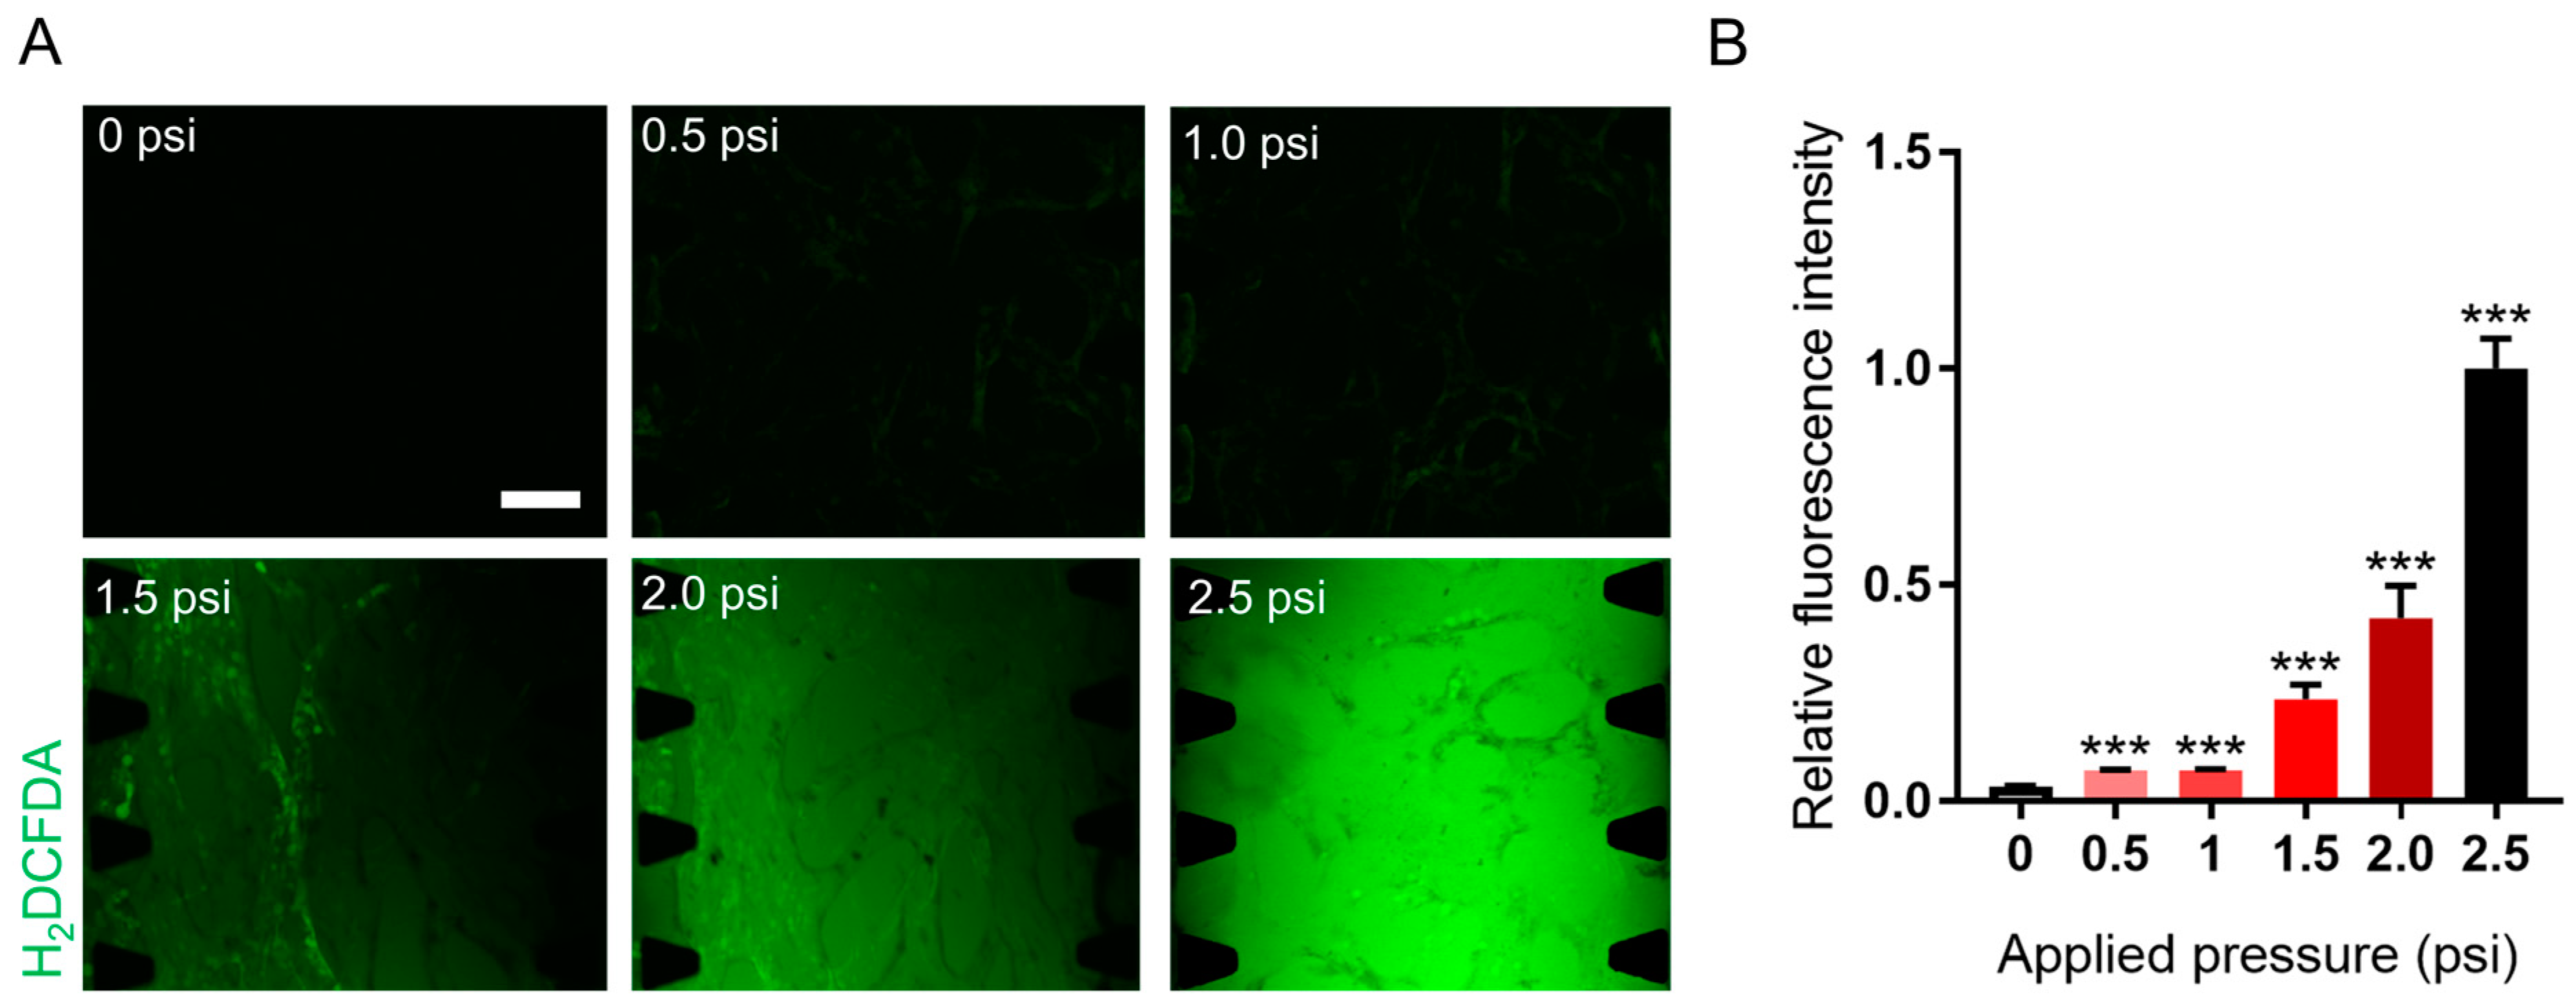
To assess the ROS generation rates as a cellular response to biomechanical compressive stress, vascular tissues were observed at six levels of compressive stress. A significant increase of ROS levels were detected from 1.5 psi to 2.5 psi compared to readings below 1.5 psi. ROS production levels increased by 6.75-fold, 12.1-fold, and 28.63-fold at 1.5 psi, 2.0 psi, and 2.5 psi, respectively, compared to the baseline 0 psi condition (Figure 6A,B), indicating that ROS levels increased exponentially with mechanical stress. ABAQUS modeling corroborated the observed correlation between ROS generation and compression, also indicating that an abrupt increase of von Mises stress occurred from 1.5 psi to 2.5 psi conditions (Figure 3C,D). The results of both the experiment and simulation indicates the importance of investigating the effect of biomechanical stress on the fully perfusable 3D vascular networks under physiological and pathological conditions since they may reflect the various blood vessel damage patterns in vivo [22]. It can be extrapolated that higher levels of biomechanical stress may substantially increase the intracellular level of ROS beyond the tested parameters. These results suggest that applying a mechanical stimulus for 3D vascular tissue compression could generate mechanotransduction, which refers to the conversion of a mechanical stimulus into electrochemical activity [21].

2.6. The Effect of Compressive Stress on Vascular Permeability and Vascular Endothelial (VE)-Cadherin Expression

Abnormal vascular permeability caused by barrier defects are often related to various pathological conditions, such as biomechanical stress and high concentrations of histamines or growth factors [23,24]. To investigate the vascular permeability in response to biomechanical compressive stress, perfusable vascular networks were treated to 0 psi and 1.5 psi conditions for one minute each.
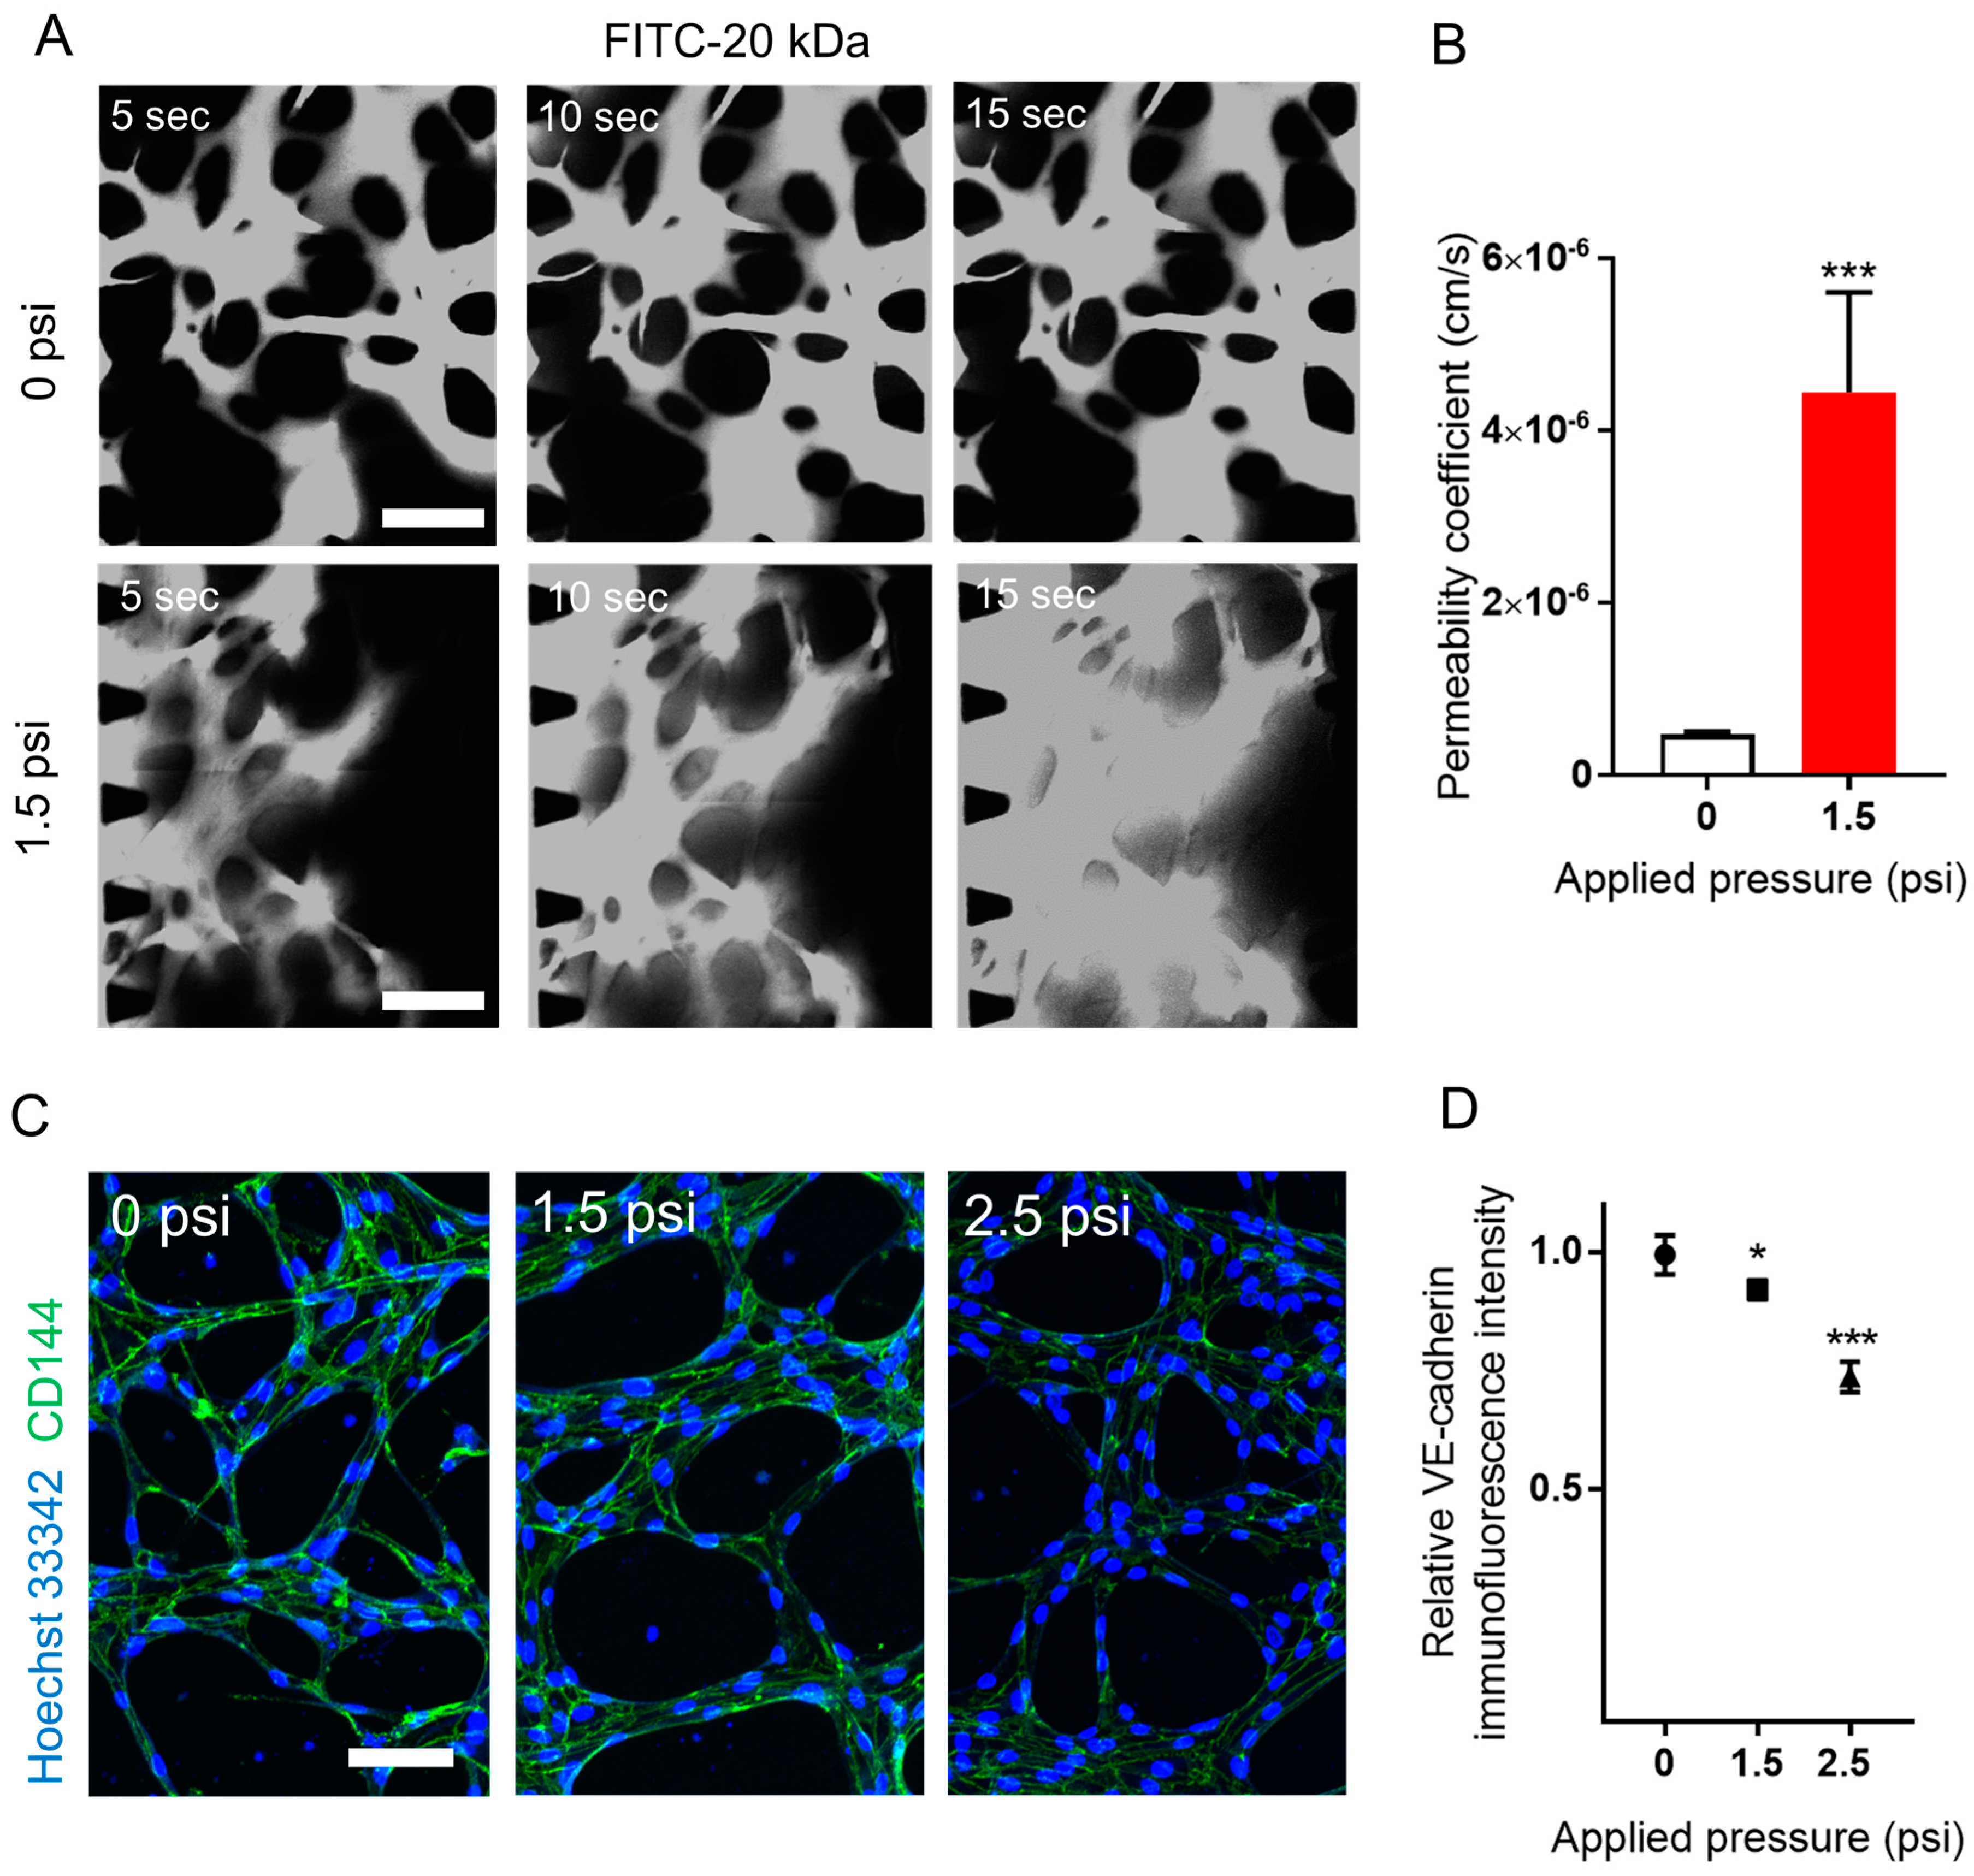
Permeability measurements using FITC-dextran are commonly used for the visualization of blood vessel barrier function. Cultivated vascular networks were perfused with 20 kDa FITC-dextran and imaged in 5 s increments to show the gradual FITC-dextran diffusion from vascular to perivascular regions (Figure 7A). The permeability coefficient value of the 1.5-psi-conditioned vascular tissues was significantly greater than that of the control (control: (4.78 ± 0.28) × 10−7 cm/s, 1.5 psi: (4.44 ± 1.16) × 10−7 cm/s) (Figure 7B).
Further, as shown in Figure 7C,D, we observed a robust and strong expression of the junctional protein VE-cadherin in the 0 psi condition. However, the relative intensity of VE-cadherin was weak when the vascular network was exposed to biomechanical stress. This result indicates that discontinuous tight junctions may imply a higher vascular permeability. In endothelial cells, adherens junctions and tight junctions play an important role in the control of vascular permeability and integrity [24]. If there are abrupt biomechanical damages and pathological conditions in the vascular network, the integrity of adherent and dismantling of tight junctions may induce and change the vascular permeability even though there are no dead endothelial cells; this is consistent with our result.
Endothelial cells respond to mechanical stress in various ways, from rapid responses including ionic conductance to following changes in gene expressions and structural reorganizations [25]. The cell mitosis and death of endothelial cells due to stress lead to leaky cell junctions, which result in increased permeability [21]. A previous study has also reported that external (cyclic) mechanical stress resulted in the increased permeability of the endothelial cell monolayer compared to samples that are not mechanically stressed [26].
To summarize, an in vitro model of vessel perfusability modification through compressive stress may prove highly useful in attempting to quantitatively assess and understand the underlying mechanisms behind many disease conditions.

3. Conclusions

This study presented a novel multi-layered microfluidic chip capable of reconstituting solid compressive stresses on cultivated blood vessels in vitro. The device was capable of mimicking biomechanical stress with the ability to visualize histological reactions before, during, and after biomechanical stress application. Using the proposed platform, engineered vascular tissues were shown to exhibit several complex histological reactions to biomechanical stress. Experimental observations indicated the stress-dependent formations of “dead zones,” increased ROS levels, and increased vessel leakiness in response to the application of compressive forces. As biomechanical stress-induced vascular pathology is both a widespread mechanism of disease and is poorly characterized, this novel integration of vascular tissue culture platform and substrate strain actuation lays the groundwork for further studies into vascular mechanobiology. Indeed, models of compressive solid-force-induced vascular damage can be applied to many real-world applications, especially concerning the safety evaluation of clothing and other wearable devices. For example, prolonged compressive stresses exerted on the body through the use of tight clothes, safety harnesses, and wearable medical device straps may pose a risk for vascular damage. Such risks may benefit from a better means of quantifying the relationship between the exerted forces and the cellular responses from the affected tissues. Although this publication does not explore the effect of compressive forces on the extracellular matrix component of vascular tissues, ultimately, both the extracellular matrix and vascular tissue responses to mechanical stress will likely prove critical to the understanding of biomechanical disease mechanisms.

4. Materials and Methods

4.1. Design and Fabrication of the Microfluidic Chip

A master with positive patterns of photoresist, SU-8 (MicroChem, Microchem Laboratory, Austin, TX, USA), on a silicon wafer was prepared using photolithography [2] and the microfluidic devices were fabricated with PDMS (polydimethylsiloxane, Sylgard 184, Dow Corning, Midland, MI, USA) using multilayer soft lithography and replica molding. The chip utilized a stacked dual-layer design: the upper layer held an air channel for the pneumatically actuated compression mechanism, while the lower layer incorporated a vascular network culture design. The PDMS elastomer and curing agents mixed in a ratio of 10:1 (w/w) were poured onto separate master molds for each of the two device layers. The top air channel layer was cured, demolded, and punched, while the bottom cell culture layer was spin-coated at 500 rpm for 45 s to control for thickness. After the spin-coating process, the bottom layer of PDMS was cured for 60 min on a hot plate at 90 °C before being demolded. Using a biopsy punch (6 mm) and a sharpened blunt syringe needle (0.4 mm), reservoirs for the cell culture medium and hydrogel-cell suspension injection ports were punched from the bottom layer, and plastic reservoirs were affixed to the bottom ports via plasma bonding. The top and bottom layers were then aligned and plasma bonded. The remaining area above the lower layer that was unoccupied by the upper layer was filled with a 10:1 mixture of PDMS again, and was poured and cured to secure the top layer to the bottom, as well as to provide a flat device form factor. The assembled devices were then plasma bonded to a glass coverslip. The devices were sterilized using UV irradiation prior to use.

4.2. Cell Culture

Human Umbilical Vein Endothelial Cells P4 (HUVECs, Lonza, Basel, Switzerland) were cultured in Endothelial Growth Medium (EGM-2, Lonza) and Human Lung Fibroblasts P6 (LFs, Lonza) were cultured in Fibroblast Growth Medium (FGM-2, Lonza); both were cultivated in dish monocultures prior to detachment and seeding.

4.3. Hydrogel and Cell Loading into a Microfluidic Chip

HUVEC (6 × 10⁶/mL) and LF (8 × 10⁶/mL) cell suspensions were mixed with fibrinogen solution (2.5 mg/mL fibrinogen with 0.15 U/mL aprotinin). The cell solutions were mixed with thrombin (0.5 U/mL) and then immediately seeded with LFs injected into the stromal channels and HUVECs into the central channel. After incubating for 5 min to allow for fibrin crosslinkage, the media channels were filled with EGM-2. The microfluidic chips were then incubated at 37 °C in 5% CO2 for 5–6 days.

4.4. Live/Dead Assay

Cell viability was quantified via a Live/Dead viability/cytoxicity assay (L3224, Invitrogen, Carlsbad, CA, USA). After aspirating all four media reservoirs of each device, 150 µL of staining solution prepared from 5 mL Endothelial Growth Medium (EGM-2, Lonza), 10 µL ethidium homodimer-1 (Etdh-1, detecting dead cells Invitrogen, Carlsbad, CA, USA), and 2.5 µL Calcein-AM (detecting live cells, Invitrogen, Carlsbad, CA, USA) and 5 µL hoechst (detecting nuclei; Molecular Probes, Eugene, OR, USA) was pipetted into the media reservoirs. The devices were then incubated at 37 °C in 5% CO2 for 45 min. The fluorescence images were obtained via confocal microscopy (Olympus FV 1000) and the proportions of surviving cells were determined by dividing the total number of live cells (blue without red fluorescence) by the total number of cells (blue fluorescence) at a given focal plane.

4.5. Measurement of ROS Using H2DCFDA

ROS levels were measured using a cell-permeant 2′,7′-dichlorodihydrofluorescein diacetate (H2DCFDA) (D399, Invitrogen). The dye remains non-fluorescent until reacting with ROS (hydrogen peroxide and hydroxyl radicals), after which the reagent is converted into a highly fluorescent 2′,7′-dichlorofluorescein (DCF) molecule. Prior to the mechanical stress induction, the cultured vascular networks were incubated in media containing 10 µM H2DCFDA for 50 min to ascertain a baseline ROS level. After the mechanical stress exposure, fluorescent images were obtained using a confocal microscope (Olympus FV 1000) and analyzed with ImageJ (Java 1.8.0_112, NIH)

4.6. Immunostaining

The samples were fixed with 4% (v/v) paraformaldehyde in PBS for 15 min, followed by 20 min of permeabilization treatment using 0.15% Triton-X100 (Sigma, Basel, Switzerland), and an hour-long treatment with 3% bovine serum albumin (BSA, Sigma) to inhibit non-specific binding. The samples were incubated at 4 °C with antibodies and washed twice with PBS before imaging. Endothelial cell-specific mouse monoclonal human VE-cadherin (Alexa Fluor 488, Molecular Probes, Eugene, OR, USA) and mouse monoclonal human CD31 (Alexa Fluor 647, BioLegend, San Diego, CA, USA).

4.7. Permeability Coefficient Measurement

Fluorescence images of the FITC-dextran diffusion across the vessels were analyzed to calculate the permeability coefficient. After removing all the media in the reservoirs, FITC-dextran was introduced to one of four media reservoirs. Since the engineered microvessels exhibited sufficient lumenization for perfusion, FITC-dextran molecules flowed into the microvessels due to hydrostatic pressure. The 10× magnified images were taken at 5 s intervals for 20 s. In accordance with previous studies in perfusability, the permeability coefficient P was calculated based on the equation below [27]:
P = 1 I W × d I / d t I j ,
where I W is the length of the vessel wall that separates the perivascular and microvessel regions, I j is the mean intensity in the microvessel region, and d I / d t is the rate of intensity increase in the perivascular region. The equation for calculating the permeability coefficient was derived from a previous study [28].

4.8. Finite Element Analysis

Nonlinear deformation of blood vessels is hard to analyze using simple continuum theory. Therefore, FEA was utilized to estimate the nonlinear deformation and to analyze the stress distribution throughout the blood vessel. Commercial FEA software ABAQUS (6.12, Dassault, Paris, France) was used for this simulation. The FEA model consisted of a rigid glass plate, cylindrical-shaped blood vessel, and a PDMS structure. Although the space between the PDMS and blood vessel was full of hydrogel, the hydrogel was excluded from the simulation as it rarely affects the deformation of the PDMS and blood vessels. A rigid model was used for the rigid glass plate because glass is not affected by PDMS deformation.
Quadric rectangular shell elements were used to describe the thinness and deformation of the blood vessels. Eight node brick elements (C3D8R) were used to model the PDMS structure since the boundary conditions were set for the ends of the PDMS structure to prevent rigid motion.
Table 1 shows the assumed properties of the PDMS and blood vessels for the purpose of the simulation. The properties of the PDMS refer according to the stiffening condition [29], and the wall thickness of a given blood vessel was assumed to be 2 μm, with a Poisson’s ratio of 0.45 [30].

Supplementary Materials

The following are available online at https://www.mdpi.com/2076-3417/10/6/2027/s1, Figure S1. Simplified model to predict the deformation of PDMS membrane (gray) and blood vessel (dark red); Figure S2. Endothelial cell viability according to different pressure; Movie S1. FEA modeling of the PDMS membrane deformation; Movie S2. FEA modeling of the blood vessel deformation; Movie S3. The effect of compressive stress to 3D perfusable microvessel network: microbead flowing test.

Author Contributions

Conceived and designed the experiment: J.A., H.L., K.S., D.P., M.C., and N.L.J. Performed the experiment: J.A., H.L., and D.P. Analyzed the data: J.A., J.Y., H.L., H.K., J.L. (Jungseub Lee), J.L. (Jungeun Lim) and H.C. Contributed reagents/materials/analysis tools: M.C. and N.L.J. Wrote the paper: J.A. All authors have read and agreed to the published version of the manuscript.

Funding

This research was supported by the Basic Science Research Program through the National Research Foundation of Korea (NRF) funded by the Ministry of Science, ICT & Future Planning (NRF-2018R1A2A1A05019550, NRF-2019R1A4A2001651) and a National Research Foundation of Korea (NRF) grant funded by the Korea government (MSIP) (No. 2012R1A3A2048841).

Acknowledgments

The auhors thank soo-jung oh for insightful comments and inspiring this work.

Conflicts of Interest

The authors declare no conflict of interest.

References

  1. Hahn, C.; Schwartz, M.A. Mechanotransduction in vascular physiology and atherogenesis. Nat. Rev. Mol. Cell Biol. 2009, 10, 53. [Google Scholar] [CrossRef] [PubMed] [Green Version]
  2. Kim, S.; Lee, H.; Chung, M.; Jeon, N.L. Engineering of functional, perfusable 3D microvascular networks on a chip. Lab Chip 2013, 13, 1489–1500. [Google Scholar] [CrossRef] [PubMed]
  3. Kim, S.; Chung, M.; Jeon, N.L. Three-dimensional biomimetic model to reconstitute sprouting lymphangiogenesis in vitro. Biomaterials 2016, 78, 115–128. [Google Scholar] [CrossRef] [PubMed]
  4. Ahn, J.; Ko, J.; Lee, S.; Yu, J.; Kim, Y.; Jeon, N.L. Microfluidics in nanoparticle drug delivery; From synthesis to pre-clinical screening. Adv. Drug Deliv. Rev. 2018, 128, 29–53. [Google Scholar] [CrossRef] [PubMed]
  5. Unger, M.A.; Chou, H.-P.; Thorsen, T.; Scherer, A.; Quake, S.R. Monolithic microfabricated valves and pumps by multilayer soft lithography. Science 2000, 288, 113–116. [Google Scholar] [CrossRef] [Green Version]
  6. Liu, W.; Li, L.; Wang, X.; Ren, L.; Wang, X.; Wang, J.; Wang, J. An integrated microfluidic system for studying cell-microenvironmental interactions versatilely and dynamically. Lab Chip 2010, 10, 1717–1724. [Google Scholar] [CrossRef]
  7. Gao, Y.; Majumdar, D.; Jovanovic, B.; Shaifer, C.; Lin, P.C.; Zijlstra, A.; Li, D. A versatile valve-enabled microfluidic cell co-culture platform and demonstration of its applications to neurobiology and cancer biology. Biomed. Microdevices 2011, 13, 539–548. [Google Scholar] [CrossRef] [Green Version]
  8. Wang, H.-Y.; Bao, N.; Lu, C. A microfluidic cell array with individually addressable culture chambers. Biosens. Bioelectron. 2008, 24, 613–617. [Google Scholar] [CrossRef]
  9. Wang, Z.; Kim, M.-C.; Marquez, M.; Thorsen, T. High-density microfluidic arrays for cell cytotoxicity analysis. Lab Chip 2007, 7, 740–745. [Google Scholar] [CrossRef]
  10. Yap, Y.C.; Dickson, T.C.; King, A.E.; Breadmore, M.C.; Guijt, R.M. Microfluidic culture platform for studying neuronal response to mild to very mild axonal stretch injury. Biomicrofluidics 2014, 8, 044110. [Google Scholar] [CrossRef] [Green Version]
  11. Jain, R.K.; Martin, J.D.; Stylianopoulos, T. The role of mechanical forces in tumor growth and therapy. Annu. Rev. Biomed. Eng. 2014, 16, 321–346. [Google Scholar] [CrossRef] [PubMed] [Green Version]
  12. Friedland, J.C.; Lee, M.H.; Boettiger, D. Mechanically activated integrin switch controls α5β1 function. Science 2009, 323, 642–644. [Google Scholar] [CrossRef] [PubMed]
  13. Kalluri, R.; Weinberg, R.A. The basics of epithelial-mesenchymal transition. J. Clin. Investig. 2009, 119, 1420–1428. [Google Scholar] [CrossRef] [PubMed] [Green Version]
  14. Facciabene, A.; Peng, X.; Hagemann, I.S.; Balint, K.; Barchetti, A.; Wang, L.P.; Coukos, G. Tumour hypoxia promotes tolerance and angiogenesis via CCL28 and Treg cells. Nature 2011, 475, 226–230. [Google Scholar] [CrossRef]
  15. Blann, A.D. How a damaged blood vessel wall contibutes to thrombosis and hypertenasion. Pathophysiol. Haemost. Thromb. 2003, 33, 445–448. [Google Scholar] [CrossRef]
  16. Taddei, S.; Virdis, A.; Ghiadoni, L.; Salvetti, G.; Salvetti, A. Endothelial dysfunction in hypertension. J. Nephrol. 1999, 13, 205–210. [Google Scholar]
  17. Kim, Y.C.; Kang, J.H.; Park, S.-J.; Yoon, E.-S.; Park, J.-K. Microfluidic biomechanical device for compressive cell stimulation and lysis. Sens. Actuators B Chem. 2007, 128, 108–116. [Google Scholar] [CrossRef]
  18. Armstrong, J.; Whiteman, M. Measurement of reactive oxygen species in cells and mitochondria. Mitochondria 2007, 80, 355. [Google Scholar]
  19. Finkel, T.; Holbrook, N.J. Oxidants, oxidative stress and the biology of ageing. Nature 2000, 408, 239–247. [Google Scholar] [CrossRef]
  20. Incalza, M.A.; D’oria, R.; Natalicchio, A.; Perrini, S.; Laviola, L.; Giorgino, F. Oxidative stress and reactive oxygen species in endothelial dysfunction associated with cardiovascular and metabolic diseases. Vasc. Pharmacol. 2018, 100, 1–19. [Google Scholar] [CrossRef]
  21. Chien, S. Mechanotransduction and endothelial cell homeostasis: The wisdom of the cell. Am. J. Physiology-Heart Circ. Physiol. 2007, 292, H1209–H1224. [Google Scholar] [CrossRef] [PubMed] [Green Version]
  22. Abaci, H.E.; Drazer, G.; Gerecht, S. Recapitulating the Vascular Microenvironment in Microfluidic Platforms. Nano Life 2013, 3, 1340001. [Google Scholar] [CrossRef]
  23. Rouleau, L.; Copland, I.B.; Tardif, J.-C.; Mongrain, R.; Leask, R.L. Neutrophil adhesion on endothelial cells in a novel asymmetric stenosis model: Effect of wall shear stress gradients. Ann. Biomed. Eng. 2010, 38, 2791–2804. [Google Scholar] [CrossRef] [PubMed] [Green Version]
  24. Cai, H.; Harrison, D.G. Endothelial dysfunction in cardiovascular diseases: The role of oxidant stress. Circ. Res. 2000, 87, 840–844. [Google Scholar] [CrossRef] [Green Version]
  25. Davies, P.F.; Tripathi, S.C. Mechanical stress mechanisms and the cell. An endothelial paradigm. Circ. Res. 1993, 72, 239–245. [Google Scholar] [CrossRef] [Green Version]
  26. Wang, B.; Caluch, A.; Fodil, R.; Fereol, S.; Zadigue, P.; Pelle, G.; Isabey, D. Force control of endothelium permeability in mechanically stressed pulmonary micro-vascular endothelial cells. Bio-Med. Mater. Eng. 2012, 22, 163–170. [Google Scholar] [CrossRef]
  27. Yuan, F.; Leunig, M.; Berk, D.A.; Jain, R.K. Microvascular permeability of albumin, vascular surface area, and vascular volume measured in human adenocarcinoma LS174T using dorsal chamber in SCID mice. Microvasc. Res. 1993, 45, 269–289. [Google Scholar] [CrossRef]
  28. Lee, H.; Kim, S.; Chung, M.; Kim, J.H.; Jeon, N.L. A bioengineered array of 3D microvessels for vascular permeability assay. Microvasc. Res. 2014, 91, 90–98. [Google Scholar] [CrossRef]
  29. Johnston, I.; McCluskey, D.; Tan, C.; Tracey, M. Mechanical characterization of bulk Sylgard 184 for microfluidics and microengineering. J. Micromechanics Microengineering 2014, 24, 035017. [Google Scholar] [CrossRef]
  30. Choi, A.; Zheng, Y. Estimation of Young’s modulus and Poisson’s ratio of soft tissue from indentation using two different-sized indentors: Finite element analysis of the finite deformation effect. Med. Biol. Eng. Comput. 2005, 43, 258–264. [Google Scholar] [CrossRef]
  31. Levental, I.; Georges, P.C.; Janmey, P.A. Soft biological materials and their impact on cell function. Soft Matter 2007, 3, 299–306. [Google Scholar] [CrossRef]
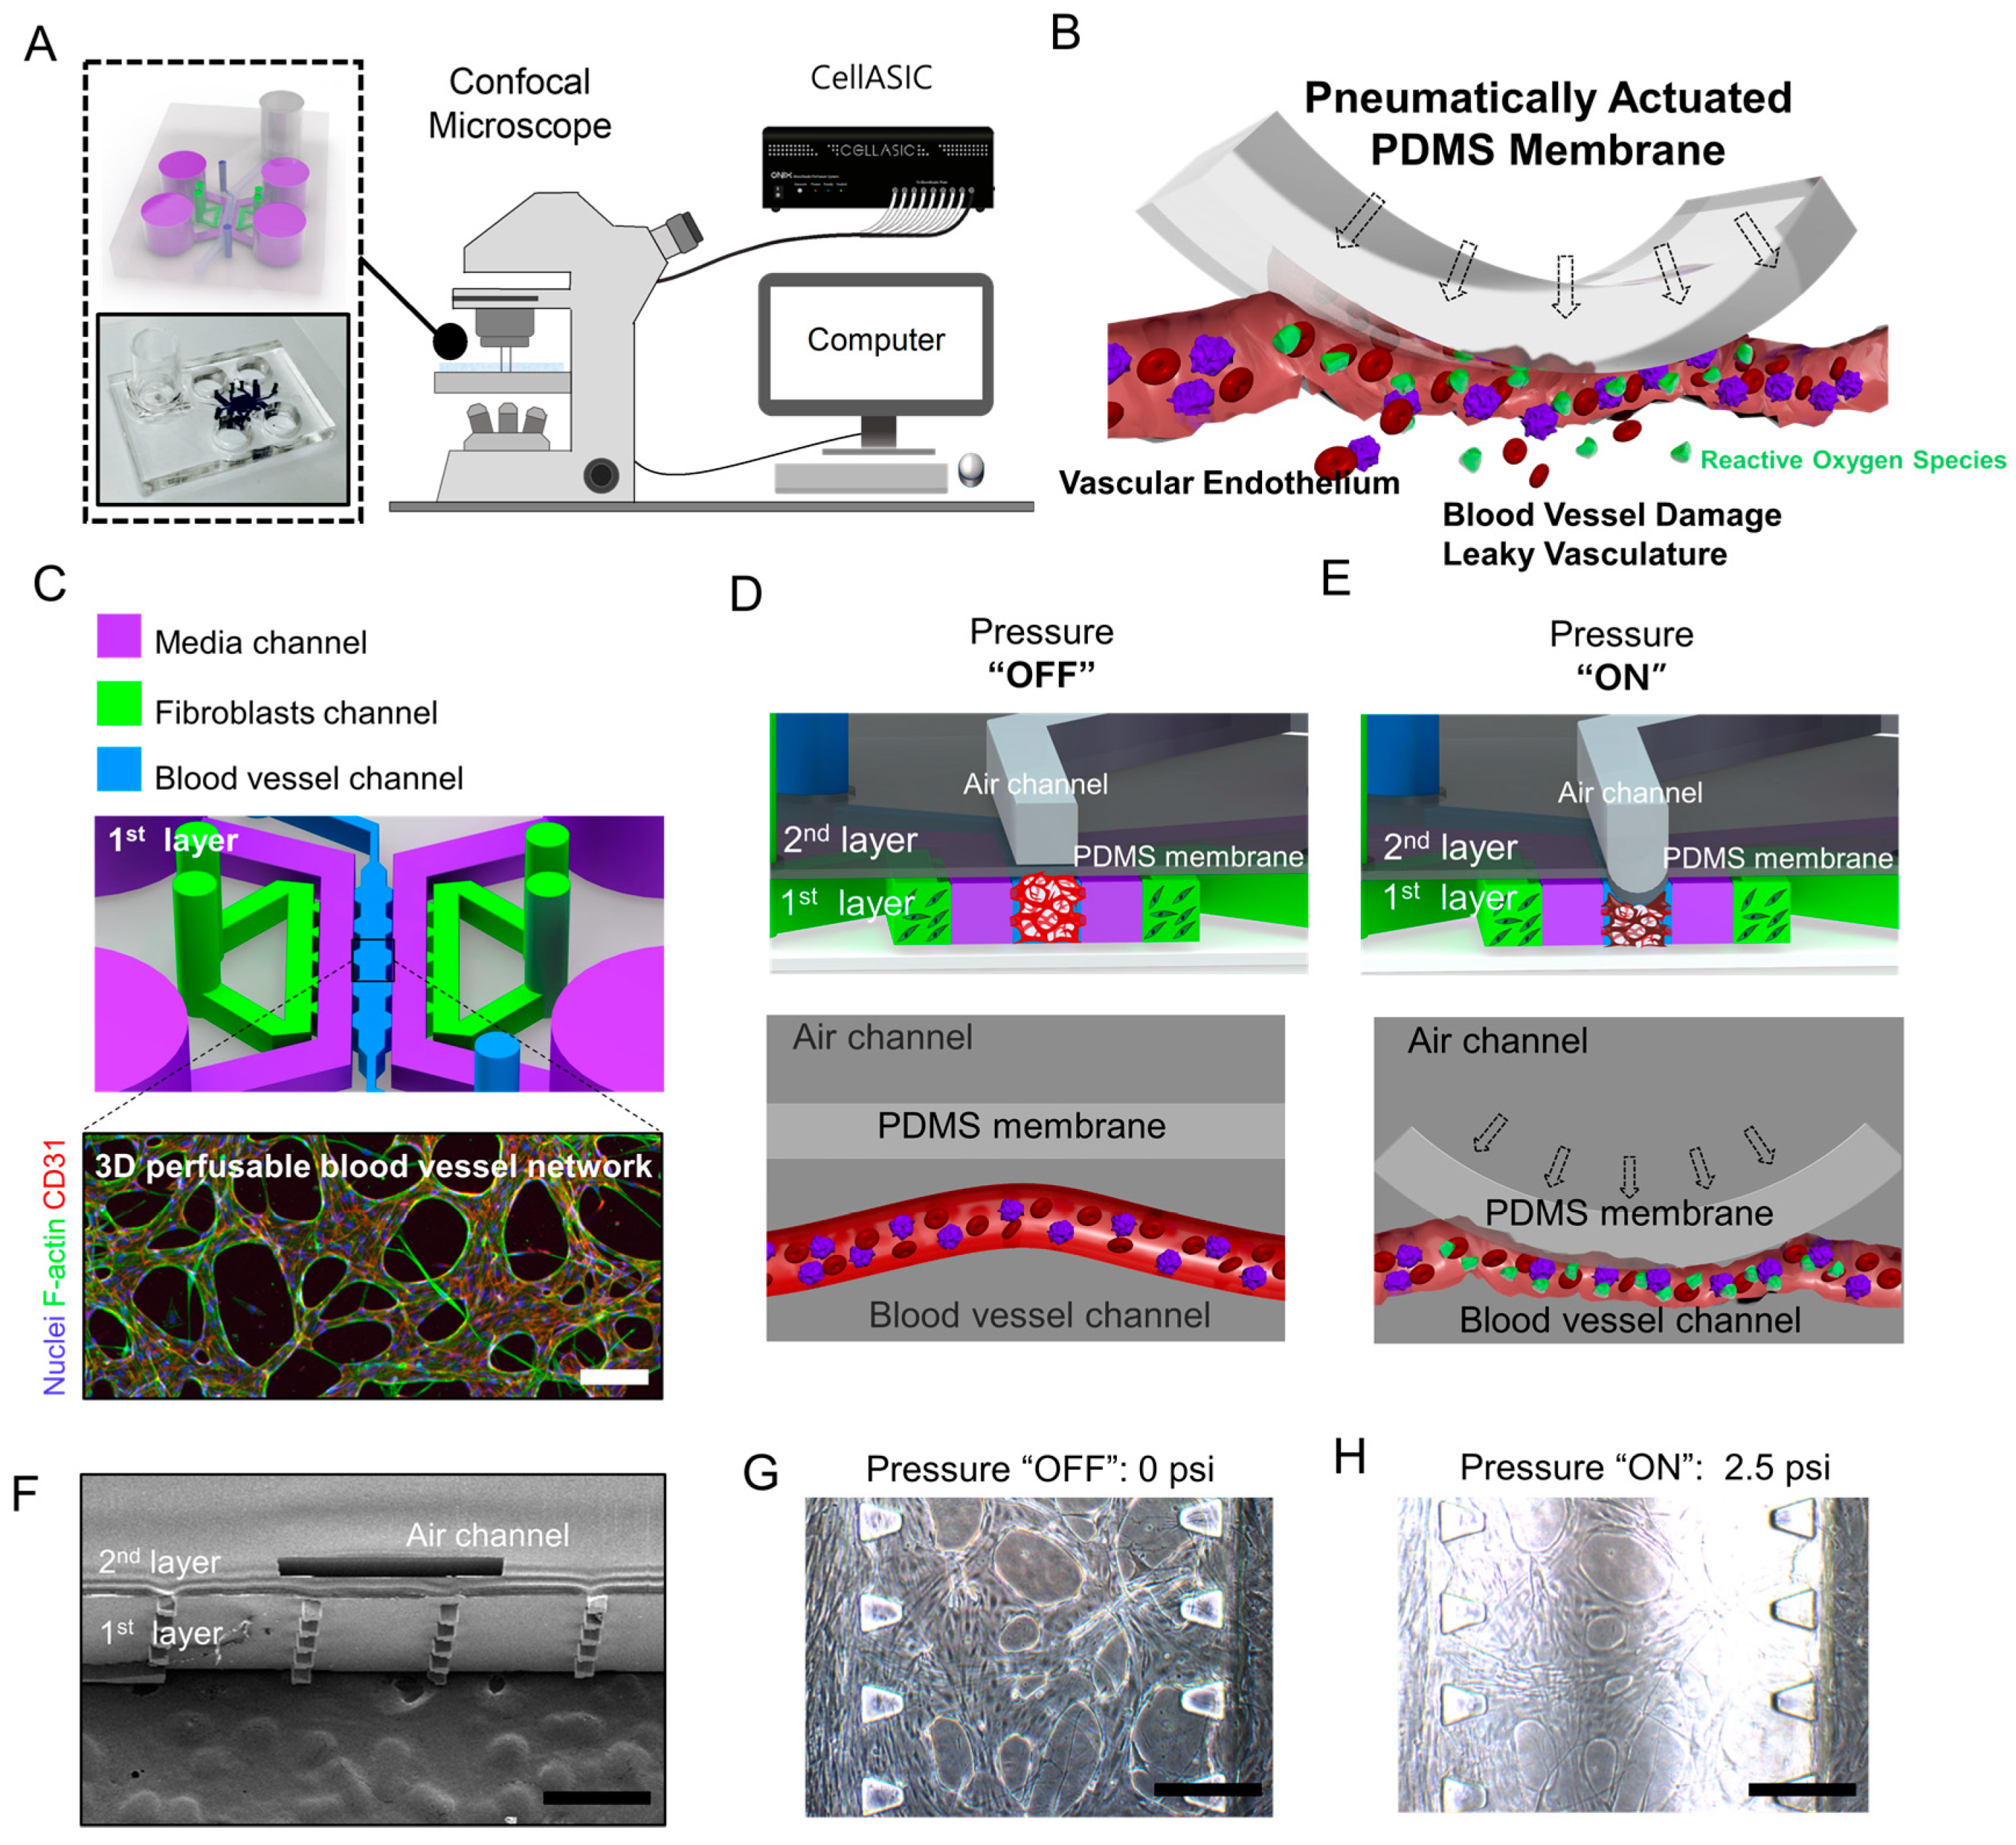
Figure 1. Multilayer microfluidic device for mimicking solid-stress-induced blood vessel compression and collapse in vitro. (A) Schematic diagram of the experimental setup. (B) Schematic illustration of the pneumatically actuated microfluidic platform for studying blood vessel compression. (C) Magnified rendered image in the cell culture layer and 3D vascularized microvessels characterized by immunofluorescence and vasculogenesis on day 5. Scale bar: 100 μm. (D) Configuration of the microfluidic device with the air channel in the “OFF” state, representing that there was no applied pressure. (E) Configuration of the microfluidic device with the air channel in the “ON” state, where air pressure was applied to the channel. Polydimethylsiloxane (PDMS) membrane deflection could induce in vitro blood vessel compression in a controlled manner. (F) Cross-sectional SEM image of the device. (G,H) Bright-field microscopy images of in vitro blood vessels in the device at 0 psi and 2.5 psi, respectively.
Applsci 10 02027 g001
Figure 2. The pixel intensity of the transverse direction in the central channel and PDMS membrane finite element analysis. (A) The change of gray value by the membrane deflection at six different pressures. The central channel was filled with FITC-dextran solution. Scale bar: 100 μm. (B) Gray value plot of the central channel.
Applsci 10 02027 g002
Figure 3. Finite element analysis of the stress distribution of a blood vessel. (A) Finite element analysis of a PDMS membrane deforming at 0.0 psi and 2.5 psi, respectively. (B) Simulated PDMS membrane deflection plot. (C) Finite element analysis of the blood vessel stress distribution according to six different pressures. (D) Von Mises stress distribution of a blood vessel.
Applsci 10 02027 g003
Figure 4. Applying compressive stress to the perfusable microvessels. (A) Microbeads (7 μm) were introduced into the microvascular network when the microvascular network was exposed to 1.5 psi. Scale bar: 100 μm (B) Bright-field images of the microvascular network in response to air pressures of 0 psi, 2.5 psi, and after releasing the applied pressure. Scale bar: 100 μm.
Applsci 10 02027 g004
Figure 5. Microvascular network viability according to six different pressures. Cell viability was examined after a 1-min duration each at six different pressures and representative fluorescence images from each sample are shown. Scale bar: 80 μm.
Applsci 10 02027 g005
Figure 6. The reactive oxygen species (ROS) level in a microvascular network. (A) ROS levels assayed using H2DCFDA fluorescence dye (green). Scale bar: 80 μm. (B) Quantitative analysis of the fluorescence intensity. Bars represent the mean ± SEM from 4–5 devices per condition. *** p < 0.001 in an unpaired two-tailed Student’s t-test.
Applsci 10 02027 g006
Figure 7. Vascular permeability and VE-cadherin expression differences from different pressures. (A) FITC-dextran (20 kDa) was introduced into the microvascular network. Scale bars: 100 μm. (B) Permeability coefficient for two different conditions. Bars represent mean ± SEM from 4–5 devices per condition. *** p < 0.001 in an unpaired two-tailed Student’s t-test. (C) Confocal microscopy images of a 3D microvessel network immunostained with anti-VE-cadherin. Scale bar: 50 μm. (D) Quantitative analysis of the relative VE-cadherin immunofluorescence intensity under pressures varying from 0 psi to 2.5 psi. Bars represent the mean ± SEM from 4–5 devices per condition. * p < 0.05, *** p < 0.001 in an unpaired two-tailed Student’s t-test.
Applsci 10 02027 g007
Table 1. Young’s modulus and Poisson’s ratio of the PDMS and the blood vessel.
Young’s Modulus (E)Poisson’s Ratio (v)
PDMS2.05 MPa [29]0.49 [29]
Blood vessel90 kPa [31]0.45 [30]