Article

Evaluation of Smart Alarm Systems for Industry 4.0 Technologies

Department of Recreational & Graduate Institute of Recreational Sport Management, National Taiwan University of Sport, Taoyuan City 33301, Taiwan
Appl. Sci. 2020, 10(6), 2022; https://doi.org/10.3390/app10062022
Submission received: 14 February 2020 / Revised: 10 March 2020 / Accepted: 11 March 2020 / Published: 16 March 2020

Abstract

:
Traditionally, the footwear industry is labor intensive, and cost control is key to ensuring shoe companies can be competitive. The development of Industry 4.0 concepts, used in high-tech industries and blockchain production information systems, enables the creation of smart factories with online alarm management systems, to improve manufacturing efficiency and reduce human resource requirements. In this paper, the performances of the causal association assessment model and the technique for order preference by similarity to the ideal solution (TOPSIS) model in evaluating large data blockchain technologies and quality online real-time early warning systems for production and raw material supplier management are compared, to increase the intelligence of production and to manage product traceability.

1. Introduction

With improvements in global living standards, the traditional shoe industry has gradually changed; co-creation design practices have been adopted, allowing the client to dictate the product, while functional sports shoes, casual shoes, and other types of footwear have become essential items with a large consumer base. In this industry, upstream raw materials include textiles, rubber, and plastics, which account for about 60% of the overall cost of the shoe. Different parts of the shoe are produced with different raw materials. For example, the soles of sports shoes are composed of foam rubber, the base consists of an economic value added (EVA) foam model, and the upper portions are composed of leather or mesh. Hence, the shoe production process uses several diverse products, and labor is intensive but low-cost. As a result, it is difficult to employ high-tech manufacturing processes in this industry while reducing raw material costs, improving product quality, and reducing human resource requirements.
In addition, in the footwear industry, a need already exists for more small- and medium-sized factories. However, it is possible that, in the future, only large factories will be able to continue to survive, as based on the appreciation of exchange rates, labor and raw material costs will continue to rise. This makes it difficult for smaller factories to innovate and upgrade, causing them to be uncompetitive. For Industry 4.0 production technologies to be successful in the shoe industry, the human-based corporate culture will also require modification. For instance, if a company does not train talent or allocate resources effectively, the import cost of its product will become too high, complicating the company’s transformation and operation. In the case discussed in this study, intelligent online manufacturing and alarm systems from high-tech industry were combined with blockchain production technology, to reduce the demand for human resources and improve the quality of several mass-produced varieties of shoes.
Intelligent alarm management systems (IAMSs) suppress nuisance alarms and provide valuable advisory information to help operators focus quickly on important information and undertake corrective actions [1]. An IAMS provides an expert decision-making system for rapid management of large amounts of data and transformation of data into information, thus reducing human resource requirements and preventing misjudgment and negligence. These systems have been applied to distributed control systems, validated in online tests, and accepted by plant operators. To ensure that a manufacturing process is not interrupted, a real-time IAMS is necessary [2,3]. In addition, since companies require an IAMS that is tailor-made for their operations, they must cooperate with vendors in exchanging information and technology to ensure that the software that is eventually purchased aligns with their business requirements [4,5]. The most effective collaborative technology must select for software contractors [6,7], and the most appropriate and effective approach for evaluating results. Essentially, an IAMS must promote cooperation between enterprises in developing software [8,9,10]. In this study, the performances of the cause-effect grey relational analysis (CEGRA) [11] and the technique for order preference by similarity to the ideal solution (TOPSIS) [12] models in evaluating the collaborative technology created by IAMS software contractors are compared, to reduce system faults that prevent these products from meeting end users’ requirements.

2. Background

This section considers the background to the practical work conducted in this study in two parts. In the first, evaluation methodologies for intelligent systems are reviewed, while the second part introduces the CEGRA and TOPSIS algorithms used for decision making in this study.

2.1. Review of Evaluation Methodologies for Intelligent Systems

Determining how to increase the product yield and reduce the costs of small- and medium-sized enterprises is a major challenge. In the semiconductor industry, manufacturers have gradually integrated with smaller firms to increase production and reduce costs [13]. Since current manufacturing systems employ 24-hour production cycles, capacities can decrease, producing fewer profits, if the system or a machine malfunctions [14,15]. To help factory operators to quickly undertake measures to prevent accidents, prediction of the risk index is significant. Hence, a number of techniques have been developed for quantifiable risk evaluation and decision making. By combining the concepts of fuzzy set theory, entropy, and ideal and grey relational analysis, Liao et al. developed a fuzzy grey relational method for multiple criteria decision-making problems [16]. Tzeng and Huang [17] proposed a grey relational analysis approach for selecting and reconfiguring aspired-for global manufacturing and logistics systems. In optimization of electrical discharge machining processes, Pradhan [18] used grey relational analysis to estimate the effect of machining parameters on a tool’s response, and determined the weights of responses using principal component analysis (PCA), further evaluating the weights of the responses using a response surface methodology. Mondal et al. [19] combined Taguchi and grey relational analysis to evaluate optimal parameters for laser cladding of a steel surface. Sun [20] combined grey relational analysis and information entropy, finding that, in evaluation of the performance of notebook companies, the results obtained with their technique were more objective than those obtained with other decision-making methods. Fayaz et al. [21] proposed a hierarchical fuzzy logic model to assess significant risks of accidents in underground facilities. With their technique, the risk index is predicted using a Kalman filter after a risk is assessed.
Each decision-making method has its advantages and disadvantages, as well as timing and use restrictions. For example, the analytic hierarchy process (AHP) [22] is applied to decision making in uncertain situations where the majority of the evaluation criteria is known. However, the AHP has the following shortcomings: (1) the evaluation scale is a subjective one to nine judgment; (2) the number of elements in the hierarchy should not exceed seven, as it will affect the consistency of the level; and (3) the consistency of the results of analysis is affected by deviation from the selection criteria and evaluation by too large a number of experts. Shih et al. [23] reported that in considering the benefit or the cost criterion, the TOPSIS method can only reflect the relative proximity of the evaluation criteria within each assessment scheme, and does not reflect the relative proximity to the ideal optimal scheme. Shannon [24] suggested that if data can be obtained directly from the decision-making environment, the entropy algorithm can be used to calculate the objective weight of the criterion. More chaotic measurements increase the weight of this criterion, reflecting larger differences between the importance of different criteria. For such measurements, the entropy method is more effective in managing uncertainty, and the reduction of subjective factors is greater. With CEGRA, both qualitative and quantitative relationships can be identified from complex factors with insufficient information. The main feature of CEGRA is that it can be applied when information is limited, and can support an objective decision based on different data. This method combines the advantages of AHP’s expert evaluation, entropy, and TOPSIS, and can be used to effectively manage decision uncertainty, multi-criteria input, and discrete data.

2.2. The CEGRA Method

The CEGRA method can use decision-making and information evaluation to incompletely explore the degree of association between two series, quantify the distance between observed and target values using discrete measures, conduct correlation analyses, establish models, and enable decision making between various schemes. CEGRA can effectively manage uncertainty, multivariate input, and discrete data in decision problems [25,26,27].
In this study, novel algorithms were designed to assess the decision making of an IAMS for the online manufacturing of sports shoes. The implementation of the algorithms used in this study are based on the CEGRA and grey situation decision-making system proposed by Deng [
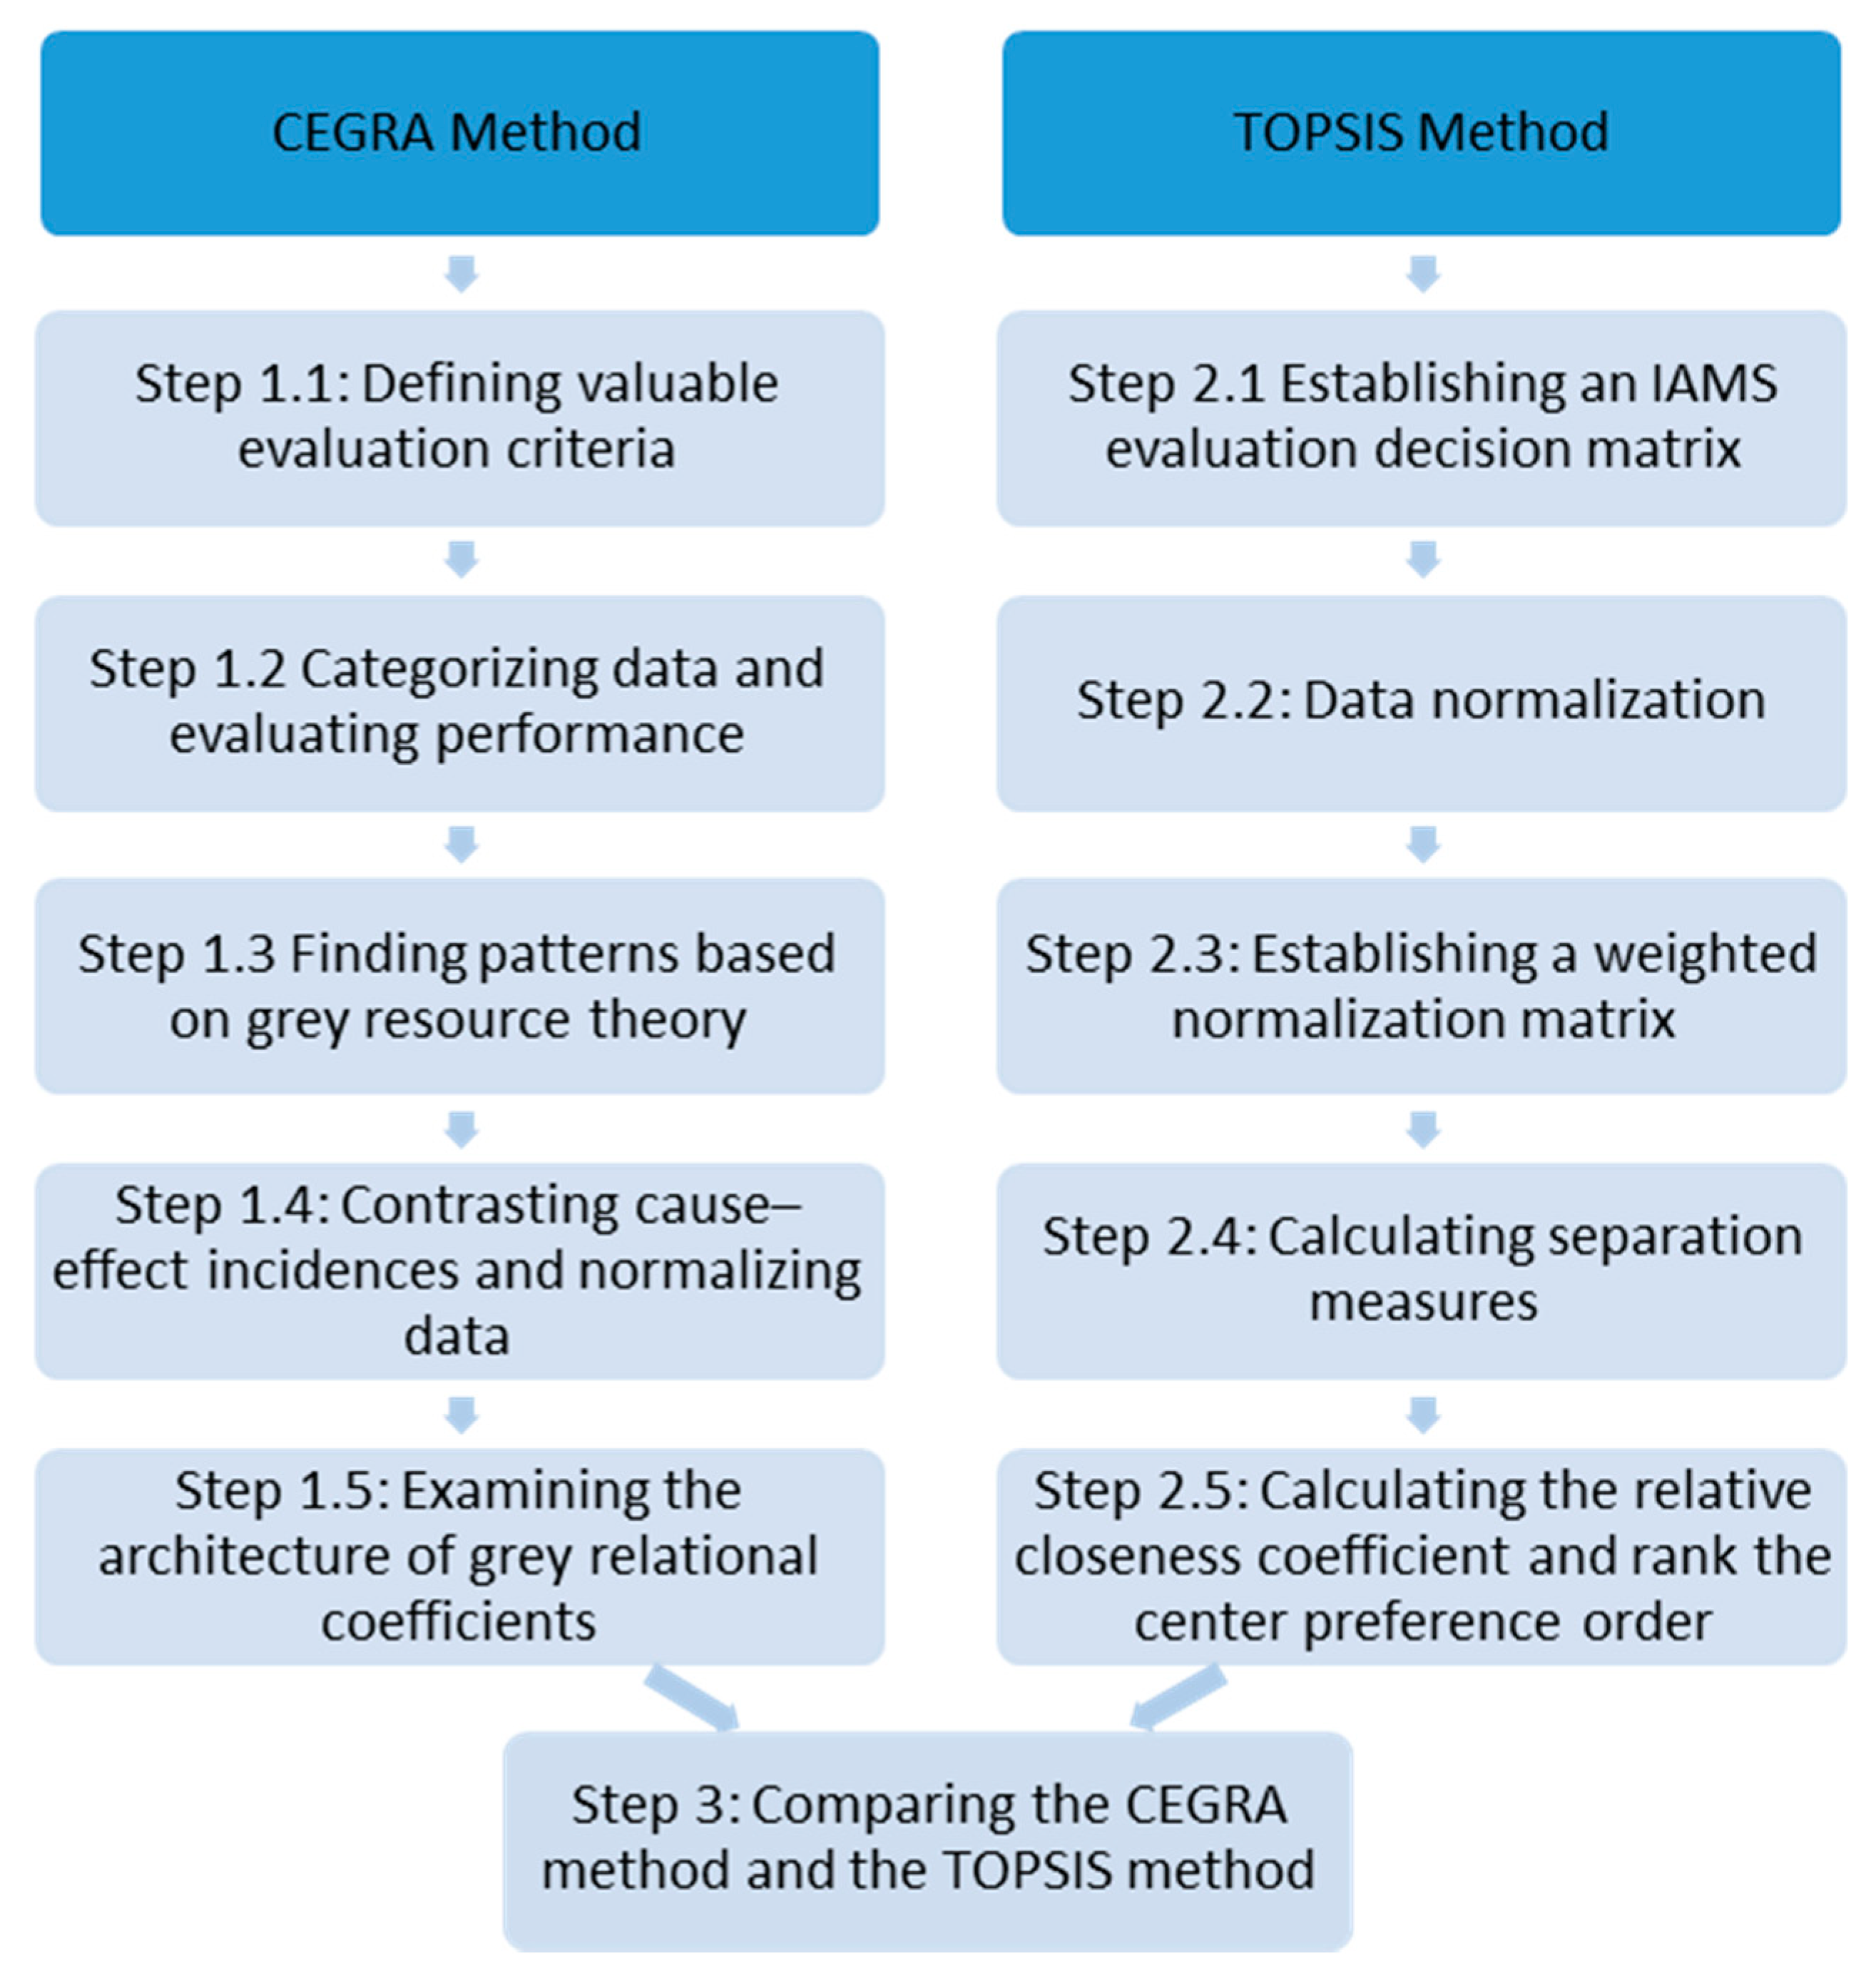
11]. The steps in the algorithms are described as follows:
Step 1.1: Defining evaluations valuable for assessing online sports shoe online manufacturing IAMSs.
Let (EPF, X) be the exploiting resource space when EPF is equipped with mapping functions as follows:
EPF: Resources → efficacies (v)
In the above, a general consensus among experts has been reached to establish a model, facilitating the ultimate goal of evaluating the performance of collaboration between technology companies according to CEGRA concepts.
Step 1.2: Categorizing data and evaluating performance.
Data from the IAMSs can be categorized as data resources or resources possessing information, θ(d), as shown below:
θ ( d ) = { v ( ) , v a l u e ; s ( ) , s i g n ; p ( ) , p o l a r i t y ; b ( ) , b a c k g r o u n d ; c ( ) , c o n n o t a t i o n }
Otherwise, only digits exist, without a resource.
If d e c o ( ) is the entirety of complete decision-making information for event o, the following data category is obtained:
Decision-making data :   θ ( d ) d e c o ( )
Step 1.3: Finding patterns based on grey resource theory.
In grey resource theory, the situation, Sij = (ai, bj), is defined as a pattern, where ai is a decision maker and bj is a resource. Hence, the effectiveness of ai and bj can expressed using Sij.
GM is defined as a mapping function, G M ( S i j ) = R i j , where R i j is the value of the mapping function, such that,
Sij = (ai, bj), Sij = SGM (grey modeling pattern)
Hence, if the mapping of an event, E i j , is defined as G M ( E i j ) = R i j , the synthetic measured effectiveness value for this event is defined as:
R i Σ = 1 n j = 1 n R i j
Step 1.4: Contrasting cause–effect incidences and normalizing data.
In the cause–effect space ( P c a u , P e f f ) , a cause–effect relationship can only be obtained between individuals with cause–effect incidences that are essential contrasts; no contrasts are required for irrelevant individuals. In this study, cause–effect incidence contrasting was defined as follows.
First, let α and β be the contrasted individuals, α , β P . μ = Δ = α β then represents a comparison gene, and for series comparison, Δ = Δ 0 i ( k ) = | χ 0 ( k ) χ i ( k ) | , where Δ 0 denotes melt and Δ indicates irrelevance.
The contrasted result, v is given as follows:
v = ς + π μ + π ,   ς 0
If ( α ς , β ) is considered a cause–effect related contrast, then α > > β or β < < α μ if α and β are irrelevant, such that v 0 . Alternatively, if α and β are incident in terms of cause and effect, then α β μ 0 v 1 .
Before calculation of the grey relational coefficients, the data series can be analyzed based on the linearity of normalized data (required to prevent data from being distorted) [28,29], and the following three metrics:
(1)
The upper-bound effectiveness, measured as
x i * ( k ) = x i ( k ) min k   x i ( k ) max k   x i ( k ) min k   x i ( k )
(2)
The lower-bound effectiveness, measured as
x i * ( k ) = max k   x i ( k ) x i ( k ) max k   x i ( k ) min k   x i ( k )
(3)
Moderate effectiveness, defined as
  • If min k   x i ( k ) x o b ( k ) max k   x i ( k ) , then:
    x i * ( k ) = | x i ( k ) x o b ( k ) | max k   x i ( k ) min k   x i ( k )
  • If max k   x i ( k ) x o b ( k ) , then:
    x i * ( k ) = x i ( k ) min k   x i ( k ) x o b ( k ) min k   x i ( k )
  • If x o b ( k ) min k   x i ( k ) , then:
    x i * ( k ) = max k   x i ( k ) x i ( k ) max k   x i ( k ) x o b ( k )
    where x o b ( k ) is the objective value of entity k.
Step 1.5: Examining the architecture of grey relational coefficients.
In a cause–effect resource incidence space ( P c a u , P e f f ) , the architecture of the grey relational coefficients must enable maximum exploitation of ecological benefits according to cause–effect incidence contrasting and the adjustable coefficient, ρ , ρ ( 0 , 1 ) . This coefficient must be based on cause and effect criteria with complete incidence. The architecture of grey relational coefficients is expressed as follows:
γ 0 i ( k ) = γ ( x 0 ( k ) , x i ( k ) ) = Δ min + ρ Δ max Δ 0 i ( k ) + ρ Δ max
The grey relational grade (GRG) for a series Xi is given as follows:
Γ 0 i = k = 1 J w k γ 0 i ( k )
where wk is the weight of the jth entity. If no weights need to be applied, then an average is taken, i.e., ω k = 1 J .

2.3. The TOPSIS Method

The TOPSIS method for multiple attribute group decision making was developed by Hwang and Yoon [12]. It has subsequently been used to evaluate the purchase of business intelligence systems, product quality improvements, flow control in a manufacturing system, and intelligent home energy management in smart grids [30,31,32,33].
In this paper, a combination of the TOPSIS method as introduced by Hwang and Yoon [12], and the implementation described by Dutta et al. [34] is applied for evaluation. The calculation steps are summarized as follows:
Step 2.1: Establishing an IAMS evaluation decision matrix.
The IAMS decision matrix, S, is defined as below,
                   ( b 1        b 2           b j           b n ) S = a 1 a 2 a i a m [ x 11 x 12 x 1 j x 1 n x 21 x 22 x 2 j x 2 n x i 1 x i 2 x i j x i n x m 1 x m 2 x m j x m n ]
where ai denotes the evaluated online manufacturing IAMSs, bj represents the criterion evaluated in the online manufacturing IAMSs, i = 1, 2, ..., m, j = 1, 2, ..., n, and xij indicates the performance rating of an evaluated online manufacturing IAMS ai with respect to criterion bj.
Step 2.2: Data Normalization.
Data is transformed to a normalized scale as follows:
for   benefit   criteria r i j = x i j i = 1 m x i j 2
for   cost   criteria   r i j = 1 / x i j i = 1 m 1 / x i j 2 for   i = 1 ,   2 ,   ,   m ; j = 1 ,   2 ,   ,   n
Step 2.3: Establishing a weighted normalization matrix
In the TOPSIS framework, the weighted normalized performance matrix is defined as
V = [ v 11 v 12 v 1 j v 1 n v 21 v 22 v 2 j v 2 n v i 1 v i 2 v i j v i n v m 1 v m 2 v m j v m n ] v i j = w j × x i j ,   for   i = 1 ,   2 ,   . . . ,   m ;   j = 1 ,   2 ,   . . . ,   n ,
where wj denotes the weight of criterion j.
Step 2.4: Calculating the separation measures
To calculate the separation measures, which, in this study, characterize an IAMS’s proximity to optimal performance, the ideal solution is first calculated as follows
d + = ( v 1 + ,   v 2 + ,   ,   v n + ) ,   where   v j + = max i   v i j
d = ( v 1 ,   v 2 ,   ,   v n ) ,   where   v j = min i   v i j
The distance between the ideal solution and the negative ideal solution for each alternative is then calculated as
d i + = j = 1 n ( v i j v j + ) 2      i = 1 , 2 ,   ,   m ,
d i = j = 1 n ( v i j v j ) 2      i = 1 , 2 ,   ,   m ,
Step 2.5: Calculating the relative closeness coefficient and rank the center preference order
The relative closeness to the ideal solution of each online manufacturing IAMSs can be calculated as:
a i * = d i d i + + d i ,   for   i = 1 , 2 ,   ,   m

3. Case Study

The Datong Shoes and Materials Company was founded in 1992 with USD $1,000,000 of capital. After the 2008 global financial crisis, their revenue declined annually and their gross profit margin turned negative; the more orders received, the larger the losses they made. Thus, the company decided to reduce its operating costs, investing in new technologies. In 2013, after introducing IAMS and blockchain production information systems, the business began to grow steadily, with turnover averaging around USD $3,500,000. With the introduction of automation, manpower was no longer the most urgent requirement. Hence, the number of factory production line workers decreased from about 1200 in 2013, to 280 by the end of 2018, which is an annual reduction of 25% in human resources. The gross profit margin grew rapidly from 8.61% to 36.28% in 2018 as shown in Table 1.
The company has a corporate culture that supports innovation, believing that exclusive companies import automated intelligent factory technologies, and that a wealth of manufacturing experience is an important asset for the sustainable development of a firm. In terms of demographics, 70% of the engineers at the Datong Shoe Material Company are over 50 years old. Therefore, in the company’s position, developing an artificial intelligence system as soon as possible is essential for transferring inherited knowledge from generation to generation, to preserve the knowledge of the older employees. At the same time, future generations should inherit the company’s goals of innovative development and sustainable management. Investment in new technologies should include initial input machine data exchanges, the online cloud, automated operations, big data analysis, and other related technologies [35]. This requires the investment of a large amount of capital and talent training and transformation to integrate the existing manufacturing technology, quality, and sales and product experience to establish an adaptable and resource-efficient intelligent plant. In terms of business and value processes, customer and business partner services must be integrated to provide excellent after-sales service. The company plans to have 100 staff and 100 employees for operation in 2019, to minimize its human resource requirements. From the viewpoint of turnover, as shown in Table 1, the goal is to maintain the same level of substantial growth of about 30%, which before was included as part of the gross margin, not the revenue.
Four collaborative technology software companies in Taiwan that specialize in code development were assessed in this study. Company A is Data Systems Consulting Co., Ltd. (Taichung, Taiwan), which specializes in ERP and customized software. Company B is IBM Co., Ltd., which specializes in information management systems and customized software. Company C is Elements Innovation Co., Ltd., which specializes in ISO databases, CRM, and customized software. Company D is Tien Kang Co., Ltd., which specializes in CPA and BI decision support systems. The CEGRA and TOPSIS algorithms for assessing online sports shoe manufacturing IAMSs are summarized in Figure 1.

3.1. Decision Making Using the CEGRA Method

Step 1.1: Defining Valuable Evaluation Criteria
Since a general consensus was reached among experts about the method followed to establish a model, the ultimate goal of evaluating the performance of collaborative technology companies according to CEGRA concepts can be achieved. In this study, 17 evaluation criteria were determined, as summarized in Table 2 [36,37,38]. Here, larger coefficients for the market share (MS), improving performance and enhancing morale (IPE), performance reward system (PRS), technology and engineering (TE), economies of scope (ES), surge capacity (SC), information sharing (IS), IT capability (ITC), and experience in similar products (ESP) criteria, represent better performance. For all other criteria, smaller coefficients are better.
Step 1.2: Categorizing Data and Evaluating Performance
Ten experienced members of research and development teams in the sports shoe manufacturing industry were selected as experts to evaluate the modules used in this study with respect to the criteria identified above. In this evaluation, the grey modeling pattern was used as the decision maker, on the basis of Equations (1) and (2). Table 3 lists the average results of evaluation of each different system in relation to each different criterion.
Step 1.3: Finding Patterns Based on Grey Resource Theory
The criteria for contrasting individuals representing a comparison gene were set as defined by Equations (3) and (4). In the resource cause–effect incidence space, the architecture of the grey relational coefficients was consistent with contrasting cause–effect incidences and the symbols for “top scale,” “button scale,” and “adjustable coefficient,” and was based on the complete incidence of cause–effect criteria.
Step 1.4: Contrasting Cause–Effect Incidences and Normalizing Data
Based on previous definitions, the reference series in this study is X0 = (2.98, 2.71, 3.35, 2.65, 2.69, 2.64, 3.39, 3.06, 2.04, 2.25, 1.91, 2.17, 2.16, 2.31, 2.91, 2.04, and 1.96). Data were normalized to this series using Equations (6) and (7), and the relational coefficients were then computed, as summarized in Table 4.
Step 1.5: Examining the Architecture of Grey Relational Coefficients
The γ 0 i ( k ) series was computed using Equation (11), following a comparison between X0 and the relational coefficients. GRG weights were subsequently calculated using Equation (12), with the results summarized in the right-hand column of Table 4. The performance values of companies A, B, C, and D were 0.79, 0.70, 0.66, and 0.66, respectively. Hence, Company A has the best performance, based on CEGRA evaluation. As it sells products at the most reasonable price and is a reputable software vendor, it can help operators in the sports shoe industry understand warning messages more clearly.

3.2. Decision Making Using the TOPSIS Method

Step 2.1: Establishing an IAMS evaluation decision matrix
The decision matrix for evaluating the IAMSs was established as described by Equation (13), using the data in Table 3.
Step 2.2: Data Normalization
As with the CEGRA, large coefficients for MS, IPE, PR, TE, ES, SC, IS, ITC, QM, and ESP, represent good performance, while smaller coefficients represent good performance for DP, FBP, RD, HIP, PM, MR and LN. The former 10 metrics were categorized as benefit criteria in the TOPSIS framework, while the latter 7 were categorized as cost criteria. Hence, data were normalized using Equation (14) or (15), as appropriate, with results as shown in Table 5.
Step 2.3: Establishing a weighted normalization matrix
The weighted normalized decision matrix depicted in Table 6 was calculated as described by Equation (16). In this research, it was assumed that all evaluation criteria had the same weight.
Step 2.4: Calculating the separation measures
The separation of the benefit criteria and cost criteria of the four companies from the ideal solution were calculated using Equations (17) and (18). Results are as shown in Table 7 and Table 8.
Step 2.5: Calculating the relative closeness coefficient and rank the center preference order
Using the separation measures summarized above, the relative closeness coefficient, a i * , for the four companies, was calculated based on Equation (21), as shown in the TOPSIS performance values column of Table 9. Each company was subsequently ranked in order of preference based on this metric.
Step 3: Comparing the CEGRA Method and the TOPSIS Method
The results of evaluation using the CEGRA and TOPSIS algorithms are given in the right-most column of Table 4 and Table 9, respectively. A comparison of these columns shows that the first- and second-ranked results were the same for both methods. However, the CEGRA method is simpler to implement than TOPSIS, highlighting its potential for use by decision makers with limited technical ability.

4. Conclusions

The traditional footwear industry is labor-intensive, and companies’ profits are constantly compressed as a result of rising wages. Hence, for sustainable operation, the Datong Shoes and Materials Company introduced IAMS and big data analysis systems to become an intelligent factory, greatly reducing their demand for manpower. In this study, we developed a CEGRA model for evaluation of intelligent system suppliers being considered for future collaboration, for further improvement of the company’s operational efficiency. In constructing this model, criteria for evaluation of these systems were identified using the focus group discussion method. The CEGRA model for evaluating collaborative technology can be divided into five steps, with different aspects of the IAMS evaluated for quality control. Thus, the model can be used to identify the criteria that most affects the quality of an IAMS, thereby reducing system faults that prevent collaborative technology software products from meeting end users’ requirements. As a result, the model enables traditional companies to evaluate the solutions provided by intelligent system suppliers when they may otherwise lack the expertise to do so. Using this model, the most suitable alternative software solution was identified from a list of four candidates.
In addition, a comparison of the findings obtained using the CEGRA model with those obtained from the traditional TOPSIS method, showed that both techniques identified the same options as the top two ranking systems. However, the CEGRA algorithm proposed can manage the uncertainty of decision problems, multiple decision evaluation attributes, and discrete data effectively, providing a simple and convenient method for decision making. Although the model introduced in this study was limited to the introduction of IAMS to upgrade a traditional shoe company to a technology shoe company, the results demonstrate that in future research, CEGRA evaluation models can help decision makers in different traditional industries find suitable solutions for upgrading to technology industries. The evaluation criteria and decision-making processes can provide system integrators with the ability to meet the needs of upgrade vendors, providing better system integration services when developing smart factories.

Author Contributions

C.-W.C. conceived designed, analyzed the data, and wrote the paper. All authors have read and agreed to the published version of the manuscript.

Funding

This research received no external funding.

Acknowledgments

I thank the Datong Shoes and Materials Company for providing the case study information.

Conflicts of Interest

The authors declare no conflict of interest.

References

  1. Liu, J.; Lim, K.W.; Ho, W.K.; Tan, K.C.; Srinivasan, R.; Tay, A. The intelligent alarm management system. IEEE Soft. 2003, 20, 66–71. [Google Scholar] [CrossRef]
  2. Kumar, C. Performance evaluation for implementations of a network of proxy caches. Decis. Support Syst. 2009, 46, 492–500. [Google Scholar] [CrossRef]
  3. Berman, S.; Schechtman, E.; Edan, Y. Evaluation of automatic guided vehicle systems. Robot. Comput. Integ. Manufactur. 2009, 25, 522–528. [Google Scholar] [CrossRef]
  4. Chang, C.W.; Chen, C.C. Development of expert decision model to monitor precision of solar silicon wafer machine line. Comput. Ind. Eng. 2010, 59, 481–487. [Google Scholar] [CrossRef]
  5. Koch, S.; Mitlohner, J. Software project effort estimation with voting rules. Decis. Support Syst. 2009, 895–901. [Google Scholar] [CrossRef]
  6. Lu, C.W.; Sheen, J.W.; Su, S.B.; Kuo, S.C.; Yang, Y.T.; Kuo, C.W. Work environment and health effects of operators at light-on-test process in TFT-LCD plants. Lect. Notes Comput. Sci. 2007, 4566, 113–117. [Google Scholar] [CrossRef]
  7. Lee, A.H.I.; Kang, H.Y.; Chang, C.T. Fuzzy multiple goal programming applied to TFT-LCD supplier selection by downstream manufacturers. Exp. Syst. App. 2009, 36, 6318–6325. [Google Scholar] [CrossRef]
  8. Monark, B.; Susanta, K.G.; Shankar, C. An expert system for control chart pattern recognition. Int. J. Adv. Manufactur. Technol. 2012, 62, 291–301. [Google Scholar] [CrossRef]
  9. Pal, S.; Gauri, S.K. Assessing effectiveness of the various performance metrics for multi-response optimization using multiple regression. Comput. Ind. Eng. 2010, 59, 976–985. [Google Scholar] [CrossRef]
  10. Tseng, F.M.; Chiu, Y.J.; Chen, J.S. Measuring business performance in the high-tech manufacturing industry: A case study of Taiwan’s large-sized TFT-LCD panel companies. Omega 2009, 37, 686–697. [Google Scholar] [CrossRef]
  11. Deng, J. The GRA in Cause–effect Space of Resources. J. Grey Syst. 2009, 21, 113–118. [Google Scholar]
  12. Hwang, C.L.; Yoon, Y.K. Multiple Attribute Decision Making: Methods and Applications, a State-of-the-Art Survey; Springer: Berlin/Heidelberg, Germany, 1981. [Google Scholar]
  13. Wang, S.J.; Liu, S.F.; Wang, W.L. The simulated impact of RFID-enabled supply chain on pull-based inventory replenishment in TFT-LCD industry. Int. J. Prod. Econ. 2008, 112, 570–586. [Google Scholar] [CrossRef]
  14. Park, T.Y.; Choung, J.Y.; Min, H.G. The cross-industry spillover of technological capability: Korea’s DRAM and TFT-LCD industries. World Develop. 2008, 36, 2855–2873. [Google Scholar] [CrossRef]
  15. Hsieh, K.L. Incorporating ANNs and statistical techniques into achieving process analysis in TFT-LCD manufacturing industry. Robot. Comput. Integ. Manufactur. 2010, 26, 92–99. [Google Scholar] [CrossRef]
  16. Liao, M.S.; Liang, G.S.; Chen, C.Y. Fuzzy grey relation method for multiple criteria decision-making problems. Qual. Quant. 2013, 47, 3065–3077. [Google Scholar] [CrossRef]
  17. Tzeng, G.H.; Huang, C.Y. Combined DEMATEL technique with hybrid MCDM methods for creating the aspired intelligent global manufacturing & logistics systems. Ann. Oper. Res. 2012, 197, 159–190. [Google Scholar] [CrossRef]
  18. Pradhan, M.K. Estimating the effect of process parameters on MRR, TWR and radial overcut of EDMed AISI D2 tool steel by RSM and GRA coupled with PCA. Int. J. Adv. Manufactur. Technol. 2013, 68, 591–605. [Google Scholar] [CrossRef]
  19. Mondal, S.; Paul, C.P.; Kukreja, L.M.; Bandyopadhyay, A.; Pal, P.K. Application of Taguchi-based gray relational analysis for evaluating the optimal laser cladding parameters for AISI1040 steel plane surface. Int. J. Adv. Manufactur. Technol. 2015, 66, 91–96. [Google Scholar] [CrossRef]
  20. Sun, C.C. Combining grey relation analysis and entropy model for evaluating the operational performance: An empirical study. Qual. Quant. 2014, 48, 1589–1600. [Google Scholar] [CrossRef]
  21. Fayaz, M.; Ullah, I.; Kim, D.H. Underground risk index assessment and prediction using a simplified hierarchical fuzzy logic model and kalman filter. Processes 2018, 6, 103. [Google Scholar] [CrossRef] [Green Version]
  22. Saaty, T.L. How to make a decision: The analytic hierarchy process. Eur. J. Oper. Res. 1971, 40, 9–10. [Google Scholar]
  23. Shih, H.S.; Shyur, H.J.; Lee, E.S. An extension of TOPSIS for group decision making. Math. Comput. Model. 2007, 45, 801–813. [Google Scholar] [CrossRef]
  24. Shannon, C.E. A mathematical theory of communication. Bell Syst. Tech. J. 1948, 27, 623–656. [Google Scholar] [CrossRef]
  25. Gupta, M.; Kumar, S. Multi-objective optimization of cutting parameters in turning using grey relational analysis. Int. J. Ind. Eng. Comput. 2013, 4, 547–558. [Google Scholar] [CrossRef]
  26. Sharma, A.; Yadava, V. Optimization of cut quality characteristics during Nd: YAG laser straight cutting of Ni-based superalloy thin sheet Using grey relational analysis with entropy measurement. Mater. Manuf. Process. 2011, 26, 1522–1529. [Google Scholar] [CrossRef]
  27. Zhou, S.; Zhou, L.; Yu, L.; Liu, S.; Luo, Q.; Sun, P.; Wu, J. Monitoring chip fatigue in an IGBT module based on grey relational analysis. Microelectron. Reliab. 2016, 56, 49–52. [Google Scholar] [CrossRef] [Green Version]
  28. Kuo, Y.; Yang, T.; Huang, G.W. The use of grey relational analysis in solving multiple attribute decision-making problems. Comput. Ind. Eng. 2008, 55, 80–93. [Google Scholar] [CrossRef]
  29. Wu, L.C.; Ong, C.S.; Hsu, Y.W. Knowledge-based organization evaluation. Decis. Support Syst. 2008, 45, 541–549. [Google Scholar] [CrossRef] [Green Version]
  30. Rouhani, S.; Ghazanfari, M.; Jafari, M. Evaluation model of business intelligence for enterprise systems using fuzzy TOPSIS. Expert Syst. Appl. 2012, 39, 3764–3771. [Google Scholar]
  31. He, Y.H.; Wang, L.B.; He, Z.Z.; Xie, M. A fuzzy TOPSIS and Rough Set based approach for mechanism analysis of product infant failure. Eng. Appl. Artif. Intell. 2016, 47, 25–37. [Google Scholar] [CrossRef]
  32. Rudnik, K.; Kacprzak, D. Fuzzy TOPSIS method with ordered fuzzy numbers for flow control in a manufacturing system. Appl. Soft Comput. 2017, 52, 1020–1041. [Google Scholar] [CrossRef]
  33. Sianaki, O.A.; Masoum, M.A.S. A multi-agent intelligent decision making support system for home energy management in smart grid: A fuzzy TOPSIS approach. Multiagent Grid Syst. 2013, 9, 181–195. [Google Scholar] [CrossRef] [Green Version]
  34. Dutta, B.; Singha, T.; Goh, M.; Lamata, M.T.; Verdegayd, J.L. Post factum analysis in TOPSIS based decision making method. Expert Syst. Appl. 2019, 138, 112806. [Google Scholar] [CrossRef]
  35. Reis, M.S.; Gins, G. Industrial process monitoring in the big data/industry 4.0 Era: From detection, to diagnosis, to prognosis. Processes 2017, 5, 35. [Google Scholar] [CrossRef] [Green Version]
  36. Yang, C.; Huang, J.B. A decision model for IS outsourcing. Inf. Manag. 2000, 20, 225–239. [Google Scholar] [CrossRef] [Green Version]
  37. Hafeez, K.; Zhang, Y.B.; Malak, N. Determining key capabilities of a firm using analytic hierarchy process. Int. J. Prod. Econ. 2002, 76, 39–51. [Google Scholar] [CrossRef]
  38. Jharkharia, S.; Shankar, R. Selection of logistics service provider: An analytic network process (ANP) approach. Sci. Dir. 2007, 35, 274–289. [Google Scholar] [CrossRef]
  39. Wei, Y.L. Worldwide storage market overview in the context of cloud and storage market overview in the context of cloud and big data trends. J. Inf. Commun. Technol. 2016, 166, 1–10. [Google Scholar]
  40. Solomon, L. The Top Complaints from Employees about Their Leaders, Harvard Business Review. Available online: https://hbr.org/2015/06/the-top-complaints-from-employees-about-their-leaders (accessed on 14 February 2020).
  41. The Hartford’s Business Owner’s Playbook. Available online: https://www.thehartford.com/business-playbook/in-depth/implementing-employee-rewards-programs (accessed on 14 February 2020).
  42. Lee, L. 3D Printing—Transforming The Supply Chain: Part 1. Available online: https://www.ibm.com/blogs/insights-on-business/electronics/3d-printing-transforming-the-supply-chain-part-1/ (accessed on 14 February 2020).
  43. Sernola, T. How to Initiate a Capacity Planning and Management Process for a Rapid Deployment Unit of a Security Service Company. Bachelor’s Thesis, Tampere University of Applied Sciences, Tampere, Finland, 2013. [Google Scholar]
  44. Li, S.; Lin, B. Accessing information sharing and information quality in supply chain management. Dec. Support Syst. 2006, 42, 1641–1656. [Google Scholar] [CrossRef]
  45. Holsapple, C.W.; Wu, J. A resource-based perspective on information technology, knowledge management, and firm performance, handbook of research on contemporary theoretical models in information systems. IGI Glob. 2009, 296–310. [Google Scholar] [CrossRef]
  46. Raoa, C.M.; Rao, K.P.; Muniswamy, C.C. Delivery performance measurement in an integrated supply chain management: Case study in batteries manufacturing firm. Serb. J. Manag. 2011, 6, 205–220. [Google Scholar] [CrossRef] [Green Version]
  47. Kaynak, H. The relationship between total quality management practices and their effects on firm performance. J. Operat. Manag. 2003, 21, 405–435. [Google Scholar] [CrossRef]
  48. Hutchinson, R.A.; Crosslin, R.L. The Cost of Information Systems Modernization a Comparison of Options for Life-Cycle Project Management Systems; Logistics Management Institute: Tysons, VA, USA, 1990. [Google Scholar]
  49. Schneider, W.; Shiffrin, R.M. Controlled and automatic human information processing: I. Detection, search, and attention. Psychol. Rev. 1977, 84, 1–66. [Google Scholar] [CrossRef]
  50. Ebert, C. The impacts of software product management. J. Sys. Soft. 2007, 80, 850–861. [Google Scholar] [CrossRef]
  51. Langdon, P.; Lewis, T.; Clarkson, J. The effects of prior experience on the use of consumer products. Univers. Access Inf. Soc. 2007, 6, 179–191. [Google Scholar] [CrossRef]
  52. Jokela, P.; Anne, S. Re-examining the link between fairness and commitment in buyer-supplier relationships. J. Purchas. Supply Manag. 2017, 23, 268–279. [Google Scholar] [CrossRef]
  53. Feng, T.T. A Study on the Relationship among Technological Learning and Technological Capability for Information Service industry in Taiwan. Ph.D. Thesis, National Chengchi University, Taipei, Taiwan, 2000. [Google Scholar]
Figure 1. Comparing the CEGRA method and the TOPSIS method.
Applsci 10 02022 g001
Table 1. Turnover and gross profit margin of Datong Shoe and Materials Company, 2013–2018. (USD).
201320142015201620172018
Turnover$3,483,534$3,968,090$3,645,004$3,624,018$3,572,838$3,763,531
Gross Margin8.61%16.89%35.75%33.68%30.45%36.28%
Table 2. Evaluation criteria and system definition or requirement.
Evaluation CriteriaSystem Definition or Requirement
Market share (MS) [39]Data related to consumer interaction that is added through the Internet of Things, to analyze the market share for sports shoes.
Improving performance and enhancing morale (IPE) [40]Provision of tools, such as information systems, that assist company executives in the management of cross-team projects, reduction of errors, and improvement of job performance and morale.
Performance reward system (PRS) [41]Rewards should be based on accomplishments and performance, and applied consistently across the company. In small business, performance is measured as a combination of attainment in productivity, efficiency, and training. The main goal of rewards is to motivate employees with tangible reasons to continue to improve performance and help the company grow.
Technology and engineering (TE)Demand for new sports shoes may change during or after they are in development. The system should allow for instant customer and engineering changes and outsourced technology. This metric assesses the provisions made for such a response.
Economies of scope (ES) [42]The ability to exploit commonalities in processing for cost-effective operation. For instance, by sharing the same raw materials in the production process, a company can produce two different kinds of sports shoes simultaneously. The approximate cost of each kind of shoe is consequently lower than the average cost required to produce the two types of shoes independently.
Surge capacity (SC) [43]The ability to meet sudden, unexpected increases in demand by expanding production with existing personnel and equipment.
Information sharing (IS) [44]Information sharing and quality are not impacted by customer or technological uncertainty, commitment of supply chain partners, or information technology (IT) enablers.
IT capability (ITC) [45]The organization’s ability to identify how IT can meet business needs, use IT to cost-effectively improve business processes, and provide long-term maintenance and support for IT-based systems.
Delivery performance (DP) [46]The customer expectation level met by products and services supplied by an organization. It indicates the potential for the supply chain to provide products and services to customers.
Flexibility in billing and payment (FBP) [38]Conditions that increase goodwill between the partner and the raw material supplier.
Quality management (QM) [47]The relationships between the quality management practices and various levels of organizational performance.
Reducing the development and maintenance costs of information systems (RD) [48]This refers to all recurring sustenance, operations, and maintenance costs accumulated in the planned product life cycle, (in the shoe industry, this encompasses a 20-year span). The system includes documentation, data, hardware, software applications, replacement training, and systems and project management.
Human Information Processing (HIP) [49]Activation of a learned sequence in the long-term memory of elements needed to manufacture sneakers. This is initiated through appropriate inputs and should proceed automatically, without stressing the capacity limitations of the system and without demanding attention or management.
Product management (PM) [50]This metric assesses the institutionalization of methods in the sneaker manufacturing process, to improve the success rate of projects in terms of schedule predictability, quality, and project duration.
Experience in similar products (ESP) [51]Application of previous interactions with customers, detailed examination of records of athletes or consumers in different sports, and of different ages and abilities, or knowledge of previous use and designs, to help clarify consumers’ requirements for better functional shoes.
More reliable information system procurement and performance (MR) [52]The footwear industry requires the procurement of several diverse raw materials, which is affected by fluctuations in international futures. This metric assesses the ability to plan for such fluctuations so that purchase prices will be less than half the sale price.
Learning new software management technology (LN) [53]Company employees use of new production technology software to learn new abilities and adapt to different tasks, and scholars are regarded as affecting the company’s competitiveness.
Table 3. The decision-making matrix.
CompanyMSIPEPRSTEESSCISITCDPFBPQMRDHIPPMESPMRLN
Company A2.982.713.352.302.332.211.722.092.042.251.912.172.162.642.082.041.96
Company B2.192.322.082.622.622.643.392.362.512.432.652.652.542.312.392.722.34
Company C2.352.292.042.652.692.592.613.063.042.593.052.622.622.602.612.712.62
Company D2.492.682.532.432.372.562.282.492.412.742.392.562.682.442.912.533.09
Table 4. Summaries of the resultant relational coefficients.
MSIPEPRTEESSCISITCDPFBPQMRDHIPPMESPMRLN Γ 0 i Rank
Company A1.001.001.000.500.500.500.500.501.001.001.001.001.000.500.501.001.000.79411
Company B0.500.520.510.920.841.001.000.580.680.730.610.500.581.000.610.500.750.69592
Company C0.560.500.501.001.000.900.681.000.500.590.500.520.530.530.730.500.630.65713
Company D0.620.930.620.610.530.840.600.630.730.500.700.550.500.721.000.580.500.65654
Table 5. Normalization of evaluation IAMSs decision matrix.
CompanyMSIPEPRSTEESSCISITCDPFBPQMRDHIPPMESPMRLN
Company A0.59130.54030.65560.45920.46460.44100.33440.41390.77200.81810.37690.98100.95970.00000.41340.96300.7873
Company B0.43450.46260.40710.52310.52250.52680.65900.46730.40920.51760.52290.00000.25840.85060.47500.00000.5225
Company C0.46630.45660.39920.52910.53640.51680.50740.60600.00000.25050.60180.06130.11070.10310.51870.01420.3274
Company D0.49410.53440.49510.48520.47260.51080.44320.49310.48640.00000.47160.18390.00000.51550.57830.26910.0000
Table 6. Weighted normalization IAMS matrix.
CompanyMSIPEPRSTEESSCISITCDPFBPQMRDHIPPMESPMRLN
Company A0.03480.03180.03860.02700.02730.02590.01970.02430.04540.04810.02220.05770.05650.00000.02430.05660.0463
Company B0.02560.02720.02390.03080.03070.03100.03880.02750.02410.03040.03080.00000.01520.05000.02790.00000.0307
Company C0.02740.02690.02350.03110.03160.03040.02980.03560.00000.01470.03540.00360.00650.00610.03050.00080.0193
Company D0.02910.03140.02910.02850.02780.03000.02610.02900.02860.00000.02770.01080.00000.03030.03400.01580.0000
Table 7. The distance between the ideal solution.
CompanyMSIPEPRSTEESSCISITCDPFBPQMRDHIPPMESPMRLN
Company A0.00000.00000.00000.00410.00420.00500.01910.01130.00000.00000.01320.00000.00000.05000.00970.00000.0000
Company B0.00920.00460.01460.00040.00080.00000.00000.00820.02130.01770.00460.05770.04130.00000.00610.05660.0156
Company C0.00740.00490.01510.00000.00000.00060.00890.00000.04540.03340.00000.05410.04990.04400.00350.05580.0270
Company D0.00570.00040.00940.00260.00380.00090.01270.00660.01680.04810.00770.04690.05650.01970.00000.04080.0463
Table 8. The distance between the negative solution.
CompanyMSIPEPRSTEESSCISITCDPFBPQMRDHIPPMESPMRLN
Company A0.00920.00490.01510.00000.00000.00000.00000.00000.04540.04810.00000.05770.05650.00000.00000.05660.0463
Company B0.00000.00040.00050.00380.00340.00500.01910.00310.02410.03040.00860.00000.01520.05000.00360.00000.0307
Company C0.00190.00000.00000.00410.00420.00450.01020.01130.00000.01470.01320.00360.00650.00610.00620.00080.0193
Company D0.00350.00460.00560.00150.00050.00410.00640.00470.02860.00000.00560.01080.00000.03030.00970.01580.0000
Table 9. Outcome of the TOPSIS.
TOPSIS Ideal Solution d+TOPSIS Negative Ideal Solution dTOPSIS Performance ValuesRank
Company A0.05770.10600.64761
Company B0.07900.06900.46592
Company C0.10450.02850.21424
Company D0.09370.04610.32993

