1. Introduction
Since the introduction of the osseointegration concept, the method of implant surgery and prosthetic treatment has undergone many changes. In the initial implant restoration, it was most important to achieve successful bone adhesion considering the remaining bone as much as possible. Afterwards, the restoration was performed in accordance with the implant and the surrounding teeth. However, as successful osseointegration became more common and the success rate of bone graft for the areas of residual bone deficiency increased, it changed into a prosthetic-driven treatment. This is to establish a prosthetic plan in consideration of the patient’s aesthetics and functionality, and then perform the implant surgery according to the position of the prosthesis. This prosthesis-driven implant placement concept is becoming more important in the restoration of teeth using implants, and more recently, computer-aided design/computer aided manufacturing (CAD/CAM) technology has been developed more rapidly [
1,
2].
In the prosthetic-driven implant placement concept, correlation between available bone and ideal tooth position is important. This can be achieved through preparation of diagnostic casts, diagnostic wax up of the restoration, and radiographic stent representing the ideal tooth position before patient imaging. Then the customized surgical guide can be prepared for accurate transfer of implant planning for clinical application [
3]. In combination with implant planning software and 3D imaging modalities, position of planned implant could be transferred from the computer to the patient mouth through computer-based surgical guides. Computer-assisted surgery (CAS) systems provide a significant increase in implantation precision compared with non-guided implantation surgery. Moreover, they provide minimally invasive, predictable, and shorter time surgery [
4].
For successful implants, evaluations of anatomical limitations are necessary to perform the additional surgeries, such as bone grafts, sinus grafts before implant surgery [
4,
5]. Previously, surgical guides have been used for the reference of the placement position [
4,
5,
6,
7], therefore these kinds of the surgical guide was provided only for placement position. A computer software was developed to help us simulate virtually implant placement and predict the completion of the prosthesis [
8,
9]. However, implant surgery using a guide system has a disadvantage in that the volume and height of the instrument is increased by adding a portion for the guide. In addition, as the guide system for each manufacturer is different, additional system costs are incurred. This results in a dependency on the manufacturer’s system. Therefore, if the guide system is used only to determine the implant position and path of the implant, and the operation can be performed in the conventional manner using the implant placement protocol what the operator needs, it will be possible to create a more operator-driven surgical environment and patient discomfort could be reduced.
This paper aims to evaluate the accuracy of computer-based pilot-guided implant surgery in comparison with fully guided implant surgery and to evaluate the efficacy of computer-guided implant surgery.
2. Materials and Methods
20 patients with a total of 74 implants were divided into two groups, one is pilot-guided implant surgery group and the other is fully guided implant surgery group. Pilot-guided implant surgery was performed in ten patients with 33 implants as follows.
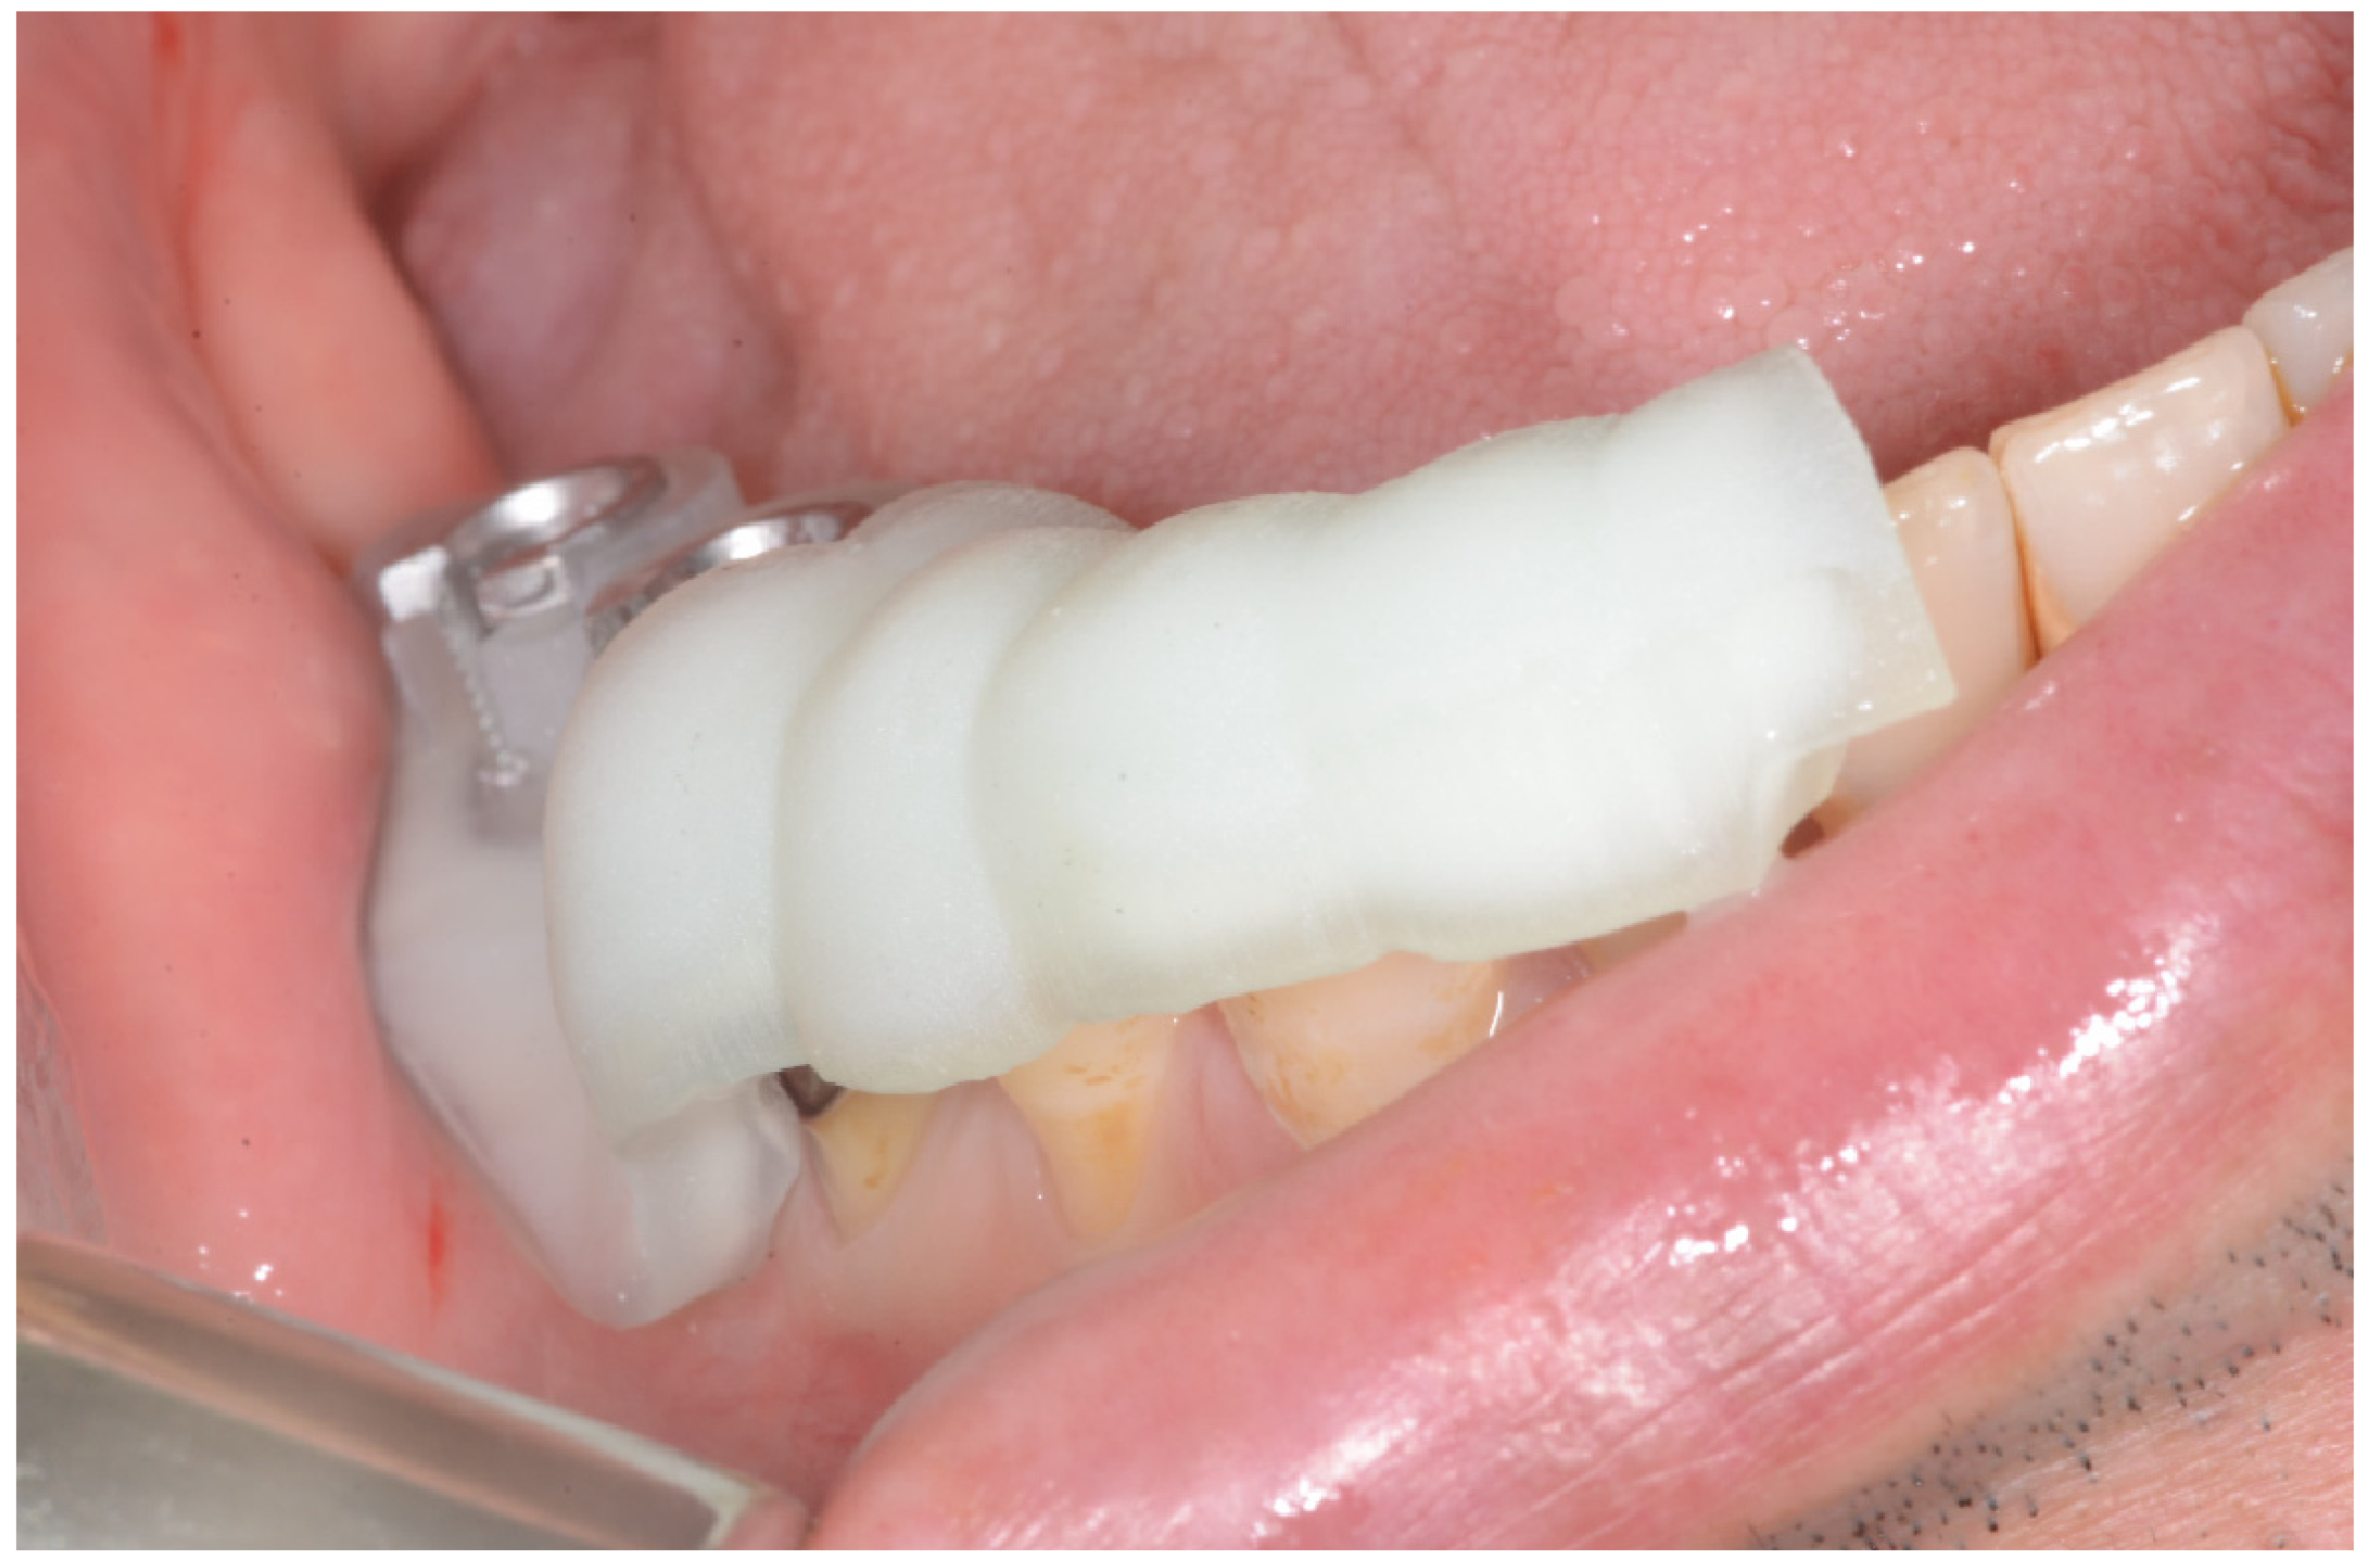
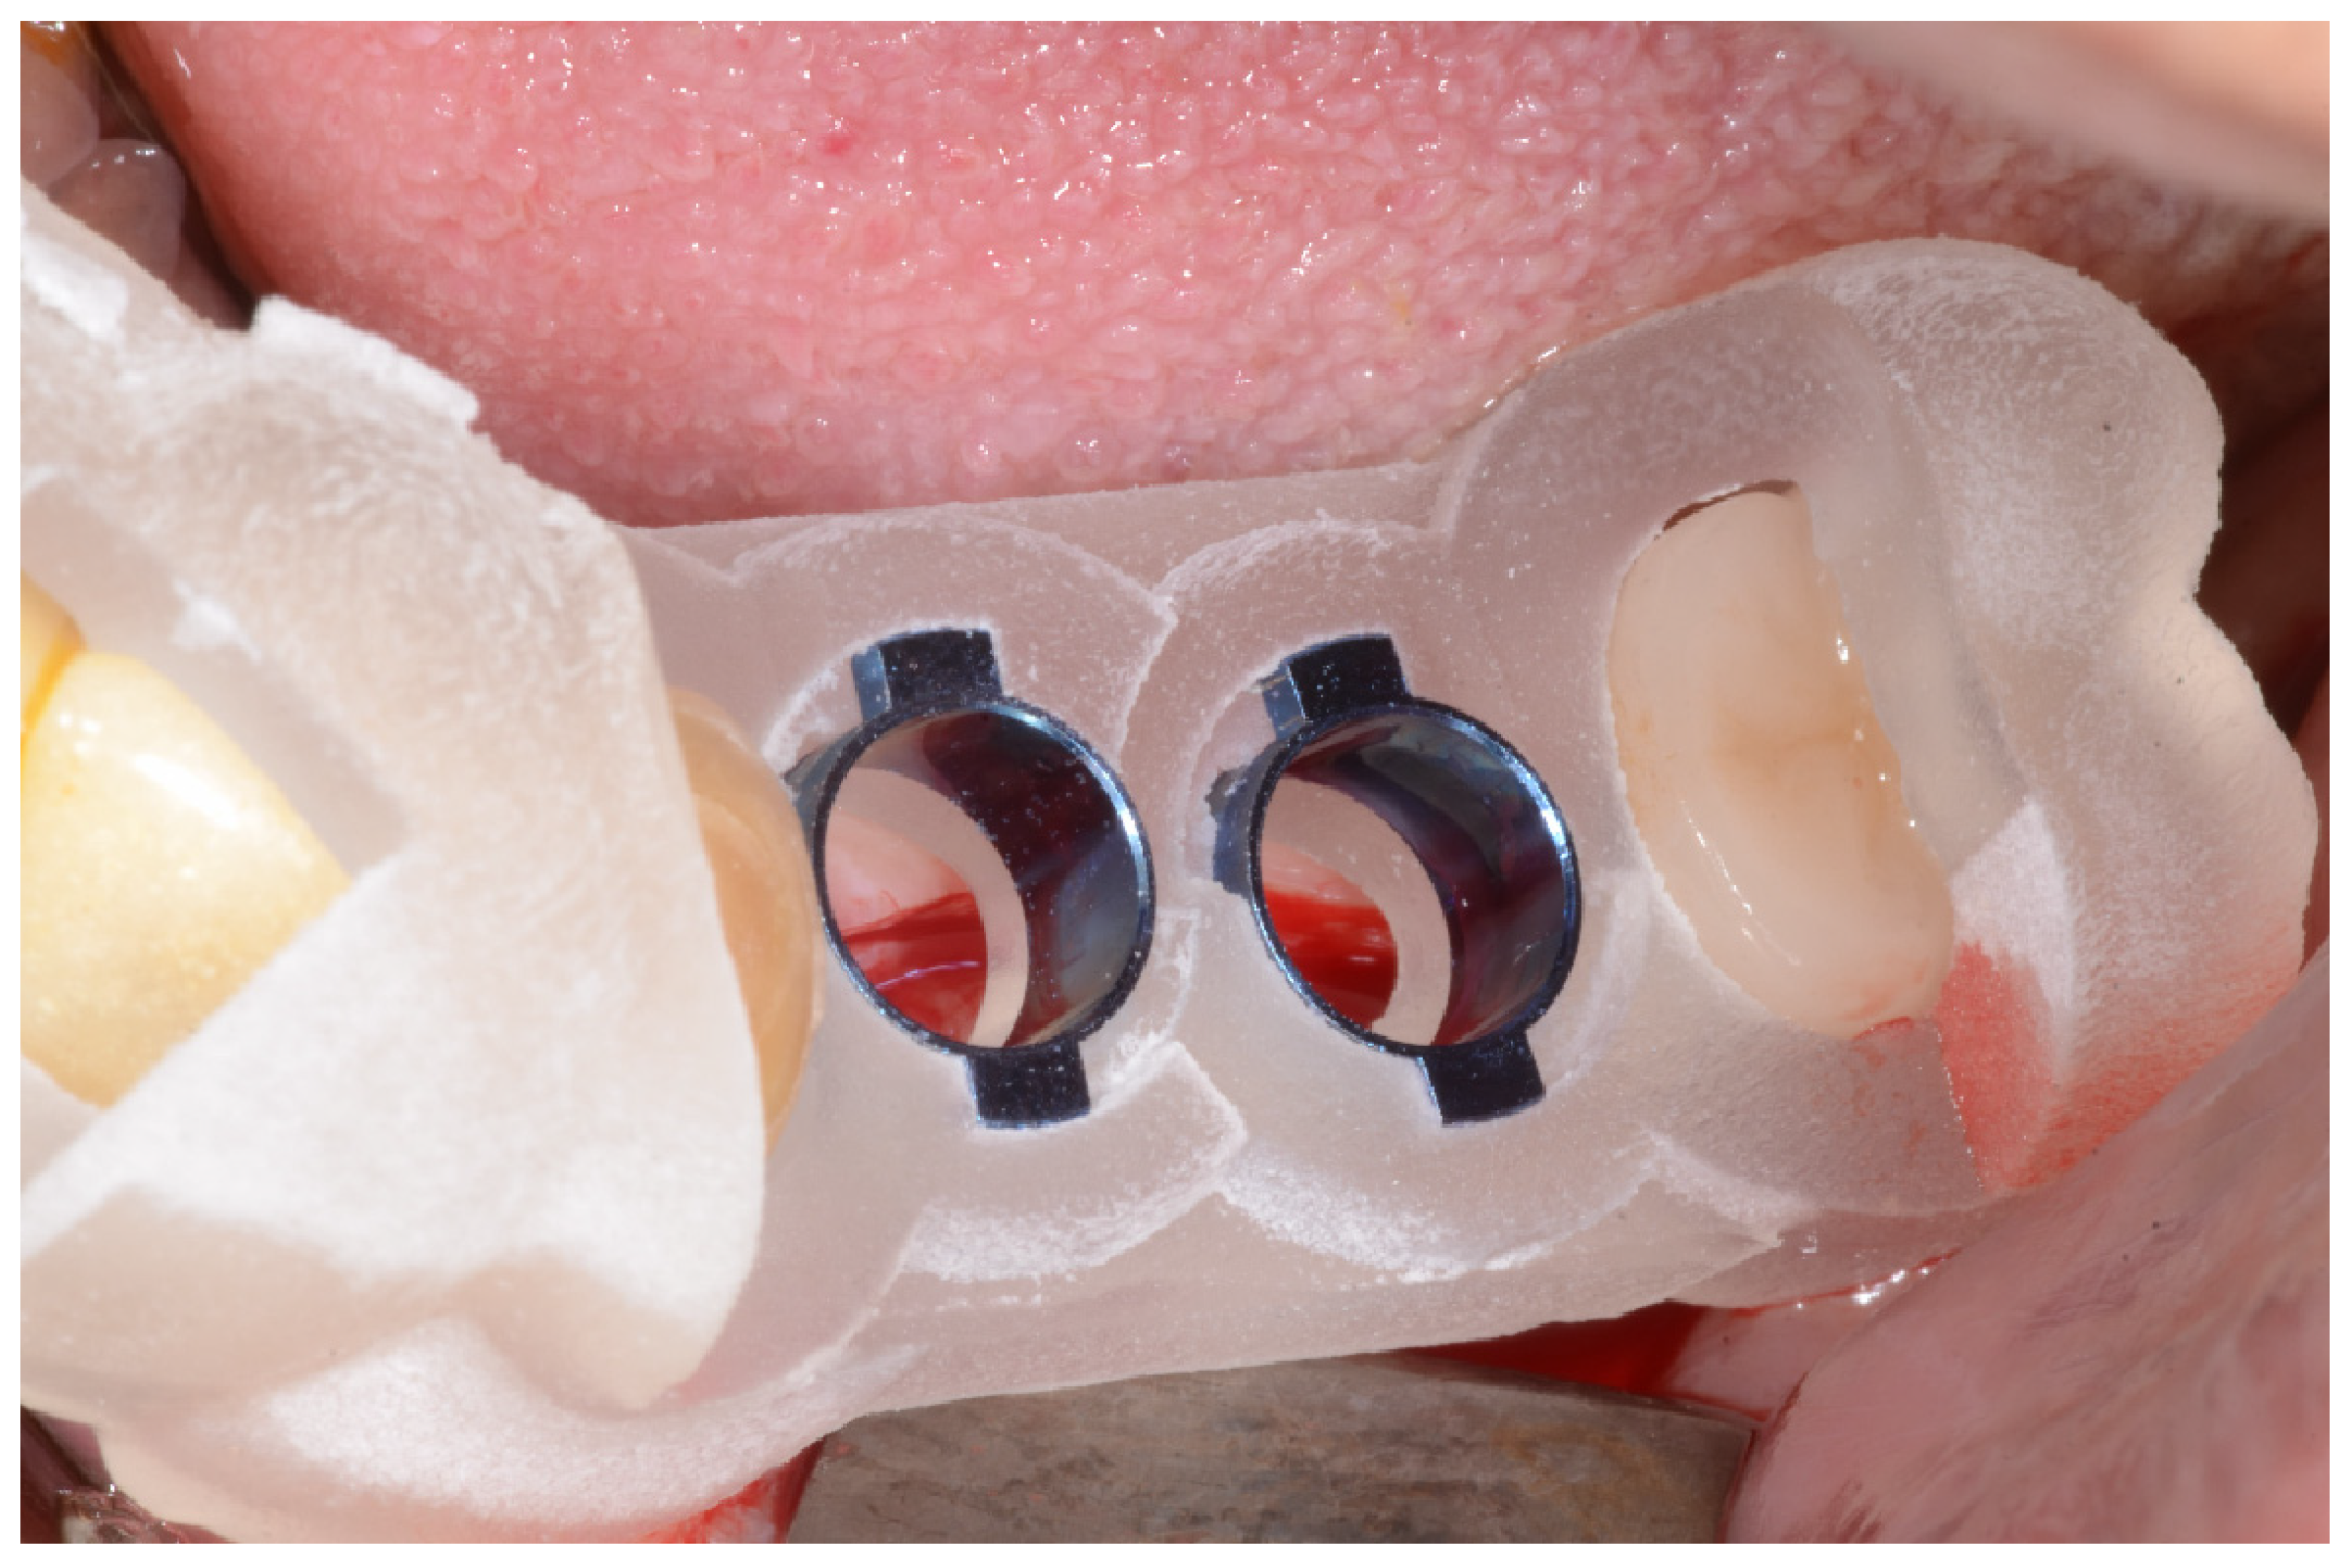
CT scan data set of patients in DICOM format registered with the surface scan data in STL format of the impression model, and data transmission was done to BlueSkyPlan (BlueSkyBio, Chicago, IL, USA). First, prosthetic crowns were aligned at the site of missing teeth. Then the positioning of the implant was placed according to the crown position. According to the virtual planning and manufacturer’s recommendations, guiding sleeves of 5-mm height, 5.5-mm diameter, and 10-mm offset were incorporated into the surgical templates. Surgical guide was designed by creating patches and finally, designed surgical guide’s STL file was obtained. Zenith Slicer software (Dentis, Daegu, South Korea) was used to prepare the STL files to design the surgical guide. SLA Zenith-C (Dentis, Daegu, South Korea) 3-D printer was used. The material for 3D printing was urethane acrylate oligomer-based photopolymer resin (ZMD-1000B Clear SG, Dentis, Daegu, South Korea). It uses resin fill system with a layer thickness of 50 microns and accuracy of 0.1 mm variation. After printing the guide, pour isopropyl alcohol (IPA) or alcohol (more than 75% of purity) into the cleaning container for post-processing of the surgical template, immerse the printout, clean it with a soft brush, remove the support, and cure with 385 and 405 nm wavelength for 10 min under room temperature in the curing machine (Zenith cure, Dentis, Daegu, South Korea). The correct position of each sleeve was inserted manually into the template hole (
Figure 1).
Initial drill and 2.0 mm drill were used for accurate planned position and then 2.8 mm drill was used for the enlargement of the drilling site, and surgical guide was removed. And then the intermediate and final drills were used for free hand sequential drilling. The implant was installed with fixture mount driver and inserted manually in the preparation site. When manual tightening met resistance, further tightening using a ratchet was continued until reaching the required depth with Dentis SLA implant (Dentis, Daegu, South Korea). For the flapless surgery, vertical depth was determined by mucosal thickness on preoperative CT data (
Figure 2 and
Figure 3).
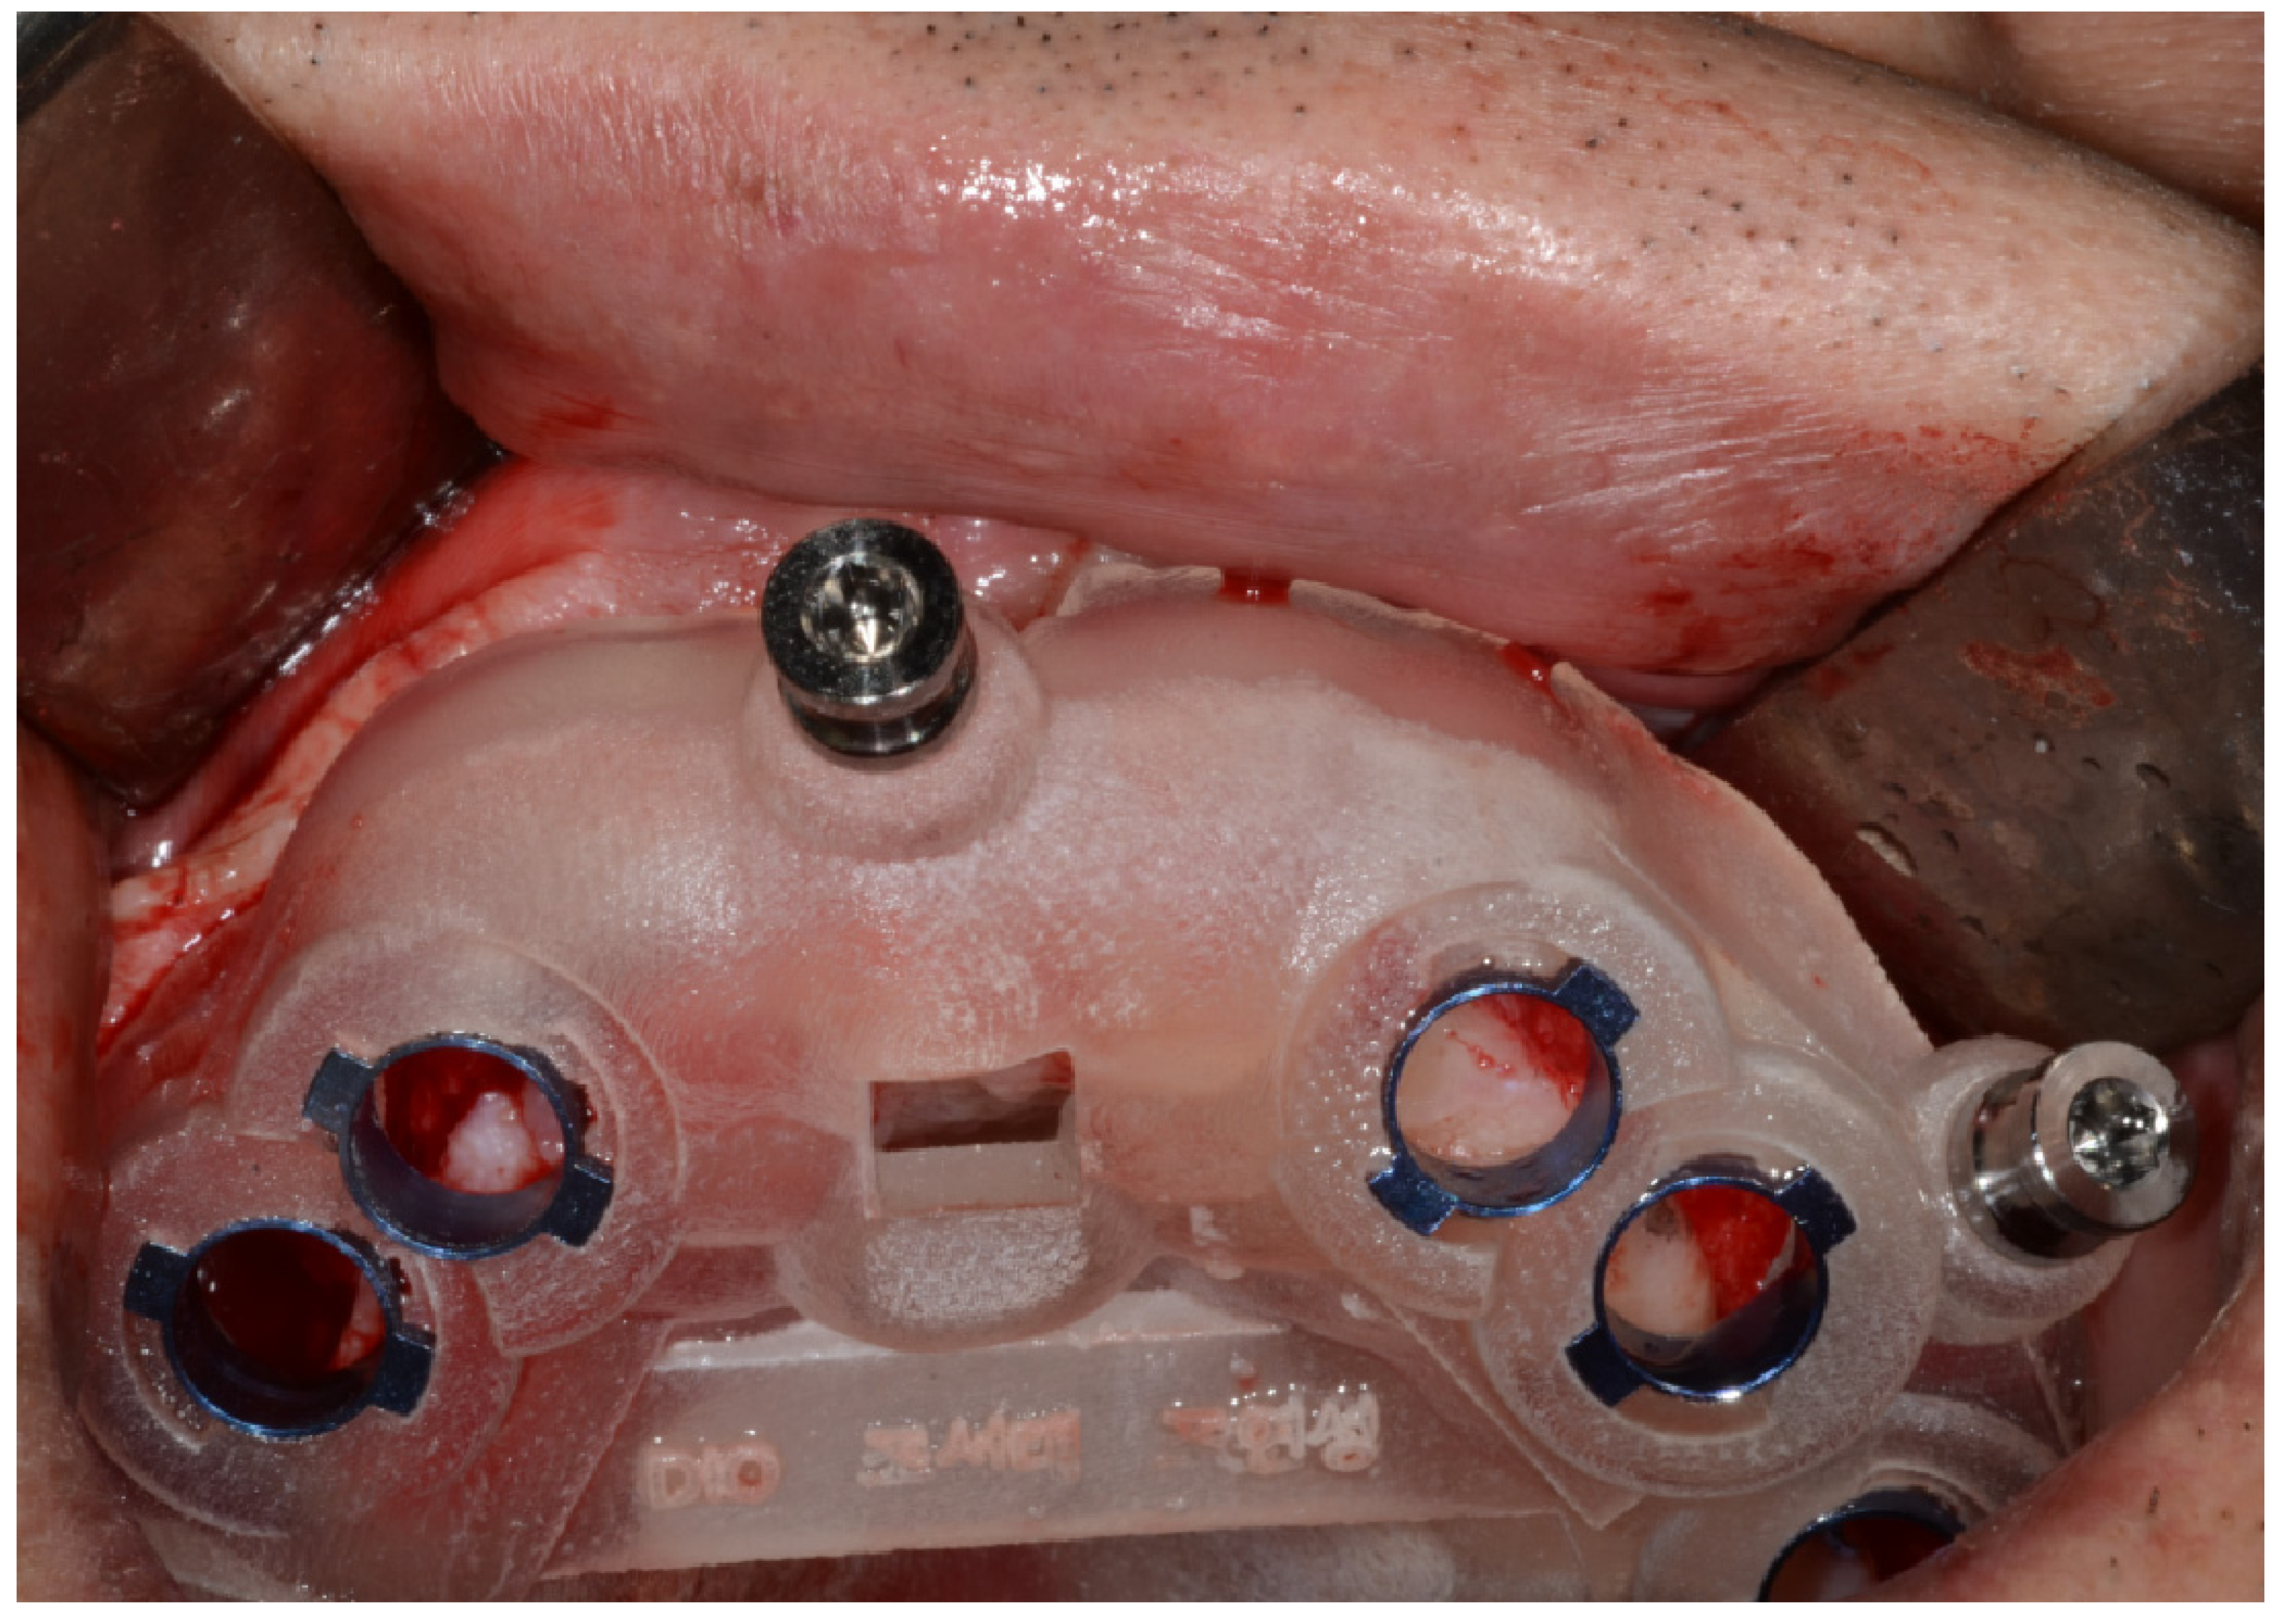
Forty-one implants of ten patients were planned using a fully guided navigation implant placement protocol (DIO, Busan, South Korea). Each patient took an intraoral scan using a TriOs intraoral scanner (3Shape, Denmark) and a preoperative CBCT scan. The preoperative plan made with Implant Studio Software (3Shape, Denmark), and then performed the implant surgery using surgical guide from initial drilling to final drill and guided implant placement (
Figure 4 and
Figure 5).
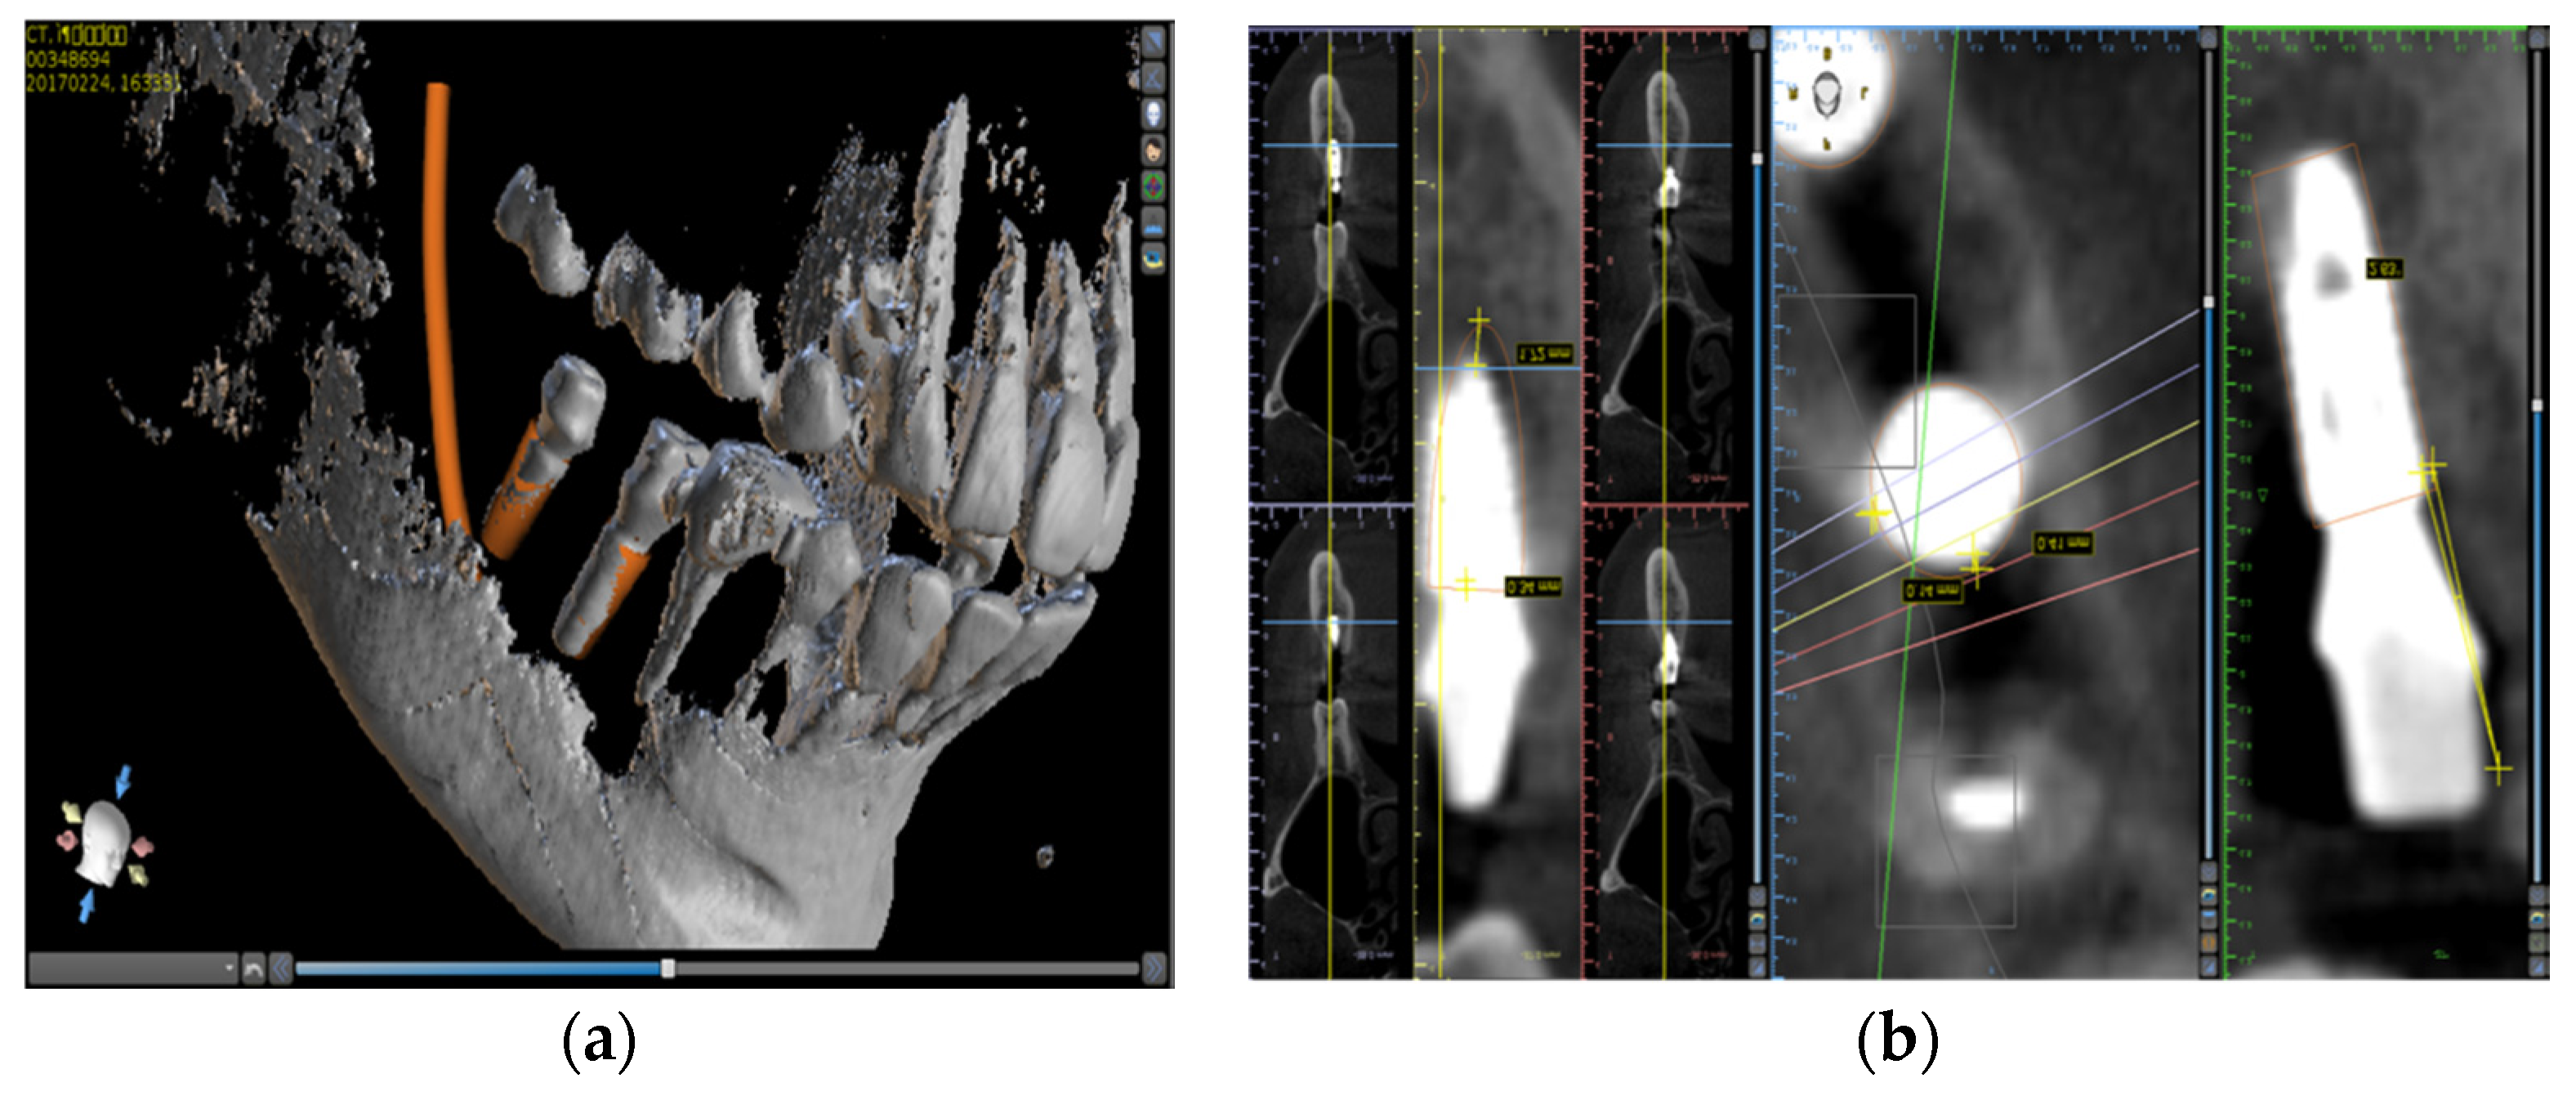
After the operation, data of actual implants were obtained from the CT scan, and this 3D image were superimposed with the pre-planned images (
Figure 6).
The difference between the planned implant position and the actual implanted position was measured on the superimposed 3D image. Additional measurements were made by dividing the deviations by three axes of dx(mesio-distal), dy(bucco-lingual), and dz(vertical). Deviations in the top (shoulder area) and bottom (apical area) positions of the implant fixture were evaluated. In addition, the angular difference of the implants was measured and statistically verified by dividing each measurement into two groups, tooth-supported and bone-supported, and anterior and posterior parts [
10].
One year after prosthesis, CT was obtained and the marginal bone loss was measured on mesial and distal side in reconstructed CT image. The lower edge of the implant neck was used as a reference point for the marginal bone level measurements. A bone level apical or shoulder to the reference point was given a negative or positive value, respectively.
Statistical analysis was performed using IBM SPSS Statistics V20. A box plot graph was prepared for the measured values of the distance and angular deviation. To evaluate the statistical significance of the difference in values, the equality of variances was evaluated through Leven’s test when the number of values in each group was 30 or more. If the number of data in each group was less than 30, nonparametric tests were conducted through the Mann-Whitney U test.
This study protocol was approved by the institutional ethics committee. Written informed consent was obtained from all of the patients. (CUDHIRB 1604027)
3. Results
A total of 74 implants were installed in the 20 patients and fixed prostheses were done. There was no significant complication 1 year after prosthesis. Three of twenty patients were in full edentulous state (1 patient with pilot guide (8 implants) and two patients with full guide (16 implants)), and these three surgical guides were supported from the bone. Of the implants placed, 14 were implanted in the anterior region (ten pilot guides and four full guides). However, the remaining 12 implants, except for the two implants of a patient using the pilot guides, were used with the posterior part using a single guide. It was planted at the same time. Total 63 implants were placed with open flap technique and 11 implants were placed with flapless technique.
Table 1 shows the distribution of implant placement, supporting part of the guide, and flap/flapless technique. All of the implant surgeries followed preoperative planning except for one case in pilot guide implant group in which the implant (#14) was excluded from the data because of the fracture of the surgical guide during surgery. Radiological examination showed that all the implants had achieved osseointegration, and both the soft and hard tissues around implants were stable. There was no implant failure one year after prosthesis
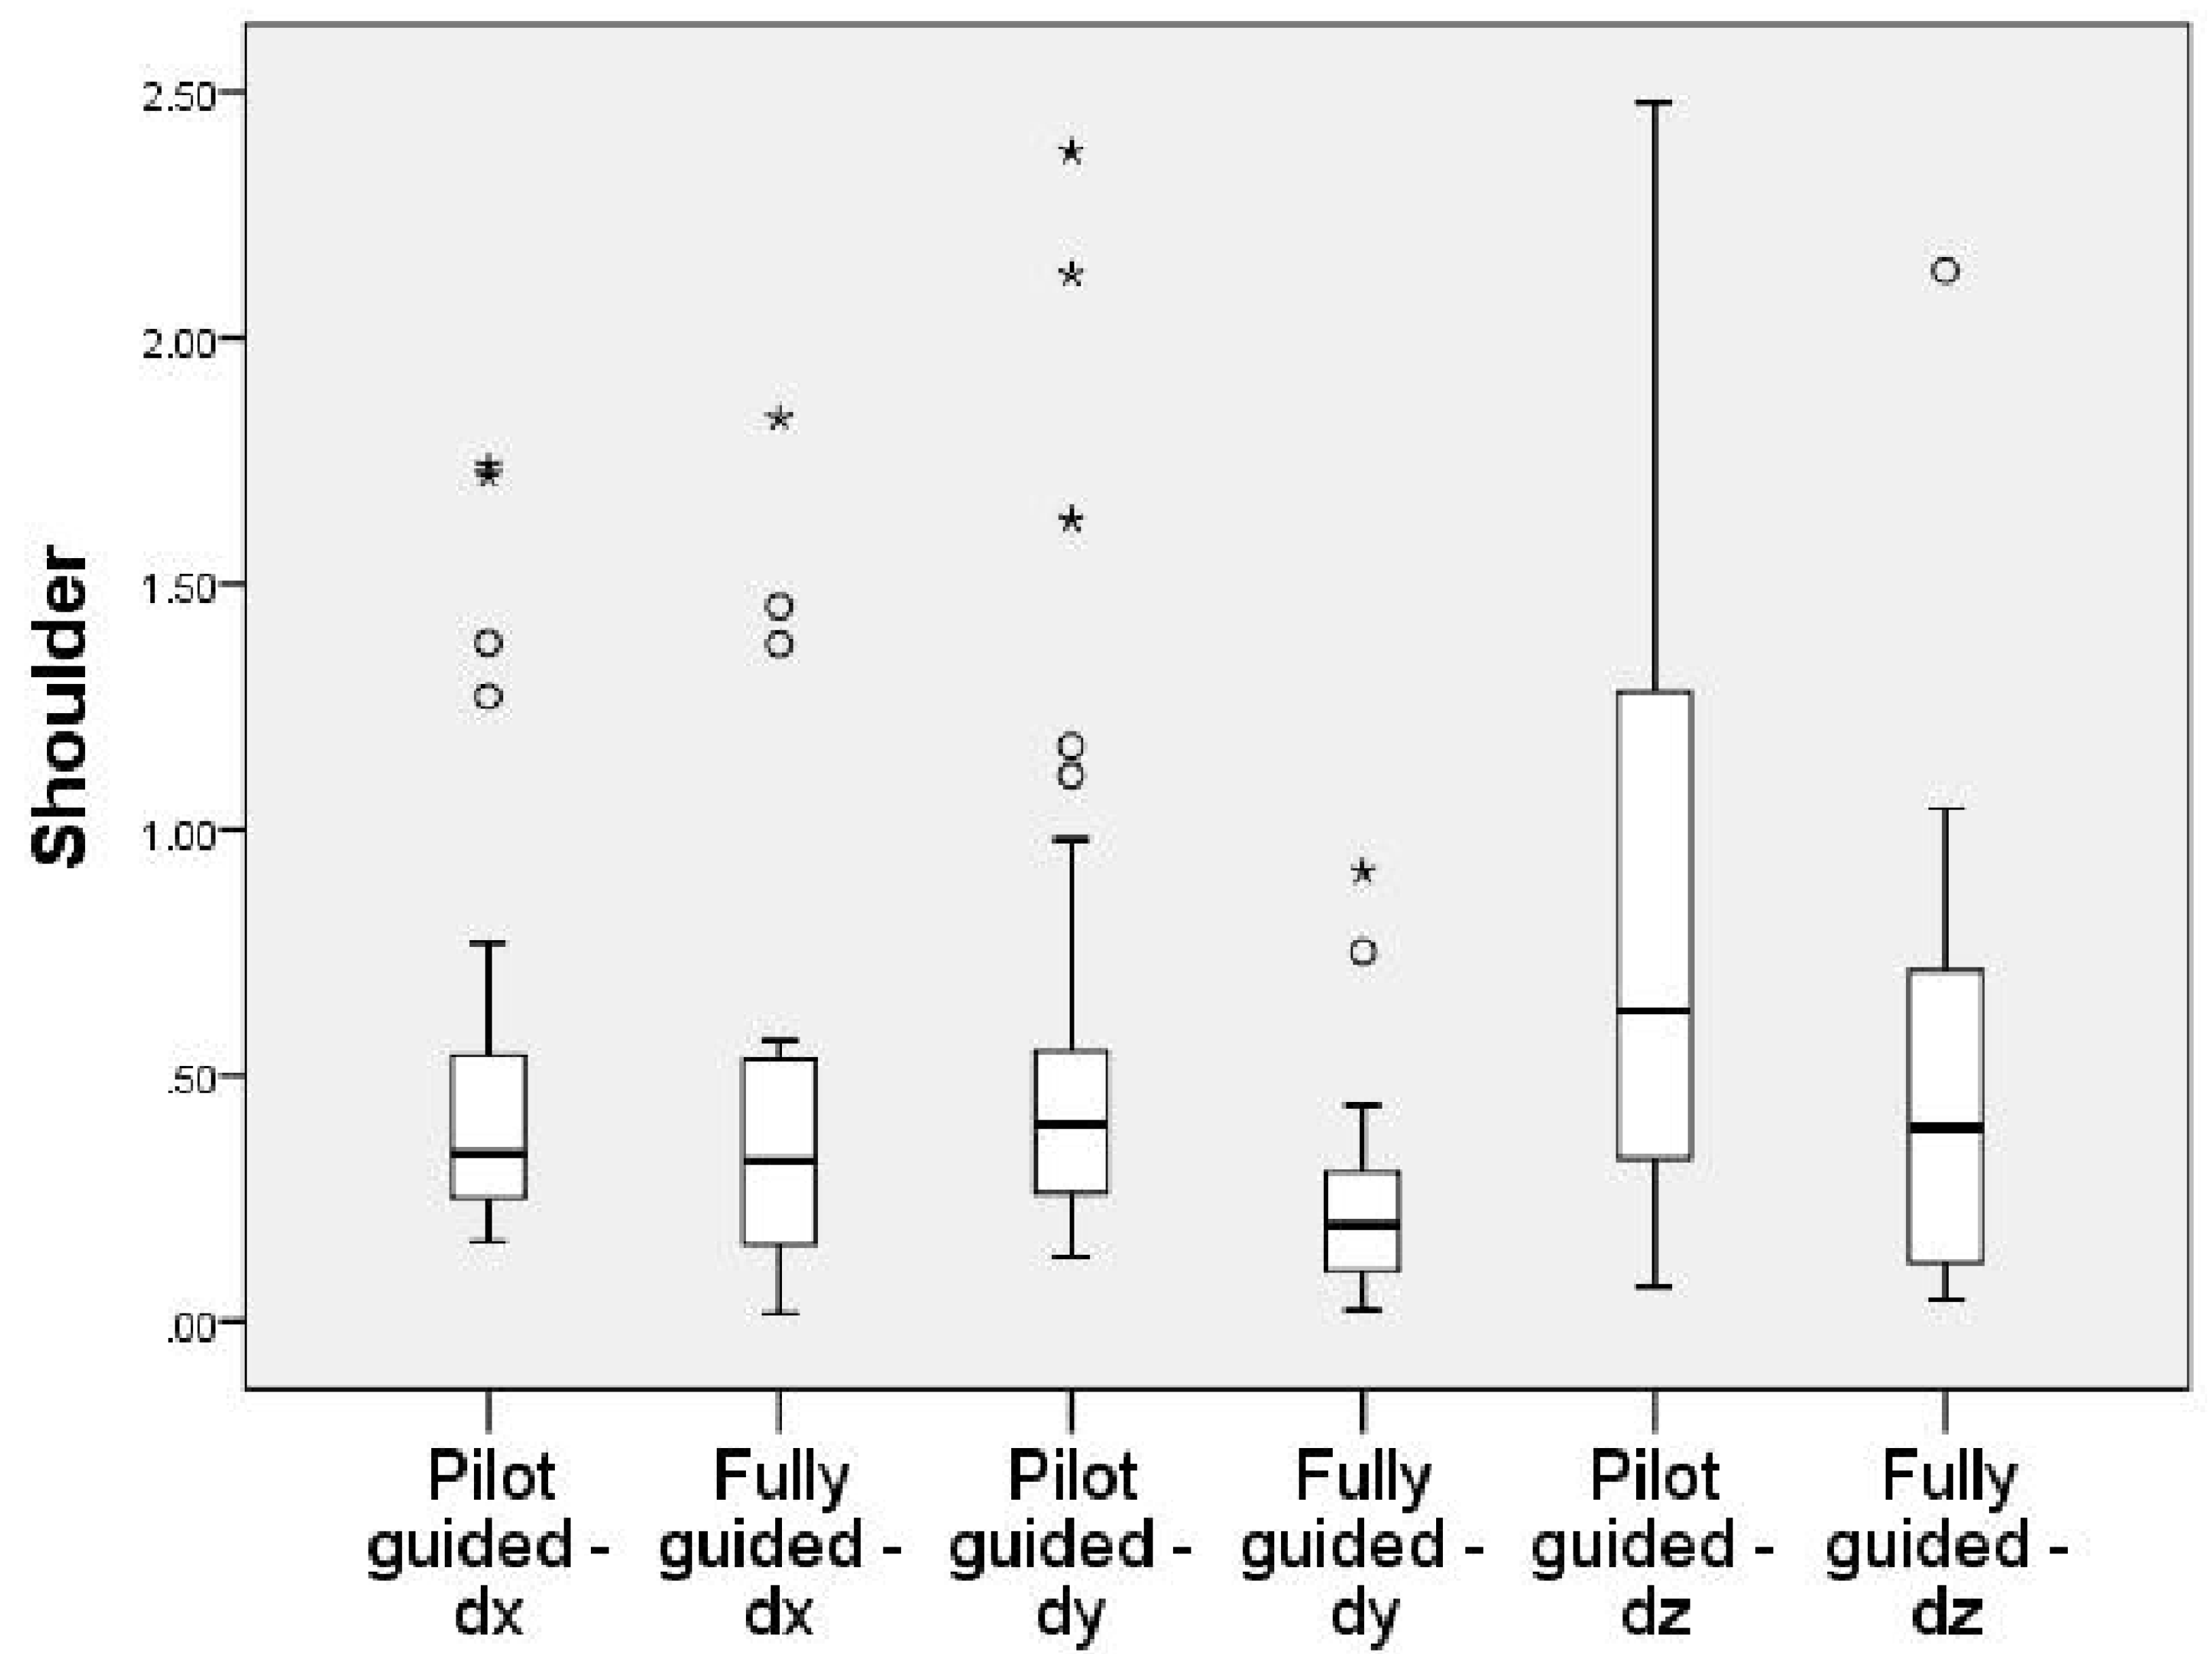
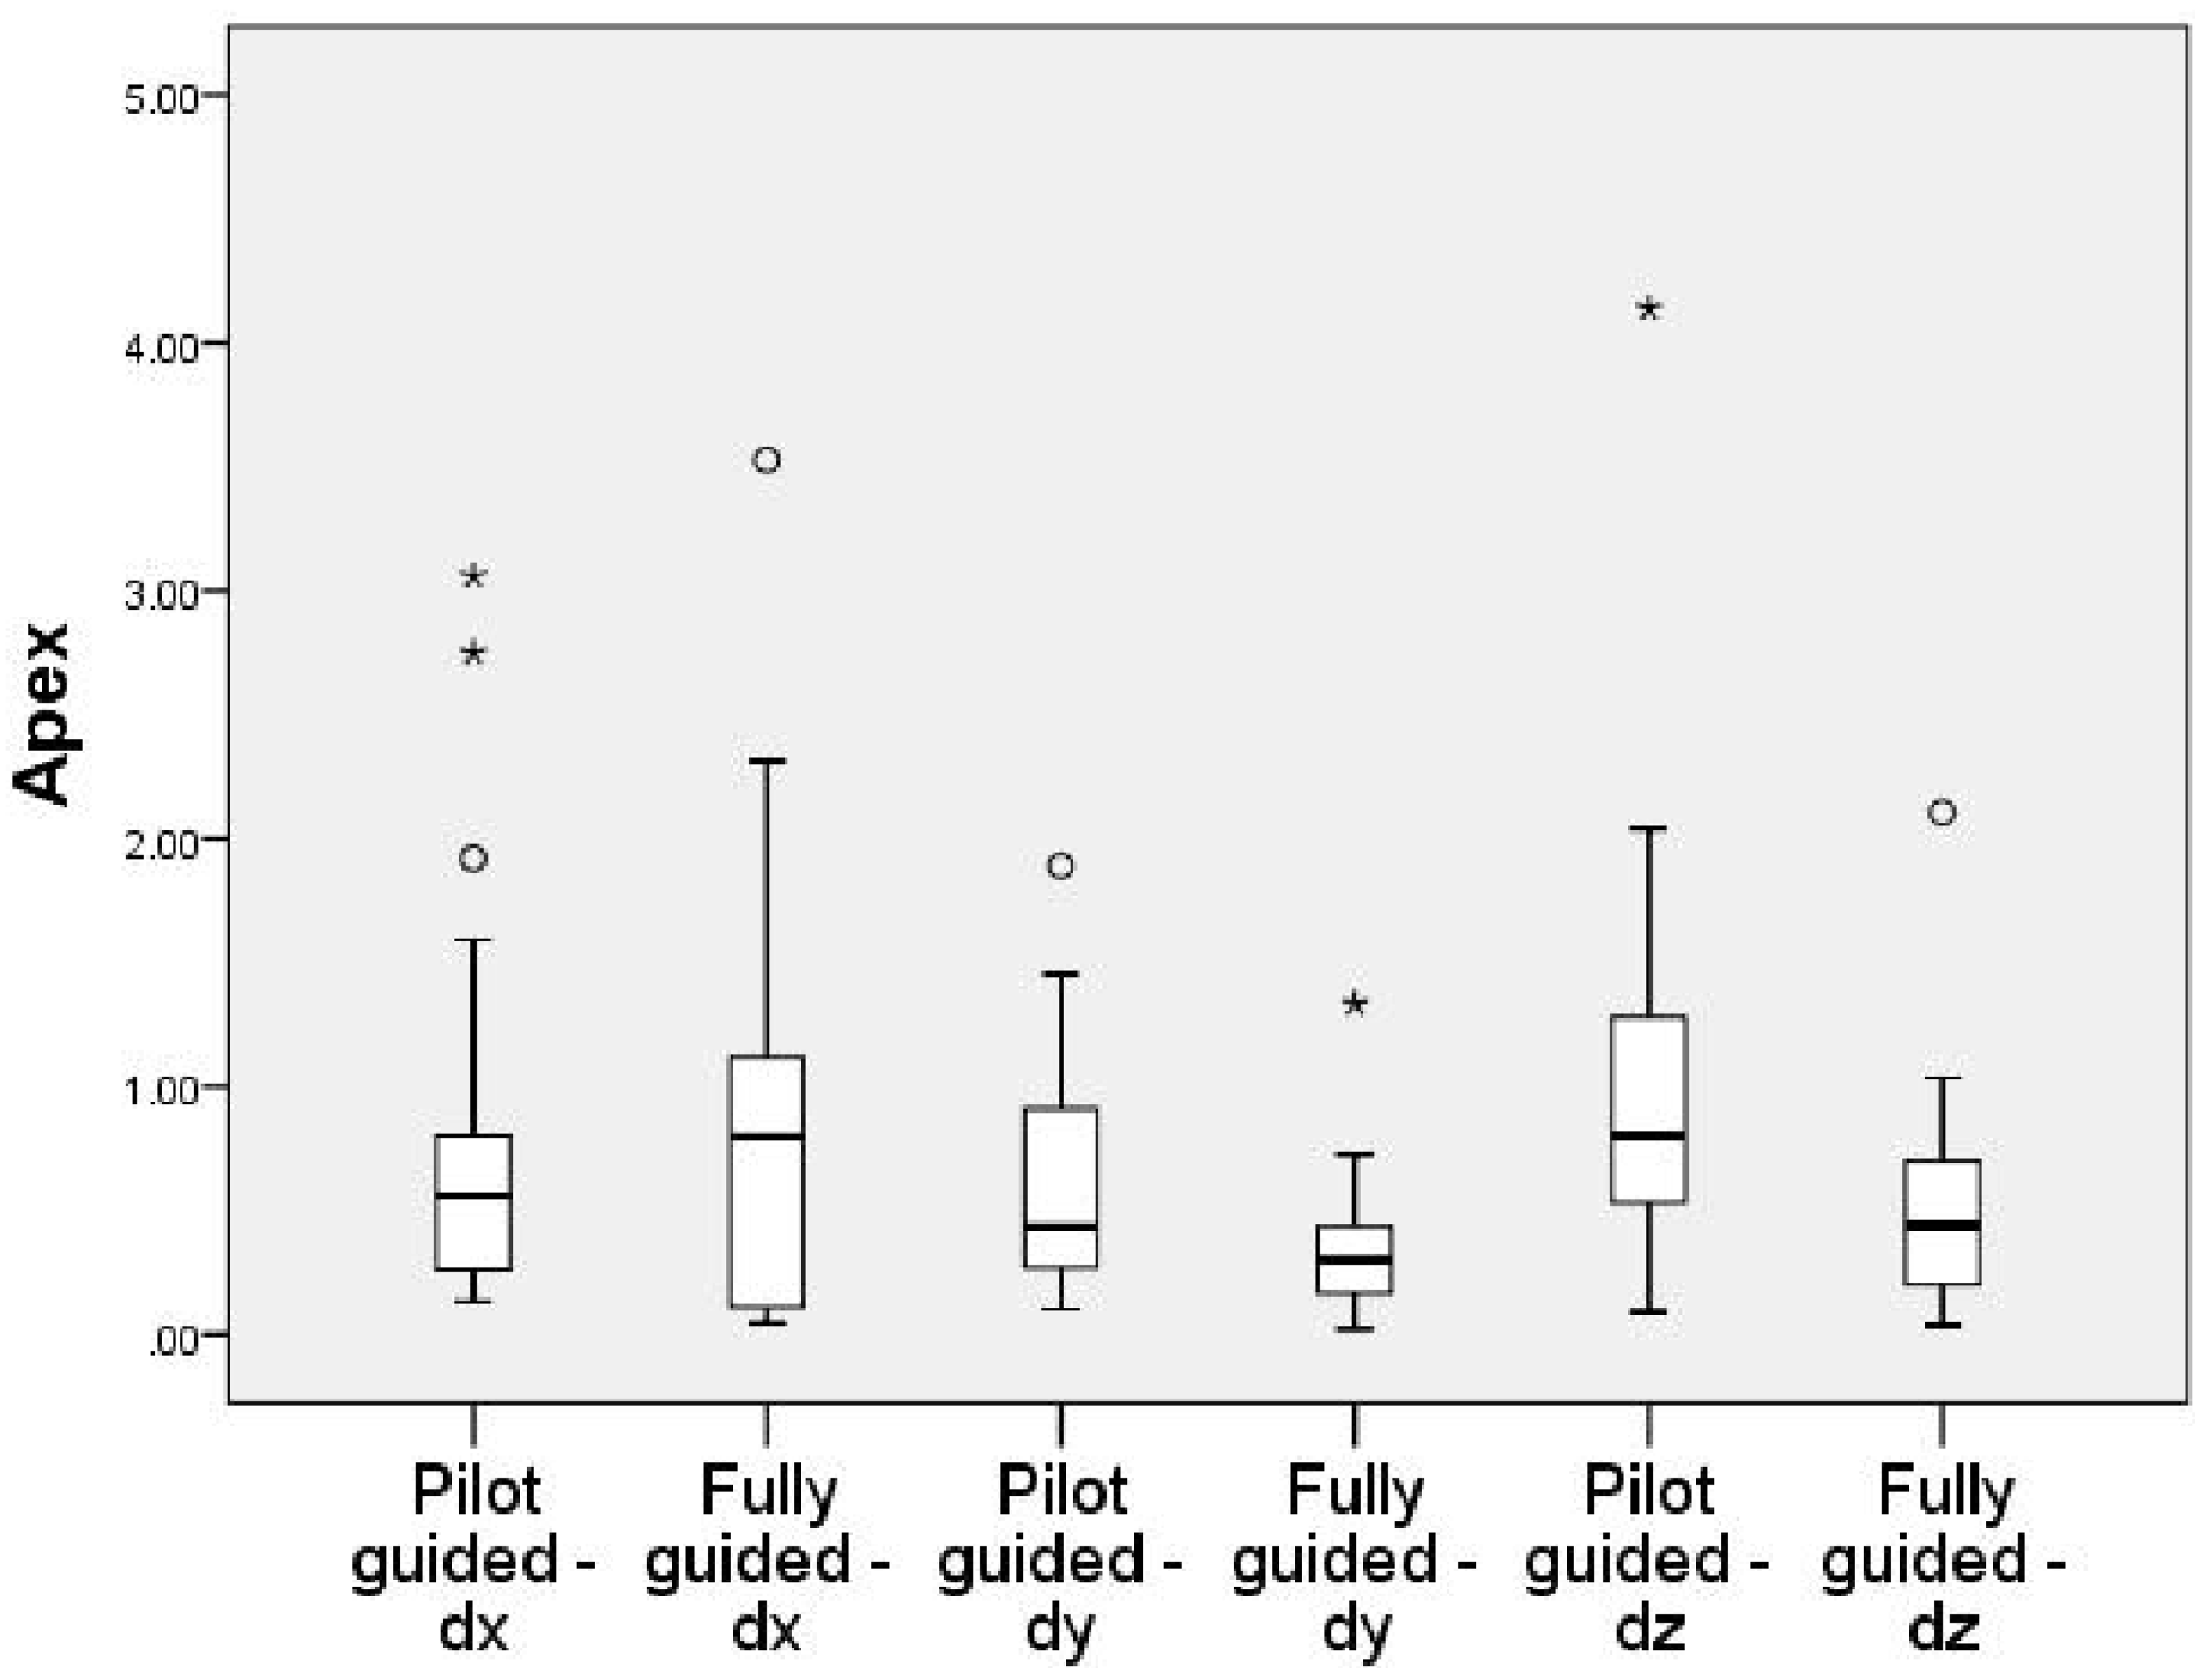
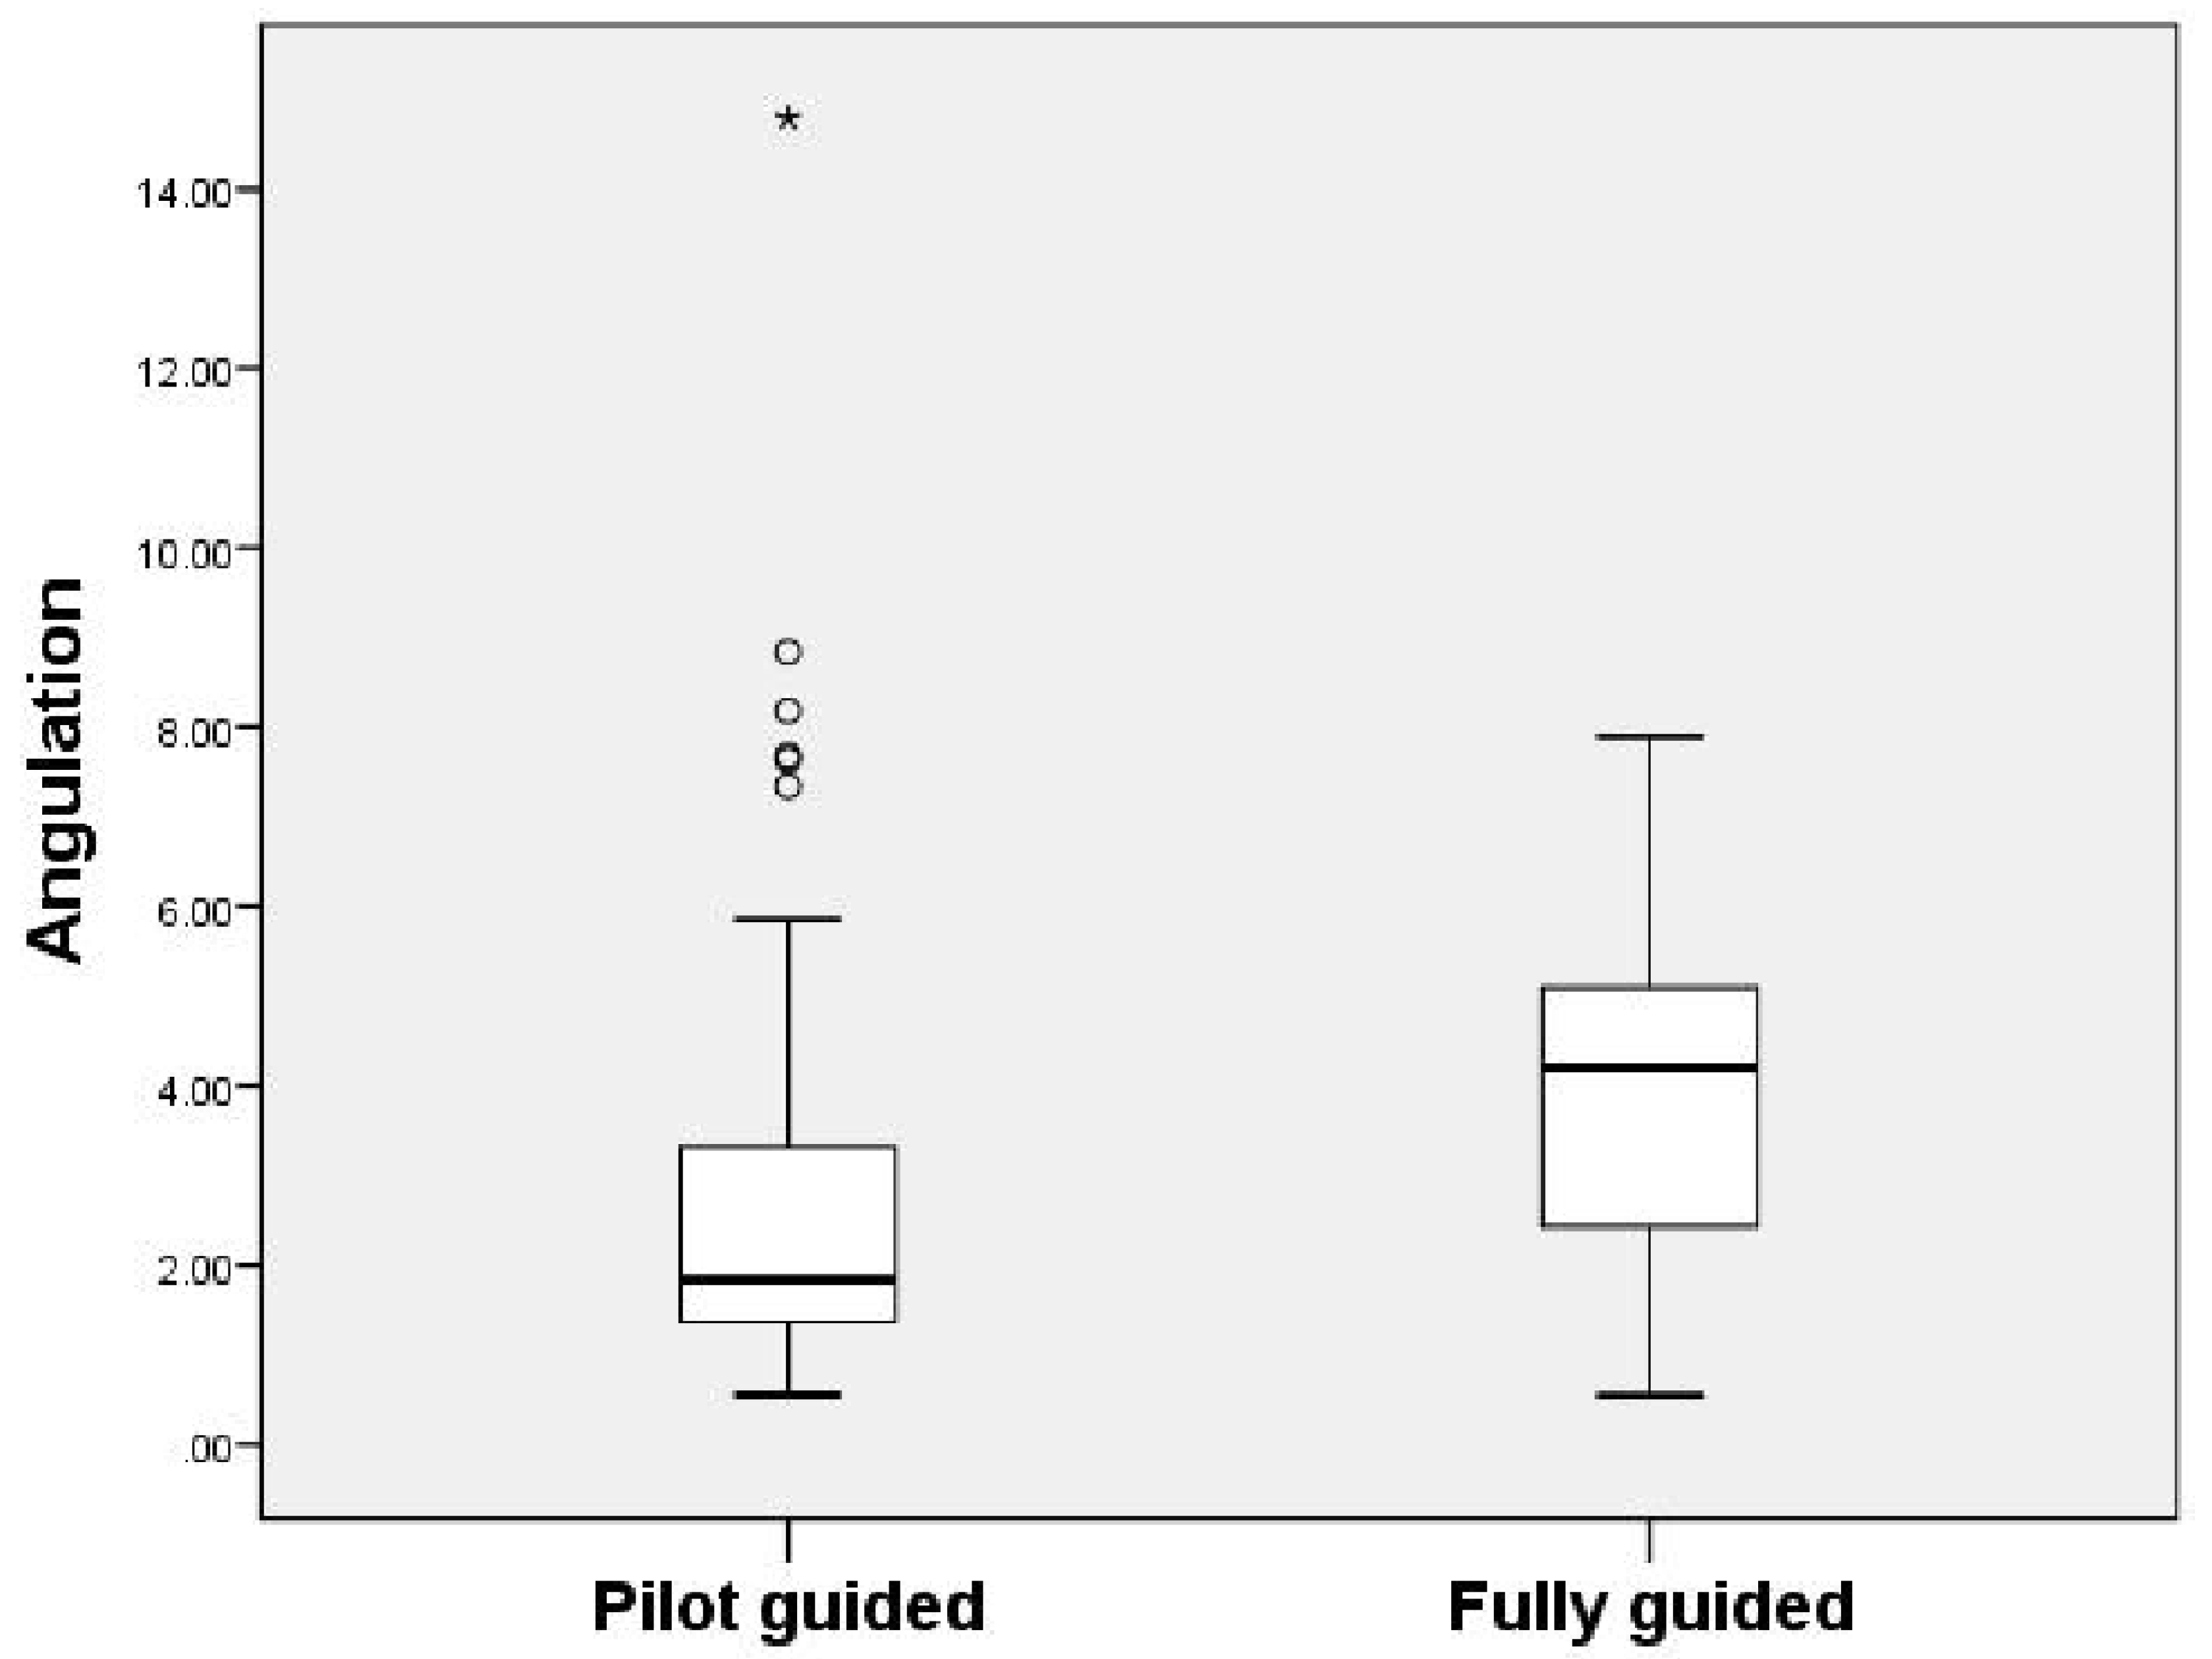
A box plot with 95% confidence interval for each measurement was made (
Figure 7,
Figure 8 and
Figure 9). The implant placement deviation was 1.33 ± 0.75 mm in the shoulder area (
Table 2.) and 1.54 ± 0.87 mm in the apical area (
Table 3) with pilot drill guide surgery. The average bone loss after 1 year was 0.50 + 0.24 mm. (
Table 4.) in the case of fully guide system, the deviation was 0.96 ± 0.57 mm in the shoulder area and 1.38 ± 0.76 mm in the apical area. As a result of measuring the angle deviation of the implants, the pilot-guided was 3.33 ± 3.23, which is more accurate than the fully guided 3.90 ± 1.85. However, it was not statistically significant.
The average bone loss after 1 year was 0.50 + 0.29 mm in the pilot-guided surgery group. In the case of fully guided surgery, average bone loss after 1 year was 0.50 + 0.24 mm. It was not statistically significant (
Table 5).
No significant difference was found between the pilot-guided and fully guided group in comparing the accuracy of the tooth-supported guide in the dental arch and the bone-supported guide in the dentate area. Between the tooth-supported guide and the bone-supported guide, the tooth-supported guide showed more accurate value, but it was not statistically significant (
Table 6.).
Accuracy comparisons for anterior and posterior parts also showed no difference between the experimental and control groups. There was a statistically significant difference between the anterior and posterior parts in the dy values of angulation and shoulder area (
Table 7.).
There was no statistically significant difference between flap and flapless surgery (
Table 8). The mean deviation showed that flap surgery was more accurate in the shoulder area, but flapless surgery has less deviation in the apical area. These differences are not statistically significant.
4. Discussion
Guided surgery using computer has the advantage of shortening the operation time while safely placing the implant in a more accurate position. However, it requires CT image, additional software for surgical planning, additional surgical instruments for guided surgery, and 3D printer for patient specific surgical template. As computer-guided surgery has become popular, many manufacturers have introduced drilling kits for computer-guided implant surgery, and various studies have been conducted on the accuracy of computer-guided implant surgery [
11,
12,
13,
14,
15]. In most studies, computer-guided implant surgery showed higher accuracy than conventional free hand implant surgery or implant surgery using conventional surgical templates [
16,
17].
In the results of this study, the mean distance deviation of pilot-guided implant surgery was similar or slightly higher than that of fully guided implant surgery. However, differences of the distance and angular deviations were not statistically significant. In the shoulder area, only dy(bucco-lingual) of horizontal deviations showed a statistically significant difference between fully guided and pilot-guided. In the apical area, vertical deviations showed a statistically significant difference. But the mean deviations, not the analysis of each direction, did not show a statistically significant difference. The statistically significant difference in vertical deviation is considered to be an error caused by the operator setting the vertical reference point of the alveolar bone in the non-flat alveolar bone area. However, there is no statistically significant difference in the shoulder area. In the measurement of the angular deviation, the value of fully guided was higher. However, this difference was not statistically significant.
The measured errors were slightly higher in the vertical than in the horizontal in both groups. This is because both groups underwent surgery using a surgical template. The errors in the bucco-lingual and mesio-distal directions are less likely to occur. However, vertical error is common in guided surgery because the superior border of alveolar bone determined by CT may be different from the superior border determined by the actual surgery. This error was also measured to an acceptable level in both groups. The measured errors were slightly higher in the apical area than in the shoulder area in both groups. This is considered to be due to the error in the drilling direction added to the positional error in shoulder area.
In case of using tooth-supported guide in dentate state and bone-supported guide in edentulous state, tooth-supported guide was expected to show higher accuracy. However, although the error value was slightly lower in the case of the tooth-supported guide, it was not statistically significant. This is thought to be due to the large proportion of patients recovering from multiple missing teeth. Tooth-supported guide was used in 17 of 20 patients. Three or more consecutive missing teeth were repaired in six patients (three pilot-guided and three fully guided), and the cantilever type tooth-supported guide was used for 11 patients (five guided patients and six fully guided patients) because of the edentulous area in the posterior region. In addition, unlike mucosa-supported guide, the guide used in this study extracted bone surface and used the bone-supported method.
The angulation error of the implant placed in the anterior area was significantly lower than the implant placed in the posterior area, but the distance error was higher than the posterior area. In particular, the error value (dy) of the bucco-lingual position in the shoulder area was significantly higher than that of the posterior region. However, there was no significant difference between the pilot-guided and fully guided cases.
It is thought to have affected the difference of the errors between the anterior and posterior area that is the pilot-guided (ten anterior implants) showed less angulation errors and higher dy errors than the fully guided (four anterior implants) in this study.
Most of the implants in this study were placed using the open flap technique and a small number of implants were placed through the flapless technique. The actual results showed similar deviations. This may be because the flapless technique is mainly used when the number of implants is expected to be sufficient due to the small number of implants placed at the same time. In fact, in this study, we designed a guide using open flap and extracting the surface from bone in the case of Kennedy Class 2 or full edentulous area. It is considered that flap or flapless has no significant effect on the results of this study.
In addition, the difference between the guide design method of the pilot guide and the fully guide, the 3d printing method used, and the post-processing method may also influence the difference. Dalal et al. reported that deviation of 0.04~0.26 mm and ~2° can be shown depending on the printing layer thickness and angulation setting value [
18]. In this study, the guide of pilot-guided surgery was designed by the operator, and the guide of fully guided surgery was designed by the manufacturer and confirmed the planned data. Because of the different 3D printer and post-processing methods used, these differences may have caused errors. Recently, many articles have been published on the accuracy of surgery using 3D printed implant surgical guides. Tahmaseb et al. [
5] compared a total of 24 papers in systematic review of the accuracy of the computer-assisted implant placement protocol and they reported that an average error of 1.12 mm was confirmed at the entry point and an average error of 1.39 mm at the apex. Compared with the results of this study, the pilot-guided error was slightly higher than the above average (1.33 mm, 1.54 mm) and slightly lower for fully guided (0.96 mm, 1.38 mm), but both results were acceptable.
In this study, distance between virtually planned and placed implants was evaluated by superimposition of preoperative planning data and postoperative data. Although it is considered the gold standard method for accuracy measurement, other measurement methods were developed in the literature to avoid additional radiation to the patient, but no available data to prove its superiority over the superimposition gold standard method [
19].
The assessment of bone loss after one year in both the groups showed an average of 0.50 mm bone loss. There is no statistical significance. This is thought to be called a natural result because both the surgical procedure in the same procedure differ only when you are using a surgical template in progress. In 1994 at the 1st European Workshop on Periodontics, the success criteria for implants were based on Brånemark’s study and agreed to bone loss of less than 1.5 mm for the first year after prosthesis placement proposed [
20]. In addition, Lee et al. [
21] reported that at 5 years, the microthreaded coronal aspect implants had 0.61 ± 0.32 mm mean crestal bone loss; the rough-surface implants without microthread, 0.99 ± 0.38 mm; and the machined coronal aspect implants, 1.06 ± 0.39 mm. Jeison et al. [
22] reported that marginal bone loss at 1-year follow-up was 1.06 mm. In this study, mean 0.5 mm marginal bone loss in the first year after surgery is successful, which may be the result of the advantage of guided surgery, which allows minimally invasive, shorter time surgery.
Behneke et al. [
23] found that free hand final drilling, results in significantly less accuracy than full sequence drilling. Compared with the freehand final drilling site preparation, a reduction of maximum deviation of 0.3 and 0.6 mm was achieved with the fully guided technique for the implant shoulder and the apex reference points, respectively. Also, fully guided surgery by Bencharit et al. [
15] showed more accurate and statistically significant results were obtained compared to partially guided surgery. The contradiction between their results and the results reported in the present study might be attributed to the study design, sample size, and type of guide support. The present study investigated tissue-supported guides compared to tooth-supported guides for Behneke et al. The deformation that might occur with tissue-supported guides might have masked the difference between the two groups. The present study was a split mouth design for 74 implants with true allocation and blinding during measurements while Behneke et al. reported retrospective data for only 46 implants with no true randomization and blinding [
23].
In this study, marginal bone loss was measured using CBCT images. However, the method using the CBCT causes image quality degradation due to the metallic portion of the implant. Ritter et al. [
24] compared the accuracy of CBCT, intraoral radiographs, and histologic analysis methods, and there was no significant difference between intraoral radiographs and CBCT in assessing bone resorption of the implant. CBCT images have the advantage of being able to evaluate the bone loss on the lingual side, although post-treatment is necessary to remove the interference, and it is particularly advantageous to identify the bone perforation around the implant [
25]. With regard to the detection threshold for marginal bone loss using periapical radiographs in experimental settings, radiographic assessment using the intraoral paralleling technique seems to be accurate, resulting in a mean difference of 0.18–0.2 mm between the real and the radiographic bone level measurements [
26]. The limited sample size and operator’s bias can be affected as a result of this study. Therefore, further clinical studies are needed to confirm this result by randomized-controlled clinical trials with a larger sample size and evaluate the efficacy of 3D printed provisional prosthesis combined with pilot guide surgery.

