Abstract
The discrete element method (DEM) coupled with computational fluid dynamics (CFD) is used extensively for the numerical simulation of gas-solid fluidized beds. In order to improve the efficiency of this approach, a coarse grain model of the DEM was proposed in the literature. In this model, a group of original particles are treated as a large-sized particle based on the initial particle distribution, and during the whole simulation process the number and components of these particle-groups remain unchanged. However, collisions between particles can lead to frequent crushing and polymerization of particle-groups. This fact has typically been ignored, so the purpose of this paper is to rationalize the coarse grain DEM-CFD model by considering the dynamic particle-group crushing and polymerization. In particular, the effective size of each particle-group is measured by a quantity called equivalent particle-group diameter, whose definition references the equivalent cluster diameter used by the energy-minimization multi-scale (EMMS) model. Then a particle-group crushing criterion is presented based on the mismatch between the equivalent diameter and actual diameter of a particle-group. As to the polymerization of two colliding particle-groups, their velocity difference after collision is chosen as a criterion. Moreover, considering the flow heterogeneity induced by the particle cluster formation, the EMMS drag force model is adopted in this work. Simulations are carried out by using a finite volume method (FVM) with non-staggered grids. For decoupling the Navier-Stokes equations, the semi-implicit method for pressure linked equations revised (SIMPLER) algorithm is used. The simulation results show that the proposed dynamic coarse grain DEM-CFD method has better performance than the original one.
1. Introduction
Inside a gas-solid fluidized bed, particles driven by a gas flow exhibit complex and intriguing flow patterns. The mutual interaction between the discrete particles and continuum gas brings desirable features for many industrial applications, which include rapid heat and mass transfer, good mixing of solids and fast chemical reaction [1,2,3]. Over the past few decades, many attempts have been made to model the complex gas-solid flow behavior in fluidized beds [4,5,6,7].
The discrete element method (DEM) which was first described by Cundall and Strack [8] is one of the most used simulation tools for dense granular flows [9,10]. In the DEM, each particle is tracked individually based on Newton’s second law of motion. The particle-particle and particle-wall interactions are modeled by using springs, dashpots and friction sliders. To be able to model a gas-solid fluidized bed, the DEM is coupled with computational fluid dynamics (CFD) to set up a DEM-CFD model, where the motion of individual solid particles is calculated by DEM and gas flow is described by a local volume averaged continuum approach [11,12,13,14]. In this model, the gas phase gives information for calculating the fluid drag force acting on individual particles, and meanwhile the solid phase gives information for determining the porosity from the coordinates of individual particles. Without DEM, CFD alone can also be used to simulate the gas-solid fluidized beds. The corresponding method is often referred to as direct numerical simulation (DNS). The DNS method has the advantage of high precision but encounters unaffordable computing overhead. By contrast, the DEM provides an efficient way for calculating the contact force between fluid and particles. It uses empirical drag force formulas instead of direct calculations. The computational grid size can be much larger than the particle size. Due to the use of much coarser computational grid compared to DNS, the CFD simulation of fluid phase becomes feasible for the DEM-CFD method.
During the past two decades, the DEM-CFD method has been extensively applied to gas-solid flows [15]. Tsuji et al. [11] first used the DEM-CFD method to predict the complex gas-solid flow behavior inside a two-dimensional fluidized bed, and then they [16,17] extended the method to simulate the flow patterns inside a large-scale bubbling fluidized bed. Van Wachem et al. [18] validated the two-dimensional DEM-CFD simulations of gas-solid fluidized beds by comparing the results with experimental data. They compared three different porosity estimation procedures which transform the results in two dimensions to three dimensions. Khawaja [19] investigated the phenomenon of bubbling by using DEM-CFD simulations with different sizes of particles. The study revealed different types of fluidization regimes as stated in the literature. In another paper, Khawaja [20] studied the phenomenon of minimum fluidization by using DEM-CFD simulations with different sizes of particles. The relationship between the pressure drop across the bed and the fluid superficial velocity was presented. So far, the DEM-CFD method has been deeply developed in simulating the fluidized beds. Many satisfactory results have been reported qualitatively or quantitatively agreeing with experiments [21,22]. The application of the DEM-CFD method has been extended to a large variety of dense gas-solid flow problems such as multiphase flow in dense medium cyclones [23], wood gasification in bubbling fluidized beds [24], char combustion in fluidized beds [25], melting of the granular packed bed [26], simulation of three-phase flows [27], etc. Now the DEM can handle more complex particles, including non-spherical particles [28] and cohesive particles [29].
Although the DEM is well established, the number of the tracked particles is severely restricted by the limited computing power. This is especially critical because applications of the DEM to device scale systems are hardly to be finished in practical time scales. To significantly decrease the number of tracked particles and thus the associated computational cost, a coarse grain model of the DEM was developed by Sakai et al. [30,31]. This coarse grain model treats a group of original particles with similar properties as a large-sized particle, generally termed as a coarse grained particle, a parcel or a particle-group. It allows for simulating of industrial scale systems with acceptable accuracy using practical amounts of computational resources and time. In previous studies, the coarse grain DEM-CFD model was adequately verified in gas-solid flows [30,31,32,33,34,35,36]. In these studies, the flow properties including minimum fluidization velocity, bubble velocity, bed height and bed pressure drop were well predicted by the coarse grain DEM-CFD model. According to increasing the coarse grain ratio, which is defined to be the ratio of particle-group size to original one, the simulation cost and the accuracy are decreasing simultaneously, so the coarse grain ratio should be properly chosen for the coarse grain DEM-CFD model.
Even though the coarse grain DEM-CFD model is verified in many applications, it is imperfect. In this model, the original particles are treated as particle-groups based on the initial particle distribution, and during the whole simulation process the number and components of these particle-groups remain unchanged. However, because of collisions during the real physical process, an original particle may escape from the particle-group which contains it or adhere to the original particles belonging to another particle-group. This fact obviously can lead to frequent crushing and polymerization of particle-groups. But the current coarse grain DEM-CFD model ignores this important physical process. Consequently, its ability for describing the heterogeneity caused by the complex mesoscale structures of gas-solid systems may be not enough. The system is likely to be overly averaged due to the unchangeable statistical averaging done at the beginning of the simulation.
The purpose of this paper is to rationalize the coarse grain DEM-CFD model by considering the dynamic particle-group crushing and polymerization to overcome the unrealistic coarse grain treatment of particles. In particular, the effective size of each particle-group is measured by a quantity called the equivalent particle-group diameter, whose definition references the equivalent cluster diameter used by the energy-minimization multi-scale (EMMS) model [37,38]. Then a particle-group crushing criterion is presented based on the mismatch between the equivalent diameter and actual diameter of a particle-group. As to the polymerization of two colliding particle-groups, their velocity difference after collision is chosen as a criterion. Moreover, particle clusters can be induced by the complex gas-solid flow. Once a particle cluster is formed, the local fluidized behavior will be greatly changed. The flowing gas is more likely to bypass the particle cluster rather than go through it. Therefore, the drag force acting on the particle cluster will be less than the summation of those acting on the individual particles. That is the drag force drop observed in experiments [39]. Considering the flow heterogeneity induced by the particle cluster formation, the EMMS drag force model is used in this work to predict the drag force drop in case of particle clustering. Simulation results show that the proposed dynamic coarse grain DEM-CFD model is more accurate than the previous one.
2. Mathematical Model
2.1. Coarse Grain DEM Model for Solid Phase
In the DEM, the trajectory of particle with mass and volume is tracked based on solving Newton’s equation of transitional motion:
Here is the translational velocity of particle . indicates the gas phase pressure. , and are the drag force, gravitational force and contact force acting on particle , respectively.
2.1.1. Drag Force
For calculating , a proper drag force model should be selected. In the literature, the Gidaspow type drag models [40,41,42] and the EMMS drag models [43,44,45,46,47,48] are most used. Generally, the Gidaspow type drag models neglect any heterogeneities induced by the complex gas-solid flow. They lie on the assumption that in each computational cell homogeneous conditions exist. Research work by Wang and Li [44] has demonstrated that the momentum transfer between solid phase and gas phase is over estimated by the Gidaspow type drag models. They are incapable of describing the drag force drop caused by mesoscale effect. By contrast, the EMMS drag models take the flow heterogeneity induced by the particle cluster formation into account though dividing the gas-solid flow into a dilute phase (gas dominated zone) and a dense phase (particle dominated zone). Because the heterogeneity is considered, the EMMS drag force models can predict the drag force drop in case of particle clustering which has been observed in experiments [39]. For the above reason, the following EMMS drag force model [44] is adopted in this study:
where , and are the void fraction (volume fraction of gas), interphase momentum exchange coefficient and gas velocity associated with particle , respectively. The is given by:
where , , and are the particle diameter, gas density, drag coefficient and heterogeneity index, respectively. The drag coefficient for an isolated particle depends on the particle Reynolds number and is given by:
where is expressed as:
Here, is the viscosity of the fluidizing gas phase. The heterogeneity index depends on both locally transient and globally averaged information of two-phase velocities and void fraction. It may be expressed as:
where , and are parameters associated with the void fraction as listed in Table 1 [49,50].

Table 1.
Parameters a, b and c in the EMMS drag force model.
These parameters are obtained by researchers through comprehensive optimization. They have been shown to have the ability to produce good results over a wide range of applications, although they may not be optimal for many special cases. Because the parameter optimization is not an easy task, the widely applicable parameters given in Table 1 are preferred in this work. Generally, the value of is between 0 and 1. When trends to 1, it represents that the particles are locally homogenously distributed and the corresponding fluidizing state is stable. Whereas if trends to 0, severe particle clustering exists and the system shows strong heterogeneity.
2.1.2. Contact Force
In case of a collision between two particles (treated as soft spheres), the contact force can be evaluated using a linear spring dashpot model, supplemented with a frictional slider [8]. Consider two colliding partners and , the contact force is divided into a normal component and a tangential component :
Here is the normal spring constant (contact stiffness), is the normal overlap between particles and , is the unit normal vector pointing from particle to collision partner , is the normal damping coefficient, is the relative normal velocity of particle and collision partner , is the tangential spring constant, is the tangential overlap between particle and collision partner , is the unit tangential vector evaluated by , is the tangential damping coefficient, is the relative tangential velocity of particle and collision partner , and is the friction coefficient. The relative velocity at the contact point is defined as follows:
where and are the radius and angular velocity of the colliding bodies, respectively. The spring constant depends on the geometry and the elastic properties of the colliding bodies. We have:
for the collisions between particles, and:
for the collisions between particles and solid walls. Here and are respectively the elasticity modulus and the Poisson ratio of the collisions between particles, and and are those of the collisions between particles and solid walls. The equivalent shear modulus of the colliding bodies in Equations (10) and (11) is given by:
The damping coefficient can be obtained by:
where is the effective mass of the contact bodies evaluated by:
for the collisions between particles, and:
for the collisions between particles and solid walls. Now the contact force acting on particle can be expressed as the summation about all the particles and solid walls who collide with particle , i.e.,:
2.1.3. Coarse Graining
The coarse grain DEM model treats a group of original particles with similar properties as a large-sized particle, generally termed as a coarse grained particle, a parcel or a particle-group.
As illustrated in Figure 1 [30], it assumes that all the original particles are spheres with the small diameter, and the size of each particle-group is times larger than the original particle. Here is called as coarse grain ratio. The sphericities of both original particle and coarse grained particle are considered as 1. According to the Newton’s second law of motion, it is reasonable to assume that the translational motion of the particle-group is the average of that of the original particles governed by:
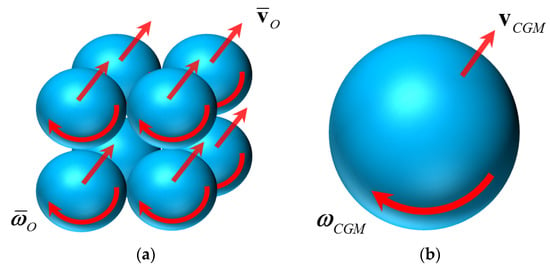
Figure 1.
Illustration of the coarse graining process (coarse grain ratio ). (a) Original particles; (b) Coarse grain particle (particle-group).
The subscript CGM refers to the coarse grain model. Under the assumption that the total kinetic energy of the particle-group is consistent with that of the original particles, we have:
where is the moment of inertia. The bar over the variables and the subscript refer to average and original particle, respectively. According Equations (17) and (18), the following formulas hold:
where is the gravitational acceleration.
2.2. CFD Model for Gas Phase
In a gas-solid fluidized beds, it is difficult to directly calculate the mutual interaction between the continuum gas and discrete particles. An alternative way to solve this problem is the local volume average technique which has been widely used in the continuum approach of modelling fluidization process [42]. According to this volume average technique, the governing equations of the gas phase are the fluid continuity and Navier-Stokes equations expressed in terms of the local mean variables over the computational cell:
where , , , and have the same meaning as mentioned above. and are the volumetric gas-particle interaction force and viscous stress tensor, respectively. According to Newton’s third law of motion, the value of at a given CFD computational cell is defined as the volume average of the drag forces acting on all the particles located in this cell:
where and are the volume of the computational cell and the number of particles located in this cell, respectively. The viscous stress tensor is given by:
By definition, the void fraction in a computational cell is the ratio of the void volume (gas volume) to the volume of the cell. If is the volume of particle inside a computational cell, then the void fraction in this cell is:
The void fraction and gas velocity at the center of mass of particle can be calculated by interpolation from the flow variables stored at the grid nodes. As illustrated in Figure 2, particle divides the cell, which it belongs to, into four parts. Each part has the area . If the void fraction and gas velocity valued at the four vertexes of this cell are and , then and can be given by:
in the two-dimensional cases.
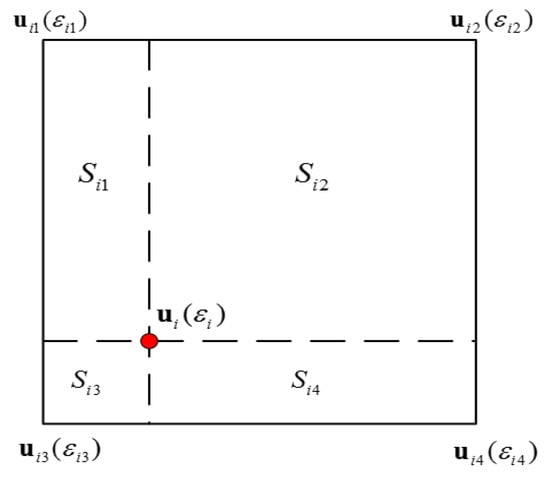
Figure 2.
Illustration of the interpolation from gas to particles (two dimensional cases).
2.3. Particle-Group Crushing and Polymerization Model
Because of the complex particle-particle and gas-particle interactions inside a gas-solid fluidized beds, the particle-groups of the coarse grain DEM-CFD model can hardly to maintain their initial configurations during the whole simulation process. Frequent crushing and polymerization of the particle-groups should be taken into consideration. However, the current coarse grain DEM-CFD model ignores this important physical process. Consequently, its ability for describing the heterogeneity caused by the complex mesoscale structures of gas-solid systems may be not enough. The system is likely to be overly averaged due to the unchangeable statistical averaging done at the beginning of the simulation. In order to rationalize the coarse grain DEM-CFD model by overcoming the unrealistic coarse grain treatment of particles, a dynamic particle-group crushing and polymerization model is present in this section.
For capturing the crushing of a particle-group, the effective size of each particle-group should be measured. Following the definition of the equivalent cluster diameter used by the EMMS model [37,38], we use to represent the equivalent diameter of a particle-group. In a gas-solid fluidized bed, is generally inversely proportional to the energy input from the gas :
where is a coefficient to be determined and equals to the difference between the total energy input and the energy input for the state of generalized minimum fluidization :
For the EMMS model, the energy consumption is divided into three parts [38]. That is:
where the subscripts , and refer to the dense phase, dilute phase and inter phase, respectively. , , , and are the particle density, estimated particle number of each phase, drag force acting on single particle or cluster in suspension, volume fraction of dense phase and apparent gas velocity, respectively. Since the drag force and apparent gas velocity have the same direction, only their norms are considered in Equation (34). At the state of generalized minimum fluidization, the energy input can be calculated by:
where , , and are the minimum fluidization velocity, apparent particle velocity, void fraction at the minimum fluidization and gravitational constant, respectively. According to the relationship at the limiting condition , the coefficient is determined by:
For the DEM model, because the motion of each particle can be directly tracked, there is no need to divide the system into dense, dilute and inter phases. The number of particles in any local area can be exactly calculated. Therefore, the expression of for a single particle-group may be simplified as:
where is the number of original particles inside the particle-group . Note that Equation (32) only takes the influence of the external gas on the equivalent diameter of a particle-group into consideration. In fact, the mutual interactions between particle-groups also have considerable influence on the equivalent diameter of a particle-group. For this reason, the energy input from other particle-groups is considered in our coarse grain DEM-CFD model. In this situation, we have:
where , and are the contact force exerted by particle-group to particle-group , relative velocity of particle-groups and , mass of particle-group and number of particle-groups colliding with particle-group . Finally, the equivalent particle-group diameter for the coarse grain DEM-CFD model can be given by:
From Equations (35)–(39), if is given, then can be calculated. The analysis of Matsen [51] indicated that all the particles would be completely dispersed in gas-solid fluidized beds at a critical void fraction 0.9997. So it is reasonable to set as this critical value 0.9997.
Now, a particle-group crushing criterion can be presented based on the mismatch between the equivalent diameter and actual diameter of a particle-group . Specifically, if:
holds, then particle-group will break into several child particle-groups. The number of the child particle-groups is determined by:
where refers to the operation of rounded down. For simplicity, it assumes that there are child particle-groups having the same diameter and mass , and the child particle-group consisted by the remainder mass has the following mass and diameter:
The velocity of the child particle-groups is inherited from their parent particle-group . Then, as to the polymerization of two colliding particle-groups, their velocity difference after collision is chosen as a criterion. Considering the collision between particle-groups and , if their velocities after collision have the following relationship:
then the two particle-groups are regarded as aggregated. After polymerization, the mass and diameter of the new particle-group are given by:
The velocity of the new particle-group is set as either or .
3. Numerical Method
For two dimensional cases, the CFD model for gas phase has the following component form:
where the subscripts and refers to the components in and directions, respectively. The finite volume method (FVM) with non-staggered grids is used to discretize Equation (47). Figure 3 illustrates the control volume for a grid node . By using this control volume, the discrete forms of Equations (47b) and (47c) at the grid node can be uniformly written as:
where the components of the source term are given by
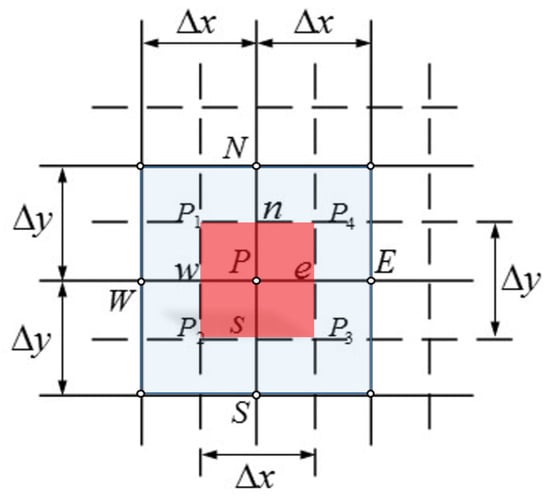
Figure 3.
Control volume for a grid point on the non-staggered grids. The dash lines in the figure divide the calculation region into sub-regions, and each sub-region is a control volume. For example, the control volume for the grid point is the red region. The intersection points of the solid lines determine the center points of the control volumes, which are the grid nodes.
Here and are the gas velocities at the previous time step. The coefficients are:
for the upwind scheme and
for the central scheme.
Note that the momentum Equation (48) can be solved only when the pressure field is given or is somehow estimated. The semi-implicit method for pressure linked equations revised (SIMPLER) is used for solving the pressure and thus the velocity. In order to derive an equation for pressure, the continuity Equation (47a) at the grid node is discretized as:
by using the FVM under the assumption that the void fraction maintains constant within a time step . To avoid the problem of volume locking on non-staggered grids, the pressure is removed from Equation (48) to obtain a pseudo velocity :
where:
It can be noted that is composed of the neighbor velocities and contains no pressure. In turn, the gas velocity at the interface of the control volume can be written as:
By inserting Equation (53) into Equation (50), we get:
Now if a guessed velocity is given, the pseudo velocity can be calculated from Equation (51) and hence a guessed pressure can be solved from Equation (54). By employing , a velocity can be solved from Equation (48). Because the pressure is not correct in general, the resulting velocity will not satisfy the continuity equation. Such an imperfect velocity field based on the guessed pressure is denoted by . Suppose the correct pressure is , where is called the pressure correction. Next, the corresponding velocity correction can be introduced in a similar manner . At this point, the velocity at the interface of the control volume, taking for example, can be expressed as:
By inserting the interfacial velocities in form of Equation (55) into the discrete continuity Equation (50), we obtain an equation for :
Now the numerical method for solving the CFD model for gas phase can be summarized as follows:
- (1)
- Calculate the pseudo velocity from Equation (51) by substituting the initial velocity .
- (2)
- Solve Equation (54) to obtain the pressure .
- (3)
- Employing the pressure , solve Equation (48) to obtain the velocity .
- (4)
- Solve Equation (56) to obtain .
- (5)
- Correct the velocity to get by use of equations in form of Equation (55).
- (6)
- Return to step 1 and repeat until convergence.
- (7)
- After convergence, calculate the pressure .
Finally, the flow chart for the whole coarse grain DEM-CFD method with considering the particle-group crushing and polymerization is shown in Figure 4.
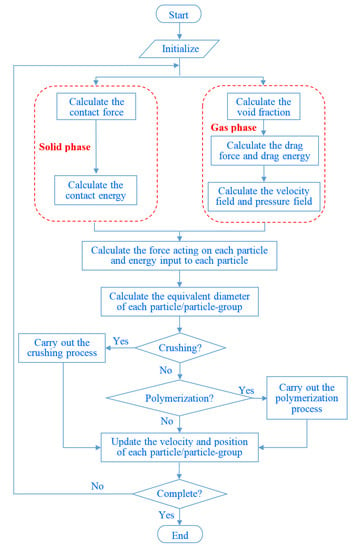
Figure 4.
Flow chart for the coarse grain DEM-CFD method with considering the particle-group crushing and polymerization.
4. Simulation Results
Two simulation cases are performed to test the dynamic coarse grain DEM-CFD method. In the first simulation case, a two-dimensional fluidized bed with 90 mm width and 500 mm height is considered. The geometry is discretized as 18 × 100 cells by setting the grid size to be 5 mm. Gas is injected from the base, where the superficial velocity is set to be 0.9 m/s. The number of solid particles is 4080. All the particles have equal size and are assumed to be spheres with sphericity equal to 1. The physical properties of the particles and gas are illustrated in Table 2. The time step size used in the simulations is 0.05 ms. Because the simulation conditions are very similar with those adopted in the experiments made by Van Wachem et al. [18], we can compare our simulation results with the experimental ones.

Table 2.
Physical properties for the first simulation case.
Before we start the simulations, some comparative studies are made to demonstrate that the EMMS drag force model fits our need. Both the EMMS drag force model and the famous Wen and Yu drag force model are used to the present simulation case. The original DEM-CFD method is used to generate simulation results. Both qualitative and quantitative comparisons show that the EMMS results are more consistent with the experimental ones. These facts as well as the research work done by many other researchers give us the reason to believe that the EMMS drag force model fits our need.
Although the particle-group crushing and polymerization model is proposed for particle-groups, we are still curious whether the simulation results will be improved if it is applied to original particles. For this purpose, we first directly use our dynamic coarse grain DEM-CFD method to the original particles under the assumption that the particles are divisible. In this case, each particle is treated as a particle-group. Figure 5 shows the results obtained by the current method together with those obtained by experiments and traditional coarse grain DEM-CFD method. For facilitating the comparisons, we call our dynamic coarse grain DEM-CFD method involving the particle-group crushing and polymerization model as PCPM and the traditional coarse grain DEM-CFD method as TM for short. The results show that the particles are in the fluidized state. Bubbles are generated periodically at the bottom of the bed and gradually rise and swell. The bubble nose is getting thinner and thinner. When the maximum bed height is reached, the top particles begin to fall back and the bubbles eventually disappear. No particles can flee from the computational domain. They will bounce when they collide with the wall. The particle-wall interactions are modeled by using springs, dashpots and friction sliders as introduced in Section 2. This consideration prevents the particles from going through the solid wall. On the other hand, if the gas velocity is too high, the particles may escape from the outlet of the fluidized bed. But for the simulation cases we considered, the gas velocity is moderate and the gravitational force prevents the particles escape from the outlet. By comparison, the results obtained by the PCPM are more consistent with the experimental results than those obtained by TM. That is the PCPM has the ability to improve the simulation results of the original DEM-CFD method (TM with a coarse grain ratio equal to 1). The transverse and longitudinal sizes and positions of the large bubbles predicted by the PCPM are much closer to the experimental results. Therefore, it appears that the PCPM can simulate the macroscopic flow properties of the fluidized bed. The particles at the top layer have a longer suspension time, which indicates that the particles at the top of the bed are crushing and separated, thus reducing the drag force required for suspension of these particles. These results indicate that the PCPM can better capture the phenomena of bubbles popping out of the bed and particle-group crushing than the TM.
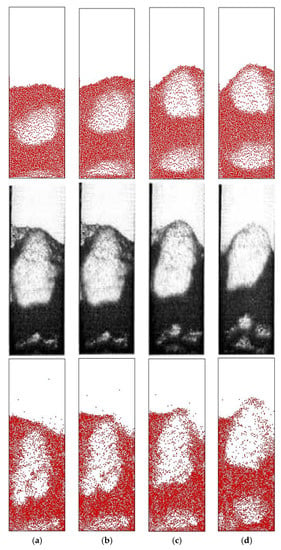
Figure 5.
Snapshots of particle distribution in a two dimensional fluidized bed. Upper: simulation results obtained by the traditional coarse grain DEM-CFD method. Middle: experimental results given by Van Wachem et al. [18] (reused with permission from Elsevier). Bottom: simulation results obtained by the current dynamic coarse grain DEM-CFD method. (a) 0.16 s. (b) 0.20 s. (c) 0.24 s. (d) 0.28 s.
The above is just an apparently qualitative comparison. We now compare the simulation results of the two methods and the experimental results quantitatively. Figure 6 shows the pressure drop at the 45 mm horizontal section above the fluidized bed distributor. It can be seen that both the PCPM and TM predicted the periodic fluctuation of the pressure. However, in terms of amplitude, the result of PCPM is closer to the experimental result. The result of TM shows rather flat pressure valleys which indicates a long duration of low pressure, while the PCPM improves this low pressure effect.
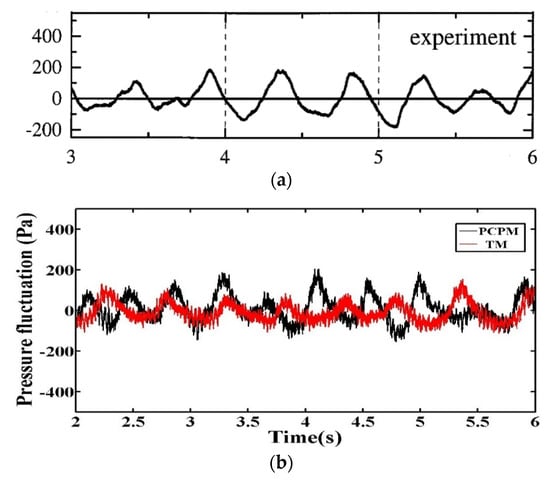
Figure 6.
Pressure drop at the 45 mm horizontal section above the fluidized bed distributor. (a) experimental result given by Van Wachem et al. [18] (reused with permission from Elsevier); (b) simulation results.
Figure 7 shows the change of bed height over observation time. The bed height predicted by the PCPM is slightly higher than that of the TM, as shown in this figure. This phenomenon is mainly caused by the consideration of particle-group crushing. That is, when the bubbles move to the top of the bed during the bed moving, the particles in the top layer will be blown higher due to the reduction of their sizes caused by particle-group crushing. Although there are some differences between the two simulation results and experimental result, both the simulations are acceptable. The dynamic variations of the total particle number and particle-group crushing amount during the simulation of PCPM are shown in Figure 8 and Figure 9. These results indicate that the collisions between particles cause violent crushing and polymerization of particle-groups during the simulation, and thus the total particle number presents a dynamic fluctuation.
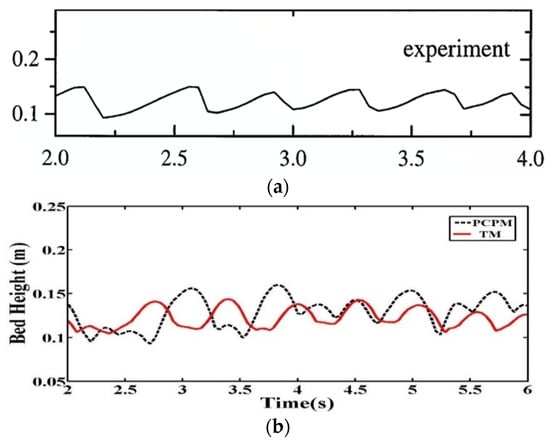
Figure 7.
The change of bed height over observation time. (a) experimental result given by Van Wachem et al. [18] (reused with permission from Elsevier); (b) simulation results.
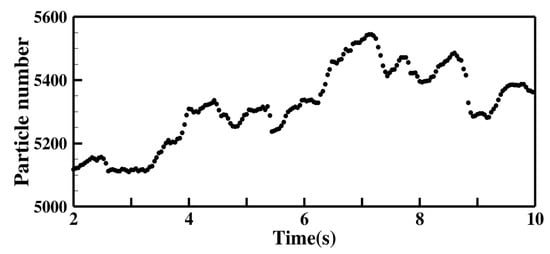
Figure 8.
The change of the total particle number during the simulation of PCPM.
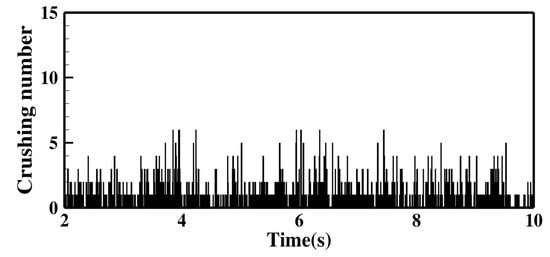
Figure 9.
Particle-group crushing amount at different time instants during the simulation of PCPM.
Next, we redo the above simulations at a coarse grain ratio . The particle-group distribution predicted by the PCPM and TM are shown in Figure 10. The results of both PCPM and TM show a qualitative agreement with the experimental results about the distribution of the particles. Hence, the macroscopic flow properties of the fluidized bed obtained from the coarse grain models can be regarded to be equivalent to the original particle system to some extent. Still, there are several differences between the results of the two methods. First, the particle distribution predicted by the TM is relatively homogeneous, while that predicted by the PCPM shows strong aggregations. Second, the top layer of the bed predicted by the TM changes mildly when the particles rise. By contrast, the PCPM can capture the drastic movement of the top layer particles when the bubbles come out of the bed. Finally, the PCPM is capable of showing the presence of multiple bubbles in the bed compared to the TM. These results indicate that the PCPM is better that the TM in describing the heterogeneity of the particle distribution in the fluidized bed. Moreover, as shown in Figure 11, the crushing and polymerization of particle-groups in PCPM make the pressure fluctuation more violent. This property alleviates the problem of too flat pressure drop predicted by the TM.
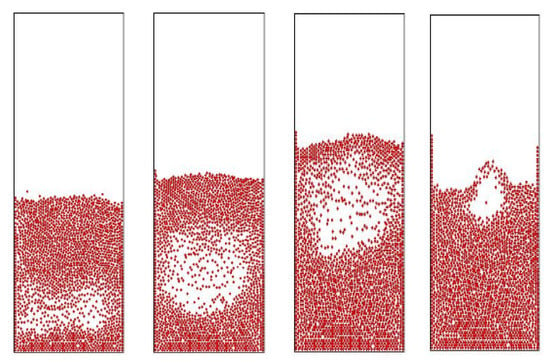
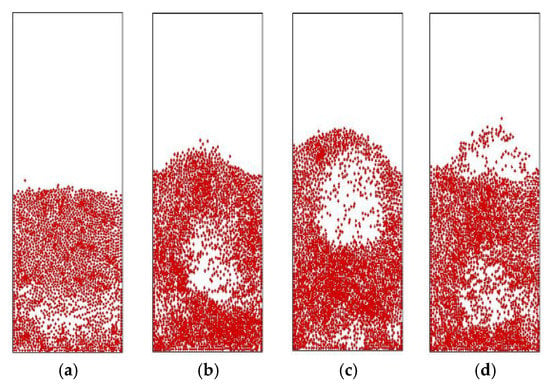
Figure 10.
Simulated snapshots of particle distribution with a coarse grain ratio . Upper: simulation results obtained by the traditional coarse grain DEM-CFD method (TM). Bottom: simulation results obtained by the current dynamic coarse grain DEM-CFD method (PCPM). (a) 0.36 s. (b) 0.40 s. (c) 0.44 s. (d) 0.48 s.
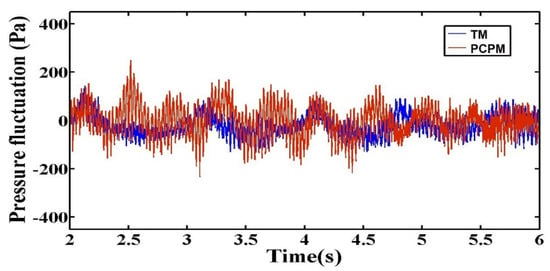
Figure 11.
Pressure drop at the 45 mm horizontal section above the fluidized bed distributor simulated with a coarse grain ratio .
For further validating the performance of PCPM, we increase the initial particle number to 9600 and adjust the superficial gas velocity to 1.9 m/s accordingly. Figure 12 shows the evolution of particle distribution at the very early stage. As can be seen, the system exhibits more complex fluidization phenomenon when the number of particles is increased. Influenced by the wake vortexes of the large bubble in the middle region of the bed, airflow escapes from the small bubbles below to the large bubble. At the same time, the particles aggregating at the top of the small bubbles are collapsing. This process causes the disappearance of small bubbles and the growth of large bubble. Because of the thick layer of aggregated particles at the top of the bed, the large bubble cannot pass through the bed quickly. Squeezed by the top layer particles, the bubble almost transforms into rectangular in shape and becomes large enough to completely fill the cross-section of the bed. Until 1.68 s, cracks appear in the top layer of the bed and the gas trapped in the large bubble escapes quickly.
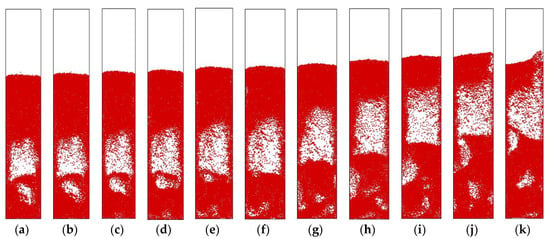
Figure 12.
Snapshots of particle distribution obtained by the PCPM for a two dimensional fluidized bed at the very early stage: the phenomenon of bubble merging along the vertical direction and rectangular bubble formation. (a) 1.00 s. (b) 1.04 s. (c) 1.08 s. (d) 1.12 s. (e) 1.16 s. (f) 1.20 s. (g) 1.32 s. (h) 1.44 s. (i) 1.56 s. (j) 1.68 s. (k) 1.80 s.
Figure 13 shows the evolution of particle distribution at the later stage. The phenomenon of bubble merging along the transverse direction can be observed from these figures. In this process, the bubbles on the left and right sides near the walls grow rapidly due to the vertical bubble merging. Soon two slender bubbles are formed on the left and right sides. The particle groups between the two bubbles gradually thin and disappear under the influence of air flow on both sides, and finally the two bubbles merge horizontally. In the case shown in the figures, since the two bubbles have reached the top layer of the bed by the time they finally merge, so the complete merging morphology is not seen. These results reflect the complexity of the fluidization pattern change in dense particle flow systems. It suggests that the heterogeneous mesoscale structures have great influence on gas-solid flows. In addition to the traditional spherical bubbles, there are also bubbles with complex structures, which will play a leading role in the dynamic behavior of the whole bed.
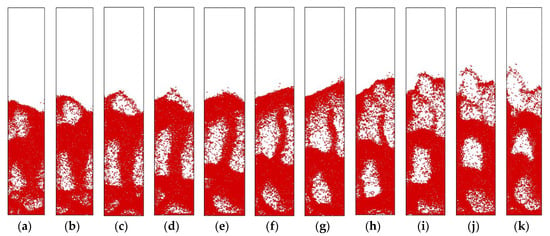
Figure 13.
Snapshots of particle distribution obtained by the PCPM for a two dimensional fluidized bed at the later stage: the phenomenon of bubble merging along the transverse direction. (a) 7.72 s. (b) 7.80 s. (c) 7.88 s. (d) 7.96 s. (e) 8.02 s. (f) 8.10 s. (g) 8.18 s. (h) 8.26 s. (i) 8.32 s. (j) 8.40 s. (k) 8.48 s.
At last, Figure 14 shows some results obtained at coarse grain ratios and . As can be seen, in the initial stage of simulation (), the bed experienced uniform expansion under the effect of gas velocity. The bed morphology simulated by the coarse grain system with is relatively close to that of the original system. However, when the coarse grain ratio increases to , the bed shows a morphology between the scattered bed and the bubbling bed. Although the bubbles generated are very small, the whole bed is still in a fluidized state. In the middle stage of simulation (), the system with coarse grain ratio can still keep a similar state to the original system, while the result of is seriously distorted. Accordingly, the coarse grain ratio of the simulation system needs to be carefully selected. Excessive coarse grain will make the coarse grain system severely deviate from the original system, and proper coarse grain will greatly reduce the simulation time. For the current simulation, when the coarse grain ratio is , the simulation time of the coarse grain system is about 10% of the original system.
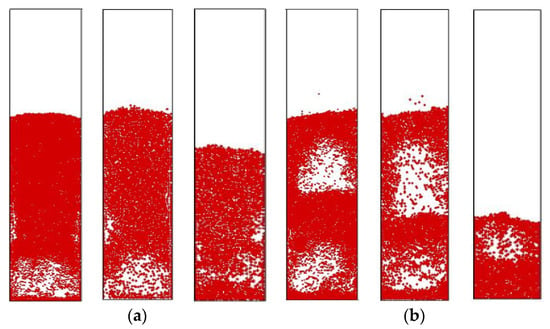
Figure 14.
Snapshots of particle distribution obtained by the PCPM at different coarse grain ratio. (a) ; (b) . (a) l = 1, l = 2, l = 3. (b) l = 1, l = 2, l = 3.
5. Conclusions
In this work, a dynamic coarse grain DEM-CFD method for gas-solid fluidized beds is presented by considering the particle-group crushing and polymerization. Compared with the original coarse grain DEM-CFD method, the coarse graining system is updated at every simulation step. It allows a dynamic adjustment of the number and components of the particle-groups. Big particle-groups can be crushed into several small particle-groups or original particles. Conversely, several small particle-groups or original particles can be polymerized into a big particle-group. That is, the number and size of the particle-groups are not invariable but change dynamically during the simulation. The size of each particle-group relies on its equivalent diameter, which is measured by an EMMS type model. If the actual diameter of a particle-group is greater than its equivalent diameter, then crushing of this particle-group takes place. As to the polymerization of two colliding particle-groups, their velocity difference after collision is chosen as a criterion. If the velocities of the two particle-groups after collision are fairly close, then the two particle-groups can be regarded as one new particle-group. Due to the diversity of particle-group sizes, the resulting particle-group heterogeneity as well as the flow heterogeneity induced by the particle cluster formation should be considered. For this reason, the EMMS drag force model is adopted in this work. A non-staggered FVM and the SIMPLER algorithm are used to perform the simulations. Flow patterns and pressure drop predicted by the current dynamic coarse grain DEM-CFD method agree better with the experimental results than the original method. For fluidized beds involving more particles, the new method can reveal the complex fluidization pattern evolution in dense particle flow systems. The simulation results also suggest that excessive coarse grain will make the coarse grain system severely deviate from the original system and proper coarse grain will greatly reduce the simulation time. In conclusion, the highlights of this work can be summarized as follows:
- A dynamic particle-group crushing and polymerization procedure is considered in the coarse grain DEM-CFD model.
- The dynamically coarse graining is based on an EMMS type model.
- Heterogeneities are considered in the coarse graining systems by using the EMMS drag force model.
- The method is validated by comparing the simulation results with the experimental ones.
Author Contributions
Conceptualization, X.W. and J.O.; methodology, X.W. and J.O.; software, K.C. and T.K.; formal analysis, K.C. and T.K.; writing—Original draft preparation, X.W.; writing—Review and editing, J.O.; funding acquisition, X.W. and J.O. All authors have read and agreed to the published version of the manuscript.
Funding
This research was funded by the National Natural Science Foundation of China (Grant No. 11671321, 11971387), the Major Research Plan of the National Natural Science Foundation of China (Grant No. 91434201) and the Young Talent Fund of the University Association for Science and Technology in Shaanxi, China.
Acknowledgments
The authors would like to thank the anonymous referees, whose valuable comments helped to improve this paper.
Conflicts of Interest
The authors declare no conflict of interest.
Nomenclature
| particle mass, [] | |
| particle volume, [] | |
| particle velocity, [] | |
| gas pressure, [] | |
| drag force, [] | |
| gravitational force, [] | |
| contact force, [] | |
| void fraction, [—] | |
| interphase momentum exchange coefficient, [] | |
| gas velocity, [] | |
| particle diameter, [] | |
| gas density, [] | |
| drag coefficient, [—] | |
| heterogeneity index, [—] | |
| particle Reynolds number, [—] | |
| gas viscosity, [] | |
| normal spring constant, [] | |
| tangential spring constant, [] | |
| normal damping coefficient, [] | |
| tangential damping coefficient, [] | |
| normal overlap between particles, [] | |
| tangential overlap between particles, [] | |
| unit normal vector, [—] | |
| unit tangential vector, [—] | |
| friction coefficient, [—] | |
| particle radius, [] | |
| angular velocity, [] | |
| elasticity modulus, [] | |
| Poisson ratio, [—] | |
| inertial moment, [] | |
| coarse grain ratio, [—] | |
| gravitational acceleration, [] | |
| viscous stress tensor, [] | |
| volume of the computational cell, [] |
References
- Ding, W.; Chen, G.; Qin, M.; He, Y.; Qu, X. Low-cost Ti powders for additive manufacturing treated by fluidized bed. Powder Technol. 2019, 350, 117–122. [Google Scholar] [CrossRef]
- Özkaya, B.; Kaksonen, A.H.; Sahinkaya, E.; Puhakka, J.A. Fluidized bed bioreactor for multiple environmental engineering solutions. Water Res. 2019, 150, 452–465. [Google Scholar] [CrossRef]
- Chyou, Y.P.; Chang, D.M.; Chen, P.C.; Chien, H.Y.; Wu, K.T.; Chein, R.Y. Development of Biomass Gasification Technology with Fluidized-Bed Reactors for Enhancing Hydrogen Generation: Part I, Hydrodynamic Characterization of Dual Fluidized-Bed Gasifiers. Appl. Sci. 2020, 10, 2. [Google Scholar] [CrossRef]
- Pannala, S.; Syamlal, M.; O’Brein, T.J. (Eds.) Computational Gas-Solids Flows and Reacting Systems: Theory, Methods and Practice: Theory, Methods and Practice; IGI Global: Hershey, PA, USA, 2010. [Google Scholar]
- Deen, N.G.; Annaland, M.V.S.; Van der Hoef, M.A.; Kuipers, J.A.M. Review of discrete particle modeling of fluidized beds. Chem. Eng. Sci. 2007, 62, 28–44. [Google Scholar] [CrossRef]
- Wang, W.; Lu, B.; Zhang, N.; Shi, Z.; Li, J. A review of multiscale CFD for gas–solid CFB modeling. Int. J. Multiph. Flow 2010, 36, 109–118. [Google Scholar] [CrossRef]
- Dash, S.; Mohanty, S.; Mishra, B.K. CFD modelling and simulation of an industrial scale continuous fluidized bed roaster. Adv. Powder Technol. 2019. [Google Scholar] [CrossRef]
- Cundall, P.A.; Strack, O.D.L. A discrete numerical model for granular assemblies. Géotechnique 1979, 29, 47–65. [Google Scholar] [CrossRef]
- Peng, W.; Song, S.; Yu, C.; Bao, Y.; Sui, J.; Hu, Y. Forecasting Landslides via Three-Dimensional Discrete Element Modeling: Helong Landslide Case Study. Appl. Sci. 2019, 9, 5242. [Google Scholar] [CrossRef]
- Daraio, D.; Villoria, J.; Ingram, A.; Alexiadis, A.; Hugh Stitt, E.; Marigo, M. Validation of a Discrete Element Method (DEM) Model of the Grinding Media Dynamics within an Attritor Mill Using Positron Emission Particle Tracking (PEPT) Measurements. Appl. Sci. 2019, 9, 4816. [Google Scholar] [CrossRef]
- Tsuji, Y.; Kawaguchi, T.; Tanaka, T. Discrete particle simulation of two-dimensional fluidized bed. Powder Technol. 1993, 77, 79–87. [Google Scholar] [CrossRef]
- Xu, B.H.; Yu, A.B. Numerical simulation of the gas-solid flow in a fluidized bed by combining discrete particle method with computational fluid dynamics. Chem. Eng. Sci. 1997, 52, 2785–2809. [Google Scholar] [CrossRef]
- Wu, G.; Ouyang, J.; Yang, B.; Li, Q. Use of compromise-based local porosities for coarse grid DEM simulation of bubbling fluidized bed with large particles. Adv. Powder Technol. 2013, 24, 68–78. [Google Scholar] [CrossRef]
- Wu, G.; Ouyang, J.; Li, Q. Revised drag calculation method for coarse grid Lagrangian–Eulerian simulation of gas–solid bubbling fluidized bed. Powder Technol. 2013, 235, 959–967. [Google Scholar] [CrossRef]
- Peters, B.; Baniasadi, M.; Baniasadi, M.; Besseron, X.; Donoso, A.E.; Mohseni, M.; Pozzetti, G. XDEM multi-physics and multi-scale simulation technology: Review of DEM–CFD coupling, methodology and engineering applications. Particuology 2019, 44, 176–193. [Google Scholar] [CrossRef]
- Tsuji, T.; Kawaguchi, T.; Tanaka, T. Large-scale DEM-CFD coupling simulation of 3-D bubbling fluidized bed. J. Soc. Powder Technol. Japan 2010, 3, 45–46. [Google Scholar]
- Tsuji, T.; Yabumoto, K.; Tanaka, T. Spontaneous structures in three-dimensional bubbling gas-fluidized bed by parallel DEM–CFD coupling simulation. Powder Technol. 2008, 184, 132–140. [Google Scholar] [CrossRef]
- Van Wachem, B.G.M.; Van der Schaaf, J.; Schouten, J.C.; Krishna, R.; Van den Bleek, C.M. Experimental validation of Lagrangian–Eulerian simulations of fluidized beds. Powder Technol. 2001, 116, 155–165. [Google Scholar] [CrossRef]
- Khawaja, H.A. CFD-DEM and Experimental Study of Bubbling in a Fluidized Bed. J. Comput. Multiph. Flows 2015, 7, 227–240. [Google Scholar] [CrossRef][Green Version]
- Khawaja, H.A. CFD-DEM simulation of minimum fluidisation velocity in two phase medium. Int. J. Multiphysics 2016, 5, 89–99. [Google Scholar] [CrossRef]
- Gupta, P.; Sun, J.; Ooi, J.Y. DEM-CFD simulation of a dense fluidized bed: Wall boundary and particle size effects. Powder Technol. 2016, 293, 37–47. [Google Scholar] [CrossRef]
- Li, T.; Zhang, Y.; Hernández-Jiménez, F. Investigation of particle–wall interaction in a pseudo-2D fluidized bed using CFD-DEM simulations. Particuology 2016, 25, 10–22. [Google Scholar] [CrossRef]
- Chu, K.W.; Wang, B.; Yu, A.B.; Vince, A. CFD-DEM modelling of multiphase flow in dense medium cyclones. Powder Technol. 2009, 193, 235–247. [Google Scholar] [CrossRef]
- Oevermann, M.; Gerber, S.; Behrendt, F. Euler–Lagrange/DEM simulation of wood gasification in a bubbling fluidized bed reactor. Particuology 2009, 7, 307–316. [Google Scholar] [CrossRef]
- Zhuang, Y.; Chen, X.; Liu, D.; Bu, C. CFD–DEM Modeling of O2/CO2 Char Combustion in a Fluidized Bed. In International Symposium on Coal Combustion; Springer: Singapore, 2015; pp. 287–293. [Google Scholar]
- Baniasadi, M.; Baniasadi, M.; Peters, B. Coupled CFD-DEM with heat and mass transfer to investigate the melting of a granular packed bed. Chem. Eng. Sci. 2018, 178, 136–145. [Google Scholar] [CrossRef]
- Pozzetti, G.; Peters, B. A multiscale DEM-VOF method for the simulation of three-phase flows. Int. J. Multiph. Flow 2018, 99, 186–204. [Google Scholar] [CrossRef]
- Zhao, T.; Dai, F.; Xu, N.W.; Liu, Y.; Xu, Y. A composite particle model for non-spherical particles in DEM simulations. Granul. Matter 2015, 17, 763–774. [Google Scholar] [CrossRef]
- Luo, Z.G.; Zhou, H.; Zhang, T.; You, Y.; Zhang, L.J.; Zou, Z.S.; Shen, Y.S. DEM study of blockage behaviour of cohesive fine particles in a packed structure of large particles. Powder Technol. 2017, 314, 102–109. [Google Scholar] [CrossRef]
- Sakai, M.; Abe, M.; Shigeto, Y.; Mizutani, S.; Takahashi, H.; Viré, A.; Percival, J.R.; Xiang, J.; Pain, C.C. Verification and validation of a coarse grain model of the DEM in a bubbling fluidized bed. Chem. Eng. J. 2014, 244, 33–43. [Google Scholar] [CrossRef]
- Sakai, M.; Koshizuka, S. Large-scale discrete element modeling in pneumatic conveying. Chem. Eng. Sci. 2009, 64, 533–539. [Google Scholar] [CrossRef]
- Sakai, M.; Takahashi, H.; Pain, C.C.; Latham, J.P.; Xiang, J. Study on a large-scale discrete element model for fine particles in a fluidized bed. Adv. Powder Technol. 2012, 23, 673–681. [Google Scholar] [CrossRef]
- Sakai, M.; Yamada, Y.; Shigeto, Y.; Shibata, K.; Kawasaki, V.M.; Koshizuka, S. Large-scale discrete element modeling in a fluidized bed. Int. J. Numer. Methods Fluids 2010, 64, 1319–1335. [Google Scholar] [CrossRef]
- Radl, S.; Radeke, C.; Khinast, J.G.; Sundaresan, S. Parcel-based approach for the simulation of gas-particle flows. In Proceedings of the 8th International Conference on CFD in Oil & Gas, Metallurgical and Process Industries, Trondheim, Norway, 21–23 June 2011; Available online: https://pdfs.semanticscholar.org/2277/7350720be0105a239ea771ae2df6befc241e.pdf (accessed on 22 March 2019).
- Girardi, M.; Radl, S.; Sundaresan, S. Simulating wet gas–solid fluidized beds using coarse-grid CFD-DEM. Chem. Eng. Sci. 2016, 144, 224–238. [Google Scholar] [CrossRef]
- Nikolopoulos, A.; Stroh, A.; Zeneli, M.; Alobaid, F.; Nikolopoulos, N.; Ströhle, J.; Karellas, S.; Epple, B.; Grammelis, P. Numerical investigation and comparison of coarse grain CFD–DEM and TFM in the case of a 1 MWth fluidized bed carbonator simulation. Chem. Eng. Sci. 2017, 163, 189–205. [Google Scholar] [CrossRef]
- Li, J.; Cheng, C.; Zhang, Z.; Yuan, J.; Nemet, A.; Fett, F.N. The EMMS model-its application, development and updated concepts. Chem. Eng. Sci. 1999, 54, 5409–5425. [Google Scholar] [CrossRef]
- Xu, G.; Li, J. Analytical solution of the energy-minimization multi-scale model for gas–solid two-phase flow. Chem. Eng. Sci. 1998, 53, 1349–1366. [Google Scholar] [CrossRef]
- Syamlal, M.; O’brien, T.J. Computer simulation of bubbles in a fluidized bed. Proc. AIChE Symp. Ser. 1989, 85, 22–31. [Google Scholar]
- Wen, C.Y.; Yu, Y.H. Mechanics of fluidization. Chem. Eng. Prog. Symp. Ser. 1966, 62, 100–111. [Google Scholar]
- Ergun, S. Fluid flow through packed columns. Chem. Eng. Prog. 1952, 48, 89–94. [Google Scholar]
- Gidaspow, D. Multiphase Flow and Fluidization: Continuum and Kinetic Theory Descriptions; Elsevier Science: Amsterdam, The Netherlands, 1994. [Google Scholar]
- Wang, J.; Ge, W.; Li, J. Eulerian simulation of heterogeneous gas–solid flows in CFB risers: EMMS-based sub-grid scale model with a revised cluster description. Chem. Eng. Sci. 2008, 63, 1553–1571. [Google Scholar] [CrossRef]
- Wang, W.; Li, J. Simulation of gas-solid two-phase flow by a multi-scale CFD approach—Extension of the EMMS model to the sub-grid level. Chem. Eng. Sci. 2007, 62, 208–231. [Google Scholar] [CrossRef]
- Hu, S.; Liu, X. A general EMMS drag model applicable for gas-solid turbulent beds and cocurrent downers. Chem. Eng. Sci. 2019, 205, 14–24. [Google Scholar] [CrossRef]
- Liu, X.; Zhao, M.; Hu, S.; Ge, W. Three-dimensional CFD simulation of tapered gas-solid risers by coupling the improved EMMS drag. Powder Technol. 2019, 352, 305–313. [Google Scholar] [CrossRef]
- Jiang, Y.; Li, F.; Ge, W.; Wang, W. EMMS-based solid stress model for the multiphase particle-in-cell method. Powder Technol. 2020, 360, 1377–1387. [Google Scholar] [CrossRef]
- Liu, X.; Ge, W.; Wang, L. Scale and structure dependent drag in gas-solid flows. AIChE J. 2019. [Google Scholar] [CrossRef]
- Li, F.; Song, F.; Benyahia, S.; Wang, W.; Li, J. MP-PIC simulation of CFB riser with EMMS-based drag model. Chem. Eng. Sci. 2012, 82, 104–113. [Google Scholar] [CrossRef]
- Lu, L.; Xu, J.; Ge, W.; Yue, Y.; Liu, X.; Li, J. EMMS-based discrete particle method (EMMS–DPM) for simulation of gas–solid flows. Chem. Eng. Sci. 2014, 120, 67–87. [Google Scholar] [CrossRef]
- Matsen, J.M. Mechanisms of choking and entrainment. Powder Technol. 1982, 32, 21–33. [Google Scholar] [CrossRef]
© 2020 by the authors. Licensee MDPI, Basel, Switzerland. This article is an open access article distributed under the terms and conditions of the Creative Commons Attribution (CC BY) license (http://creativecommons.org/licenses/by/4.0/).