Identification of Breast Malignancy by Marker-Controlled Watershed Transformation and Hybrid Feature Set for Healthcare

Abstract
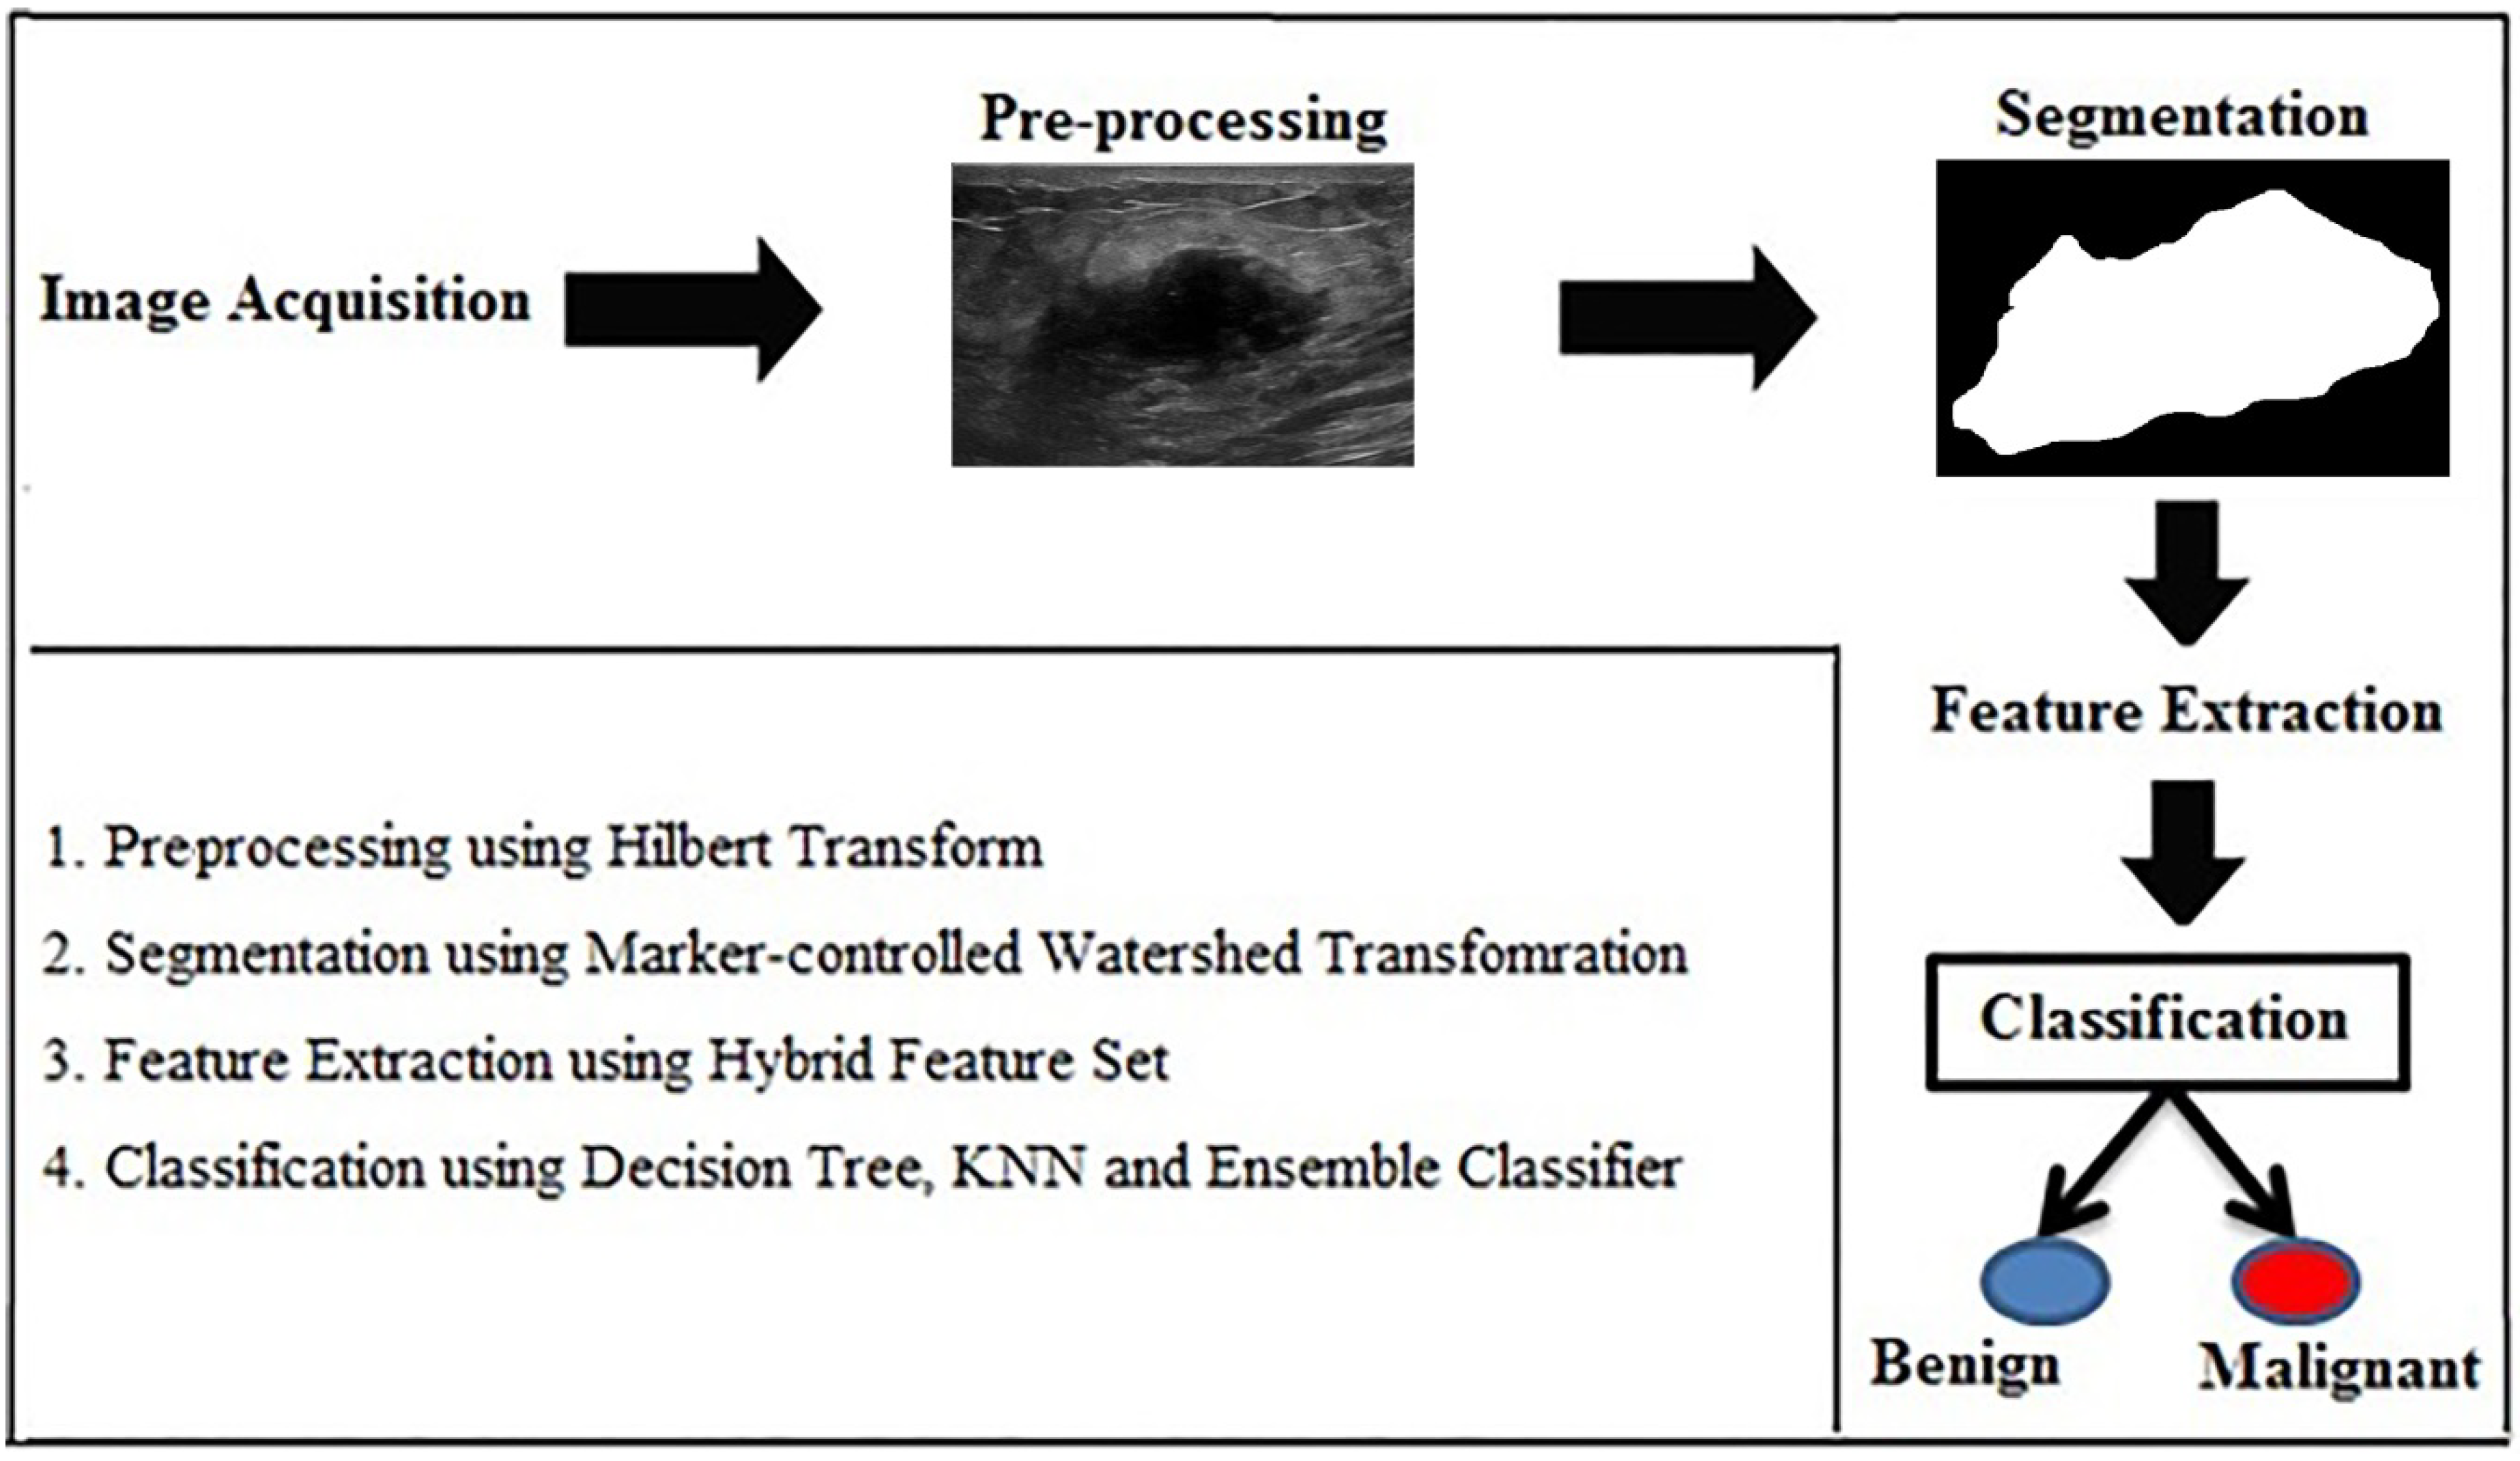
1. Introduction
- To develop an automated CADx system to detect breast cancer accurately.
- To introduce the marker-controlled watershed transformation for efficient segmentation.
- To extract hybrid feature set incorporating both shape-based and texture features to describe lesions in detail and to overcome the limitations of texture-based methods for BUS images.
2. Proposed Methods
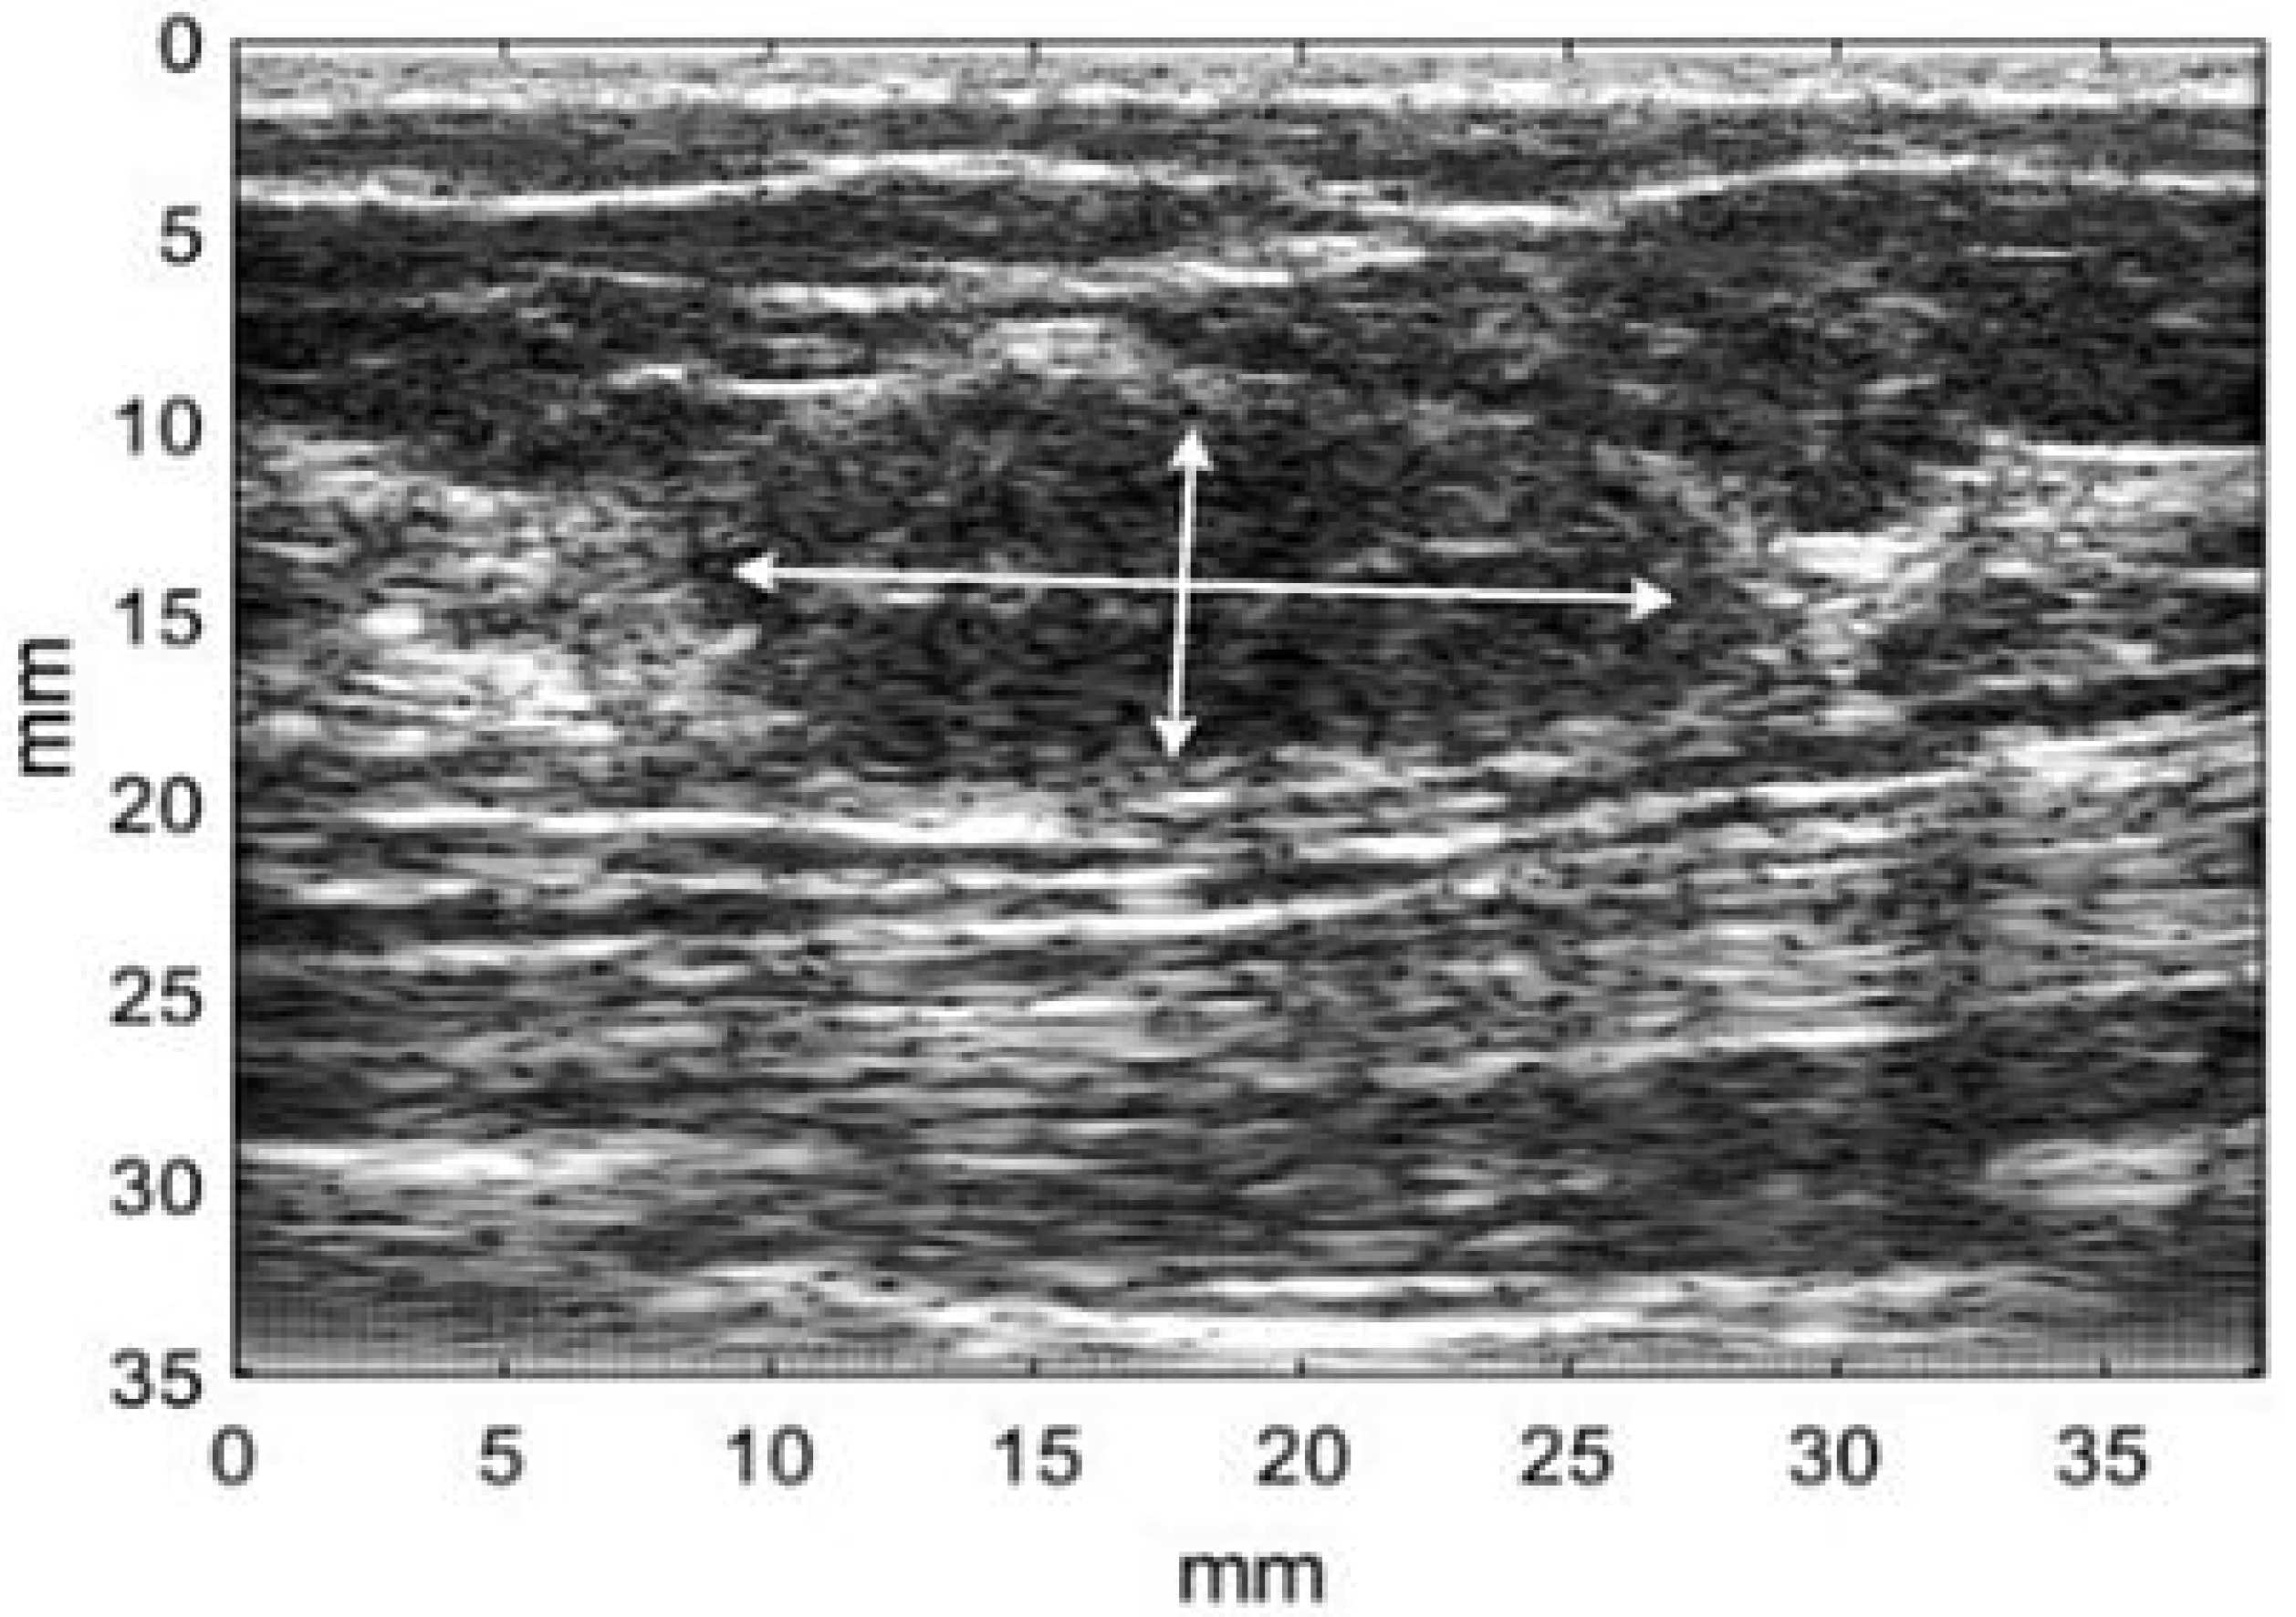
2.1. Image Database
2.2. Preprocessing
2.3. Segmentation
2.4. Feature Extraction
2.5. Classification
3. Results
4. Discussion
5. Conclusions and Future Directions
Author Contributions
Funding
Conflicts of Interest
Data Sharing and Availability
References
- Jemal, A.; Bray, F.; Center, M.M.; Ferlay, J.; Ward, E.; Forman, D. Global cancer statistics. Cancer J. Clin. 2011, 61, 69–90. [Google Scholar]
- Laderian, B.; Fojo, T. CDK4/6 Inhibition as a therapeutic strategy in breast cancer: Palbociclib, ribociclib, and abemaciclib. Semin. Oncol. 2017, 44, 395–403. [Google Scholar] [PubMed]
- Kelly, K.M.; Dean, J.; Comulada, W.S.; Lee, S.J. Breast cancer detection using automated whole breast ultrasound and mammography in radiographically dense breasts. Eur. Radiol. 2010, 20, 734–742. [Google Scholar] [PubMed]
- Timmers, J.M.H.; van Doorne-Nagtegaal, H.J.; Verbeek, A.L.M.; Den Heeten, G.J.; Broeders, M.J.M. A dedicated BI-RADS training programme: Effect on the inter-observer variation among screening radiologists. Eur. J. Radiol. 2012, 81, 2184–2188. [Google Scholar]
- Calas, M.J.G.; Almeida, R.M.V.R.; Gutfilen, B.; Pereira, W.C.A. Intraobserver interpretation of breast ultrasonography following the BI-RADS classification. Eur. J. Radiol. 2010, 74, 525–528. [Google Scholar]
- Cheng, H.D.; Shan, J.; Ju, W.; Guo, Y.; Zhang, L. Automated breast cancer detection and classification using ultrasound images: A survey. Pattern Recognit. 2010, 43, 299–317. [Google Scholar]
- Flores, W.G.; de Albuquerque Pereira, W.C.; Infantosi, A.F.C. Improving classification performance of breast lesions on ultrasonography. Pattern Recognit. 2015, 48, 1125–1136. [Google Scholar]
- Sadad, T.; Munir, A.; Saba, T.; Hussain, A. Fuzzy C-means and region growing based classification of tumor from mammograms using hybrid texture feature. J. Comput. Sci. 2018, 29, 34–45. [Google Scholar]
- Jalalian, A.; Mashohor, S.B.; Mahmud, H.R.; Saripan, M.I.B.; Ramli, A.R.B.; Karasfi, B. Computer-aided detection/diagnosis of breast cancer in mammography and ultrasound: A review. Clin. Imaging 2013, 37, 420–426. [Google Scholar]
- Xian, M.; Zhang, Y.; Cheng, H.D.; Xu, F.; Zhang, B.; Ding, J. Automatic breast ultrasound image segmentation: A survey. Pattern Recognit. 2018, 79, 340–355. [Google Scholar]
- Shan, J.; Cheng, H.D.; Wang, Y. A novel automatic seed point selection algorithm for breast ultrasound images. In Proceedings of the International Conference on Pattern Recognition, Tampa, FL, USA, 8–11 December 2008. [Google Scholar]
- Gomez, W.; Leija, L.; Alvarenga, A.V.; Infantosi, A.F.C.; Pereira, W.C.A. Computerized lesion segmentation of breast ultrasound based on marker-controlled watershed transformation. Med. Phys. 2010, 37, 82–95. [Google Scholar] [PubMed]
- Rivest, J.-F.; Soille, P.; Beucher, S. Morphological gradients. In Nonlinear Image Processing III; SPIE: Bellingham, WA, USA, 1992; pp. 139–150. [Google Scholar]
- Yang, M.C.; Moon, W.K.; Wang, Y.C.F.; Bae, M.S.; Huang, C.S.; Chen, J.H.; Chang, R.F. Robust texture analysis using multi-resolution gray-scale invariant features for breast sonographic tumor diagnosis. IEEE Trans. Med. Imaging 2013, 32, 2262–2273. [Google Scholar]
- Shi, X.; Cheng, H.D.; Hu, L.; Ju, W.; Tian, J. Detection and classification of masses in breast ultrasound images. Digit. Signal Process. 2010, 20, 824–836. [Google Scholar]
- Lo, C.M.; Chang, R.F.; Huang, C.S.; Moon, W.K. Computer-aided diagnosis of breast tumors using textures from intensity transformed sonographic images. In IFMBE Proceedings; Springer: Basel, Switzerland, 2015; Volume 47, pp. 124–127. [Google Scholar]
- Cai, L.; Wang, X.; Wang, Y.; Guo, Y.; Yu, J.; Wang, Y. Robust phase-based texture descriptor for classification of breast ultrasound images. Biomed. Eng. Online 2015, 14, 26. [Google Scholar]
- Nemat, H.; Fehri, H.; Ahmadinejad, N.; Frangi, A.F.; Gooya, A. Classification of breast lesions in ultrasonography using sparse logistic regression and morphology-based texture features. Med. Phys. 2018, 45, 4112–4124. [Google Scholar]
- Cheng, J.Z.; Chou, Y.H.; Huang, C.S.; Chang, Y.C.; Tiu, C.M.; Chen, K.W.; Chen, C.M. Computer-aided US diagnosis of breast lesions by using cell-based contour grouping. Radiology 2010, 255, 746–754. [Google Scholar]
- Rodriguez-Cristerna, A.; Guerrero-Cedillo, C.P.; Donati-Olvera, G.A.; Gómez-Flores, W.; Pereira, W.C.A. Study of the impact of image preprocessing approaches on the segmentation and classification of breast lesions on ultrasound. In Proceedings of the 2017 14th International Conference on Electrical Engineering, Computing Science and Automatic Control, CCE 2017, Mexico City, Mexico, 20–22 October 2017. [Google Scholar]
- O’Mahony, N.; Campbell, S.; Carvalho, A.; Harapanahalli, S.; Hernandez, G.V.; Krpalkova, L. Deep Learning vs. Traditional Computer Vision. In Advances in Intelligent Systems and Computing (CVC 2019); Springer: Las Vegas, NV, USA, 2020; pp. 128–144. [Google Scholar]
- Byra, M. Discriminant analysis of neural style representations for breast lesion classification in ultrasound. Biocybern. Biomed. Eng. 2018, 38, 684–690. [Google Scholar]
- Byra, M.; Galperin, M.; Ojeda-Fournier, H.; Olson, L.; O’Boyle, M.; Comstock, C.; Andre, M. Breast mass classification in sonography with transfer learning using a deep convolutional neural network and color conversion. Med. Phys. 2019, 46, 746–755. [Google Scholar]
- Wu, S.; Gao, Z.; Liu, Z.; Luo, J.; Zhang, H.; Li, S. Direct reconstruction of ultrasound elastography using an end-to-end deep neural network. In Lecture Notes in Computer Science (Including Subseries Lecture Notes in Artificial Intelligence and Lecture Notes in Bioinformatics); Springer: Cham, Switzerland, 2018. [Google Scholar]
- Kong, B.; Zhan, Y.; Shin, M.; Denny, T.; Zhang, S. Recognizing end-diastole and end-systole frames via deep temporal regression network. In Lecture Notes in Computer Science (Including Subseries Lecture Notes in Artificial Intelligence and Lecture Notes in Bioinformatics); Springer: Cham, Switzerland, 2016; pp. 264–272. [Google Scholar]
- Piotrzkowska-Wróblewska, H.; Dobruch-Sobczak, K.; Byra, M.; Nowicki, A. Open access database of raw ultrasonic signals acquired from malignant and benign breast lesions. Med. Phys. 2017, 44, 6105–6109. [Google Scholar]
- Al-Dhabyani, W.; Gomaa, M.; Khaled, H.; Fahmy, A. Dataset of breast ultrasound images. Data Br. 2020, in press. [Google Scholar]
- Giger, M.L.; Al-Hallaq, H.; Huo, Z.; Moran, C.; Wolverton, D.E.; Chan, C.W.; Zhong, W. Computerized analysis of lesions in US images of the breast. Acad. Radiol. 1999, 6, 665–674. [Google Scholar] [PubMed]
- Sharma, N.; Aggarwal, L.M. Automated medical image segmentation techniques. J. Med. Phys. 2010, 35, 3–14. [Google Scholar] [PubMed]
- Roerdink, J.; Meijster, A. The Watershed Transform: Definitions, Algorithms and Parallelization Strategies. Fundam. Inform. 2000, 41, 187–228. [Google Scholar]
- Gonzalez, R.; Woods, R. Digital Image Processing; Prentice Hall: Upper Saddle River, NJ, USA, 2002. [Google Scholar]
- Chen, W.B.; Zhang, X. A new watershed algorithm for cellular image segmentation based on mathematical morphology. In Proceedings of the 2010 International Conference on Machine Vision and Human-Machine Interface, Kaifeng, China, 24–25 April 2010; pp. 653–656. [Google Scholar]
- Soille, P. Morphological Image Analysis: Principles and Applications, 2nd ed.; Springer: Berlin, Germany, 2004. [Google Scholar]
- Liu, J.; Shi, Y. Image Feature Extraction Method Based on Shape Characteristics and Its Application in Medical Image Analysis. Appl. Inform. Commun. 2011, 224, 172–178. [Google Scholar]
- Behnam, H.; Zakeri, F.S.; Ahmadinejad, N. Breast mass classification on sonographic images on the basis of shape analysis. J. Med. Ultrason. 2010, 37, 181–186. [Google Scholar]
- Haralick, R.M.; Shanmugam, K.; Dinstein, I.H. Textural Features for Image Classification. IEEE Trans. Syst. Man. Cybern. 1973, SMC-3, 610–621. [Google Scholar]
- Soh, L.K.; Tsatsoulis, C. Texture analysis of sar sea ice imagery using gray level co-occurrence matrices. IEEE Trans. Geosci. Remote Sens. 1999, 37, 780–795. [Google Scholar]
- Clausi, D.A. An analysis of co-occurrence texture statistics as a function of grey level quantization. Can. J. Remote Sens. 2002, 28, 45–62. [Google Scholar]
- Zinovev, D.; Raicu, D.; Furst, J.; Armato, S.G., III. Predicting radiological panel opinions using a panel of machine learning classifiers. Algorithms 2009, 2, 1473–1502. [Google Scholar]
- Refaeilzadeh, P.; Tang, L.; Liu, H. Cross Validation, Encyclopedia of Database Systems (EDBS); Arizona State University, Springer: Berlin/Heidelberg, Germany, 2009; pp. 532–538. [Google Scholar]
- Fischer, J.E.; Bachmann, L.M.; Jaeschke, R. A readers’ guide to the interpretation of diagnostic test properties: Clinical example of sepsis. Intensive Care Med. 2003, 29, 1043–1051. [Google Scholar]
- Rokach, L. Ensemble-based classifiers. Artif. Intell. Rev. 2010, 33, 1–39. [Google Scholar]
- Mounce, S.R.; Ellis, K.; Edwards, J.M.; Speight, V.L.; Jakomis, N.; Boxall, J.B. Ensemble Decision Tree Models Using RUSBoost for Estimating Risk of Iron Failure in Drinking Water Distribution Systems. Water Resour. Manag. 2017, 31, 1575–1589. [Google Scholar]
- Jankovic, D.; Peng, P.; Sehmbi, H.; Perlas, A. Basics of Ultrasound Imaging. In Regional Nerve Blocks in Anesthesia and Pain Therapy; Springer: Cham, Switzerland, 2015; pp. 27–56. [Google Scholar]
- Nugroho, H.A.; Triyani, Y.; Rahmawaty, M.; Ardiyanto, I. Computer Aided Diagnosis using Margin and Posterior Acoustic Featuresfor Breast Ultrasound Images. Telkomnika 2017, 4, 1776–1784. [Google Scholar]
- Moon, W.K.; Lo, C.M.; Chen, R.T.; Shen, Y.W.; Chang, J.M.; Huang, C.S. Tumor detection in automated breast ultrasound images using quantitative tissue clustering. Med. Phys. 2014, 41, 042901. [Google Scholar]
- Singh, B.K.; Verma, K.; Thoke, A.S. Adaptive gradient descent backpropagation for classification of breast tumors in ultrasound imaging. Procedia Comput. Sci. 2015, 46, 1601–1609. [Google Scholar]


| Field | Description | Field | Description |
|---|---|---|---|
| Id | Patient ID | Rf1 | First scan |
| Rf2 | Second scan | Rf2 | Second scan |
| Roi1 | ROI for the first scan | Roi2 | ROI for the second scan |
| birads | Category of BI-RADS | Class | Malignant (1), Benign (0) |
| Features | Formula | Features | Formula |
|---|---|---|---|
Where represents number of different intensity levels. | Where | ||
Where and are the means and standard deviations of and | |||
Where , , , | |||
| Feature | Formula | Description |
|---|---|---|
| Elongation | Used to measure the object length. | |
| Roundness | Method to show the level of determination lesion. | |
| Solidity | Used to measure the density of the lesion. | |
| Rectangularity | Method to explain resemblance of lesion shape with rectangular shape. | |
| Compactness | The ratio between the lesion area with circle area. | |
| Convexity | This technique is the perimeter ratio between convex full of lesion and the lesion itself. | |
| Eccentricity | The proportion of distance between the ellipse focal and major axis. |
| Feature set | Size | Description |
|---|---|---|
| GLCM | 1 × 20 | Produce texture features based on second order statistical method by co-occurrence matrix |
| Shape-based | 1× 7 | Compute elongation, compactness, rectangularity, solidity, roundness, eccentricity, and convexity |
| Ensemble (Preset: RUSBoosted trees, ensemble method: RUSBoost, learner type: Decision tree, maximum number of splits: 20, number of learners: 30, learning rate: 0.1) | |||
| Scan | Statistic | Value | 95% of Confidence Interval |
| Longitudinal | Accuracy | 97.00% | 91.48% to 99.38% |
| Sensitivity | 96.23% | 87.02% to 99.54% | |
| Specificity | 97.87% | 88.71% to 99.95% | |
| PPV | 98.08% | 88.00% to 99.72% | |
| NPV | 95.83% | 85.51% to 98.90% | |
| KNN (Preset: Weighted KNN, number of neighbors: 10, distance metric: Euclidean distance weight: Squared inverse) | |||
| Longitudinal | Accuracy | 94.00% | 87.40% to 97.77% |
| Sensitivity | 92.59% | 82.11% to 97.94% | |
| Specificity | 95.65% | 85.16% to 99.47% | |
| PPV | 96.15% | 86.54% to 98.98% | |
| NPV | 91.67% | 81.04% to 96.59% | |
| Decision tree (Preset: Complex tree, maximum number of splits: 100, split criterion: Gini’s diversity index) | |||
| Longitudinal | Accuracy | 88.00% | 79.98% to 93.64% |
| Sensitivity | 90.00% | 78.19% to 96.67% | |
| Specificity | 86.00% | 73.26% to 94.18% | |
| PPV | 86.54% | 76.27% to 92.78% | |
| NPV | 89.58% | 78.80% to 95.22% | |
| Ensemble (Preset: Ensemble method: RUSBoost, RUSBoosted trees, learner type: Decision tree, number of learners: 30, maximum number of splits: 20, learning rate: 0.1) | |||
| Scan | Statistic | Value | 95% of Confidence Interval |
| Transverse | Accuracy | 95.00% | 88.72% to 98.36% |
| Sensitivity | 92.73% | 82.41% to 97.98% | |
| Specificity | 97.78% | 88.23% to 99.94% | |
| PPV | 98.08% | 88.00% to 99.72% | |
| NPV | 91.67% | 81.05% to 96.59% | |
| KNN (Preset: Weighted KNN, distance metric: Euclidean, number of neighbors: 10, distance weight: Squared inverse) | |||
| Transverse | Accuracy | 93.00% | 86.11% to 97.14% |
| Sensitivity | 90.91% | 80.05% to 96.98% | |
| Specificity | 95.56% | 84.85% to 99.46% | |
| PPV | 96.15% | 86.55% to 98.98% | |
| NPV | 89.58% | 78.81% to 95. 21% | |
| Decision tree (Preset: Complex tree, Split criterion: Gini’s diversity index, maximum number of splits: 100) | |||
| Transverse | Accuracy | 85.00% | 76.47% to 91.35% |
| Sensitivity | 87.76% | 75.23% to 95.37% | |
| Specificity | 82.35% | 69.13% to 91.60% | |
| PPV | 82.69% | 72.35% to 89.72% | |
| NPV | 87.50% | 76.60% to 93.74% | |
| Ensemble (Preset: RUSBoosted trees, Ensemble method: RUSBoost, learner type: Decision tree, number of learners: 30, maximum number of splits: 20, learning rate: 0.1) | ||
| Statistic | Value | 95% of Confidence Interval |
| Accuracy | 96.60% | 94.90% to 97.86% |
| Sensitivity | 94.34% | 90.32% to 97.04% |
| Specificity | 97.70% | 95.81% to 98.89% |
| PPV | 95.24% | 91.55% to 97.36% |
| NPV | 97.25% | 95.34% to 98.40% |
| Decision tree (Preset: Complex tree, split criterion: Gini’s diversity index, maximum number of splits: 100) | ||
| Accuracy | 95.83% | 93.99% to 97.23% |
| Sensitivity | 92.96% | 88.65% to 96.01% |
| Specificity | 97.24% | 95.22% to 98.56% |
| PPV | 94.29% | 90.42% to 96.65% |
| NPV | 96.57% | 94.53% to 97.87% |
| KNN (Preset: Weighted KNN, number of neighbors: 10, distance weight: Squared inverse, distance metric: Euclidean) | ||
| Accuracy | 95.36% | 93.45% to 96.85% |
| Sensitivity | 92.86% | 88.49% to 95.95% |
| Specificity | 96.57% | 94.40% to 98.07% |
| PPV | 92.86% | 88.76% to 95.54% |
| NPV | 96.57% | 94.53% to 97.86% |
| Methods | Feature Set | Classifier | Accuracy (%) | Sensitivity (%) | Specificity (%) |
|---|---|---|---|---|---|
| Proposed technique | Hybrid features | Ensemble | 97.00 | 96.23 | 97.87 |
| Nugroho et al. 2017 [45] | Texture and geometry analysis | SVM | 91.30 | 92.00 | 89.60 |
| Moon et al. 2014 [46] | Echogenicity and morphology | Logistic regression | - | 92.50 | - |
| B. Singh et al. 2015 [47] | texture and shape features | ANN | 84.60 |
© 2020 by the authors. Licensee MDPI, Basel, Switzerland. This article is an open access article distributed under the terms and conditions of the Creative Commons Attribution (CC BY) license (http://creativecommons.org/licenses/by/4.0/).
Share and Cite
Sadad, T.; Hussain, A.; Munir, A.; Habib, M.; Ali Khan, S.; Hussain, S.; Yang, S.; Alawairdhi, M. Identification of Breast Malignancy by Marker-Controlled Watershed Transformation and Hybrid Feature Set for Healthcare. Appl. Sci. 2020, 10, 1900. https://doi.org/10.3390/app10061900
Sadad T, Hussain A, Munir A, Habib M, Ali Khan S, Hussain S, Yang S, Alawairdhi M. Identification of Breast Malignancy by Marker-Controlled Watershed Transformation and Hybrid Feature Set for Healthcare. Applied Sciences. 2020; 10(6):1900. https://doi.org/10.3390/app10061900
Chicago/Turabian StyleSadad, Tariq, Ayyaz Hussain, Asim Munir, Muhammad Habib, Sajid Ali Khan, Shariq Hussain, Shunkun Yang, and Mohammed Alawairdhi. 2020. "Identification of Breast Malignancy by Marker-Controlled Watershed Transformation and Hybrid Feature Set for Healthcare" Applied Sciences 10, no. 6: 1900. https://doi.org/10.3390/app10061900
APA StyleSadad, T., Hussain, A., Munir, A., Habib, M., Ali Khan, S., Hussain, S., Yang, S., & Alawairdhi, M. (2020). Identification of Breast Malignancy by Marker-Controlled Watershed Transformation and Hybrid Feature Set for Healthcare. Applied Sciences, 10(6), 1900. https://doi.org/10.3390/app10061900