Article

Exergy Analysis of Kalina and Kalina Flash Cycles Driven by Renewable Energy

1
Department of Mechanical Engineering, Kumoh National Institute of Technology, Daehakro 61, Gumi, Gyeongbuk 39177, Korea
2
Department of Mechanical System Engineering, Kumoh National Institute of Technology, Daehakro 61, Gumi, Gyeongbuk 39177, Korea
*
Author to whom correspondence should be addressed.
Appl. Sci. 2020, 10(5), 1813; https://doi.org/10.3390/app10051813
Submission received: 10 February 2020 / Revised: 28 February 2020 / Accepted: 4 March 2020 / Published: 6 March 2020

Abstract

:

Featured Application

The results of this paper are expected to be a guide for the newly proposed Kalina flash cycle.

Abstract

The Kalina cycle (KC) has been recognized as one of the most efficient conversion systems of low-grade heat sources. The Kalina flash cycle (KFC) is a recently proposed novel cycle which is equipped with an additional flash process to the KC. In this study, the exergy performance of KC and KFC driven by a low-grade heat source are investigated comparatively. The dependence of the exergy destruction at each component as well as the system’s exergy efficiency on ammonia concentration, separator pressure and, additionally, flash pressure for KFC, are systematically investigated. Results showed that KFC can be optimized with respect to flash pressure on the base of exergy efficiency, and the component where largest exergy destruction occurs varies for different separator pressure and ammonia fraction in both systems. It is also shown that the maxima of net power production and exergy efficiency in KFC with optimal flash pressure are superior to those in KC.

1. Introduction

Due to the limited fossil fuel resources and environmental problems, the efficient conversion and storage of renewable energy has been increasingly important [1]. The organic Rankine cycle (ORC) and the Kalina cycle (KC) have been recognized as the feasible and efficient ways of generating power by exploiting a low-grade heat source. KC uses a solution of ammonia in water for working fluid, whose boiling points differ. It usually operates as an absorption cycle with varying concentration during the cycle. An improved efficiency is expected owing to the reduced thermal mismatch between the source and mixture during the heat acceptance process [2,3]. An earlier theoretical study by El-Sayed and Tribus [4] showed a potential of KC for a 10%–20% enhanced thermal efficiency than RC. The early KC proposed by Kalina and Leibowitz [5] was shown to produce a higher power output than ORC for a specific geothermal application.
KC can be used to generate power by exploiting sensible heat from a variety of sources: geothermal energy, industrial waste heat, ocean thermal energy, solar energy, and others. One of the important design considerations of KC is compatibility with the available sources. In the case of low- to medium-grade geothermal applications, a mixture with ammonia fraction of around 70 wt% is commonly used [6]. However, the optimal concentration depends on many design parameters: concentrations range from 58 to 89 wt% as reviewed in [7]. Next to concentration the key parameters influencing the performance of KC are separator temperature and the inlet and outlet conditions of the turbine (pressure and temperature) [7]. Arslan [8] used an artificial neural network to obtain optimized power generation and required pump power for a specific geothermal KC of KCS-34. Sun et al. [9] studied KC with a superheater and reported the optimized exergy and energy efficiencies for Kumejima Island as 35.6% and 6.48%. Mergner and Schaber [10] analyzed 5 years’ data logs for the evaporator of a KC.
It is worth trying to enhance the power-generation performance by integrating the system with the Kalina cycle. Peng et al. [11] proposed to integrate a gas turbine and a Kalina cycle with a solar-driven power system, with an expectation of peak efficiency of 27.5% and 69% reduction of water consumption. Qu et al. [12] proposed to combine concentrating photovoltaics and a Kalina cycle equipped with absorption chiller to improve both systems’ efficiency. Yuksel et al. [13] proposed to integrate a geothermal Kalina cycle with modules for absorption cooling and hydrogen generation, and showed that energy and exergy efficiencies higher than 40% are expected. Among the studies on the performance optimization of a KC, a solar thermal Kalina cycle equipped with a storage system was investigated by Wang et al. [14] and optimized by a genetic algorithm.
Recently, Cao et al. [15] analyzed two novel configurations of the KC employing a flash vessel: Kalina flash cycle (KFC). They conducted an analysis of low-grade heat recovery performance of the system, and their results of thermodynamic and economic analysis show that the optimal solutions of KFCs are superior to KC. The result of recent thermodynamic performance analysis by Kim et al. [16] also confirms superiority of KFC to KC.
Exergy analysis is a universal method for evaluating the rational use of energy that can be applied to any kind of energy conversion system, can identify the location, magnitude and causes of thermodynamic inefficiencies, and enhances understanding of the energy conversion processes in complex systems [17]. Ebrahimi et al. [18] conducted a data-driven exergy analysis of a grid connected underwater compressed air energy storage facility. In this work, exergetical performance of KC and KFC driven by renewable energy is comparatively analyzed. Key parameters are ammonia concentration, flash pressure, and separator pressure and the effects of these parameters on the system’s exergy efficiency and exergy destruction ratios of the main components are systematically investigated.

2. Materials and Methods

The schematic diagrams of the (a) Kalina cycle (KC) and the (b) Kalina flash cycle (KFC) are shown in Figure 1. As these two systems are the same except for the added components of the flash vessel and turbine 2, the same location numbers in KC are allotted to the corresponding locations in the KFC and a pair of dual numbers are used to simply bypass the missing components. KFC consists of a heat-recovery vapor generator (HRVG), separator, flash vessel, turbines 1 and 2, throttle valve, mixer, condenser, pump, and regenerator.
The processes in KFC are as follows [15]: the ammonia solution in water with basic mass fraction of xb and at pressure and temperature of PH and TH vaporizes in HRVG. The fluid of two-phase flow (state 1) out of HRVG then enters the separator and is separated into vapor (state 2) and solution (state 3). The solution from separator is delivered to the flash vessel and flashed. After flashing, the fluid is divided into secondary vapor (state 4) and secondary solution (state 5) at pressure Pf. The primary vapor from separator enters and leaves turbine 1 after producing power (state 6), and the secondary vapor from flash vessel enters and leaves turbine 2 after producing additional power (state 7), and two exhaust fluids mix together (state 10). The secondary solution from the flash vessel is cooled in regenerator (state 8), throttled (state 9), and mixed with the fluid from two turbines (state 11). In the condenser the fluid completely condenses to a liquid at saturation temperature of TL (state 12). A cycle is completed when the working fluid is pressurized (state 13) and preheated (state 14), and then enters HRVG. Aside from the working fluid, two fluids are additionally involved in the cycle operation: a source fluid of air and a coolant of water. The source fluid makes the working fluid vaporize at HRVG with its sensible heat corresponding to the difference between temperatures at the inlet of Ts (state 15) and the outlet of Tso (state 16). The temperature of coolant rises from Tc at the inlet (state 17) to Tco at the outlet (state 18) of the condenser.
For the convenience of simulation the system is assumed to satisfy the following simplifications:
(1)
The cycle operates as a steady process.
(2)
Pressure drops such as in the pipe lines are negligible.
(3)
Heat loss at any component is negligible.
(4)
The pump and turbines operate with constant isentropic efficiencies.
(5)
The heat exchangers operate with constant pinch point temperature differences.
(6)
Both vapor and liquid phases of the mixture are saturated at the exits of separator and flash vessel.
When the mass flow rate at any location is denoted by subscripted m and its enthalpy by h, mass flow rates through the HRVG, turbines, flash vessel, and regenerator are determined from the mass and energy conservations as follows:
m 1 = m s c p s T s T s o h 1 h 14
m 2 = m 1 h 1 h 3 h 2 h 3
m 3 = m 1 m 2
m 4 = m 3 h 3 h 5 h 4 h 5
m 5 = m 3 m 4
Here, ms denotes the source’s specified mass flow rate and cps denotes its isobaric specific heat.
The heat transfer rates at HRVG, regenerator, and condenser, denoted by Qs, Qr, and Qc can be determined from the enthalpy changes of the working fluid and given by:
Q s = m 1 ( h 1 h 14 )
Q r = m 5 ( h 5 h 8 )
Q c = m 11 ( h 11 h 12 )
The powers produced by turbines, Wt1 and Wt2, and consumed by pump, Wp, can be determined in the same way. Along with the net power production, Wnet, these are given by:
W t 1 = m 2 ( h 2 h 6 )
W t 2 = m 4 ( h 4 h 7 )
W p = m 12 ( h 13 h 12 )
W n e t = W t 1 + W t 2 W p
Exergy, work potential of a system for a specified state, is equal to the amount of work it produces when its state changes to that of the surroundings through a reversible process. Under the neglect of kinetic and potential contributions, the rate of exergy flow of fluid stream is written by:
E = m [ h h 0 T 0 ( s s 0 ) ]
with s and 0 denoting the fluid entropy and the state of the surroundings, respectively [19]. A portion of exergy delivered by the source flow, Ein, is used to produce net power, Wnet; the rest is destroyed at the system components by an amount of dtot including the loss due to the coolant exhaust. That is,
E i n = E 15 E 16 = W n e t + d t o t
In this paper, ηex denotes the system’s exergy efficiency defined as the ratio of the net power production to the exergy input of the system, but the component base exergy efficiencies are not considered. Exergy destruction ratio at each component is defined in the same way. They are altogether written as follows [20]:
η e x = W n e t / E i n
D s = ( E 14 + E 15 E 1 E 16 ) / E i n
D r = ( E 5 + E 13 E 8 E 14 ) / E i n
D c = ( E 11 + E 17 E 12 E 18 ) / E i n
D f = ( E 3 E 4 E 5 ) / E i n
D v = ( E 8 E 9 ) / E i n
D m = ( E 6 + E 7 + E 9 E 11 ) / E i n
D w = ( E 2 + E 4 + E 12 E 6 E 7 E 13 W n e t ) / E i n
D c o = ( E 18 E 17 ) / E i n
Here, lower case letters from s to co, in order of appearance, refer to the HRVG, regenerator, condenser, flash vessel, valve, mixer, turbines and pump, and coolant, respectively. From the exergy balance of the system, all these ratios add up to 1:
η e x + D s + D r + D c + D f + D v + D m + D w + D c o = 1
The method of [21] is used to evaluate the properties of ammonia-water mixture, combined with the method of [20] to resolve its equilibrium conditions among the phases and elements.

3. Results and Discussion

3.1. Effects of Flash Pressure in Kalina Flash Cycle (KFC)

In this section, a Kalina flash cycle (KFC) driven by a hot air with temperature of 150 °C and mass flow rate of 1 kg/s is simulated. Table 1 lists the basic system data to be input for simulation, which are taken similar to those of [15,16] for comparison. Table 2 presents the thermodynamic and flow data at each node of KFC under the basic conditions. Here y denotes dryness factor which is defined as the ratio of the mass of vapor to the mass of mixture (liquid and vapor), thus y = 0 and y = 1 denote pure liquid and vapor, respectively. The table shows that for the ammonia mass fraction of basic solution of 60%, the mass fractions of primary and secondary vapors rise to higher than 85%, while those of primary and secondary solutions drop to around 30%; the condensing pressure is 7.54 bar.
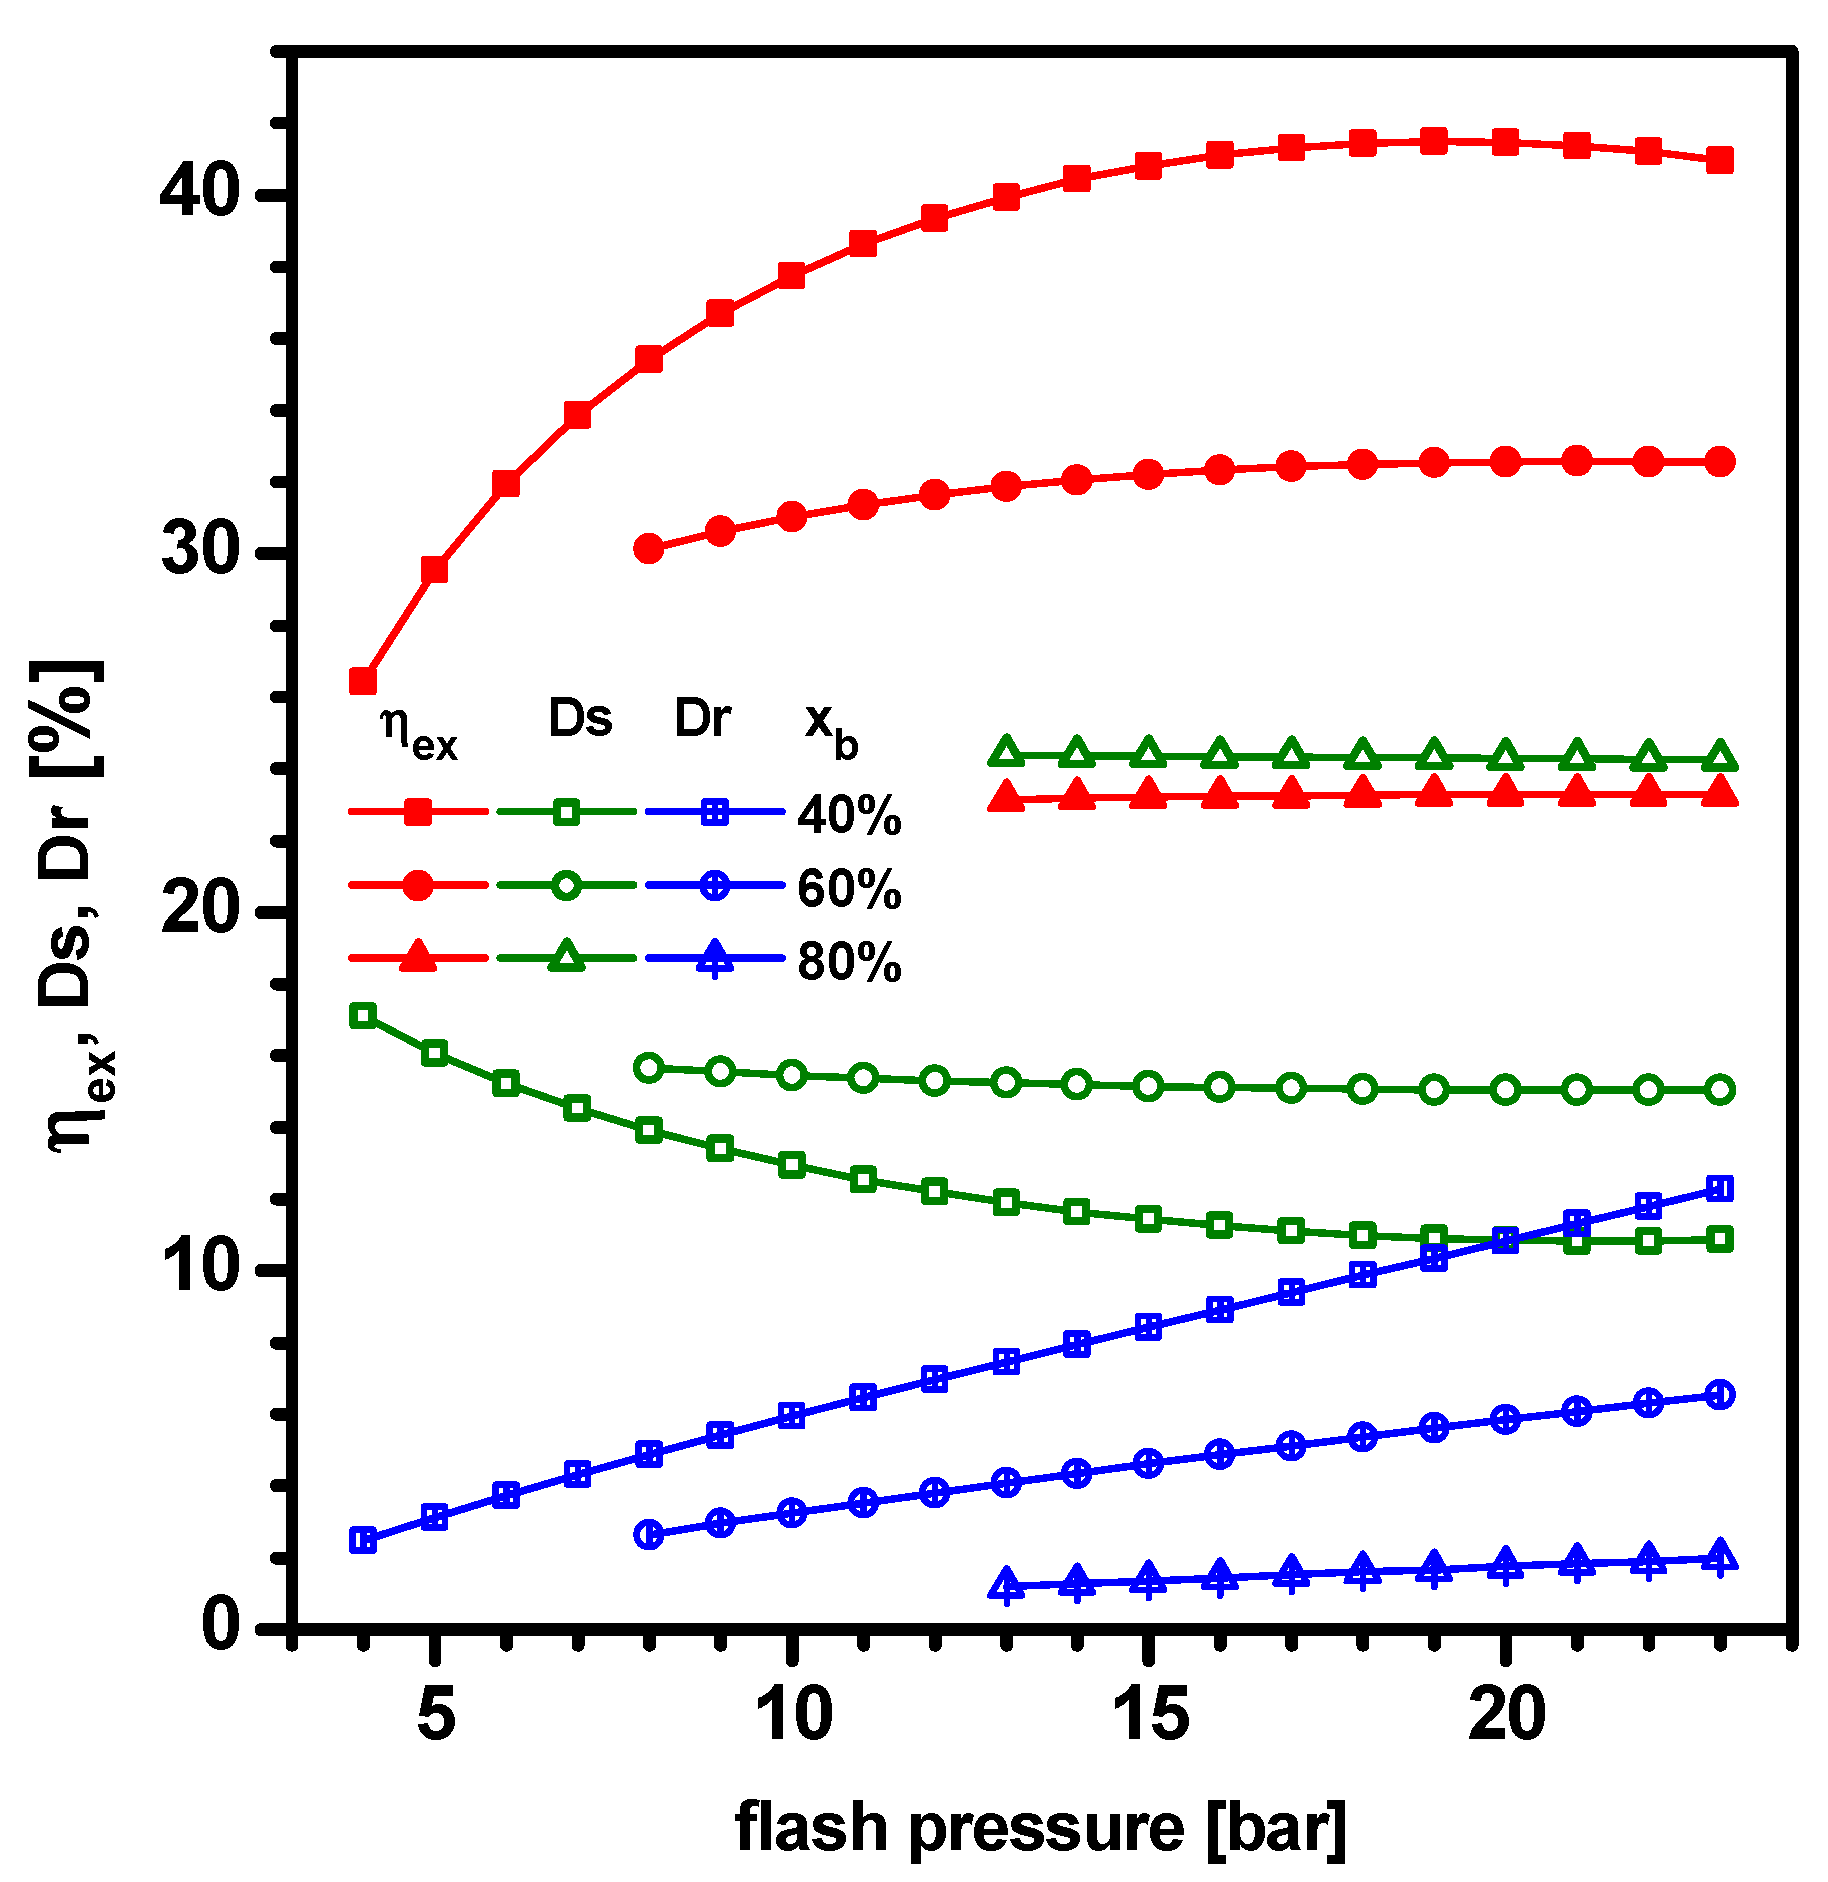
Figure 2 shows the dependence of the exergy efficiency and exergy destruction ratios of HRVG (Ds) and regenerator (Dr) on the flash pressure for ammonia fractions of 40%, 60%, and 80% in KFC. As flash pressure increases, exergy efficiency increases to reach a maximum value and decreases afterwards for xb = 40%. This behavior is the result of competition at turbine 2 between the positive effect that an increased pressure ratio enhances specific work and the negative effect of decreased mass flow rate, with increasing flash pressure. Exergy destruction ratio of regenerator is a monotonically increasing function of flash pressure owing to an enhanced heat transfer at regenerator, while exergy destruction ratio of HRVG monotonically decreases with flash pressure, which is because the working fluid enters HRVG with higher temperature and reduces heat transfer at HRVG. For a given flash pressure, exergy efficiency and exergy destruction ratio of regenerator are higher, but exergy destruction ratio of HRVG is lower for higher ammonia concentrations. The changing slopes of the exergy efficiency, and the ratios of exergy destruction of HRVG and regenerator, with respect to flash pressure are very gradual for the highest value of 80%; this implies that their changing slopes decrease with increasing ammonia concentration. It can be explained as follows. As the ammonia mass fraction becomes higher, the dryness factor of the working fluid at the end of HRVG becomes greater, which leads to higher mass flow rate at TB1 (m2), and lower mass flow rate to the flash vessel (m3) [16]. Consequently, the ratio of TB1 power production to total output decreases, and the effects of flashing on the heat transfers at regenerator and HRVG are reduced.
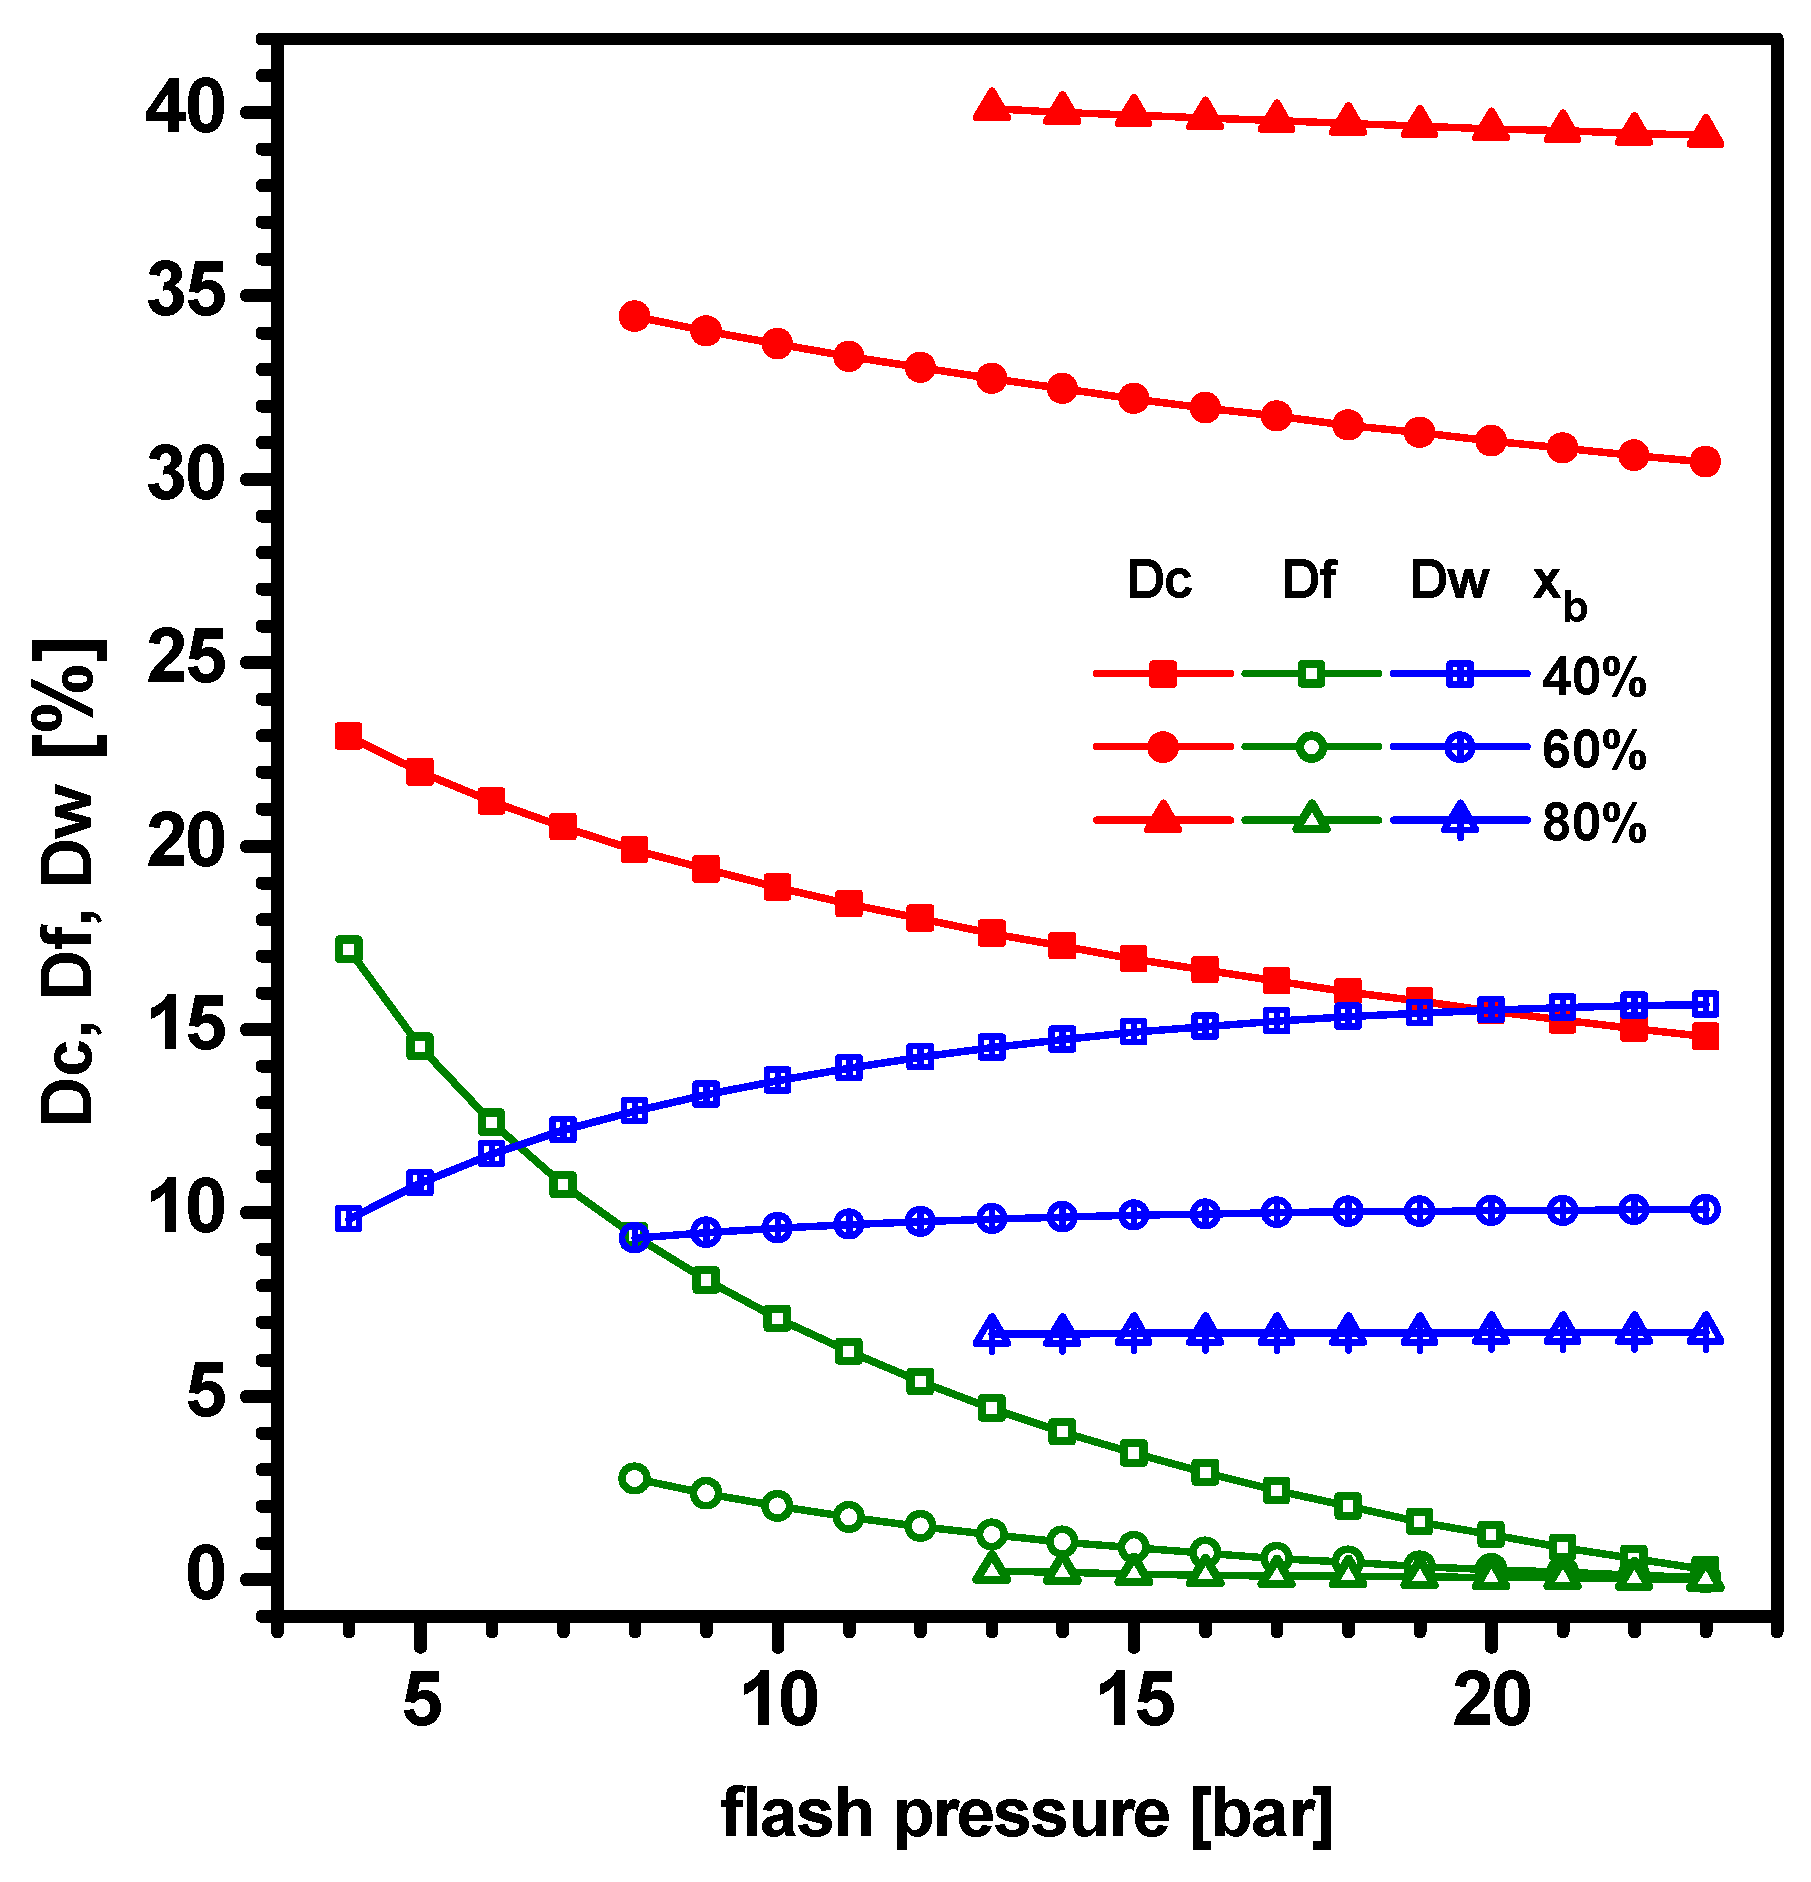
Figure 3 shows the dependence of exergy destruction ratios of condenser (Dc), flash vessel (Df), and power components (Dw) on the flash pressure for ammonia fractions of 40%, 60%, and 80% in KFC. As flash pressure increases, exergy destruction ratio of condenser decreases due to the decreased heat transfer at condenser, and that of the flash vessel decreases because of the declined difference of the separator pressure and flash pressure. But the exergy destruction ratio of power components increases with the increase of flash pressure because the resulting higher pressure drop in turbine 2 enhances power production. When flash pressure is specified, making the mixture richer in ammonia results in an increase of exergy destruction of the condenser and decreases of exergy destruction of the flash vessel and power components. All of them change more slowly against flash pressure as the ammonia fraction increases.
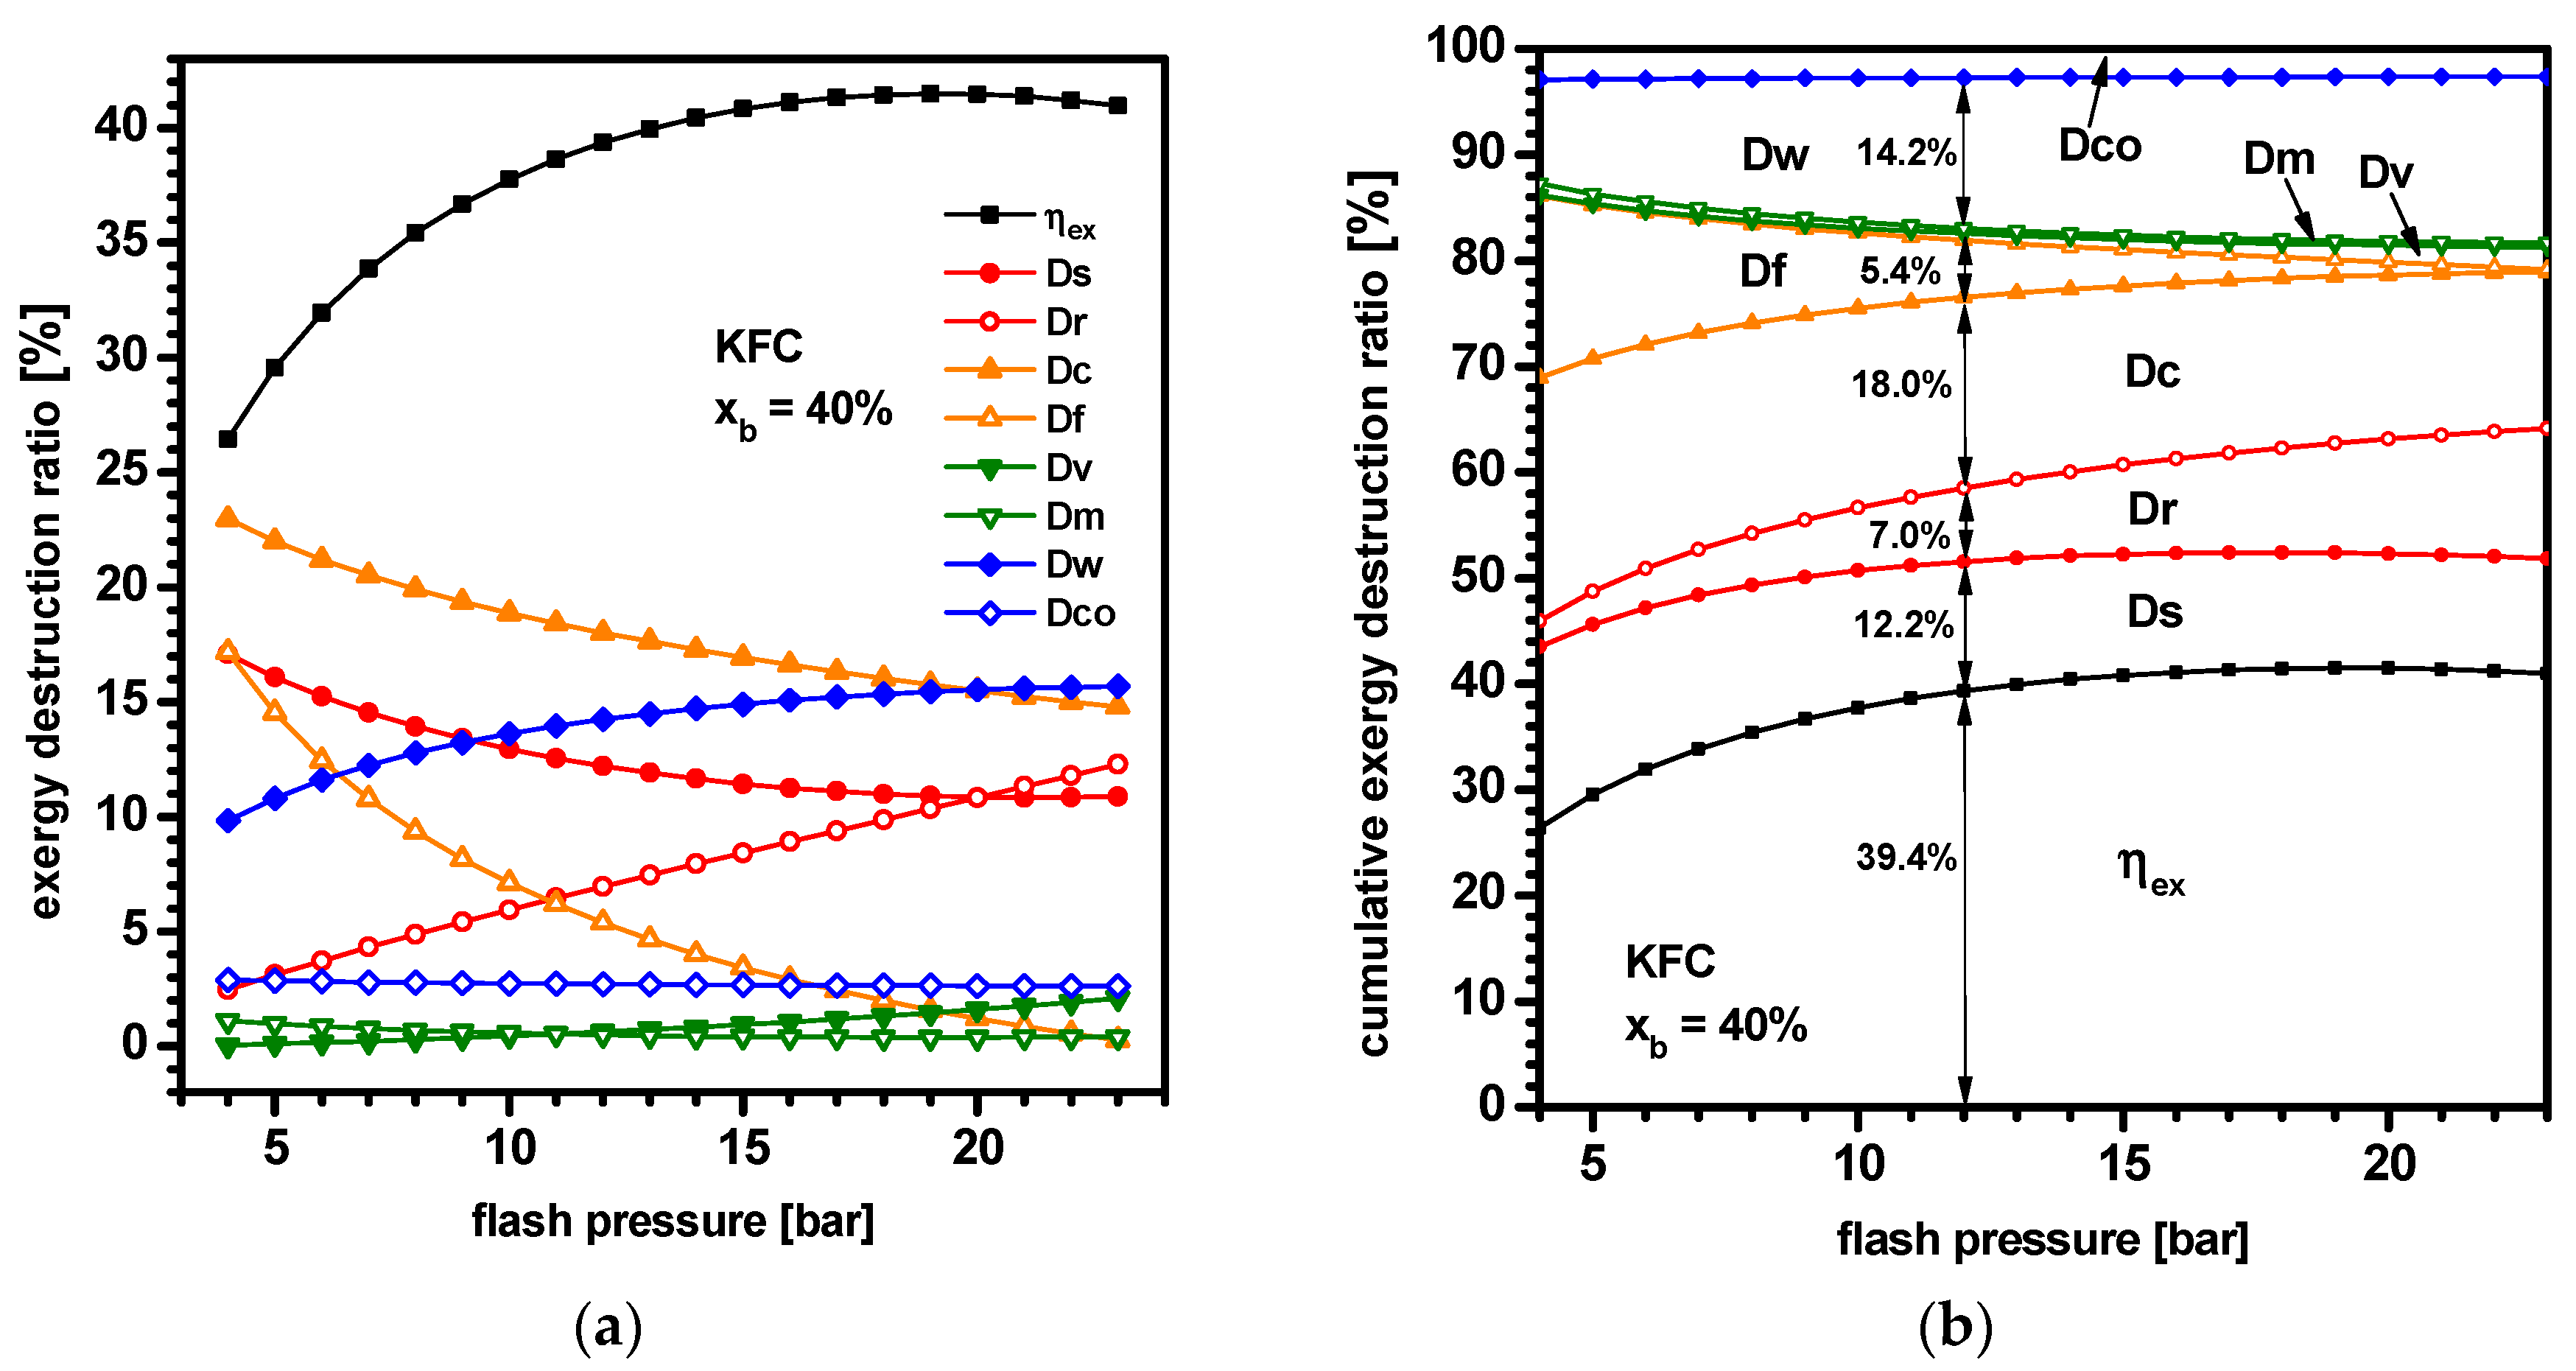
Figure 4 shows the dependence of (a) separate and (b) cumulative ratios of exergy consumption on the flash pressure for the ammonia mass fraction of 40%. As seen from Equation (24), the sum of the exergy efficiency and total exergy destruction ratios equals unity, and the distributions of the exergy efficiency and exergy destruction ratio are usually represented with the band graphs or pie charts. In the cumulative graphs [22,23], the magnitude of the exergy efficiency or an exergy destruction ratio is denoted as the distance between the non-crossing data lines. Therefore, the cumulative graph for a specified flash pressure corresponds to a single band graph and a cumulative graph can be considered as the two-dimensionally extended band graph for varying values of the flash pressure. Example data of separate and cumulative ratios of exergy consumption for xb = 40% and Pf = 12 bar are listed in Table 3, and also numerically illustrated in Figure 4b. A maximum point exists in the exergy efficiency (ηex) curve. As flash pressure increases, exergy destruction ratios of power components (Dw) and regenerator (Dr) increase; by contrast, exergy destruction ratios of condenser (Dc), HRVG (Ds), and flash vessel (Df) decrease. The exergy destruction ratios of the rest components (Dm, Dv, Dco) are lower than 3% and insignificant. Of all components, exergy destruction ratio of flash vessel decreases most rapidly: from 17.2% at 4 bar to 0.3% at 23 bar. The largest exergy destruction occurs in a condenser for flash pressures below 20 bar, and in power components above 20 bar. For example, at flash pressure of 5 bar and xb = 40%, Figure 4 shows that ηex = 29.6%, Ds = 16.1% (second), Dr = 3.1%, Dc = 22.0% (highest), Df = 14.5% (third), Dv = 0.1%, Dm = 0.1%, Dw = 10.8%, and Dco = 2.9%. Therefore, the top three sources of exergy destruction are condenser, HRVG, and flash vessel.
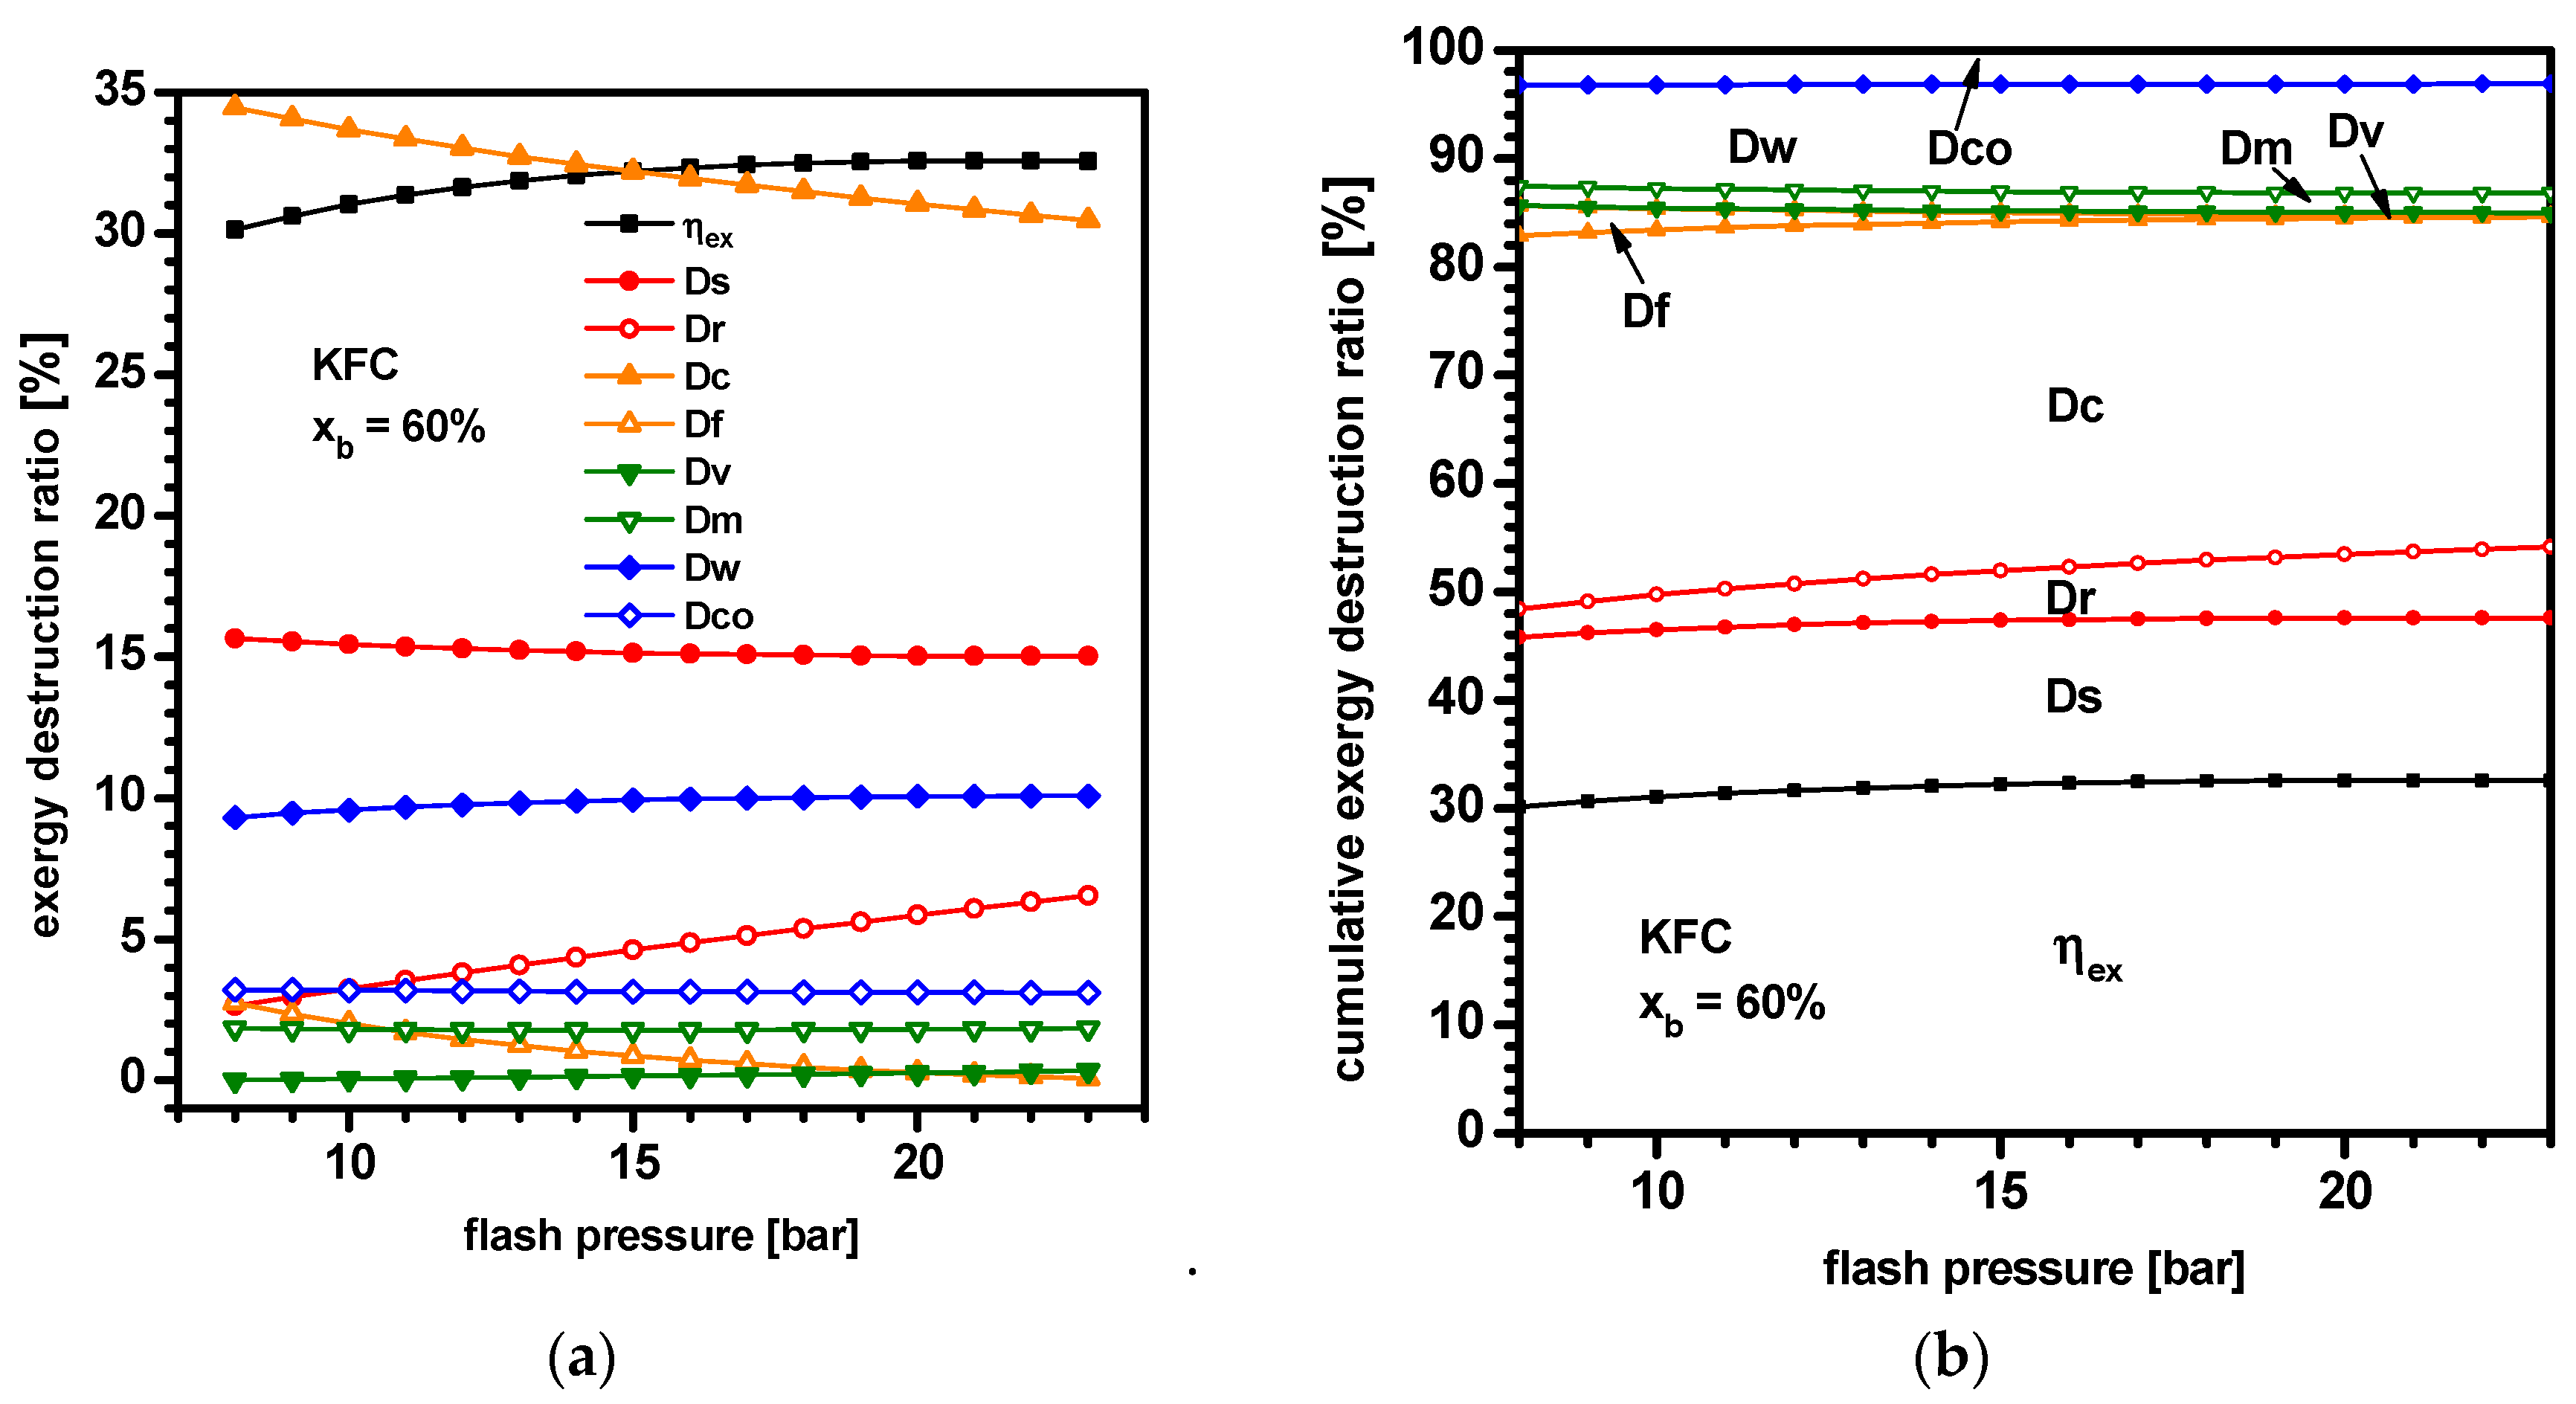
Figure 5 shows the dependence of (a) separate and (b) cumulative ratios of exergy consumption on the flash pressure for the ammonia mass fraction (xb) of 60%. Similar to the case of xb = 40%, the exergy efficiency (ηex) curve has a maximum value; the exergy destruction ratio of the regenerator (Dr) increases, and the ratios of the condenser (Dc) and flash vessel (Df) decrease as the flash pressure increases. However, the exergy consumption ratios change quite gradually compared with the case of xb = 40%. The top three exergy destructions occur in the condenser, HRVG, and power components with the magnitude in descending order.

3.2. Performance of Kalina Cycle (KC) and KFC with Optimal Flash Pressures

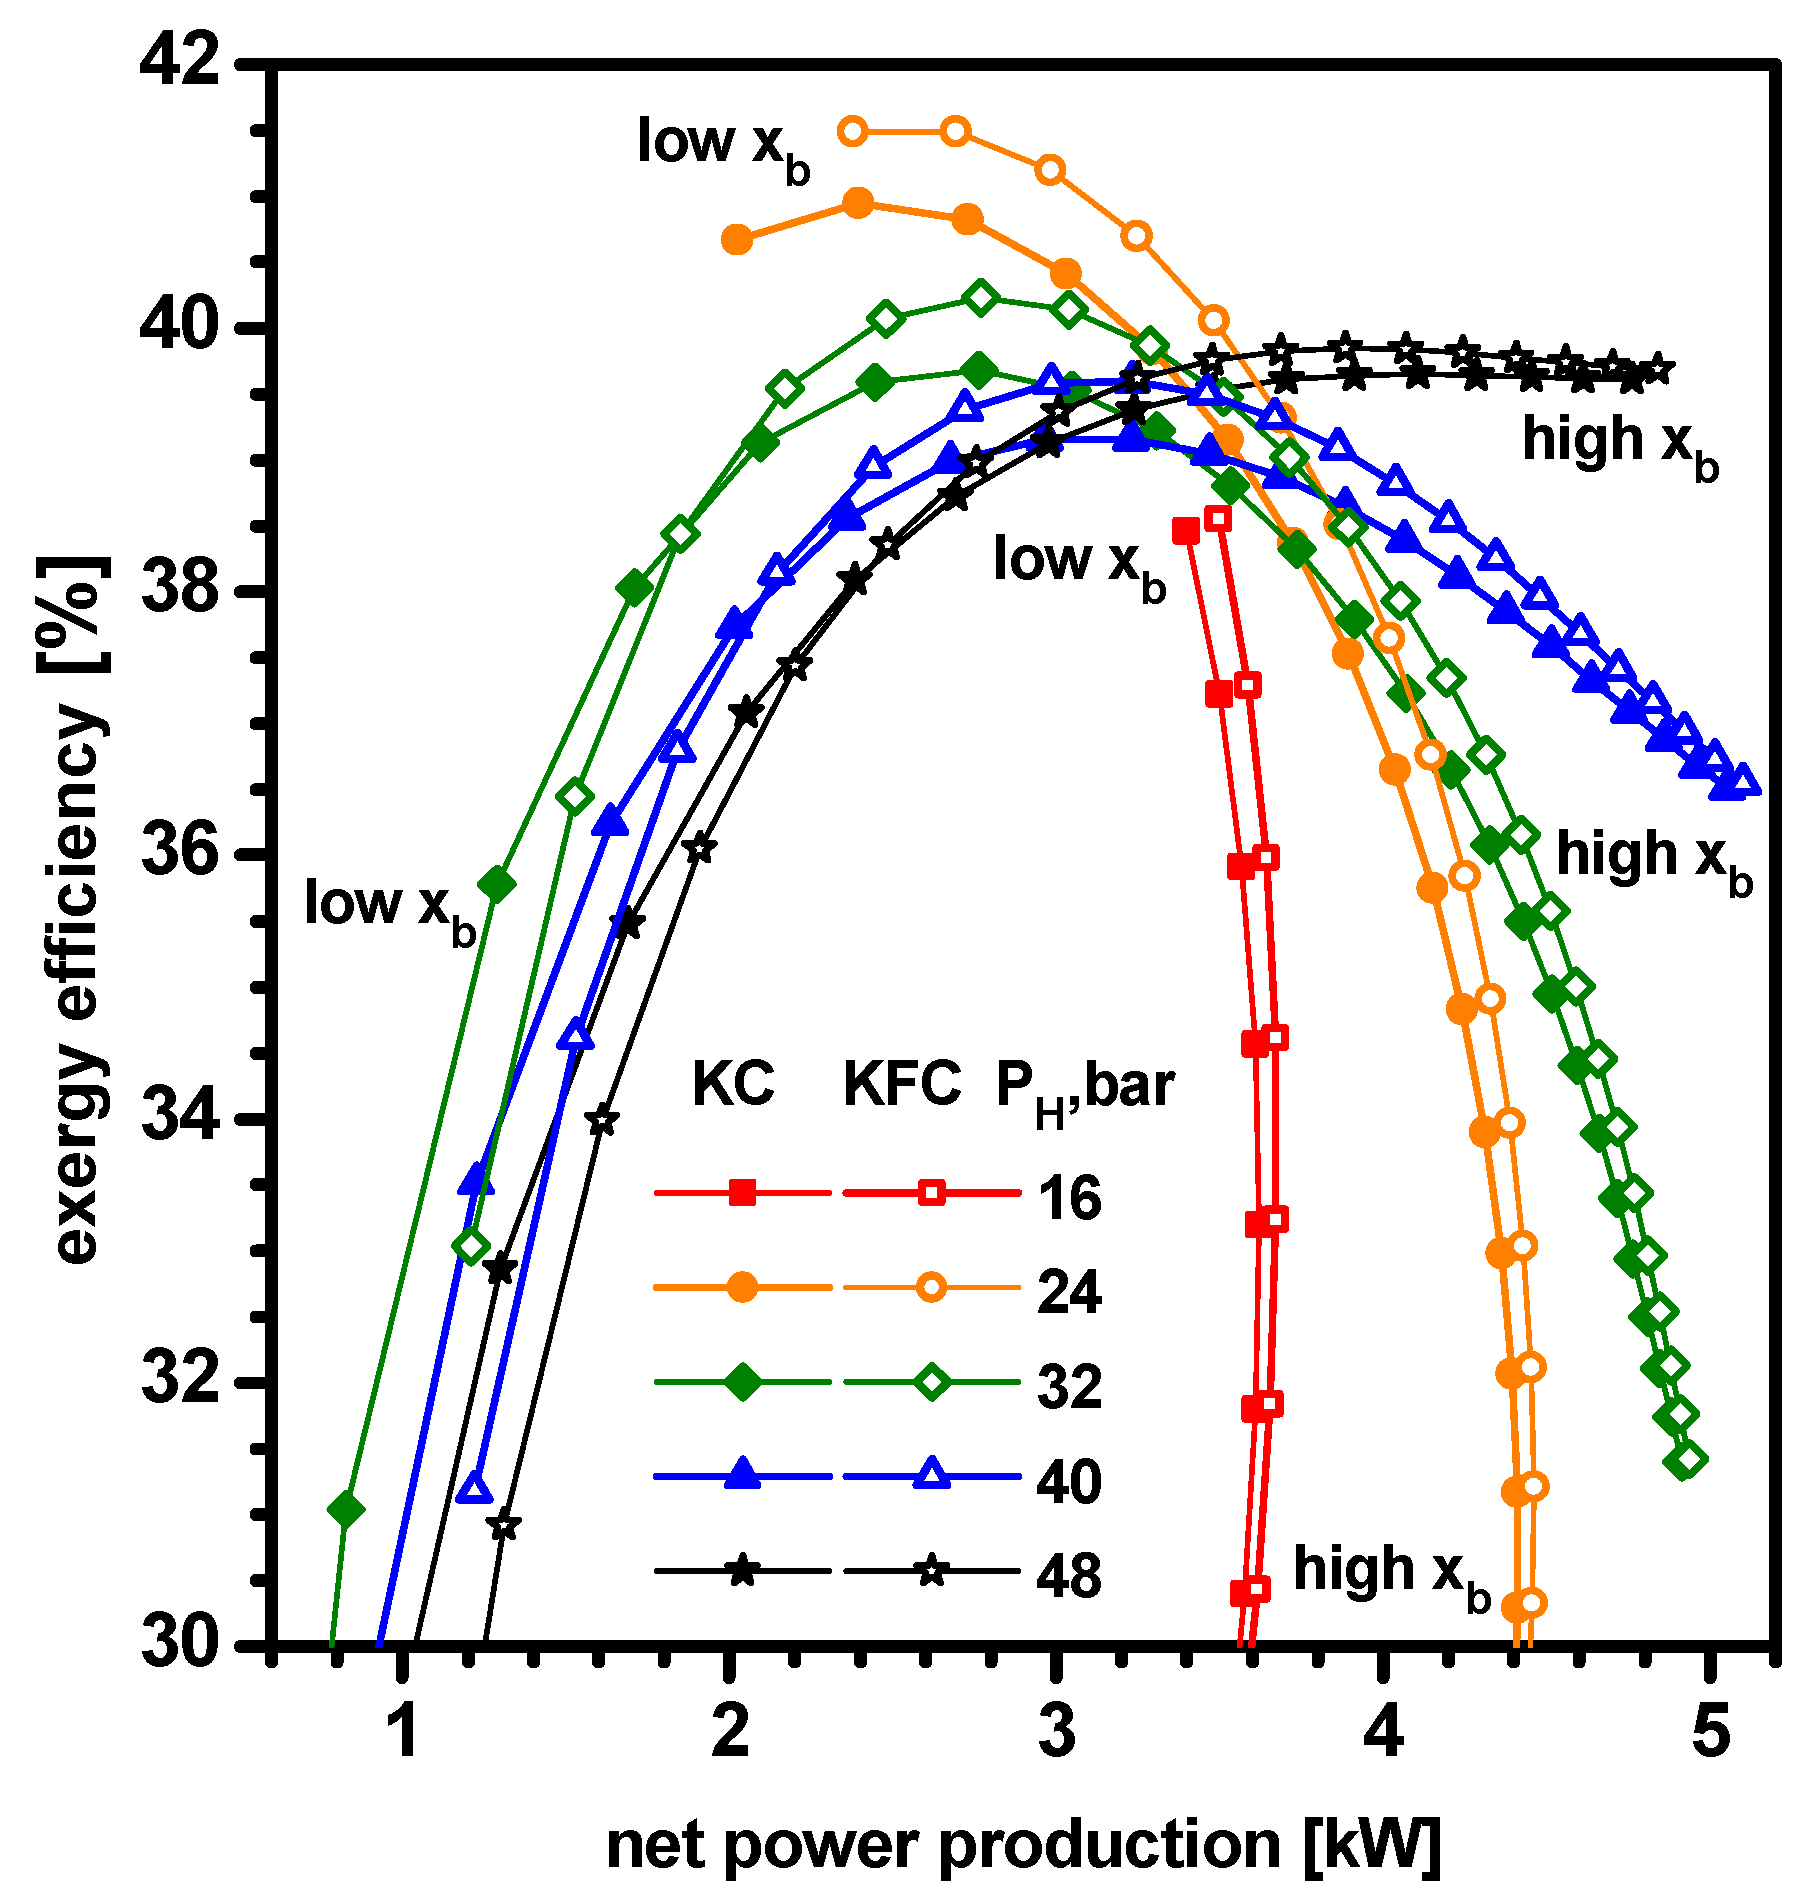
In this section, the exergetical performance of KC and KFC are comparatively investigated, in which the pressure of the flash vessel installed only in KFC is assumed to be a pressure yielding the maximum exergy efficiency for a specified set of other parameter values. Figure 6 is the characteristic diagram of net power vs. exergy efficiency illustrating the system performance of KC and KFC for the ammonia fraction, xb, from 40% to 80% and separator pressure, PH, from 16 bar to 48 bar. In both systems, net power has a local maximum when the separator pressure is low (16, 24 bar); while it monotonically increases with the ammonia fraction, i.e., to the right, at higher separator pressures (32, 40, 48 bar). By contrast, exergy efficiency has a local maximum when the separator pressure is high (24, 32, 40, 48 bar) and monotonically decreases with ammonia fraction, i.e., downward, at the lowest pressure of 16 bar. For each separator pressure the ammonia fraction producing maximum net power is higher than that yielding maximum exergy efficiency. With respect to separator pressure, maximum net power production shows an increasing–decreasing pattern, while exergy efficiency shows a decreasing–increasing pattern in the considered parameter range. The diagram clearly shows that the KFC gives higher optimal values of net power as well as exergy efficiency than KC for all separator pressures. In fact each point in the diagram representing a set of values of PH and xb of the KFC locates at the right and upper position of the corresponding point of the KC; implying better performances of the KFC.
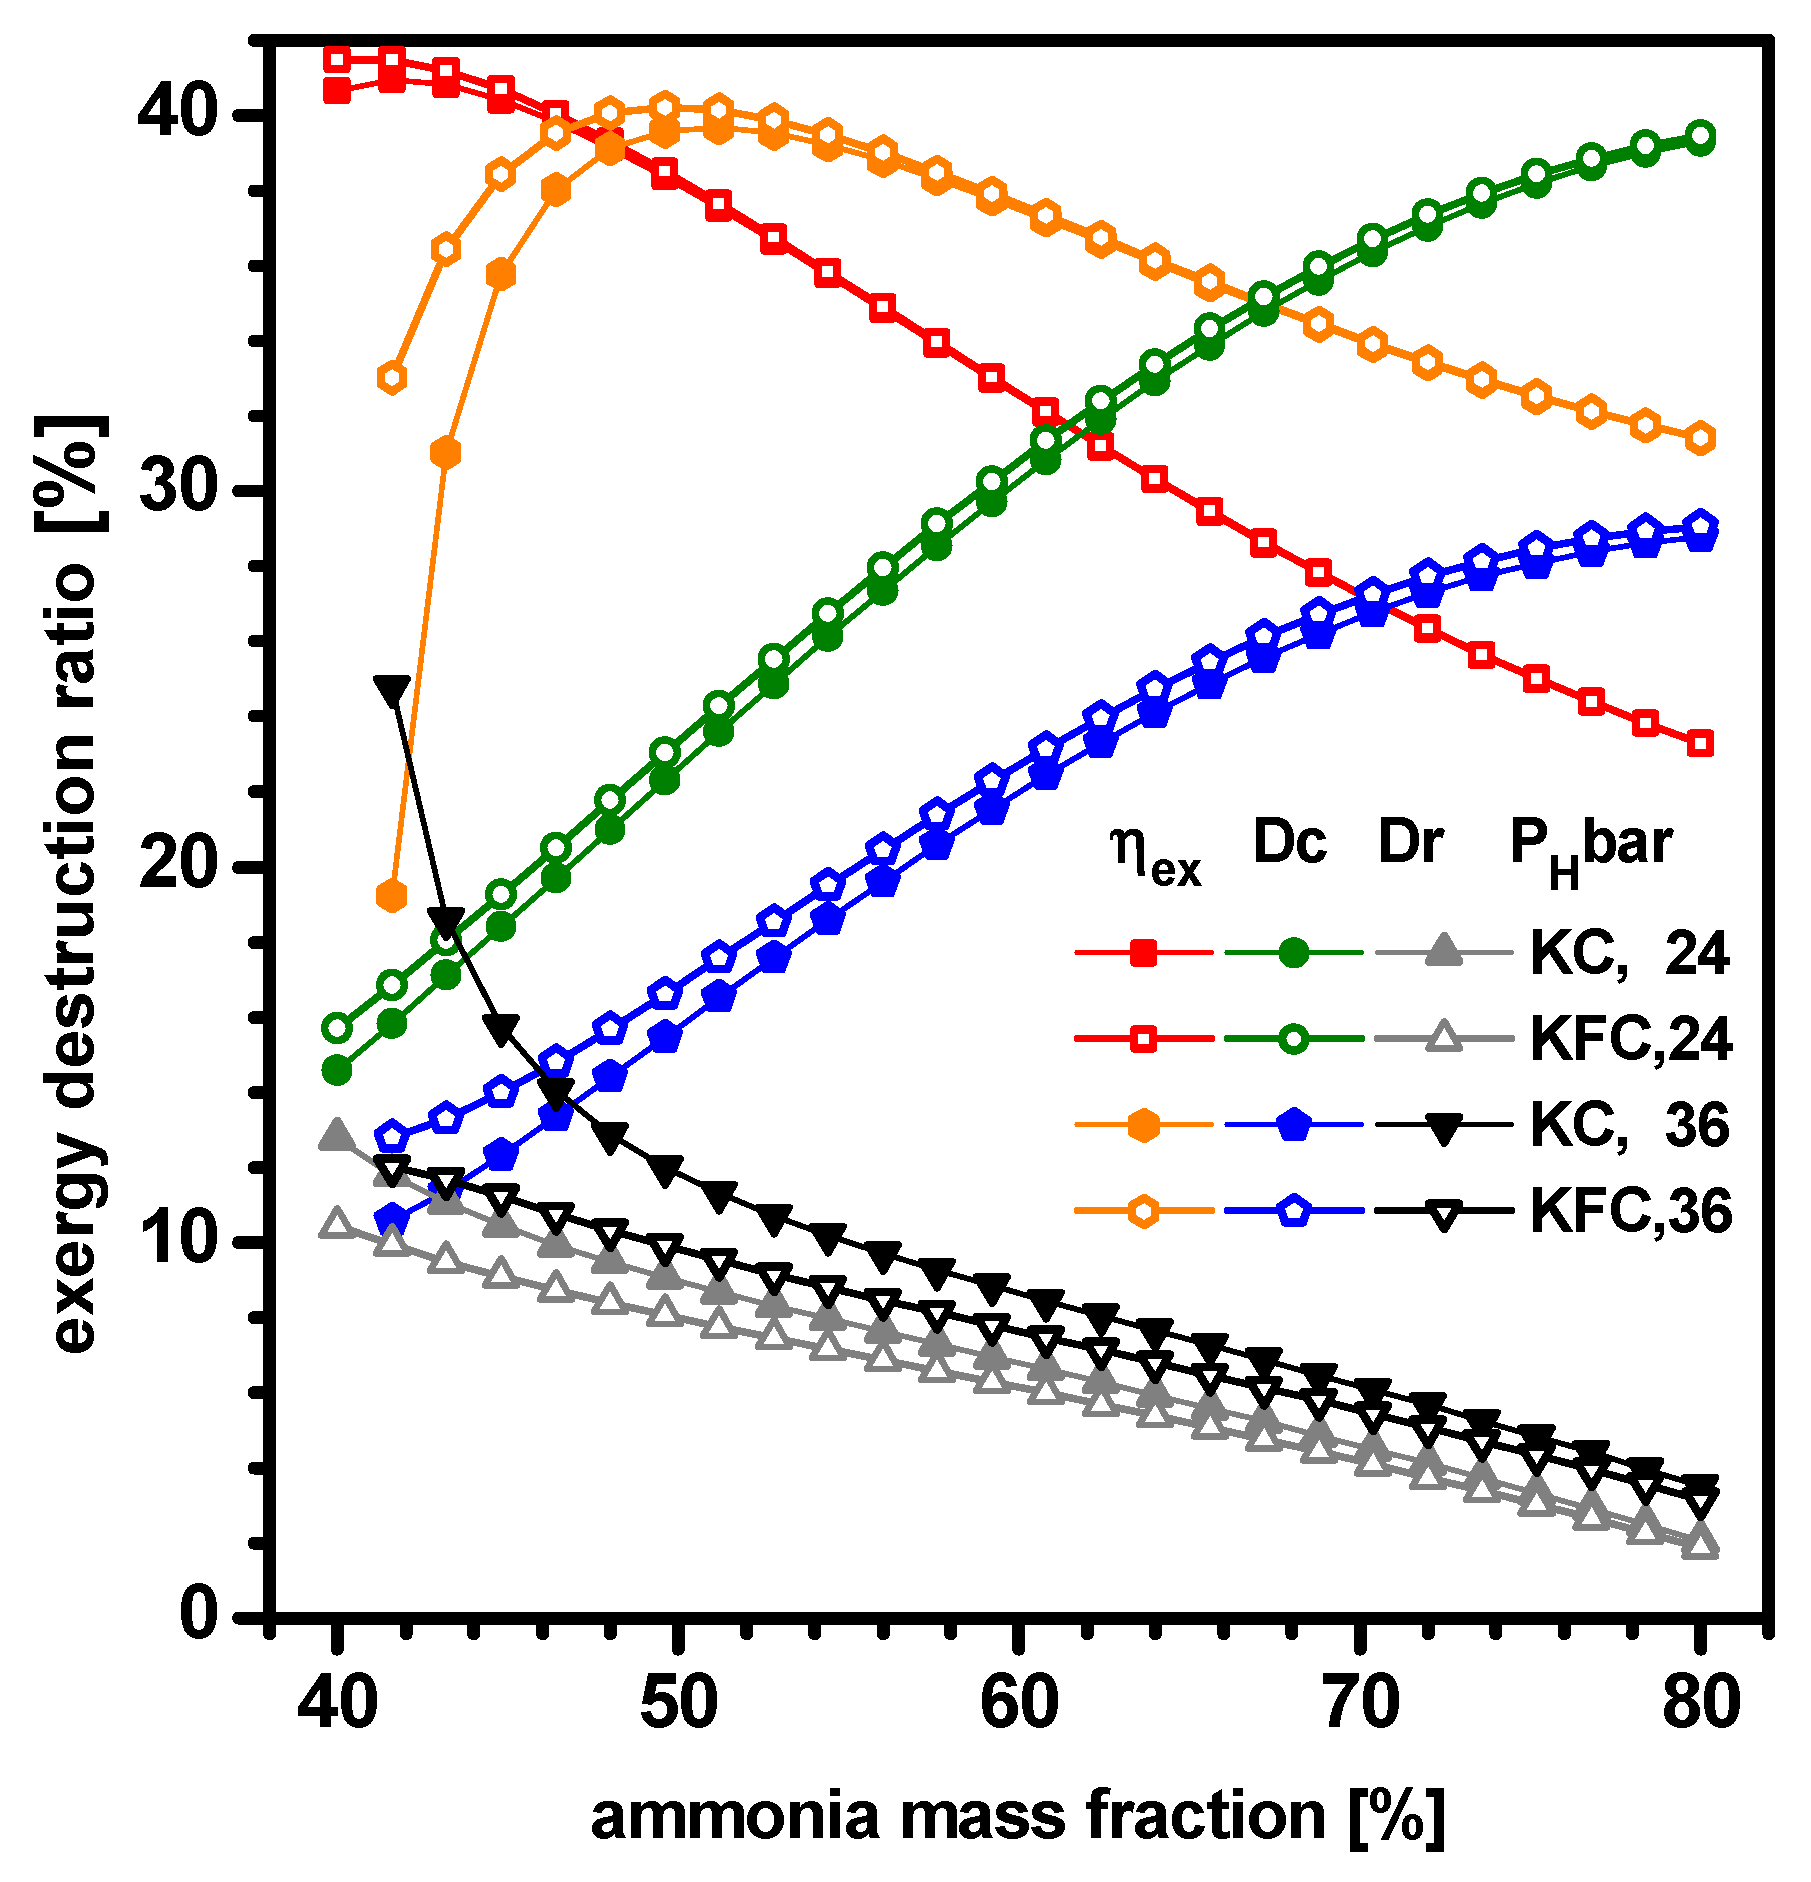
Figure 7, Figure 8 and Figure 9 are comparative illustrations of exergetical performance of the KC and KFC. Figure 7 depicts the dependence the exergy efficiency (ηex) and exergy destruction ratios of condenser (Dc) and regenerator (Dr) on the ammonia fraction (xb) for separator pressure of 24 and 36 bar. Both cycles show peak points on the exergy efficiency curves, which move to the right and downward with the rise of separator pressure. Although the gap shrinks rapidly with increasing ammonia fraction, KFC gives higher exergy efficiency than KC. Condenser heat transfer increases when the mixture becomes richer in ammonia or separator pressure is lowered. The contrary is true of the regenerator. Therefore, the ratio of exergy destruction of condenser and regenerator are monotonically increasing and decreasing function of ammonia fraction, respectively. In addition exergy is destroyed more in the condenser and less in the regenerator for lower separator pressure, respectively. The effect of flashing is also opposite in the condenser and regenerator: the exergy destruction in the condenser is larger in KFC than KC, and vice versa for the regenerator. Similar to the exergy efficiency, the gaps between the KFC and KC rapidly shrink at higher ammonia fractions. This implies that the flashing effect is more influential for ammonia-poor basic solutions.
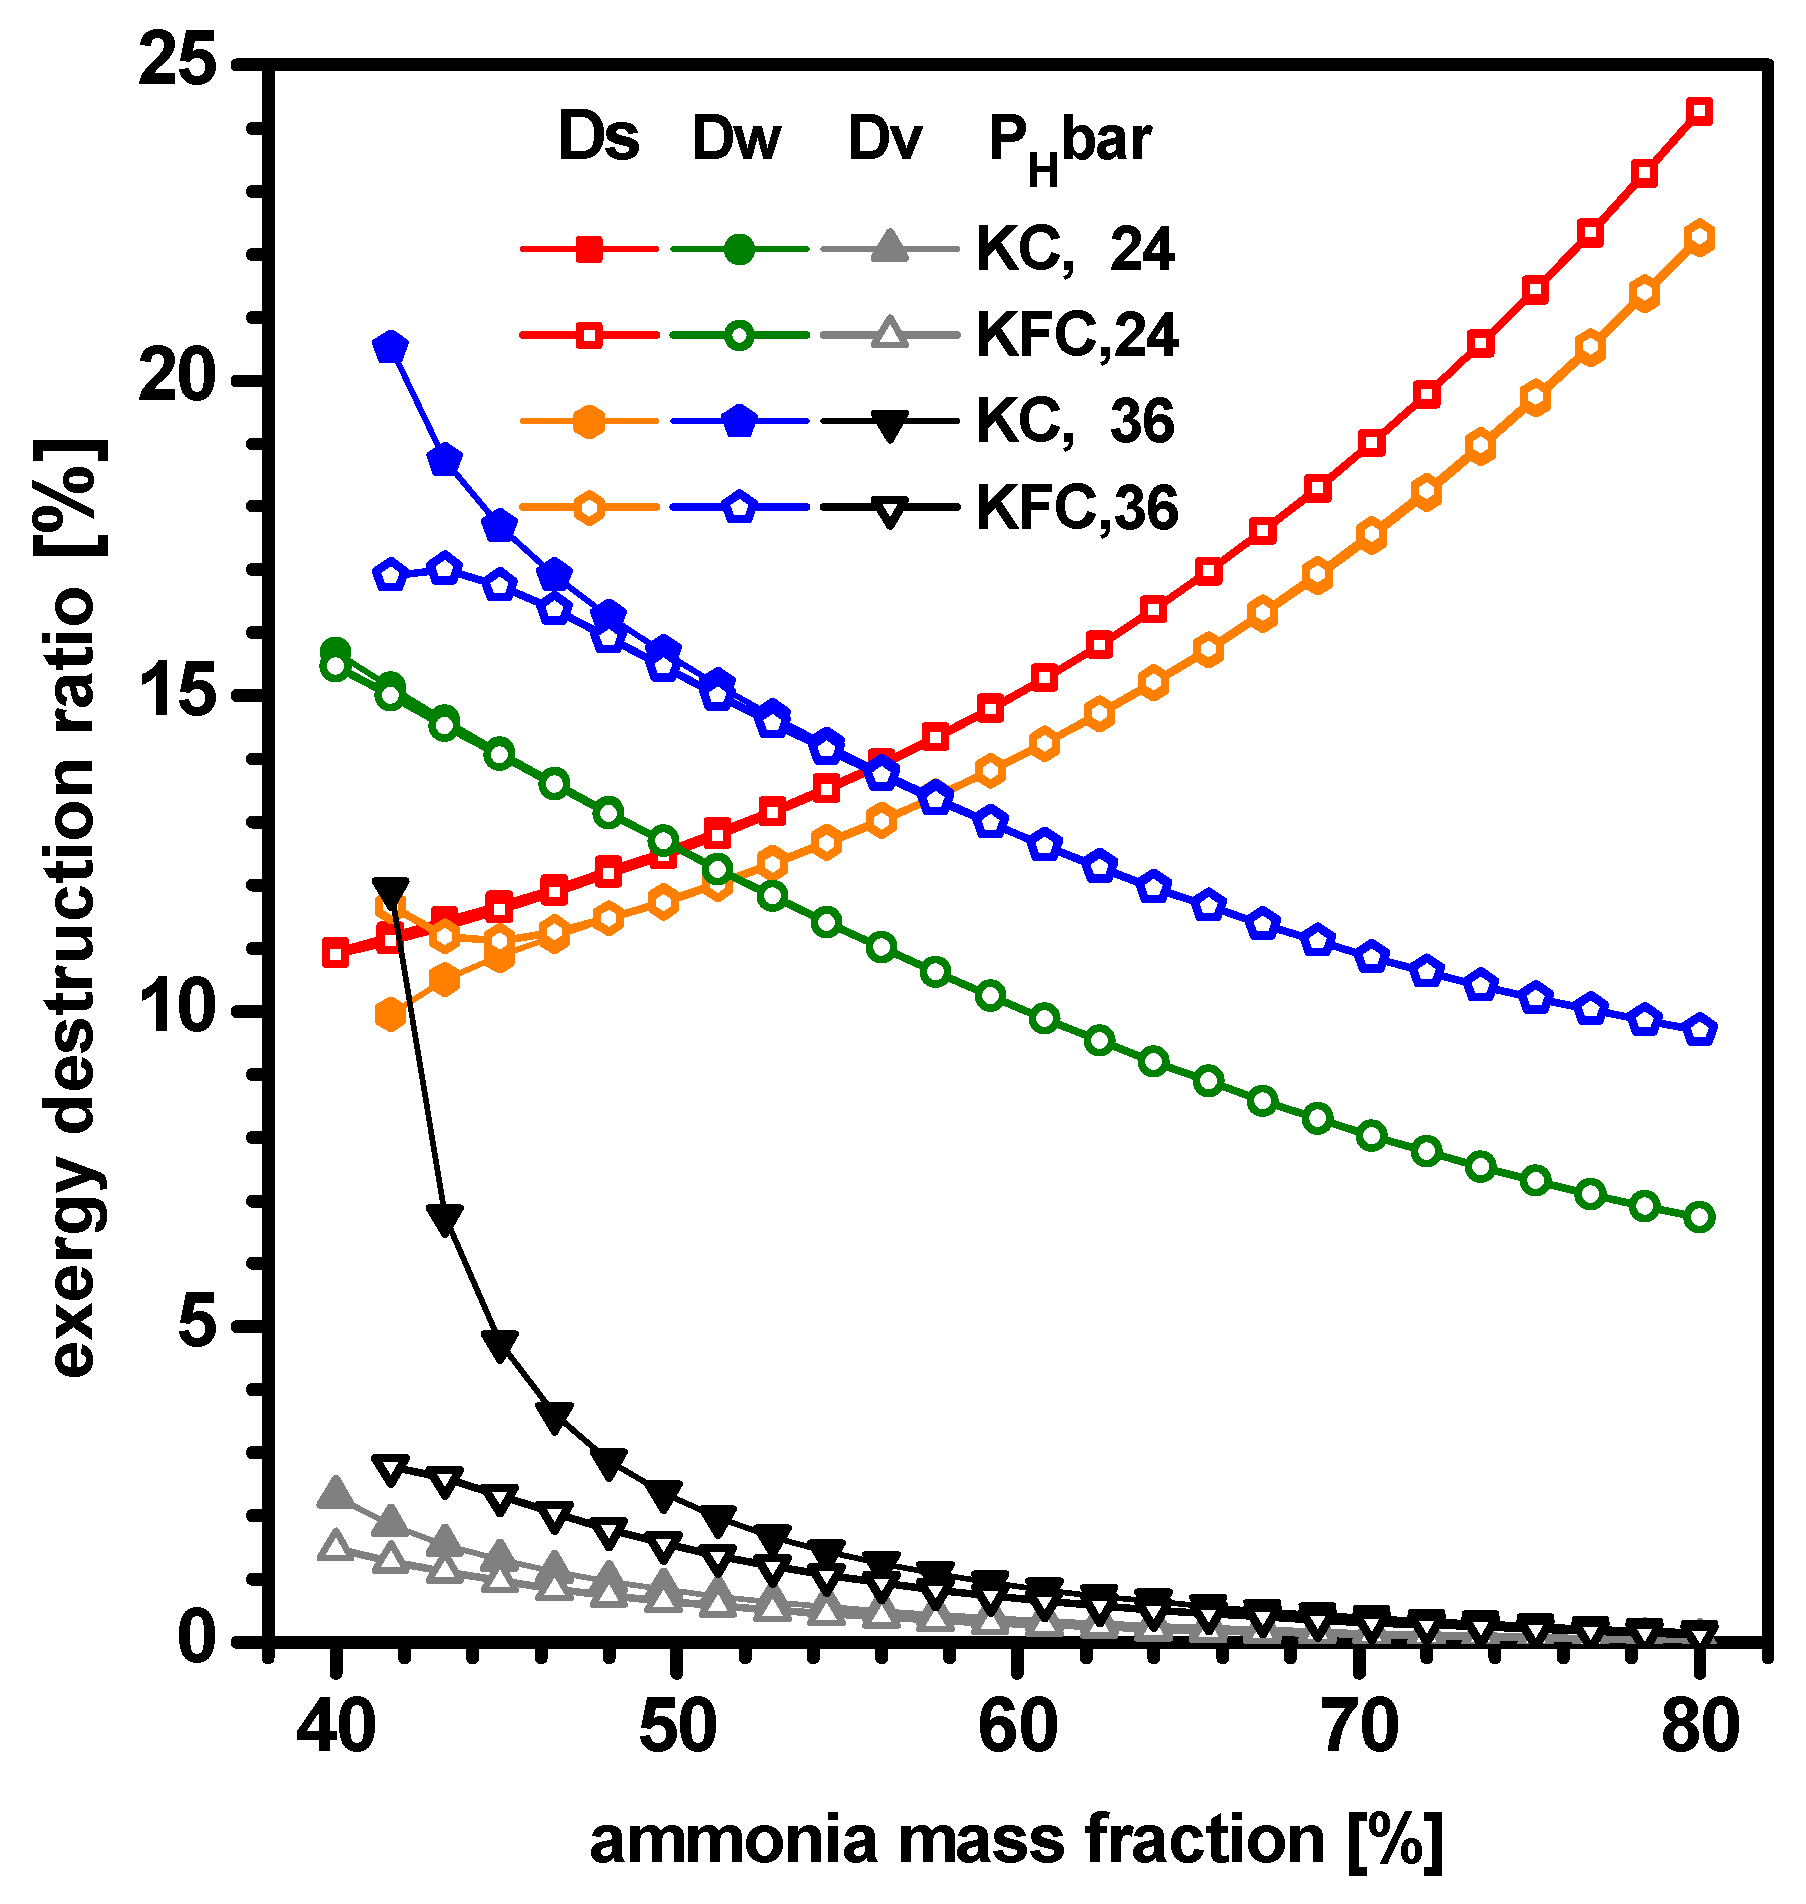
Figure 8 depicts the dependence of the exergy destruction ratios of HRVG (Ds), power components (Dw), and throttle valve (Dv) on ammonia fraction for PH = 24, 36 bar in KC and KFC. In both systems, exergy destruction at the HRVG increases with the increase of the ammonia fraction or decrease of the separator pressure, mainly because these factors enhance the heat transfer at the HRVG. By contrast, exergy destructions occurring at power components and throttle valve decrease with the increase of ammonia fraction or decrease of separator pressure. It is worth noting that the exergy destruction ratio at the power components shows a different behavior against ammonia fraction to the net power production [16]. The effect of flashing in the HRVG is also opposite to those in the power components and throttle vale: the exergy destruction in the HRVG is larger in the KFC than the KC, and vice versa for power components and throttle vale. However the difference between cycles diminishes rapidly with the increase of ammonia fraction. A big difference of the exergy destruction ratio of the throttle valve in two cycles for the low ammonia concentration range is remarkable. Note that the pressure of the working fluid plummets from flash pressure to condensing pressure through the throttle valve.
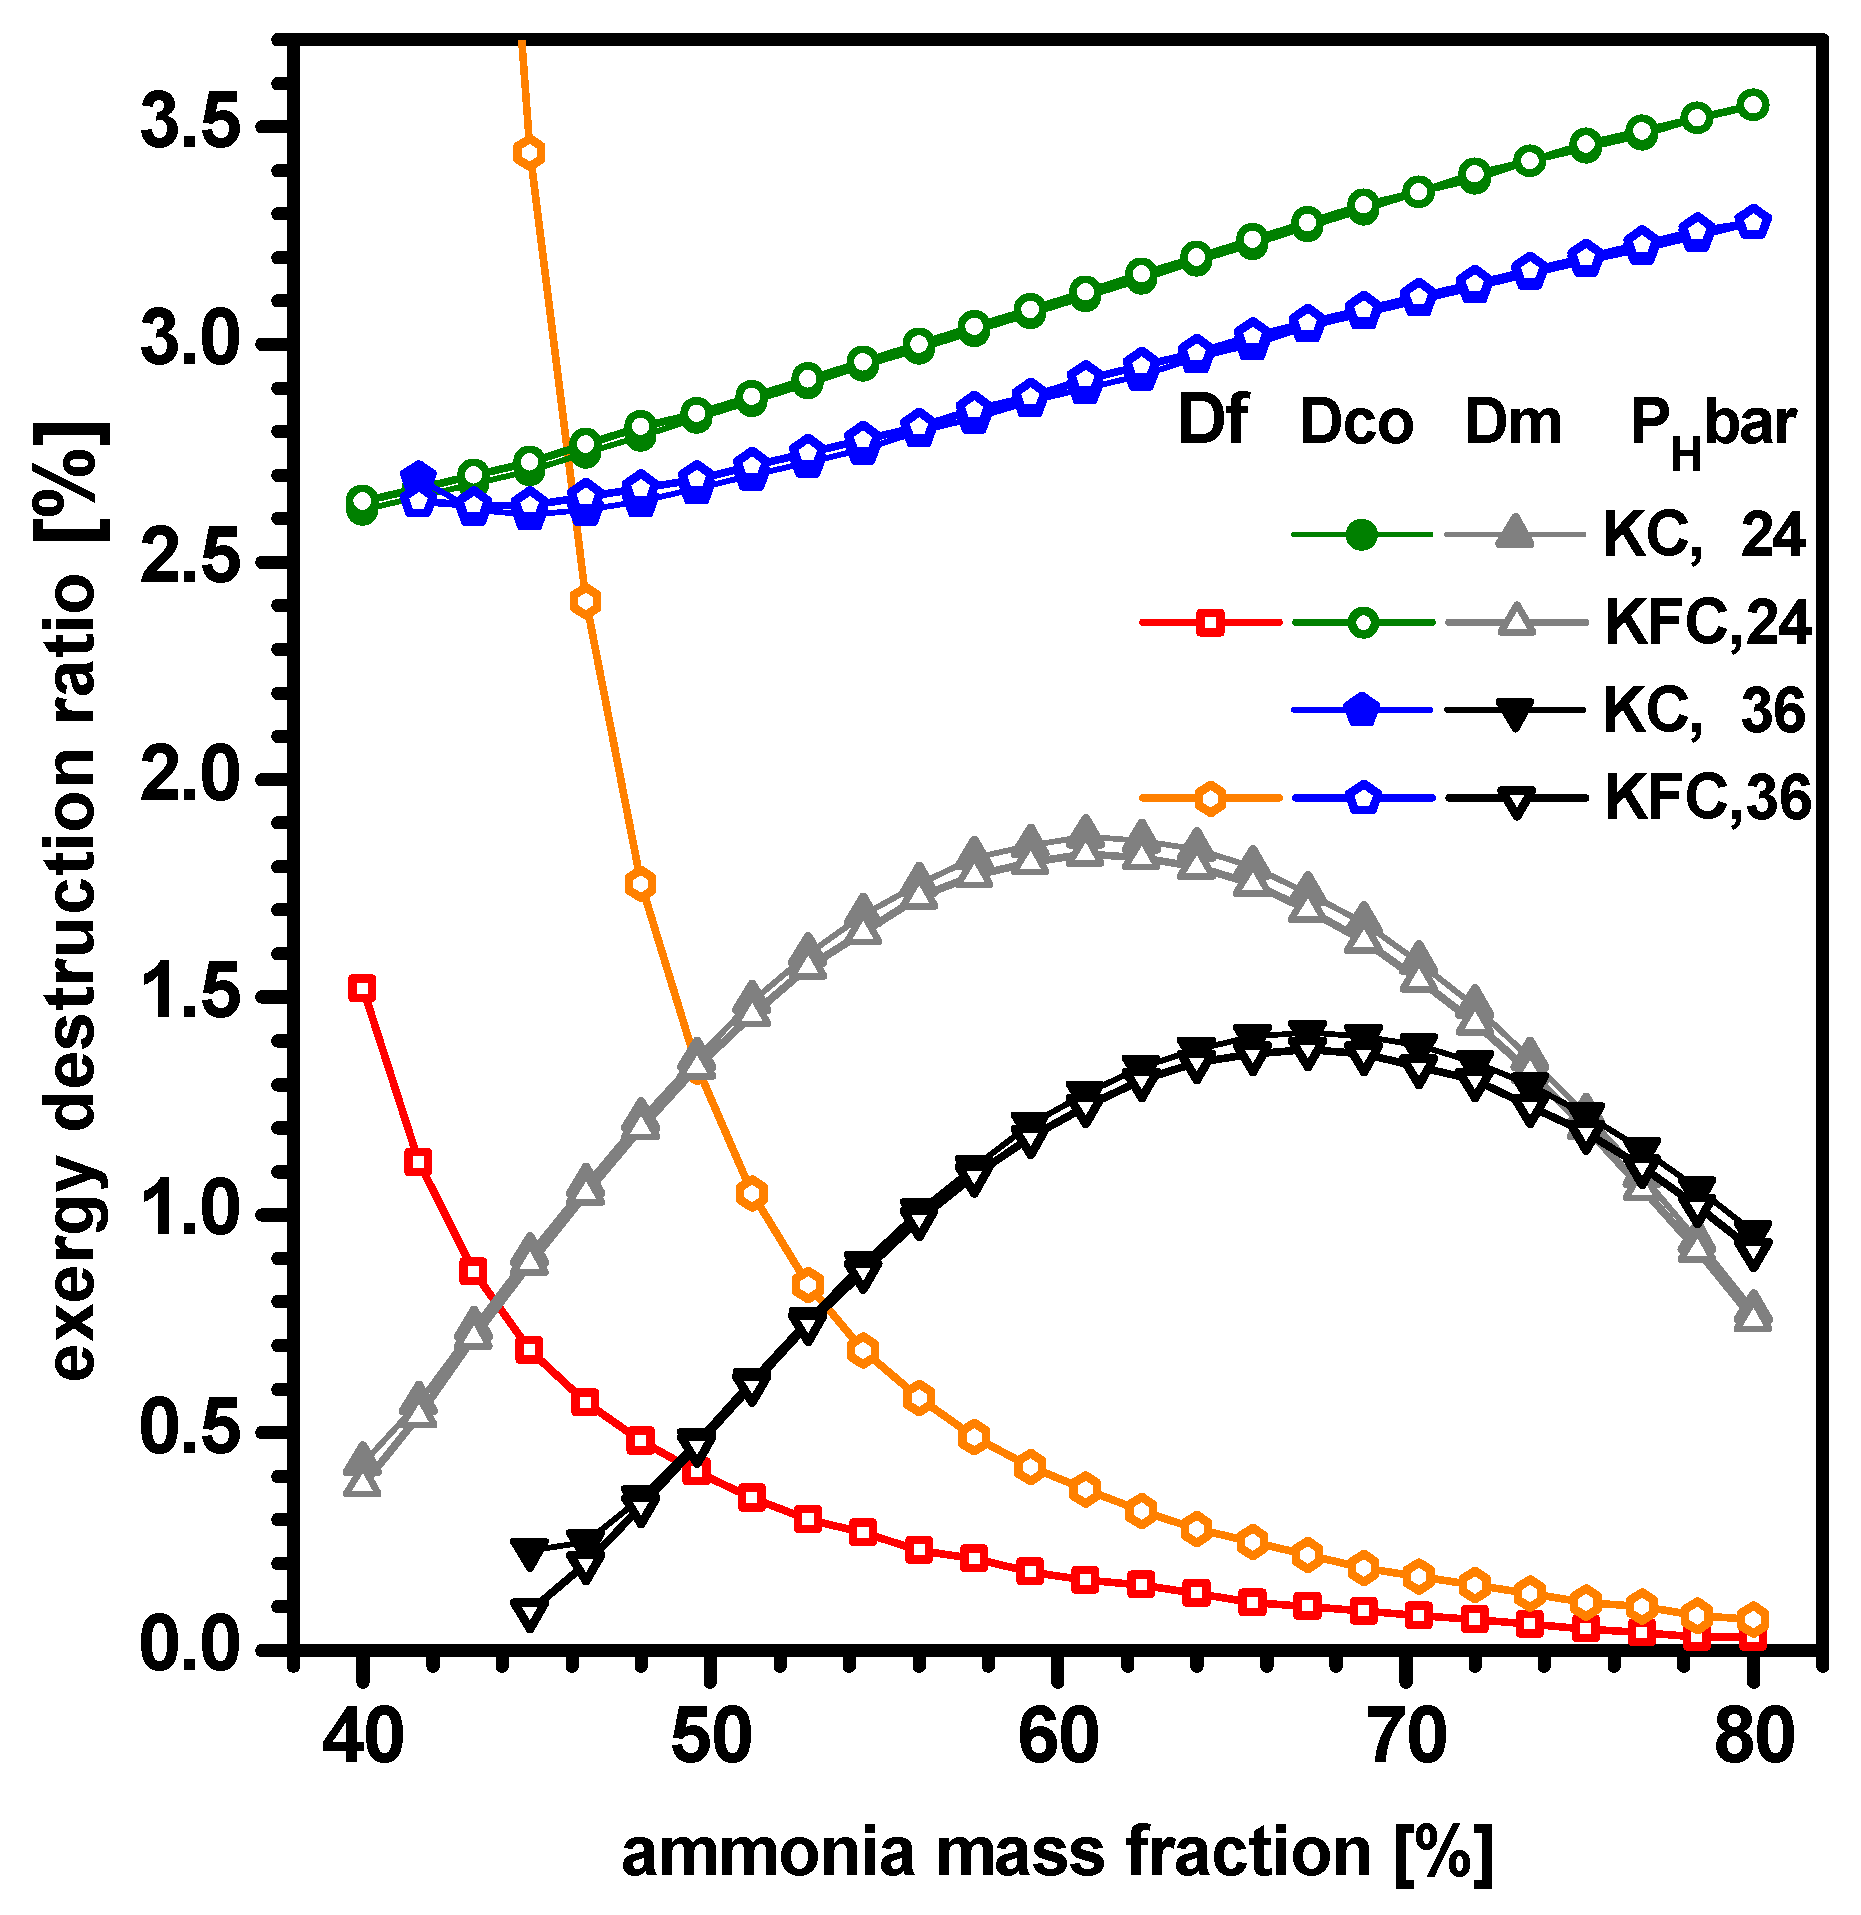
Figure 9 depicts the dependence of the ratios of exergy destroyed at the flash vessel (Df), lost through coolant exhaust (Dco), and destroyed at mixer (Dm) for PH = 24, 36 bar in the KC and KFC. In both systems, the exergy destruction at the flash vessel decreases with the increase of ammonia fraction or the decrease of the separator pressure, which is mainly caused by the effect of increase in the dryness factor in the separator and the consequent decrease in the mass flow rate at the flash vessel. Except for very low ammonia fractions and high pressure of PH = 36 bar, the exergy loss through coolant exhaust increases with the increase of ammonia fraction or decrease of separator pressure mainly because the dryness factor in separator is increased and consequently the fluid temperature at condenser inlet is raised. In the exceptional case of PH = 36 bar and ammonia fractions below 45%, exergy loss of the coolant exhaust decreases with increasing ammonia fraction, which is mainly caused by the effect of increased exergy input. The exergy destruction of the mixer exhibits a hill shape against the ammonia fraction as a result of competition between the effects of the dryness factor and mass flow rate. The difference of the exergy consumption at the flash vessel and through the coolant exhaust between the KC and KFC is insignificant. Furthermore, both ratios are lower than 4%.
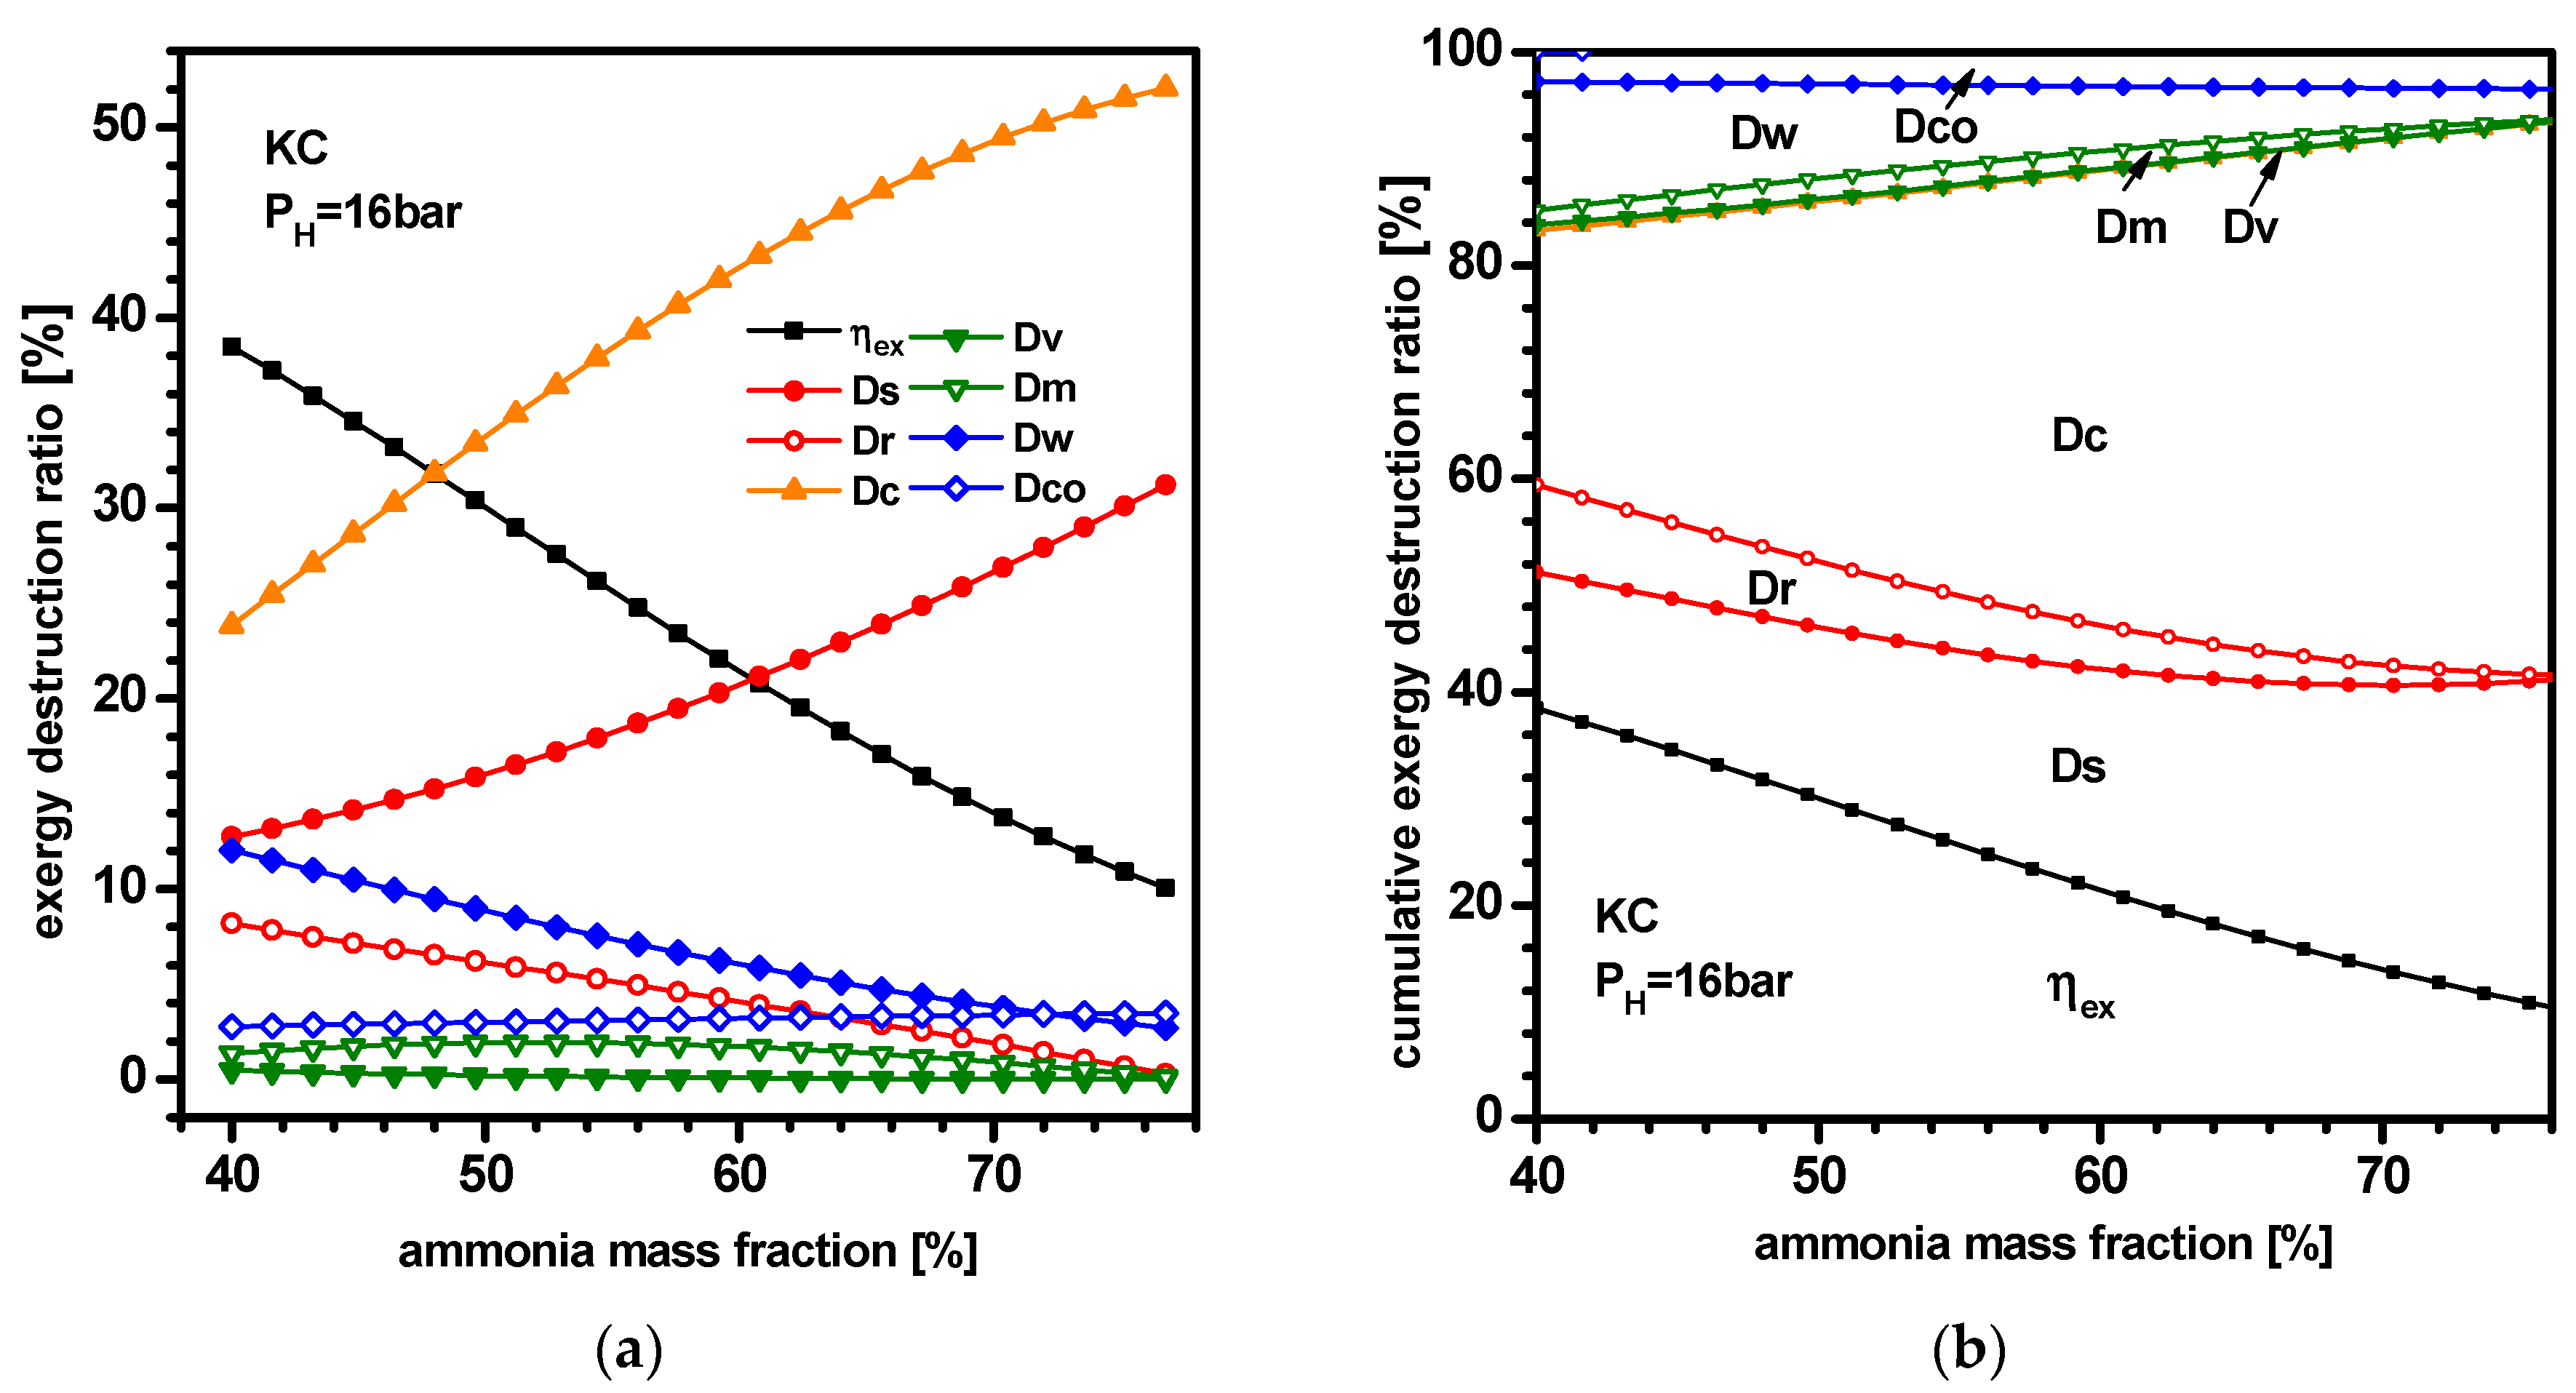
Figure 10 and Figure 11 show the dependence of (a) separate and (b) cumulative ratios of exergy consumption on the ammonia mass fraction (xb) for separator pressure of 16 bar in the KC and KFC, respectively. As the flash pressure is highly restricted to selection from a narrow range between separator pressure and condensing pressure, the effect of flashing is not expected to be remarkable for this low separator pressure. The results for the KC are very close to those of the KFC and hard to differentiate with the naked eye. Two systems show almost same behavior quantitatively as well as qualitatively. Correspondingly the only additional component of flash vessel in the KFC yields nearly zero exergy destruction (Df). The top three exergy consumptions are due to power generation (ηex) and destruction at the condenser (Dc) and HRVG (Ds) for the considered concentration range. Ratios of exergy destruction of the condenser and HRVG and the exergy loss through coolant exhaust (Dco) are increasing function of xb; by contrast, ηex and the ratios of power components (Dw) and regenerator (Dr) are the decreasing function of xb. The rest of the ratios are lower than 3%.
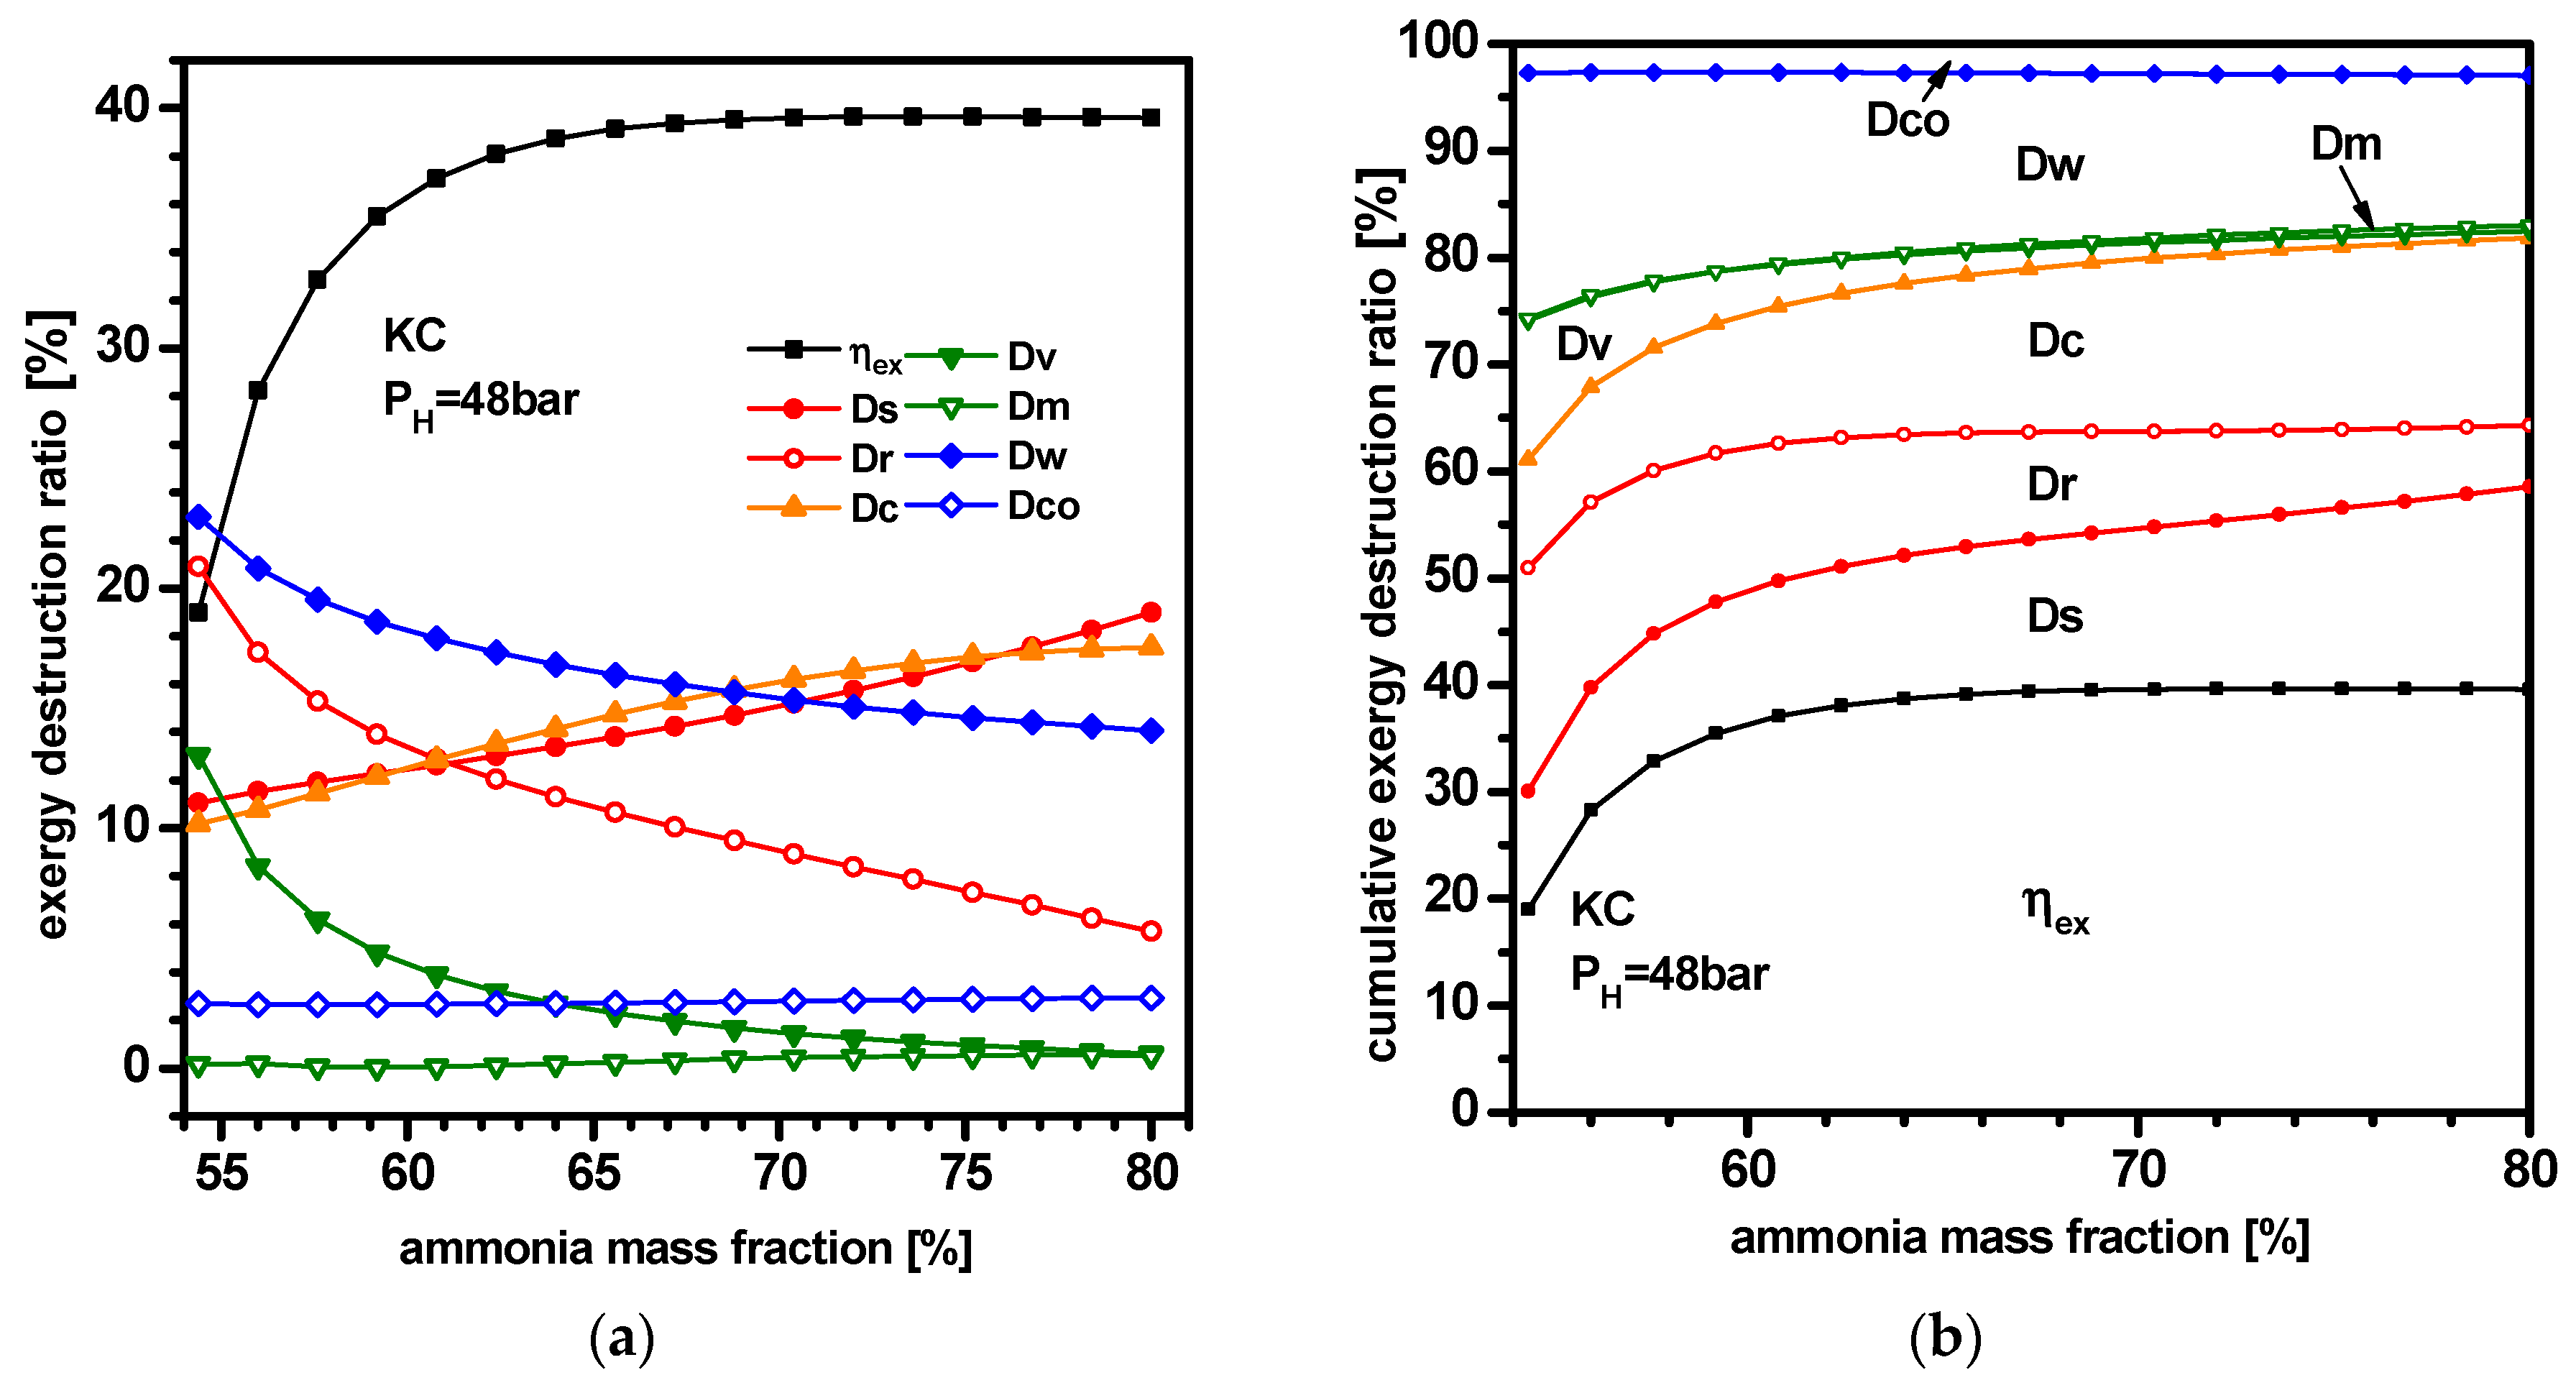
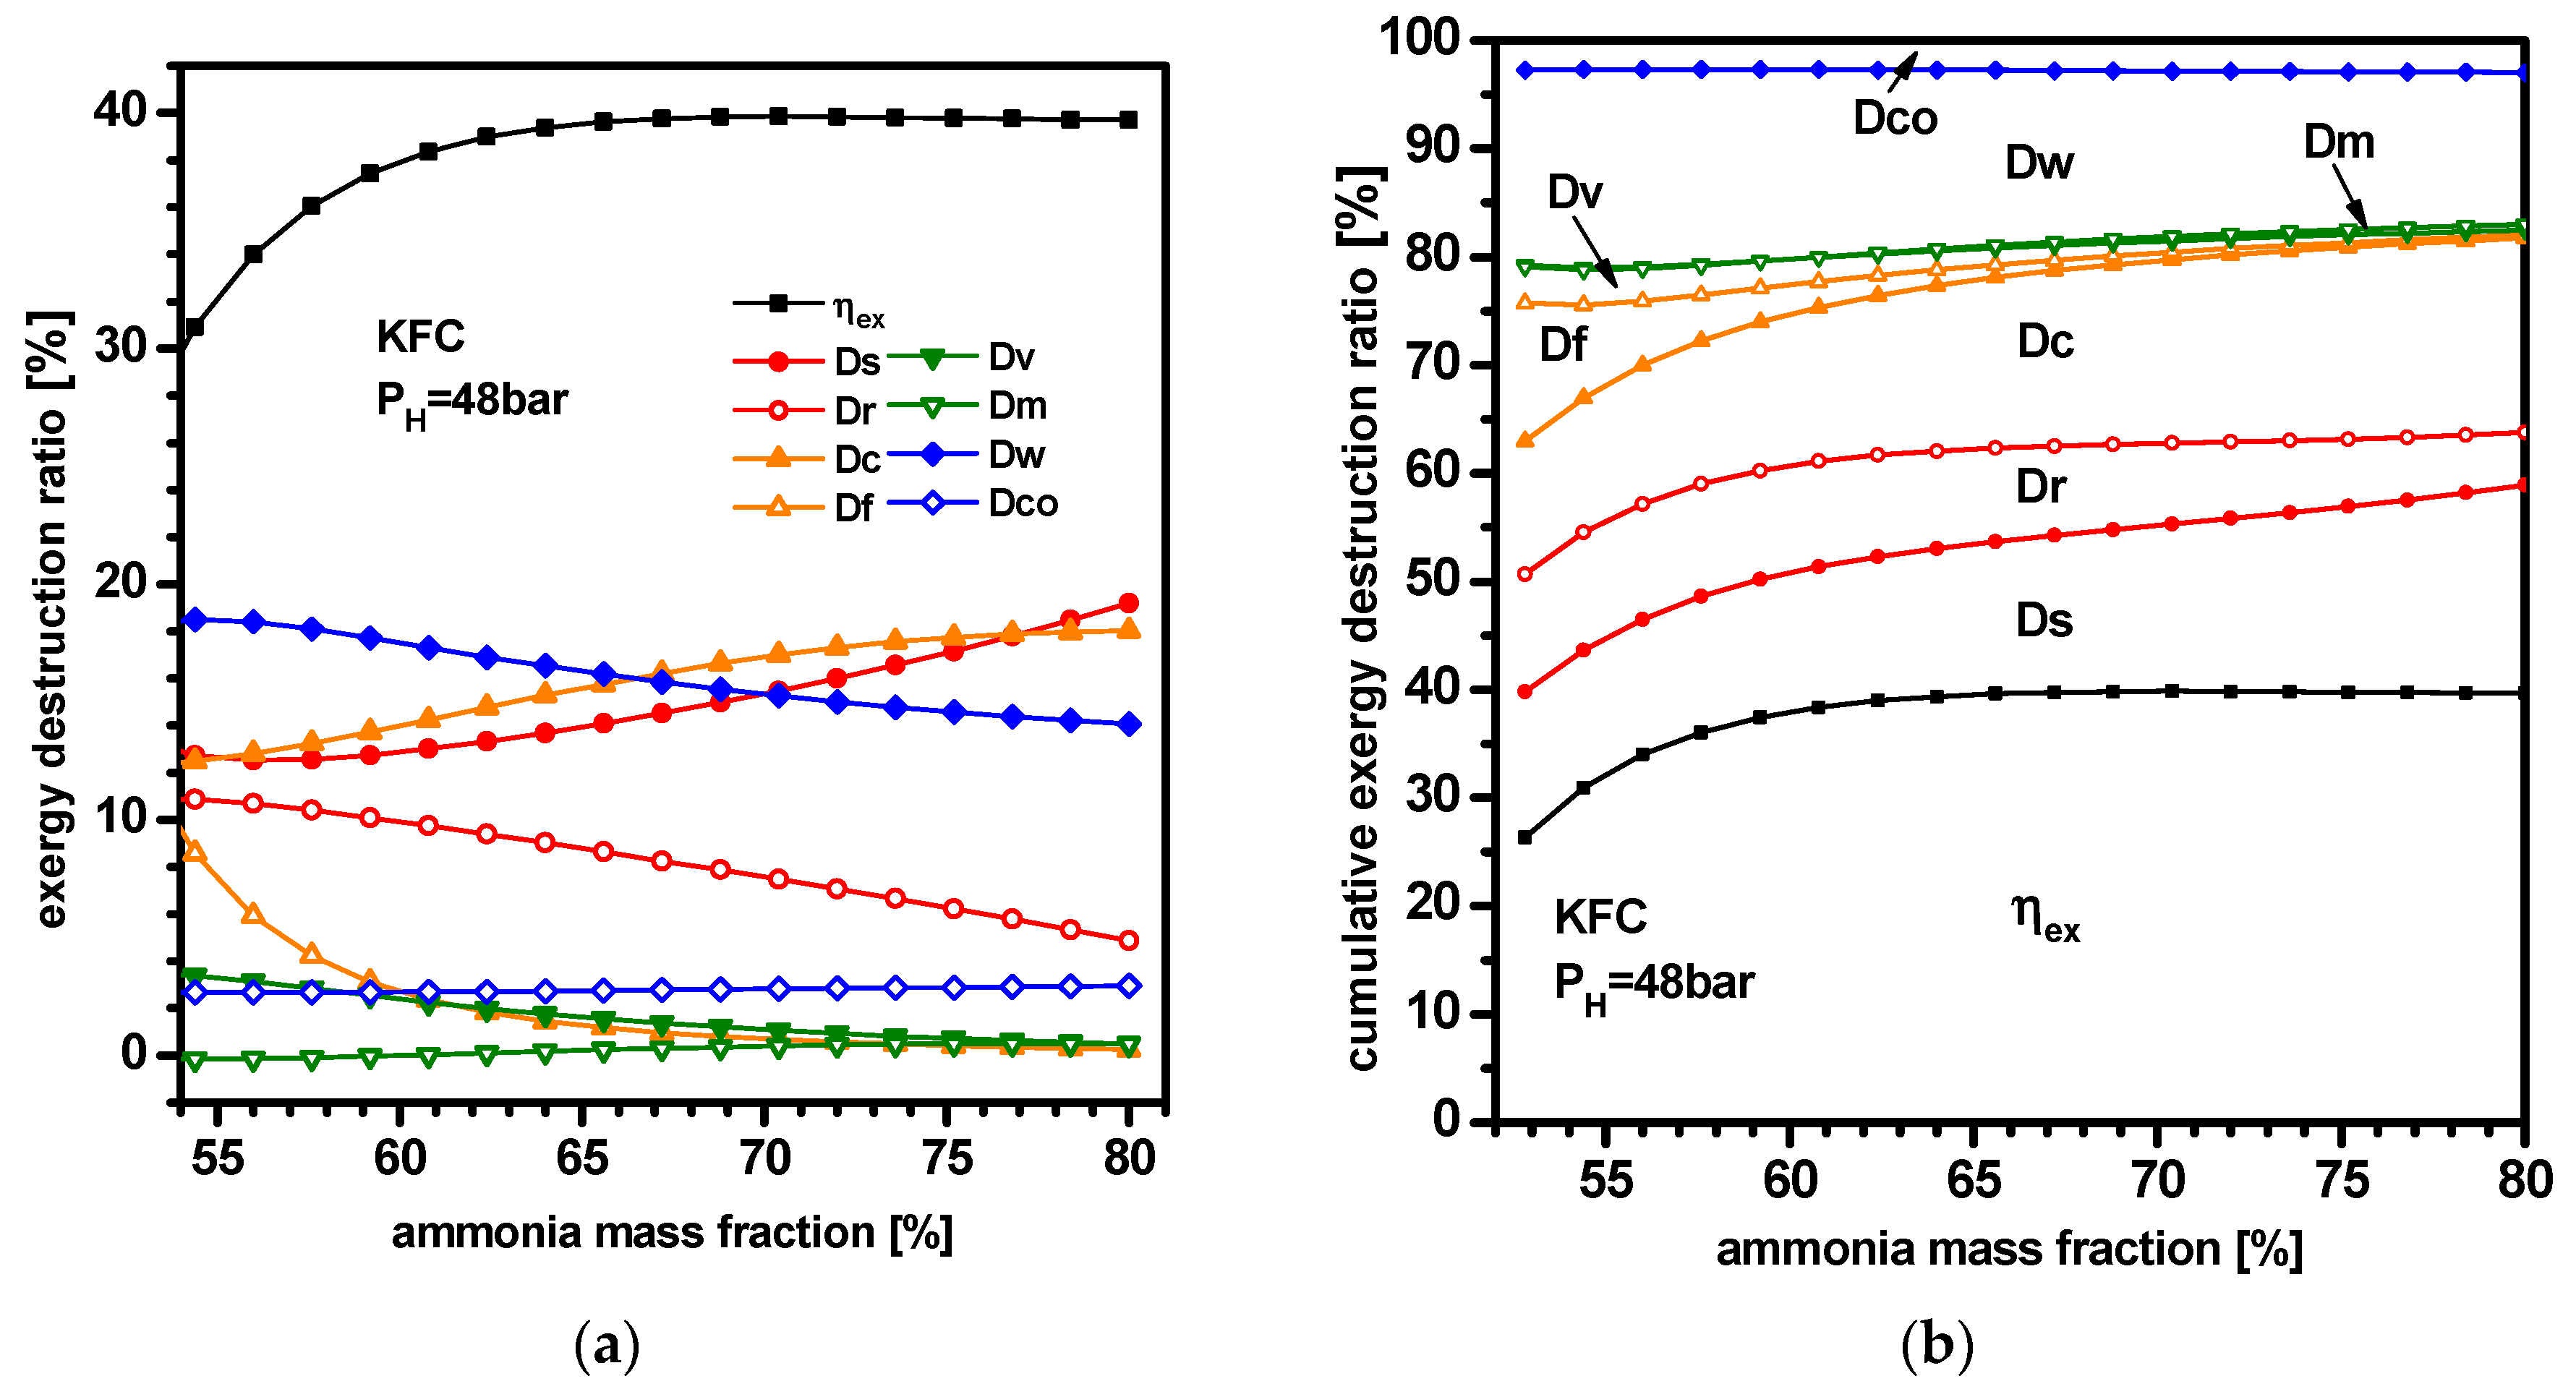
Figure 12 and Figure 13 show the dependence of (a) separate and (b) cumulative ratios of exergy consumption on the basic ammonia mass fraction (xb) for separator pressure of 48 bar in the KC and KFC, respectively. As the ammonia fraction increases, the fractions of exergy consumed to generate power (ηex), and destroyed in the HRVG (Ds) and condenser (Dc) increase; by contrast, those destroyed in power components (Dw), regenerator (Dr), and throttle valve (Dv) decrease. The exergy destruction ratio of flash vessel (Df) which exists only in KFC decreases from 9.8% to 0.3% in the range of xb between 54% and 80%. The remaining ratios of the mixer (Dm) and coolant exhaust (Dco) are lower than 3%. The component at which largest exergy destruction occurs is different in both the KC and KFC, and depends on the range of ammonia fraction. For example, the HRVG in both systems yields the largest exergy destruction for high enough values of xb.

4. Conclusions

The Kalina flash cycle (KFC) has been recently proposed to recover low-grade heat source. In the present study, exergetical and optimal performance analyses were comparatively conducted for the Kalina cycle (KC) and KFC driven by a hot air stream with 150 °C and 1 kg/s. The important system parameters for the analysis were flash pressure, basic ammonia fraction, and separator pressure. The dependence of the exergy efficiency and destruction at each component of the systems on these parameters were parametrically investigated. The main findings of the analysis are summarized as follows:
(1)
In KFC, flash pressure yielding maximum exergy efficiency exists for each set of ammonia fraction and separator pressure. As flash pressure increases, the exergy destructions of power component and regenerator increase; contrarily, those of the condenser, heat recovery vapor generator (HRVG), and flash vessel decrease. The largest exergy destruction occurs at condenser except when ammonia fraction is low and flash pressure is high; in which case it is largest at the power components.
(2)
In both the KC and KFC, the ammonia fraction producing maximum net power is higher than that yielding maximum exergy efficiency for each separator pressure. With respect to the change of separator pressure, maxima of net power production and exergy efficiency have a local maximum and local minimum, respectively.
(3)
As the ammonia fraction increases, exergy destructions of the condenser, HRVG, and coolant exhaust increase, while those of the power components, regenerator, and throttle valve decrease; the exergy efficiency shows decreasing, increasing-decreasing, and increasing behaviors for low, medium, and high separator pressures, respectively.
(4)
Identifying the most irreversible component depends on separator pressure and ammonia fraction. For low separator pressure, the component where the largest exergy destruction occurs is the condenser irrespective of ammonia fraction. For high separator pressure, however, it shifts from power components, to condenser, and to HRVG as the ammonia fraction increases.
(5)
The KFC showed superior maxima of net power production and system exergy efficiency compared to basic KC and potential for the recovery of the low-grade heat source.

Author Contributions

Conceptualization, K.H.K. and C.H.H.; methodology, K.H.K.; validation, H.J.K. and C.H.H.; formal analysis, K.H.K.; investigation, C.H.H.; data curation, H.J.K.; writing—original draft preparation, K.H.K.; writing—review and editing, H.J.K. and C.H.H.; funding acquisition, C.H.H. All authors have read and agreed to the published version of the manuscript.

Funding

This research was funded by Kumoh National Institute of Technology.

Acknowledgments

This research was supported by Kumoh National Institute of Technology.

Conflicts of Interest

The authors declare no conflict of interest.

Nomenclature

cpsisobaric specific heat of source, kJ/kg·K
dtottotal exergy destruction rate of the system, kW
Dcexergy destruction ratio of condenser, %
Dcoexergy destruction ratio of coolant exhaust, %
Dfexergy destruction ratio of flash vessel, %
Dmexergy destruction ratio of mixer, %
Drexergy destruction ratio of regenerator, %
Dsexergy destruction ratio of HRVG, %
Dvexergy destruction ratio of throttle valve, %
Dwexergy destruction ratio of turbines and pump, %
especific exergy, kJ/kg
Erate of exergy flow, kW
Einrate of exergy flow delivered by the source fluid, kW
hspecific enthalpy, kJ/kg
mmass flow rate, kg/s
Ppressure, bar
Qheat transfer rate, kW
sspecific entropy, kJ/kg·K
Ttemperature, °C
Wpower, kW
Wnetnet power, Wt1 + Wt2 − Wp, kW
xammonia mass fraction, %
ydryness factor of ammonia water mixture, (mass of vapor)/(total mass)
ΔTpp1pinch point temperature difference of HRVG, °C
ΔTpp2pinch point temperature difference of regenerator, °C
ηexsystem’s exergy efficiency, %
ηpisentropic efficiency of pump, %
ηtisentropic efficiency of turbines, %
Subscripts
bbasic solution of ammonia water mixture
ccoolant at the inlet of condenser; condenser
cocoolant at the outlet of condenser
fflash vessel
Hseparator
Lworking fluid at the outlet of condenser
ppump
rregenerator
ssource fluid at the inlet of HRVG; HRVG
sosource fluid at the outlet of HRVG
t1, t2first turbine, second turbine
0dead state (state of the surroundings)
Abbreviations
AWammonia water mixture
HRVGheat recovery vapor generator
KCKalina cycle
KFCKalina flash cycle
ORCorganic Rankine cycle
TBturbine

References

  1. Mozayeni, H.; Wang, X.; Negnevitsky, M. Thermodynamic and exergy analysis of a combined pumped hydro and compressed air energy storage system. Sustain. Cities Soc. 2019, 48, 101527. [Google Scholar] [CrossRef]
  2. Lolos, P.A.; Rogdakis, E.D. A Kalina power cycle driven by renewable energy sources. Energy 2009, 34, 457–464. [Google Scholar] [CrossRef]
  3. Bombarda, P.; Invernizzi, C.M.; Pietra, C. Heat recovery from Diesel engines: A thermodynamic comparison between Kalina and ORC cycles. Appl. Therm. Eng. 2010, 30, 212–219. [Google Scholar] [CrossRef] [Green Version]
  4. El-Sayed, Y.M.; Tribus, M. A theoretical comparison of the Rankine and Kalina cycles. ASME Spec. Publ. 1985, AES-1, 97–102. [Google Scholar]
  5. Kalina, A.I.; Leibowitz, H.M. Application of the Kalina cycle technology to geothermal power generation. Geotherm. Resour. Counc. Trans. 1989, 13, 605–611. [Google Scholar]
  6. Desideri, U.; Bidini, G. Study of possible optimization criteria for geothermal power plants. Energy Convers. Manag. 1997, 38, 681–691. [Google Scholar] [CrossRef]
  7. Zhang, X.; He, M.; Zhang, Y. A review of research on the Kalina cycle. Renew. Sustain. Energy Rev. 2012, 16, 5309–5318. [Google Scholar] [CrossRef]
  8. Arslan, O. Power generation from medium temperature geothermal resources: ANN-Based optimization of Kalina system-34. Energy 2011, 36, 2528–2534. [Google Scholar] [CrossRef]
  9. Sun, F.; Zhou, W.; Ikegami, Y.; Nakagami, K.; Su, X. Energy-Exergy analysis and optimization of the solar-Boosted Kalina cycle system 11(KCS-11). Renew. Energy 2014, 66, 268–279. [Google Scholar] [CrossRef]
  10. Mergner, H.; Schaber, K. Performance analysis of an evaporation process of plate heat exchangers installed in a Kalina power plant. Energy 2018, 145, 105–115. [Google Scholar] [CrossRef]
  11. Peng, S.; Hong, H.; Jin, H.; Wang, Z. An integrated solar thermal power system using intercooled gas turbine and Kalina cycle. Energy 2012, 44, 732–740. [Google Scholar] [CrossRef]
  12. Qu, W.; Hong, H.; Su, B.S.; Jin, H. A concentrating photovoltaic/Kalina cycle coupled with absorption chiller. Appl. Energy 2018, 224, 481–493. [Google Scholar] [CrossRef]
  13. Yuksel, Y.E.; Ozturk, M.; Dincer, I. Thermodynamic analysis and assessment of a novel integrated geothermal energy-Based system for hydrogen production and storage. Int. J. Hydrog. Energy 2018, 43, 4233–4243. [Google Scholar] [CrossRef]
  14. Wang, J.; Yan, Z.; Zhou, E.; Dai, Y. A Parametric analysis and optimization of a Kalina cycle driven by solar energy. Appl. Therm. Eng. 2013, 50, 408–415. [Google Scholar] [CrossRef]
  15. Cao, L.; Wang, J.; Chen, L.; Dai, Y. Comprehensive analysis and optimization of Kalina-Flash cyclesfor low-Grade heat source. App. Therm. Eng. 2018, 131, 540–552. [Google Scholar] [CrossRef]
  16. Kim, K.H.; Han, C.H.; Ko, H.J. Comparative Thermodynamic Analysis of Kalina and Kalina Flash Cycles for Utilizing Low-Grade Heat Sources. Energies 2018, 11, 3311. [Google Scholar] [CrossRef] [Green Version]
  17. Tsatsaronis, G. Strengths and Limitations of Exergy Analysis. In Thermodynamic Optimization of Complex Energy Systems. NATO Science Series (Series 3. High Technology); Bejan, A., Mamut, E., Eds.; Springer: Berlin/Heidelberg, Germany, 1999; Volume 69, pp. 93–100. [Google Scholar]
  18. Ebrahimi, M.; Carriveau, R.; Ting, D.; McGillis, A. Conventional and advanced exergy analysis of a grid connected underwater compressed air energy storage facility. App. Energy 2019, 242, 1198–1208. [Google Scholar] [CrossRef]
  19. Cengel, Y.A.; Boles, M.A. Thermodynamics: An Engineering Approach, 8th ed.; McGraw-Hill: New York, NY, USA, 2011. [Google Scholar]
  20. Kim, K.H.; Han, C.H.; Kim, K. Effects of ammonia concentration on the thermodynamic performances of ammonia-Water based power cycles. Thermochim. Acta 2012, 530, 7–16. [Google Scholar] [CrossRef]
  21. Xu, F.; Goswami, D.Y. Thermodynamic properties of ammonia-Water mixtures for power cycle application. Energy 1999, 24, 525–536. [Google Scholar] [CrossRef]
  22. Kim, K.H.; Han, C.H.; Kim, K. Comparative exergy analysis of ammonia-water based Rankine cycles with and without regeneration. Int. J. Exergy 2013, 12, 344–361. [Google Scholar] [CrossRef]
  23. Lee, H.Y.; Park, S.H.; Kim, K.H. Comparative analysis of thermodynamic performance and optimization of Organic Flash Cycle (OFC) and Organic Rankine Cycle (ORC). Appl. Therm. Eng. 2016, 100, 680–690. [Google Scholar] [CrossRef]
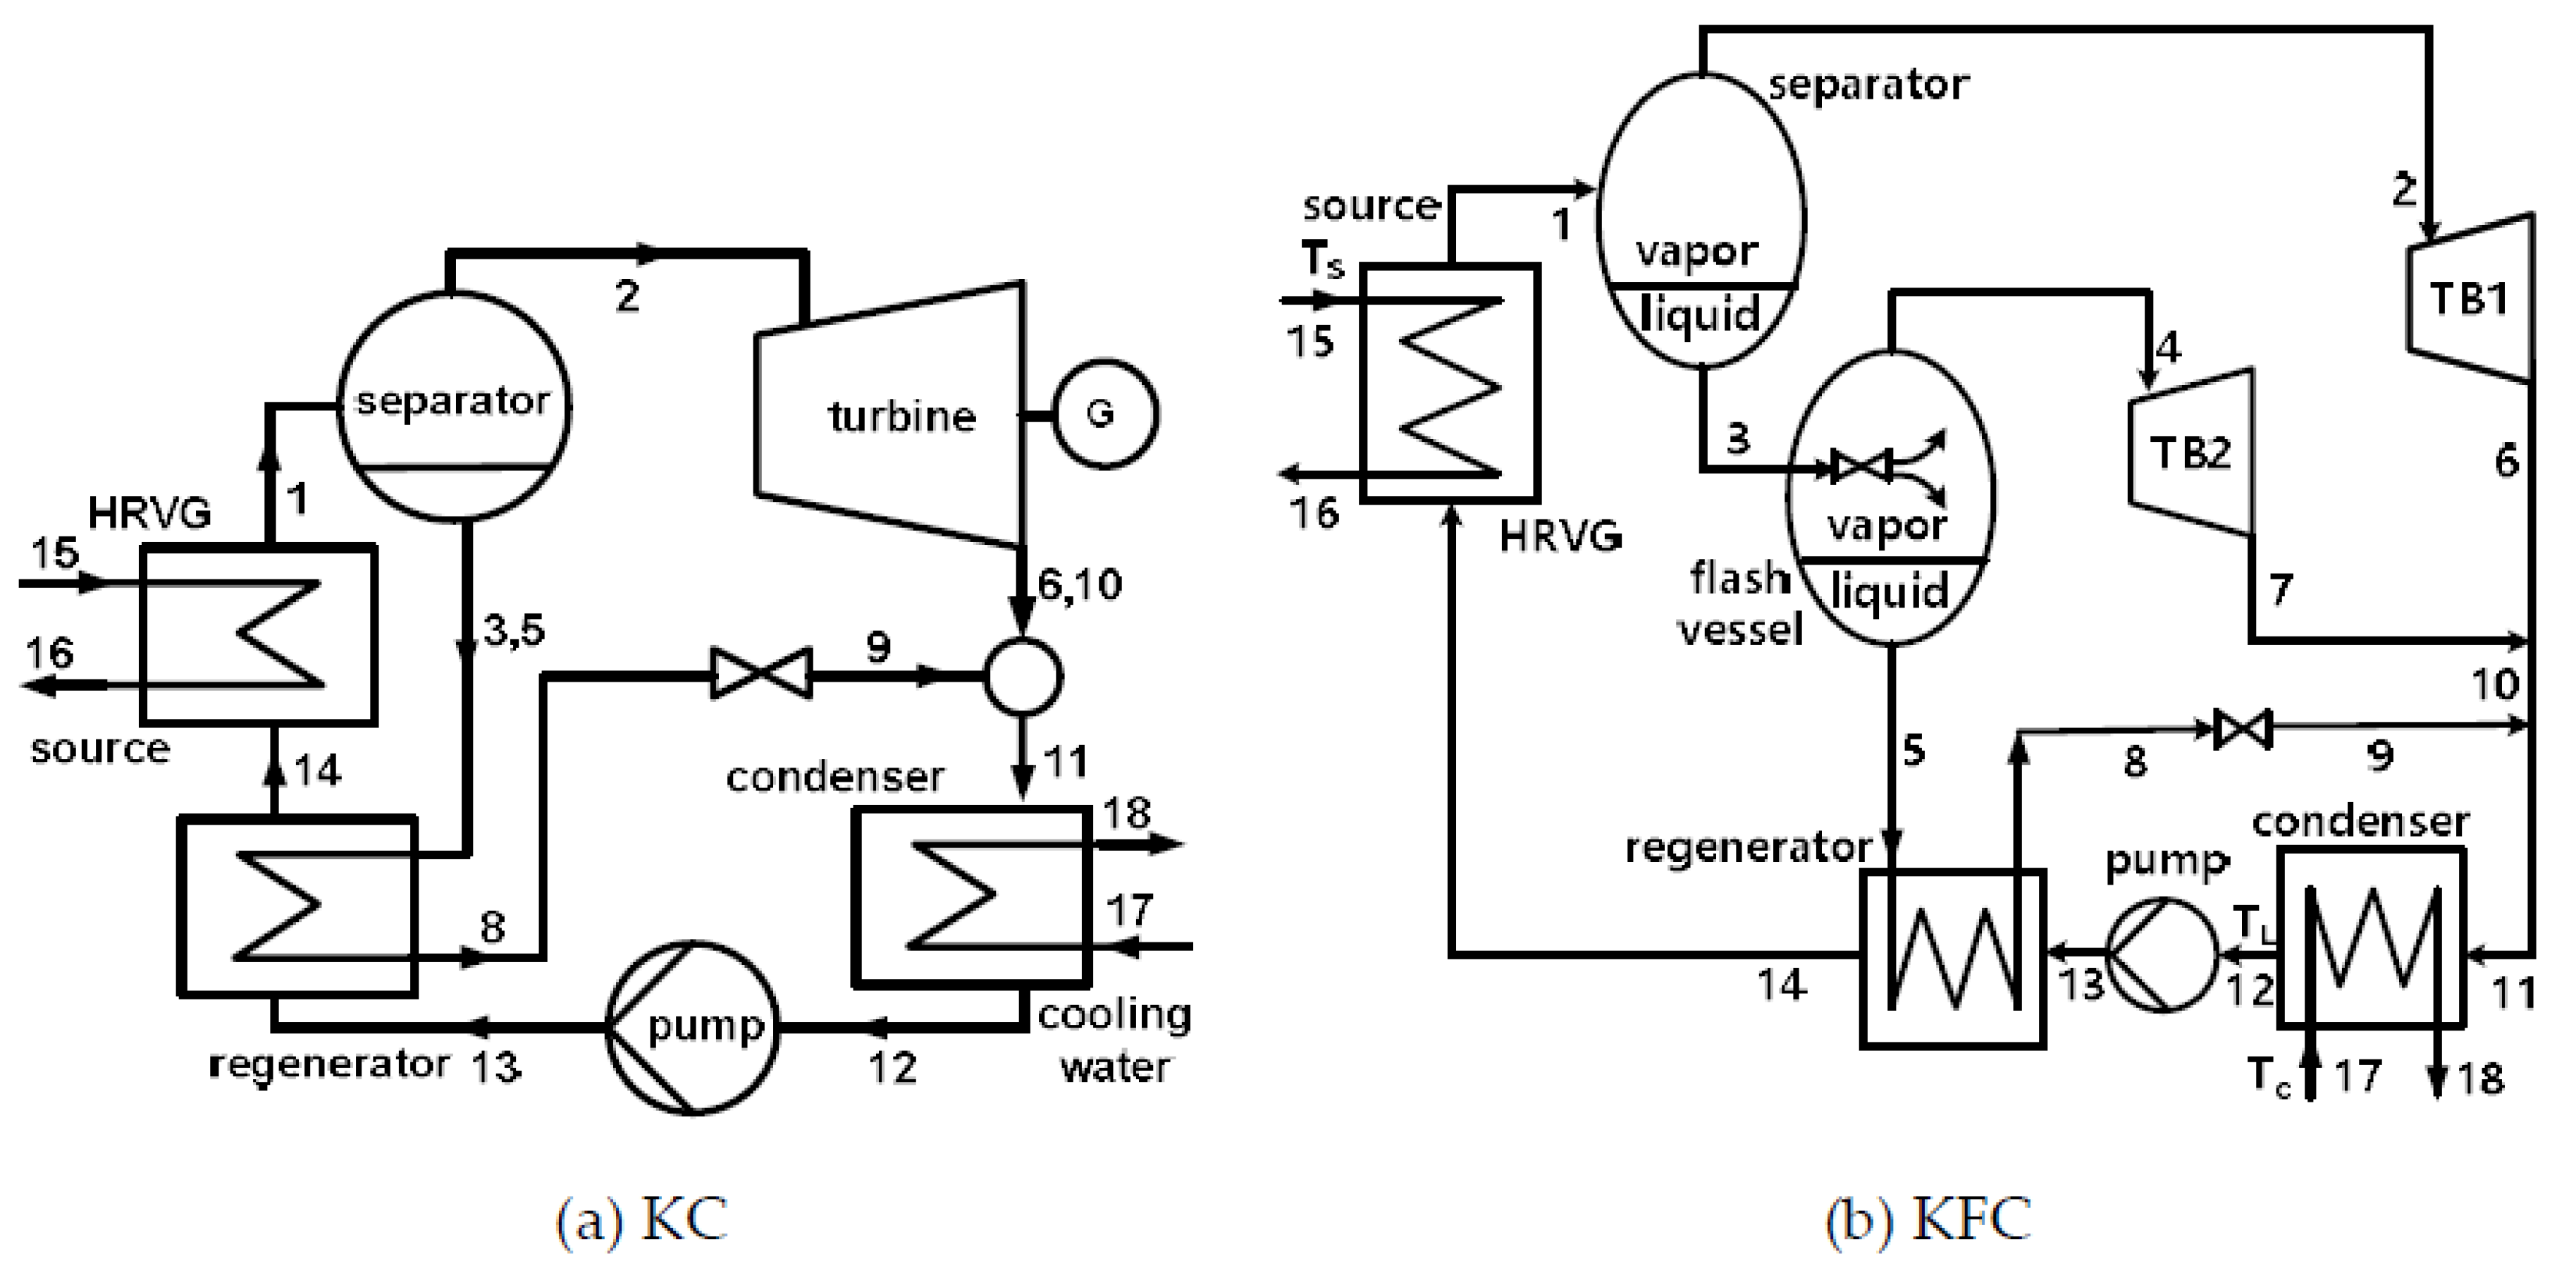
Figure 1. Schematic diagrams of the Kalina cycle (a) and the Kalina flash cycle (b).
Applsci 10 01813 g001
Figure 2. Dependence of ηex, Ds, and Dr on the flash pressure for some values of xb.
Applsci 10 01813 g002
Figure 3. Dependence of Dc, Df, and Dw on the flash pressure for some values of xb.
Applsci 10 01813 g003
Figure 4. Dependence of (a) separate and (b) cumulative ratios of exergy consumption on the flash pressure for xb = 40%.
Applsci 10 01813 g004
Figure 5. Dependence of (a) separate and (b) cumulative ratios of exergy consumption on the flash pressure for xb = 60%.
Applsci 10 01813 g005
Figure 6. Diagram of net power production vs. exergy efficiency of Kalina cycle (KC) and KFC.
Applsci 10 01813 g006
Figure 7. Dependence of ηex, Dc, and Dr on ammonia mass fraction for PH = 24, 36 bar in the KC and KFC.
Applsci 10 01813 g007
Figure 8. Dependence of Ds, Dw, and Dv on ammonia mass fraction for PH = 24, 36 bar in the KC and KFC.
Applsci 10 01813 g008
Figure 9. Dependence of Df, Dco, and Dm on ammonia mass fraction for PH = 24, 36 bar in the KC and KFC.
Applsci 10 01813 g009
Figure 10. Dependence of (a) separate and (b) cumulative ratios of exergy consumption on the ammonia mass fraction for PH = 16 bar in the KC.
Applsci 10 01813 g010
Figure 11. Dependence of (a) separate and (b) cumulative ratios of exergy consumption on the ammonia mass fraction for PH = 16 bar in the KFC.
Applsci 10 01813 g011
Figure 12. Dependence of (a) separate and (b) cumulative ratios of exergy consumption on the ammonia mass fraction for PH = 48 bar in the KC.
Applsci 10 01813 g012
Figure 13. Dependence of (a) separate and (b) cumulative ratios of exergy consumption on the ammonia mass fraction for PH = 48 bar in the KFC.
Applsci 10 01813 g013
Table 1. Base conditions of the system.
SymbolDescriptionValueUnit
TsSource temperature150°C
msFlow rate of source fluid1kg/s
THSeparator temperature139.9°C
PHSeparator pressure24bar
xbBasic mass fraction of ammonia60%
PfFlash pressure15bar
TLCondenser outlet temperature40°C
TcCoolant inlet temperature25°C
TcoCoolant outlet temperature30°C
T0Dead state temperature25°C
ΔTpp1Pinch point temperature difference of HRVG10°C
ΔTpp2Pinch point temperature difference of regenerator8°C
ηpIsentropic efficiency of pump60%
ηtIsentropic efficiency of turbines75%
Table 2. Thermodynamic and flow data at each node of the Kalina flash cycle (KFC) under the base conditions.
NoFluidyx
(%)
T
(°C)
P
(bar)
h
(kJ/kg)
s
(kJ/kg·K)
e
(kJ/kg)
m
(kg/s)
1AW0.5060.0139.924.001106.63.00296.80.061
2AW1.0087.1139.924.001732.64.68427.40.031
3AW0.0032.6139.924.00471.91.30164.40.030
4AW1.0086.6123.315.001715.74.85359.50.002
5AW0.0029.5123.315.00400.91.11149.10.029
6AW0.9687.194.97.541583.34.81237.00.031
7AW0.9886.697.87.541626.44.93245.80.002
8AW0.0029.545.615.0056.10.1492.50.029
9AW0.0029.545.77.5456.10.1491.80.029
10AW0.9687.095.17.541585.44.82237.40.033
11AW0.4760.088.57.54867.12.64165.00.061
12AW0.0060.040.07.540.00.0084.00.061
13AW0.0060.040.624.003.80.0086.30.061
14AW0.0060.075.224.00165.70.49102.30.061
15air 150.00.00127.30.3621.01.000
16air 93.40.0069.60.216.91.000
17water 25.00.000.00.000.02.535
18water 30.00.0021.00.070.22.535
Table 3. Example data of separate and cumulative ratios of exergy consumption for xb = 40% and Pf = 12 bar.
TypeηexDsDrDcDfDvDmDwDco
separate0.3940.1220.0700.1800.0540.0060.0050.1420.027
cumulative0.3940.5160.5860.7660.8200.8260.8310.9731.000