Article

Prediction of Structural Type for City-Scale Seismic Damage Simulation Based on Machine Learning

1
Beijing Key Laboratory of Urban Underground Space Engineering, School of Civil and Resource Engineering, University of Science and Technology Beijing, Beijing 100083, China
2
Guangdong Provincial Key Laboratory of Durability for Marine Civil Engineering, Shenzhen University, Shenzhen 518060, China
3
Key Laboratory of Civil Engineering Safety and Durability of China Education Ministry, Department of Civil Engineering, Tsinghua University, Beijing 100084, China
*
Author to whom correspondence should be addressed.
Appl. Sci. 2020, 10(5), 1795; https://doi.org/10.3390/app10051795
Submission received: 27 January 2020 / Revised: 23 February 2020 / Accepted: 2 March 2020 / Published: 5 March 2020

Abstract

:
Being the necessary data of the city-scale seismic damage simulations, structural types of buildings of a city need to be collected. To this end, a prediction method of structural types of buildings based on machine learning (ML) is proposed herein. Specifically, using the training data of 230,683 buildings in Tangshan city, China, a supervised ML solution based on a decision forest model was designed for the prediction. The scale sensitivity and regional applicability of the designed solution are discussed, respectively, and the results show that the supervised ML solution can maintain high accuracy for different scales; however, it is only suitable for cities similar to the sample city. For wide applicability for various cities, a semi-supervised ML solution was designed based on sampling investigation and self-training procedures. The downtowns of Daxing and Tongzhou districts in Beijing were selected as a case study for the designed semi-supervised ML solution. The overall prediction accuracies of structural types for Daxing and Tongzhou downtowns can reach 94.8% and 99.5%, respectively, which are acceptable for seismic damage simulations. Based on the predicted results, the distributions of seismic damage in Daxing and Tongzhou downtown were output. This study provides a smart and efficient method for obtaining structural types for a city-scale seismic damage simulation.

1. Introduction

Generally, cities are densely organized, with many buildings and civil infrastructures. If a city is affected by a strong earthquake, many casualties and significant losses will occur. For example, the 2011 Christchurch earthquake of New Zealand caused 185 deaths and a loss of US$ 11–15 billion [1].
Earthquakes pose a serious threat for many cities in China. For instance, Tangshan, a medium-sized city in China was hit by an Ms 7.8 intraplate earthquake on 28 July 1976, which caused more than 240,000 deaths, and razed the city of Tangshan [2]. Actually, two third of cities beyond one million people in China are located in high risk areas of earthquakes (i.e., the corresponding seismic precautionary intensities of these cities are more than 6 according to the seismic design code of China [3]). For example, Beijing, the capital of China, and Taiyuan, a large city in the north of China, are both located in the area of seismic precautionary intensity 8. Therefore, the earthquake safety of these cities deserves further study.
A city-scale seismic damage simulation is important for earthquake disaster prevention and mitigation. Such a simulation can provide detailed results of potential building seismic damages, which can support decision making on urban planning for disaster prevention, seismic retrofit, earthquake emergency management, etc.
Currently, the multi-degree-of-freedom (MDOF) model proposed by Lu et al. [4,5,6,7,8] has been validated by actual earthquakes and successfully applied in several cities [5,8,9]. For instance, it is employed by the SimCenter project of the National Science Foundation of the United States to predict the seismic damage of 1.8 million buildings in the San Francisco Bay Area [10].
The MDOF model requires five parameters: Story area, story height, story number, construction year, and structural type. With the development of geographic information system (GIS) technology, many algorithms have been proposed to obtain the story areas and building heights automatically. For example, Li et al. proposed an algorithm for automatically detecting building footprints from very high resolution (VHR) satellite images by using a visual attention method and morphological building indices [11]. The story areas can be calculated by the polygons of building footprints. Kadhim and Mourshed proposed a shadow-overlapping algorithm for estimating building heights from VHR satellite images [12], by using graph theory and morphological fuzzy processing techniques. Note that imagery between 0.3–0.8 m/pxl is considered VRH satellite imagery in the above research. Story numbers can be calculated according to building heights and the design story heights of different building types. For example, the popular design story height is 3.0 m for residential buildings in China, according to the corresponding design code [13]. Additionally, the construction year can be quickly determined by the comparison of historical maps [14]. Currently, many cities have provided their building data for the public, e.g., the building data (e.g., footprints and construction years) of San Francisco can be downloaded by the DataSF website [15].
However, the data of structural types (e.g., masonry, frame, and shear wall structures) of the entire city are difficult to obtain, which limits the applications of city-scale seismic damage simulations based on the MDOF model. Specifically, the structural type of a building can hardly be identified by satellite image or maps; therefore, the structural type must be determined from the building’s interior or by consulting relevant engineering drawings, which results in extensive manual workloads. Therefore, an efficient method to predict the structural types of building groups is necessary for a city-scale seismic damage simulation.
Machine learning (ML) [16] can be employed to predict the structural building types of a city. Using ML, some potential patterns can be obtained to perform predictions from large amounts of data. Accordingly, the potential patterns between structural types and other building inventory data (e.g., story area, story height, story number, and construction year) can be identified using ML. Consequently, the structural type of each building in a city can be predicted using such patterns.
In the field of buildings and constructions, ML is primarily adopted for automatic designing and detection [17,18,19,20,21]. For instance, Krijnen et al. proposed a self-learning algorithm for the automatic selections of structures based on building information models [17]. Dornaika et al. presented a generic framework that exploited recent advances in image segmentation and region descriptor extraction for the automatic and accurate detection of buildings on aerial orthophotos [18]. Yuan et al. designed a deep convolutional network with a simple structure that integrates the activation from multiple layers for pixel-wise prediction; furthermore, they trained the network to extract buildings from aerial scene images [19,20]. Bassier et al. proposed an automatic building recognition method based on ML for point cloud models created by three-dimensional laser scanners [21]. However, the existing ML-based studies on the predictions of structural types of buildings are few.
Herein, a method to predict the structural type of buildings based on ML is proposed. Specifically, using the training data of 230,683 buildings in Tangshan city, China, a supervised ML solution based on a decision forest model was designed for the prediction. The scale sensitivity and regional applicability of the designed solution are discussed, respectively, and the results show that the supervised ML solution can maintain high accuracy for different scales; however, it is only suitable for cities similar to the sample city. For wide applicability for various cities, a semi-supervised ML solution was designed based on sampling investigation and self-training procedures. The downtowns of Daxing and Tongzhou districts in Beijing were selected as a case study for the designed semi-supervised ML solution. The overall prediction accuracies of structural types for Daxing and Tongzhou downtowns can reach 94.8% and 99.5%, respectively, which are acceptable for seismic damage simulations. Based on the predicted results, the distributions of seismic damage in Daxing and Tongzhou downtown were output. This study provides a smart and efficient method for obtaining structural types for a city-scale seismic damage simulation.

2. Framework

The framework of this study is shown in Figure 1, which includes four parts: Training data, supervised ML solution, semi-supervised ML solution, and case study.
Training data: This part includes five attributes of a building, i.e., structural type, construction year, story number, story height, and story area. The building data of two cities in China was used for the training in this study. One city is Tangshan, which has 230,683 buildings; the other city is Taiyuan, whose downtown has 31,154 buildings. These data were provided by the department of urban planning in the local government.
Supervised ML solution: The ML models and implementation platforms suitable for the prediction of structural types are determined by comparing prediction accuracies. In addition, the scale sensitivity and regional applicability of the designed solution are discussed.
Semi-supervised ML solution: First, the sampling fraction of the building investigation is determined based on the supervised ML solution above. Subsequently, the semi-supervised self-training procedure is designed based on the sample data. Finally, the prediction performance of the semi-supervised ML solution is assessed.
Case study: The downtowns of Daxing and Tongzhou, the districts of Beijing, were selected as a case study, which has 69,180 and 34,763 buildings, respectively. The structural types of buildings in the downtowns of Daxing and Tongzhou were predicted using the designed semi-supervised ML solution, and the prediction performances were assessed based on the sample data. Furthermore, the seismic damage of Daxing and Tongzhou downtowns were simulated using the predicted structural types.

3. Supervised ML Solution

3.1. Determination of Models and Platforms

Many ML models and implementation platforms exist [22,23,24,25,26,27], and each has its own advantages and disadvantages. Therefore, appropriate models and platforms must be determined.
(1) ML models
The purpose of this study is to predict the structural type with other building attribute data. Structural types are generally limited, e.g., masonry, frame, and shear-wall structures; therefore, the prediction of structural type is a multi-class classification problem in ML. The existing studies indicate that artificial neural network [22], decision forest [23], support vector machine (SVM) [24], and logistic regression [25] are suitable for the classification problem.
The artificial neural network model that simulates the synaptic connection of the brain comprises a large number of neurons and their interconnections; it can be used for multi-class classification problems [22]. The decision forest model is equivalent to an upgraded decision tree model. The decision forest [23] is composed of many decision trees, and each decision tree is independent. For classification problems, the prediction result with the highest accuracy in all the decision trees will be selected as the result of the decision forest. Logistic regression is the appropriate regression analysis to conduct when the dependent variable is binary or multi-class, because it can describe data and explain the relationship between one dependent variable and one or more independent variables. The SVM method is mainly used to segregate the two classes. However, the prediction of structural types in this study is a multi-class problem. Therefore, except SVM model, the artificial neural network, decision forest and logistic regression models were adopted in this study. The prediction results of these three models can be compared with each other, and more accurate results will be applied in the city-scale seismic damage simulation.
(2) Implementation platforms
Currently, many implementation platforms exist for ML, e.g., BigML [26], Microsoft Azure (hereinafter referred to as Azure) [27], Google’s TensorFlow [28], and Amazon Machine Learning [29]. Azure has integrated lots of the existing ML models, e.g., the artificial neural network, decision forest models, and logistic regression models, and it can be freely employed for a long time. Therefore, Azure was adopted in this study.

3.2. Data Processing

The data (i.e., building footprints, construction years, story heights, story areas and story numbers) of 230,683 building in Tangshan were provided by the department of urban planning in the local government of Tangshan city.
First, the department has validated the data through the extensive surveying and mapping jobs; thus, these data can be considered to be cleaned before the training.
Subsequently, the correlation matrix of the building data was calculated to evaluate possible dependencies. Taking Tangshan city, for example, the correlation matrix of the building data is demonstrated in Figure 2. It can be observed that the building data has weak dependencies and can be used as the input data for predicting structural types of buildings.
Finally, the building data have been normalized by using the min-max normalization method, because building attributes are generally concentrated within a certain range. For example, the story numbers for most buildings in Tangshan are 1–6. By the min-max normalization, the effect on the prediction caused by different scales of data can be avoided.
Note that only four types of building data are used to predict structural types in this study, thus, the building data need to be carefully checked to avoid incorrect or missing data. Actually, the purpose of the prediction of structural types in this study is to support the urban planning for earthquake preparedness, hence, the data provider of this study is the department of urban planning of a city, and they can guarantee the accuracy of the provided data.

3.3. Model Training

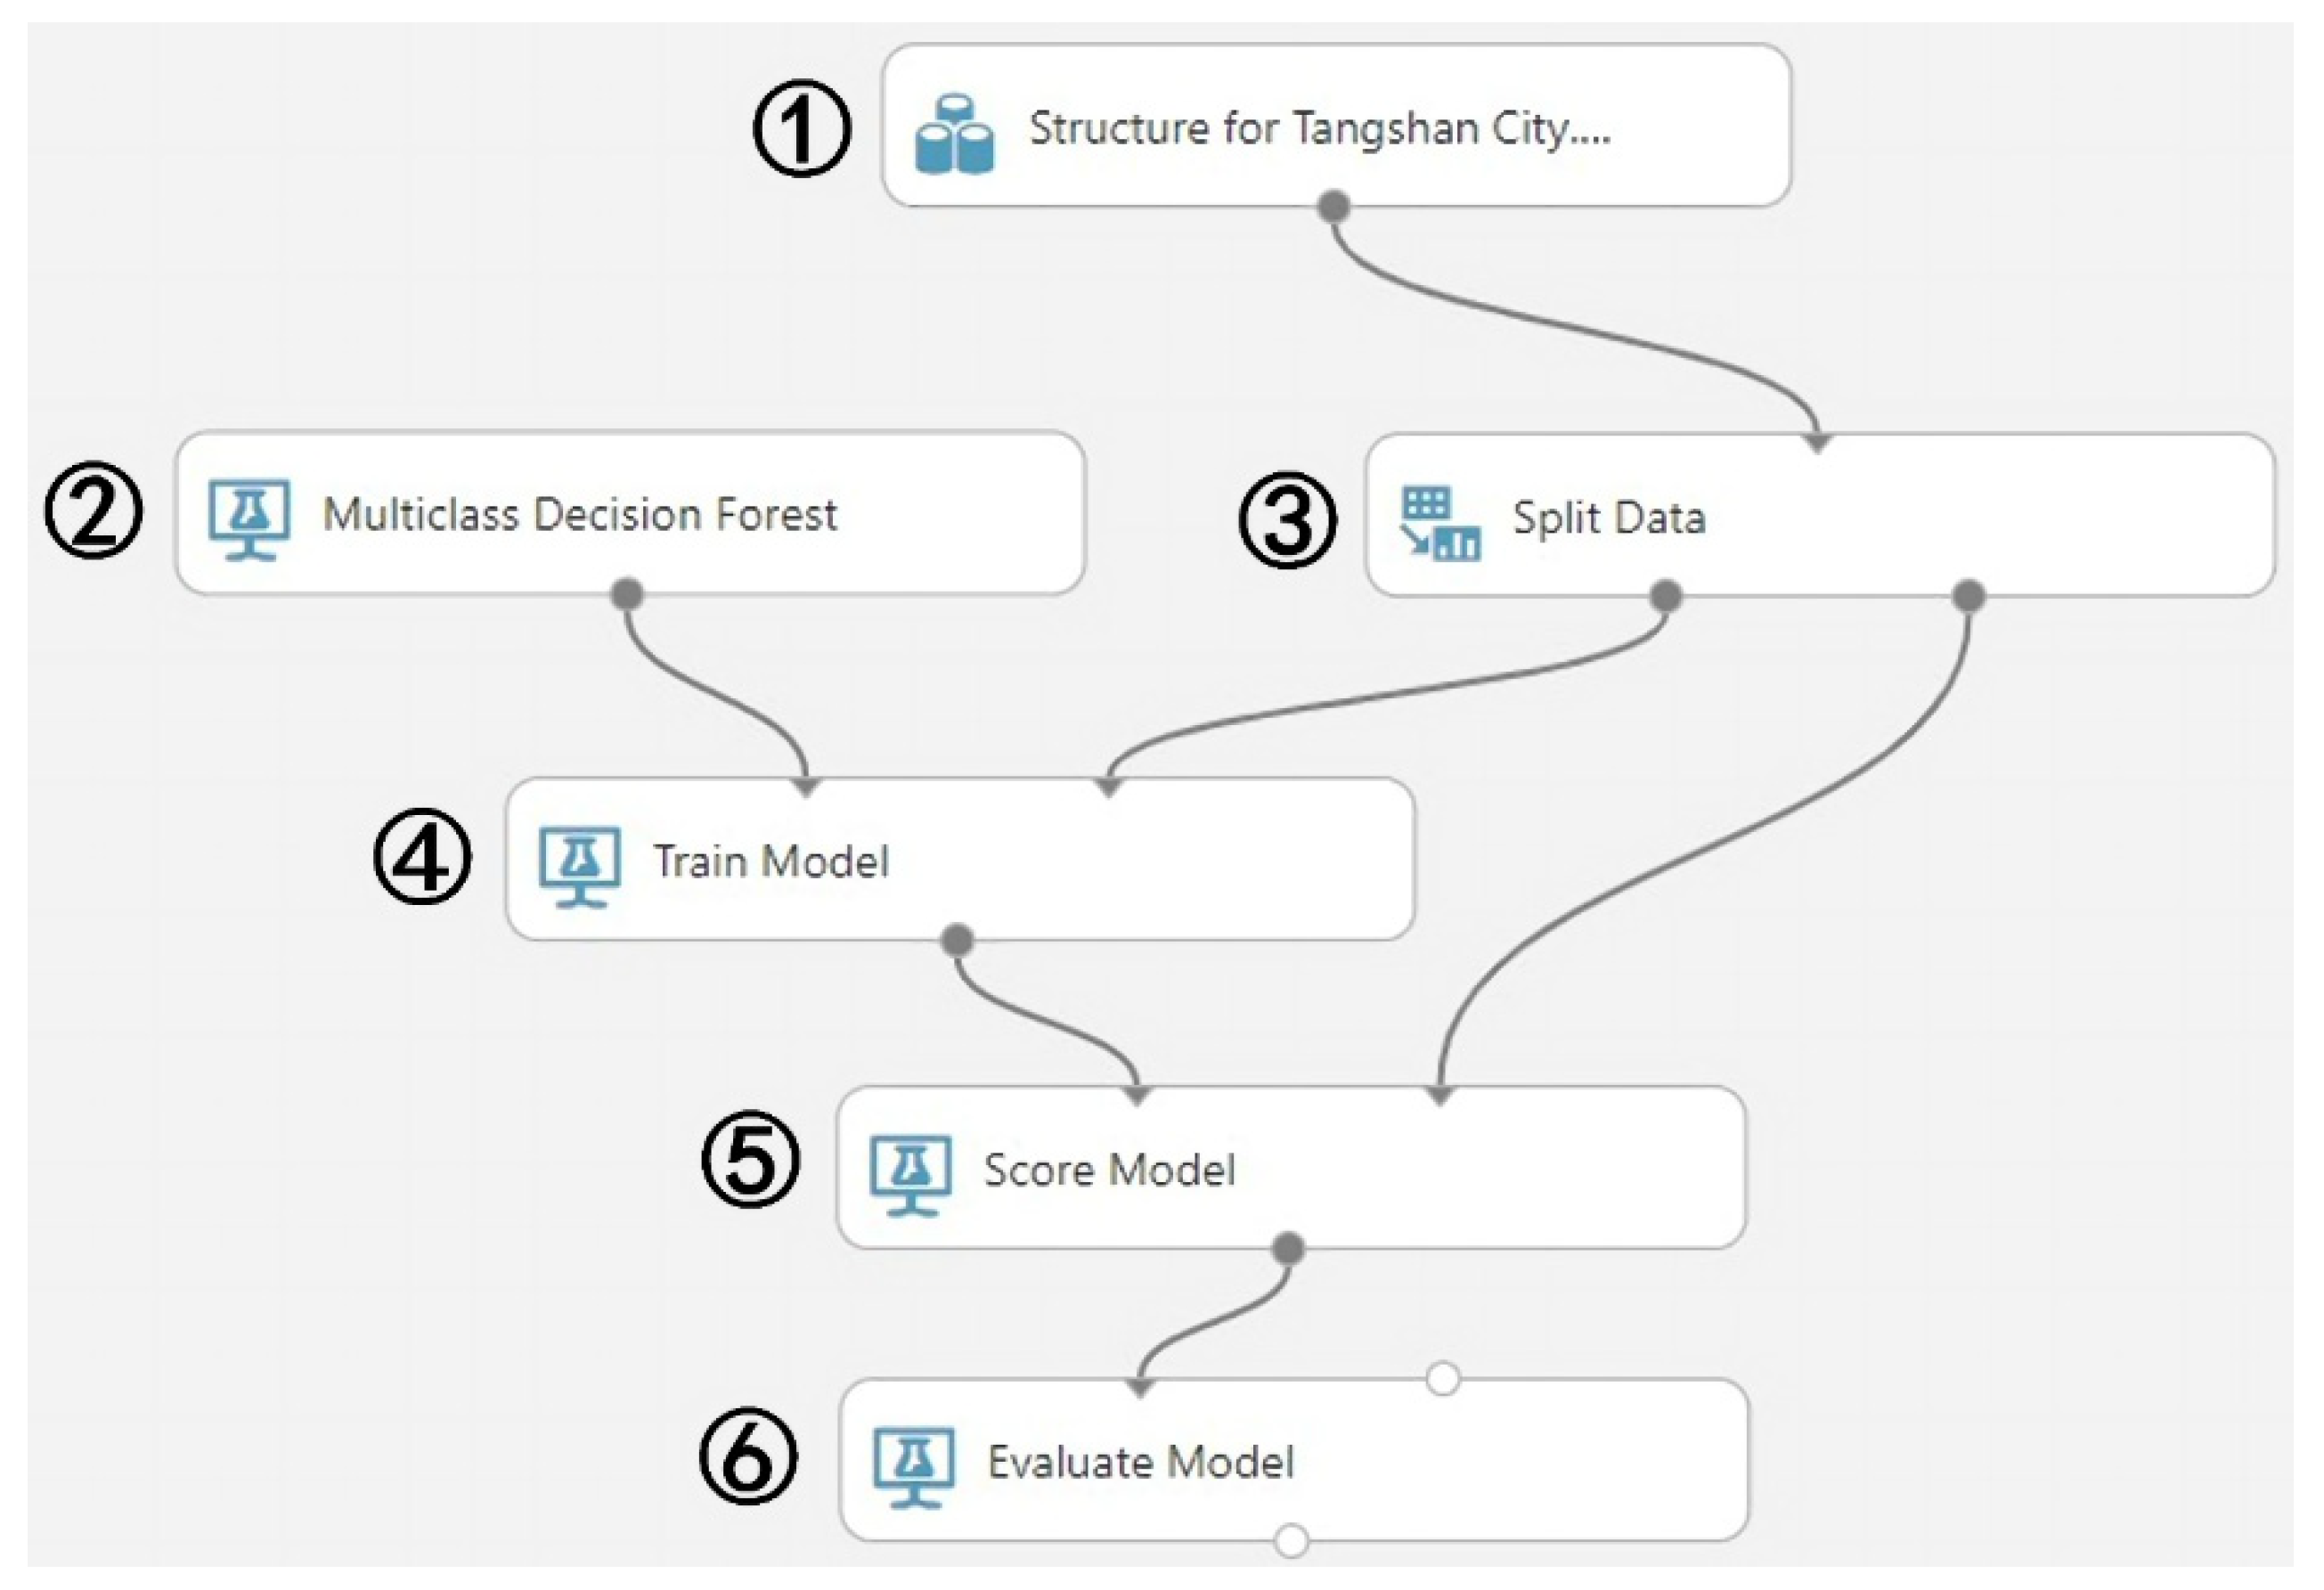
The data of 230,683 buildings in Tangshan were used to train the artificial neural network, decision forest and logistic regression models. Azure packages each operation as a component that can be defined and organized through visual programming. The prediction solution can be created efficiently using components. Using the decision forest model as an example, the supervised ML solution was designed using the components, as shown in Figure 3.
The components in Figure 3 are specified as follows:
  • Component 1 (Select Data): Select the uploaded source data, i.e., Tangshan data.
  • Component 2 (Select Model): Select “Multi-class Decision Forest” model in Azure for the prediction.
  • Component 3 (Split Data): Split the source data into training data (i.e., 80% of the source data) and assessment data (i.e., the remaining 20% of the source data).
  • Component 4 (Train Model): Train the prediction model using the training data.
  • Component 5 (Score Model): Score the prediction results using the assessment data.
  • Component 6 (Evaluate Model): Evaluate the accuracy of the prediction model.
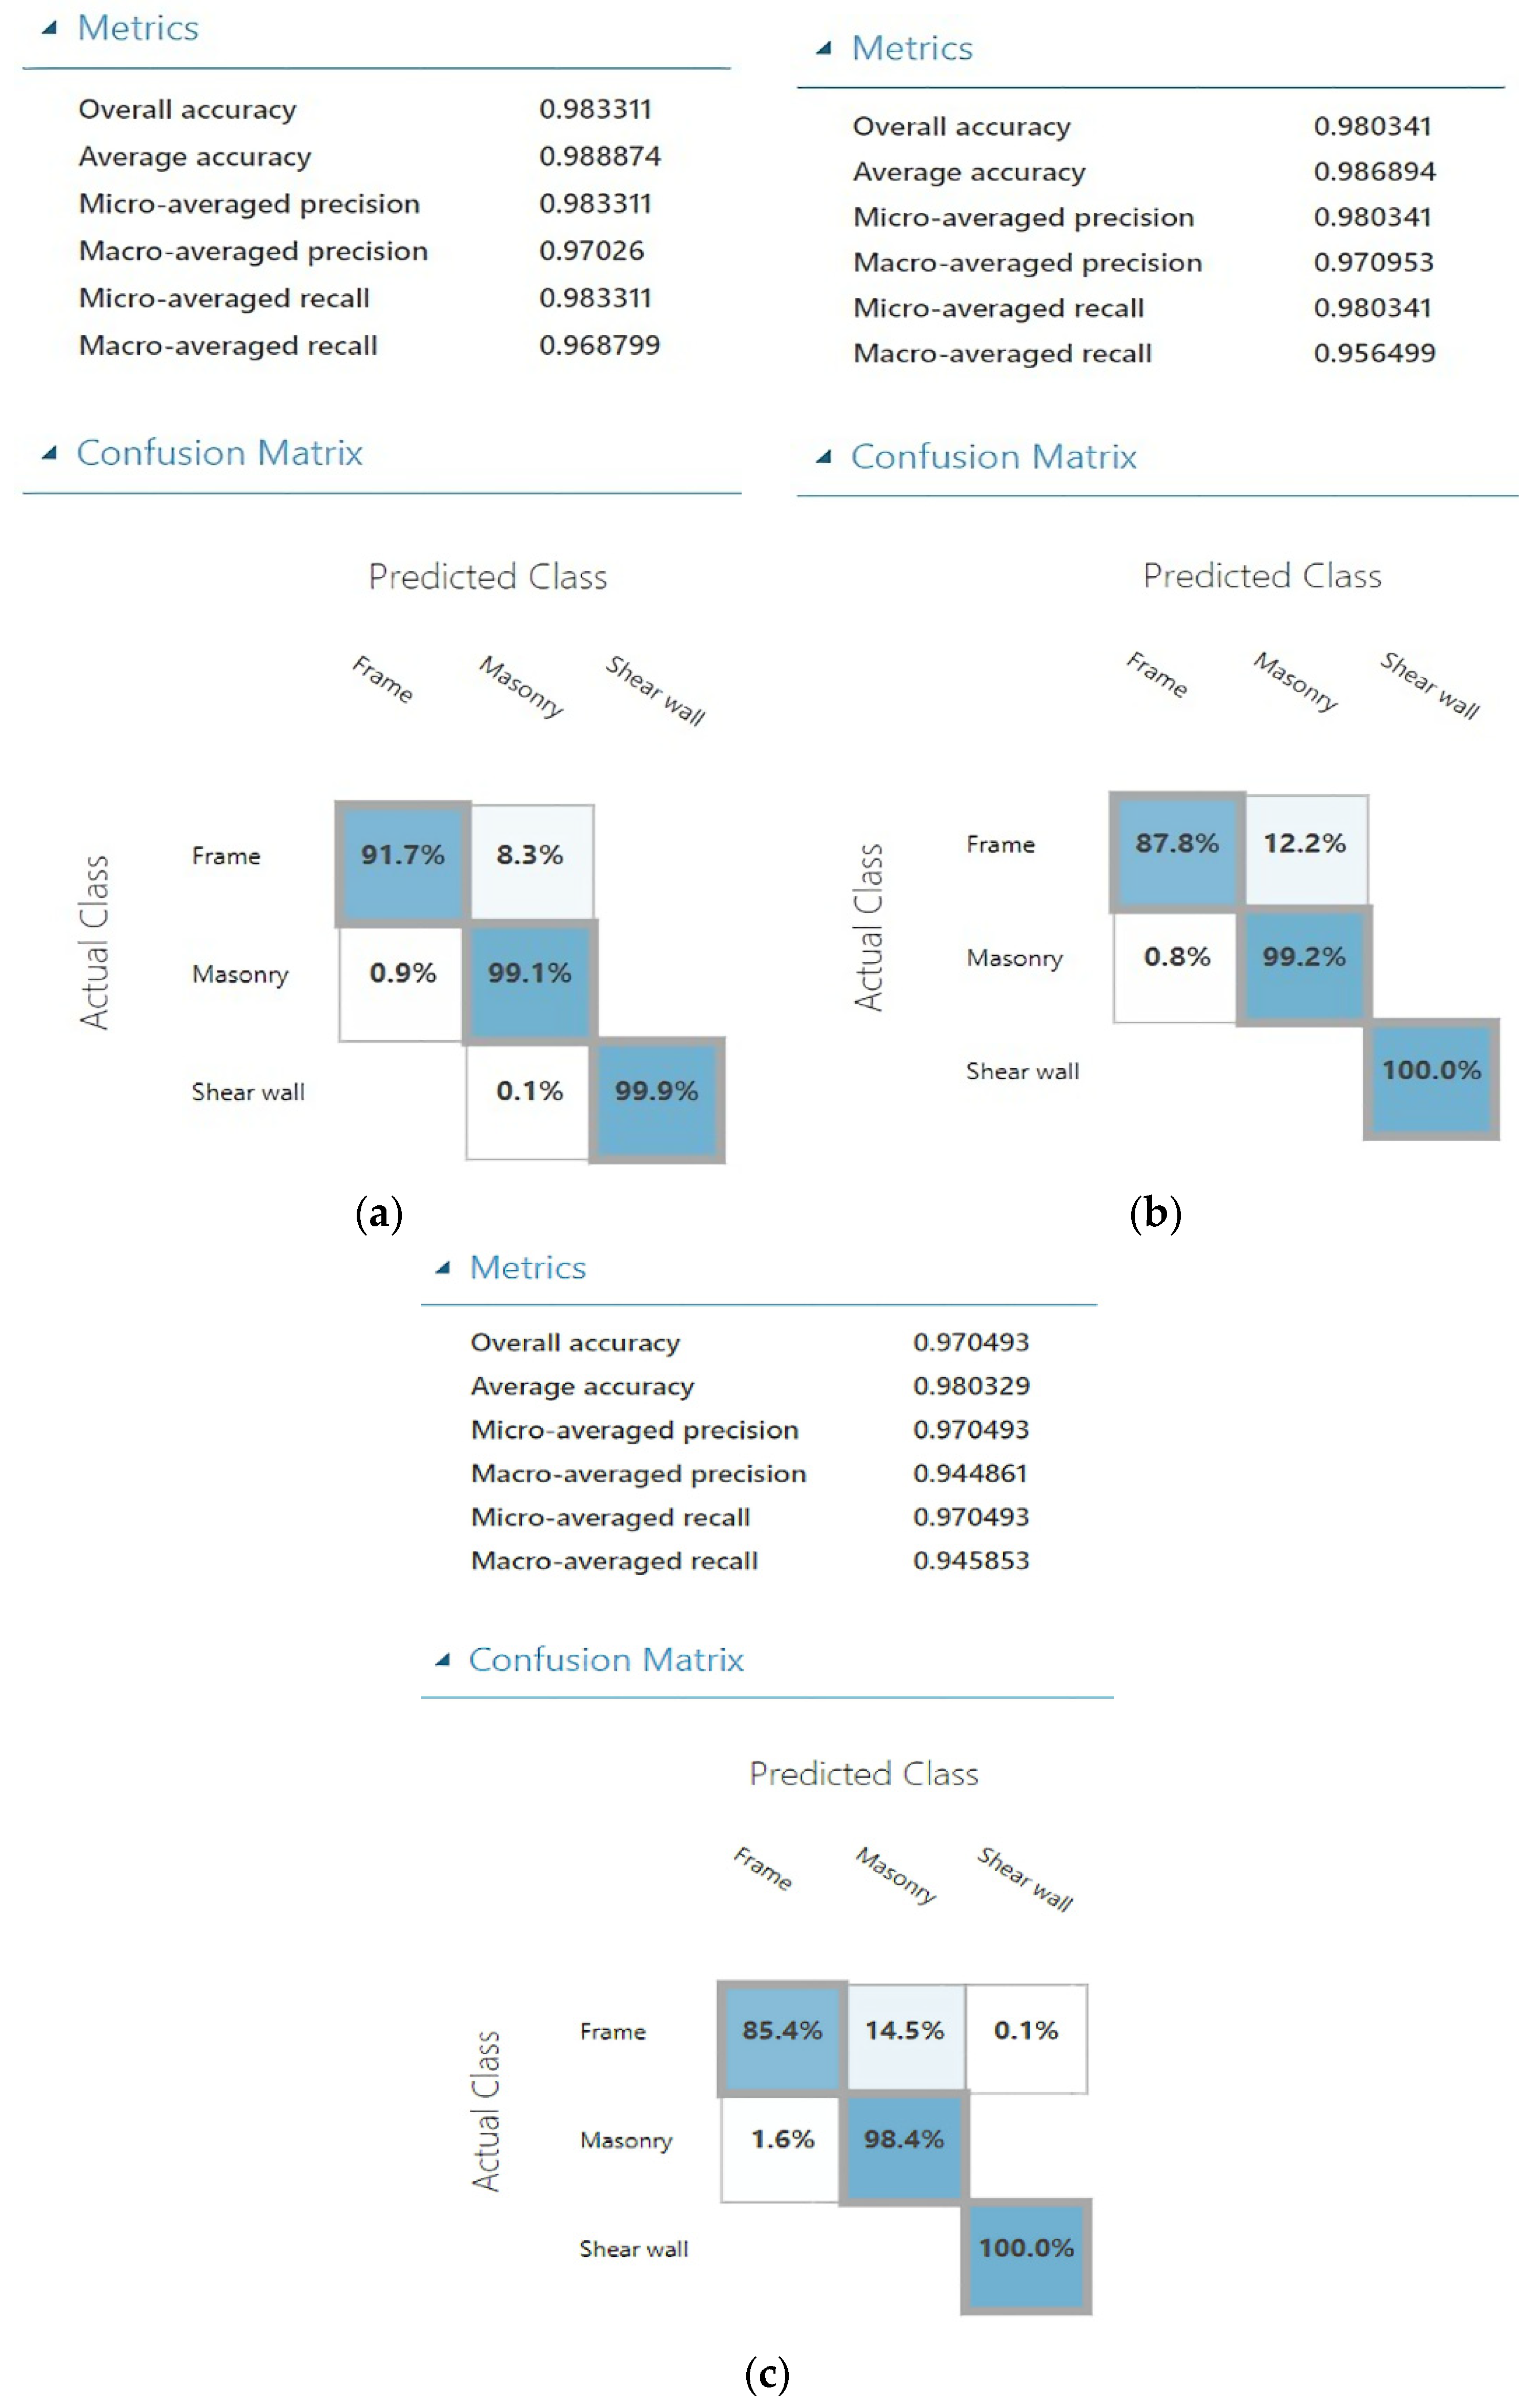
Using the designed supervised ML solution above, the overall accuracy for predicting structural type in Tangshan reaches 98.3%, as shown in Figure 4a. If the artificial neural network and logistic regression models are adopted, the corresponding overall accuracies will be 98.0% and 97.0%, as shown in Figure 4b,c. Therefore, the designed supervised ML solution can predict the structural type of a city with high accuracy.
Besides, according to the precisions and recalls in Figure 4, the macro and micro F1 scores of the above three predictions can be calculated to evaluate the performances of different ML models further, as shown in Table 1. The F1 score is simply a way to combine the performance metrics of precision and recall. According to Table 1, the macro and micro F1 scores of the decision forest model is the highest, while that of the logistic regression model is the lowest. In addition, the decision forest model also has the highest accuracy, but the logistic regression has the lowest accuracy. Therefore, although the artificial neural network and logistic regression models also have high accuracy, the decision forest model is recommended for the prediction of structural types in this study, due to the best performance in the above three models.

3.4. Scale Sensitivity Assessment

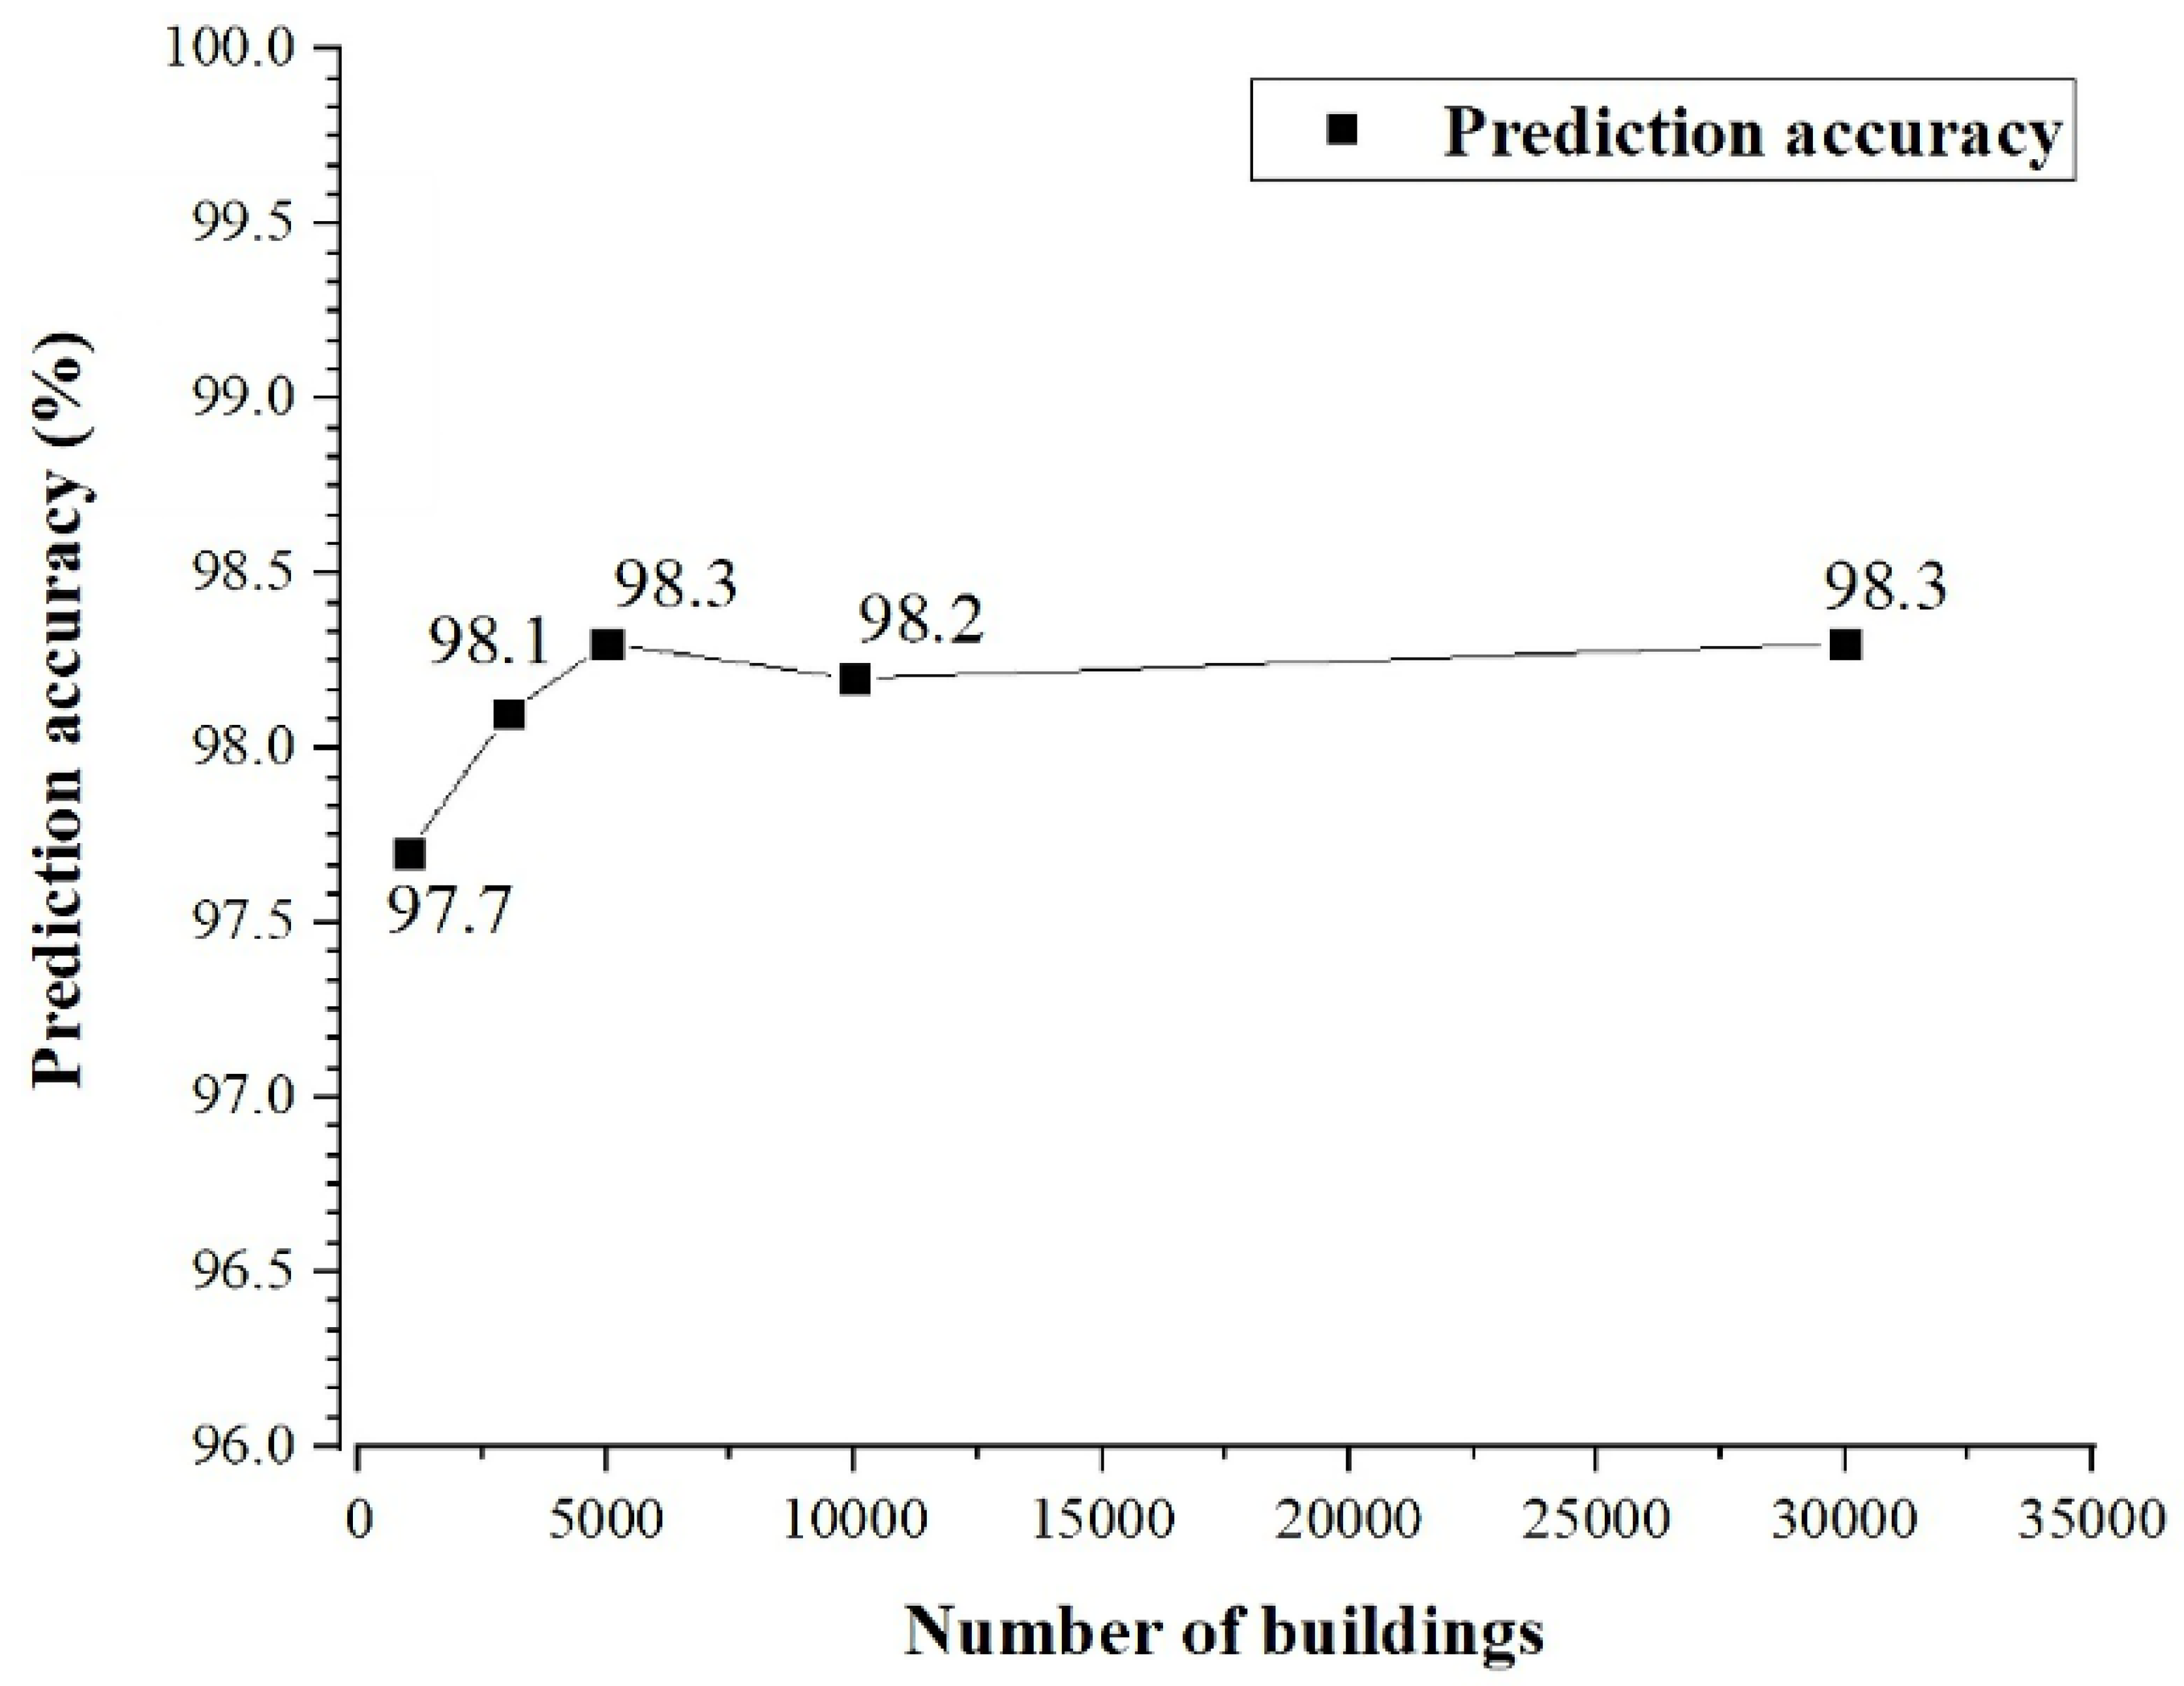
In actual application scenarios, the scales of the predicted buildings are uncertain. To assess the scale sensitivity of the prediction model, different scales of buildings were adopted to perform the predictions. In these predictions, the building data were randomly selected from all buildings in Tangshan city. The prediction results are shown in Figure 5.
When the building scales are 1000, 3000, 5000, 10,000, and 30,000, the corresponding prediction accuracies are 97.7%, 98.1%, 98.3%, and 98.2%, 98.3% respectively. The results show that the building scales have no significant effect on the prediction accuracy. Therefore, the designed supervised ML solution can accurately predict the structural type for different building scales.

3.5. Regional Applicability Assessment

The structural types of buildings may differ from different regions. Therefore, if the prediction model is trained with the data of a city, the prediction accuracy may decrease when it is used in other cities.
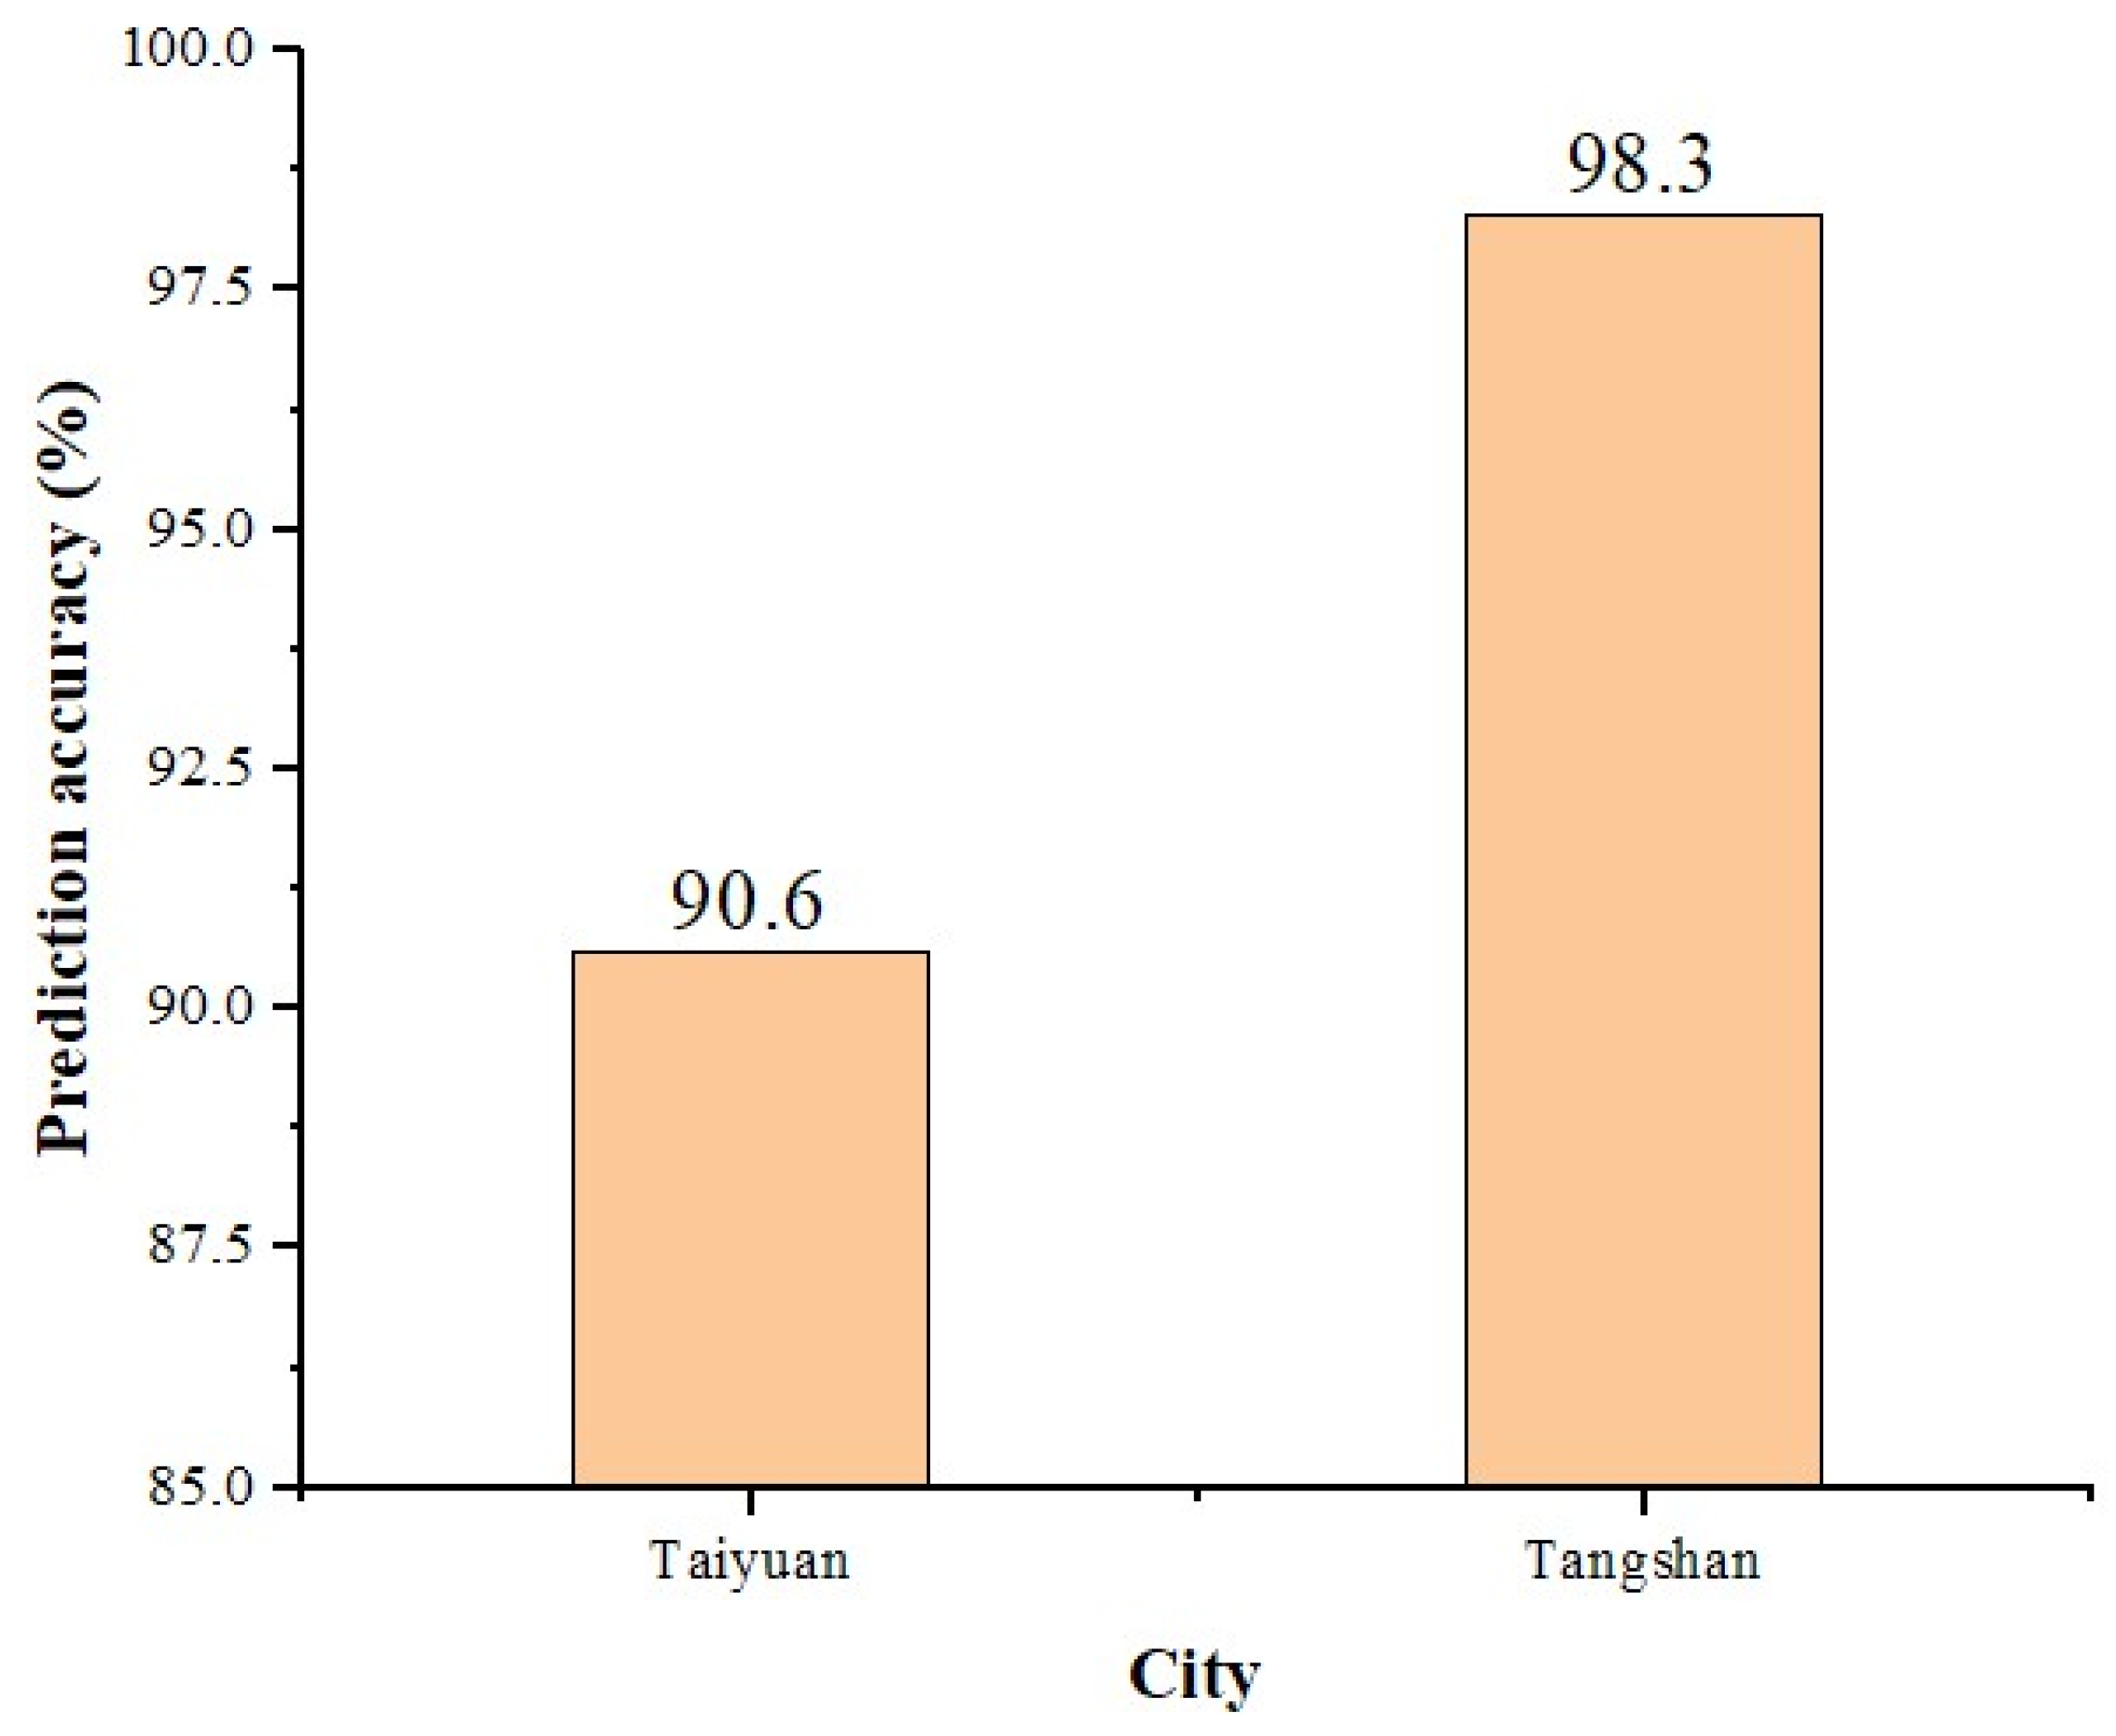
To assess the effects of different regions on the prediction accuracy, the model trained by Tangshan city was used to predict the structural types of 31,154 buildings in the downtown of Taiyuan city, China. Note that the building data of Taiyuan were provided by the department of urban planning in the local government. As demonstrated in Figure 6, the prediction accuracy of Taiyuan is 90.6% using the sample data in Tangshan, while that of Tangshan is 98.3% using the same data.
It is noted that Taiyuan and Tangshan are typical northern cities in China; therefore, the two cities are similar. However, if a southern city is used, the prediction accuracy may be not very high. Therefore, the designed supervised ML solution is recommended to be applied for cities similar to the sample city. Furthermore, a semi-supervised prediction model is designed for better regional applicability.

4. Semi-Supervised ML Solution

4.1. Determination of Sampling Fraction

The designed semi-supervised ML solution is based on the building sampling investigation in the predicted city. In detail, the sampling building is randomly selected, and then the structural types of sampling buildings are determined by consulting the relevant engineering drawings from the urban archive administration, so that the sampled structural types are accurate. The building data obtained by the sampling investigation were used to predict the structural type of all buildings in the city. In the sampling investigation, deficient building data may cause an inaccurate prediction result, while excessive building data incur extensive manual work; therefore, the number of buildings to be investigated (i.e., sampling fraction) is a critical question.
According to the existing building data of the two cities (i.e., Taiyuan and Tangshan), the predictions were performed based on different sampling fractions to determine the optimal fraction. In detail, six sampling fractions (i.e., 0.05%, 0.1%, 0.5%, 1%, 5%, and 10%) were performed for the prediction of two cities. The predictions employ the decision forest model. The sample data were used to train the model, while all the remaining building data in the city except the sample data were used for assessing the accuracy of the prediction.
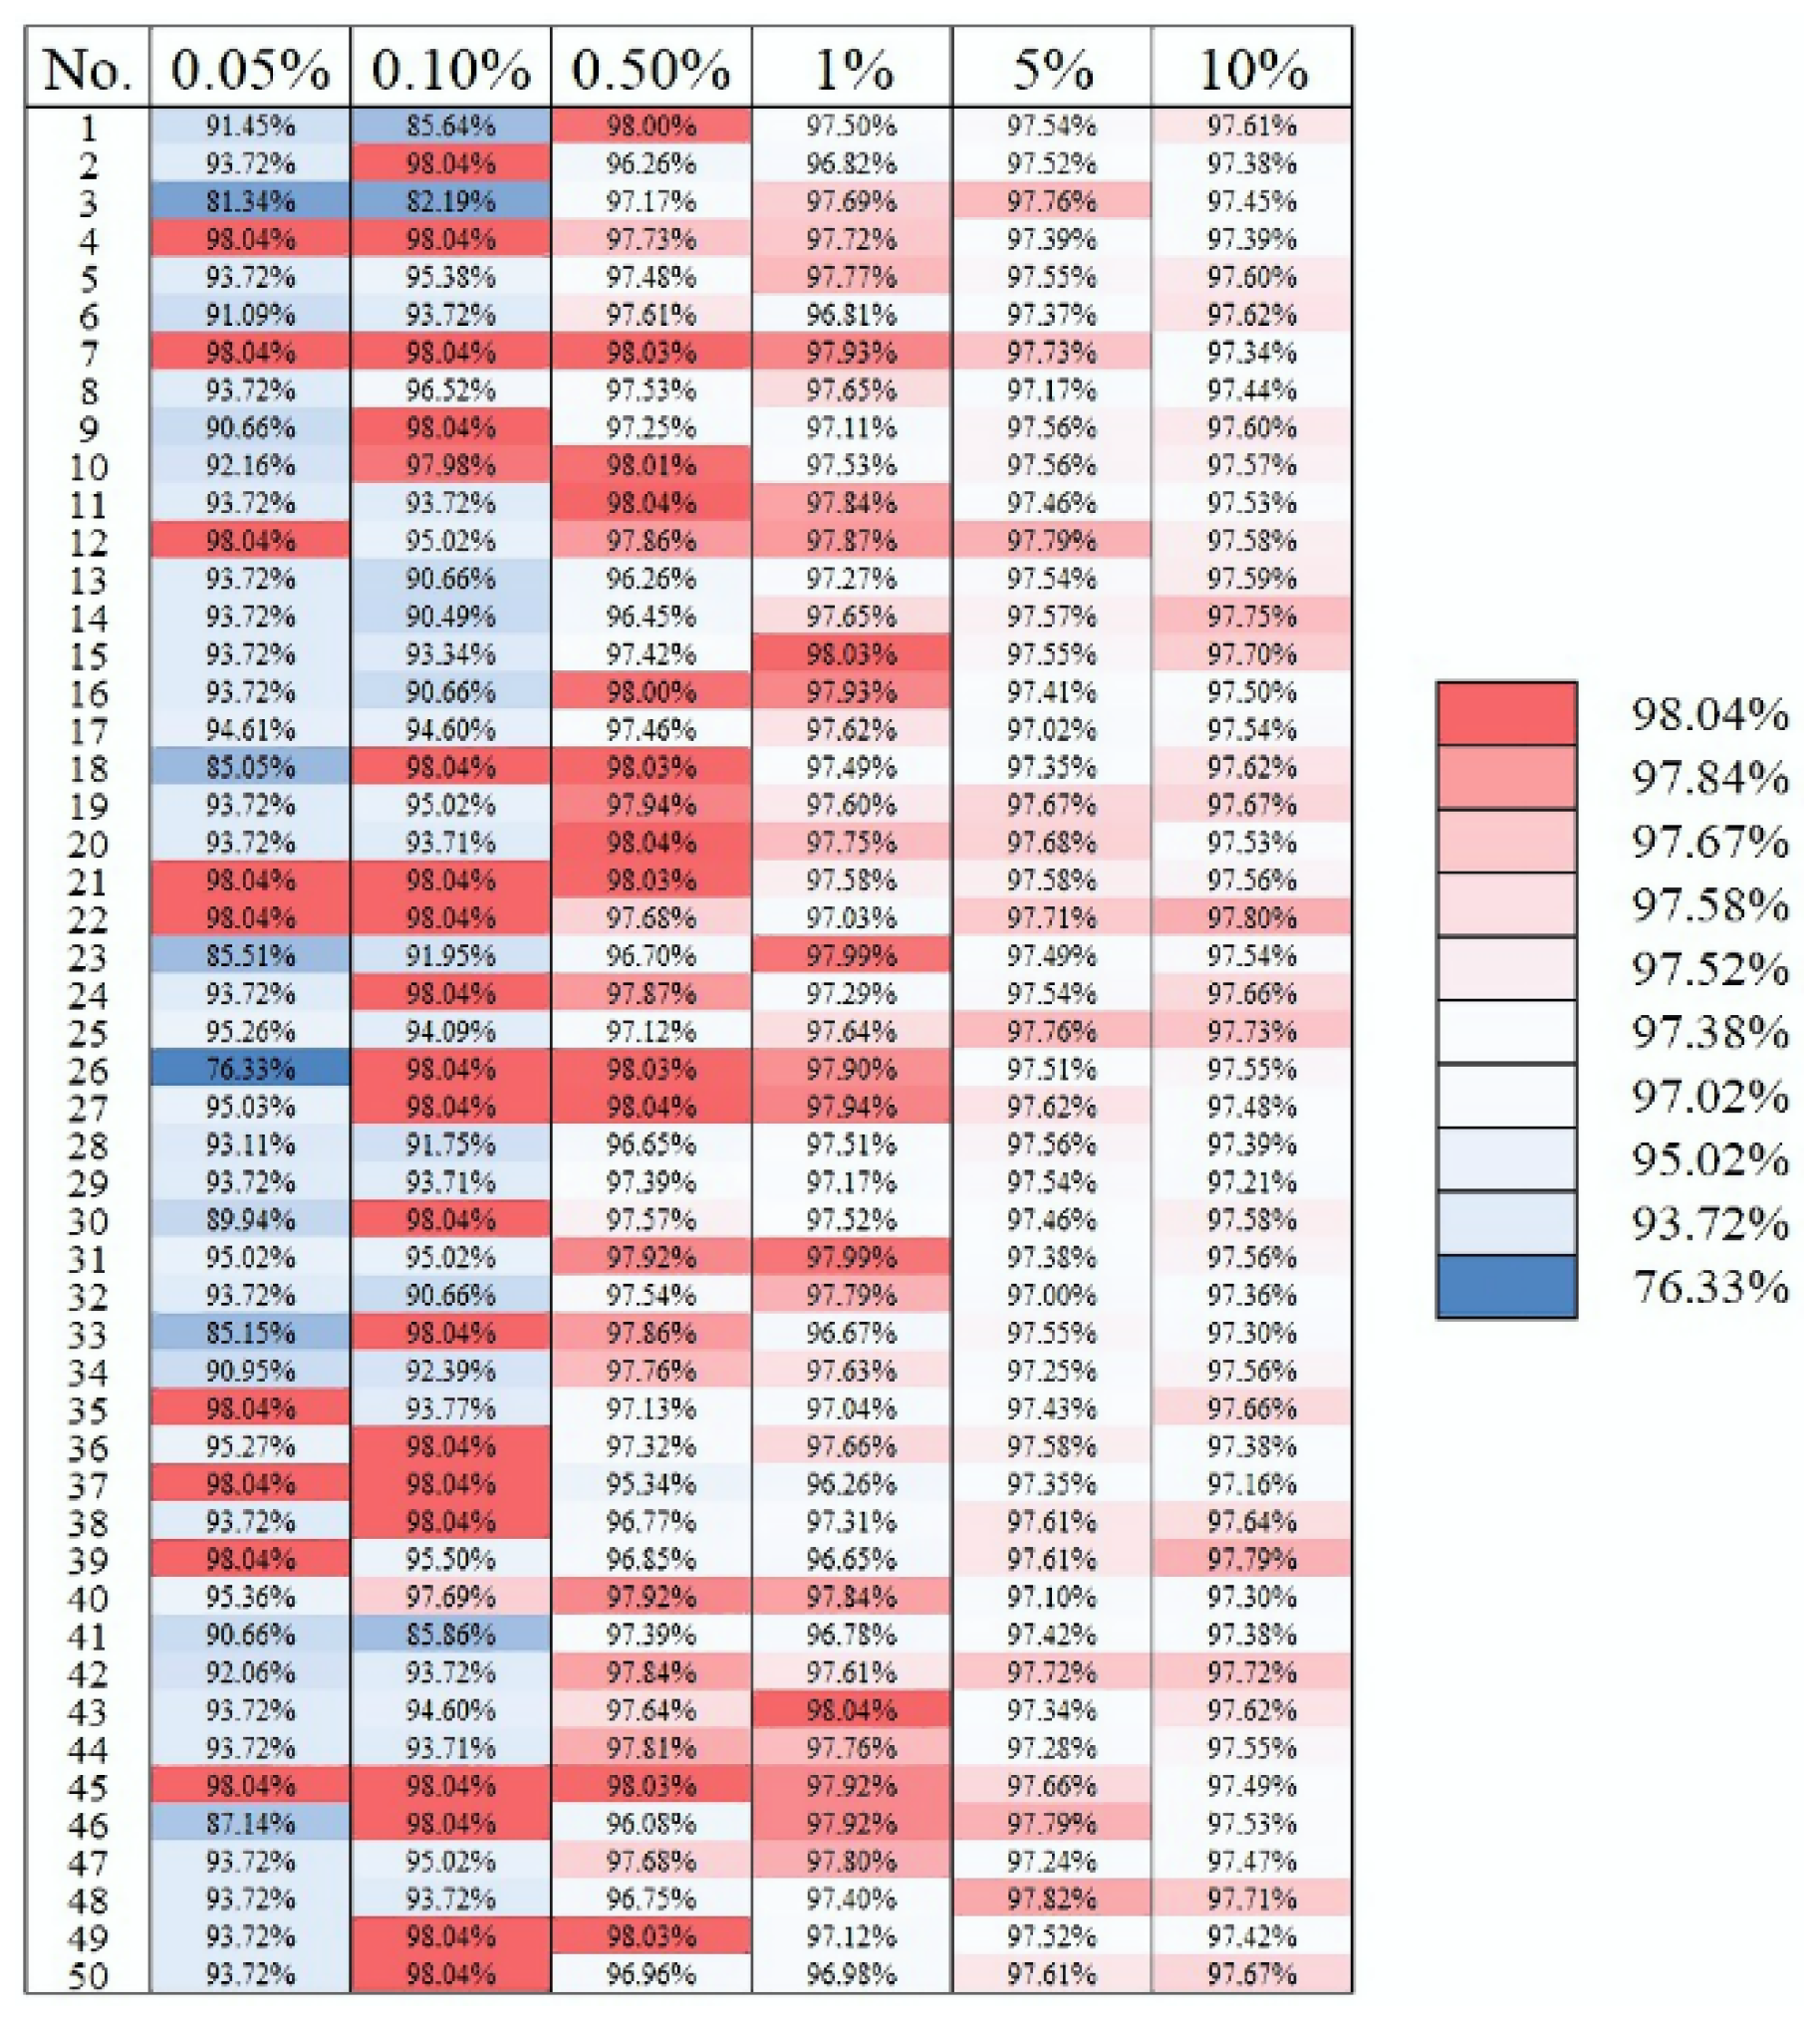
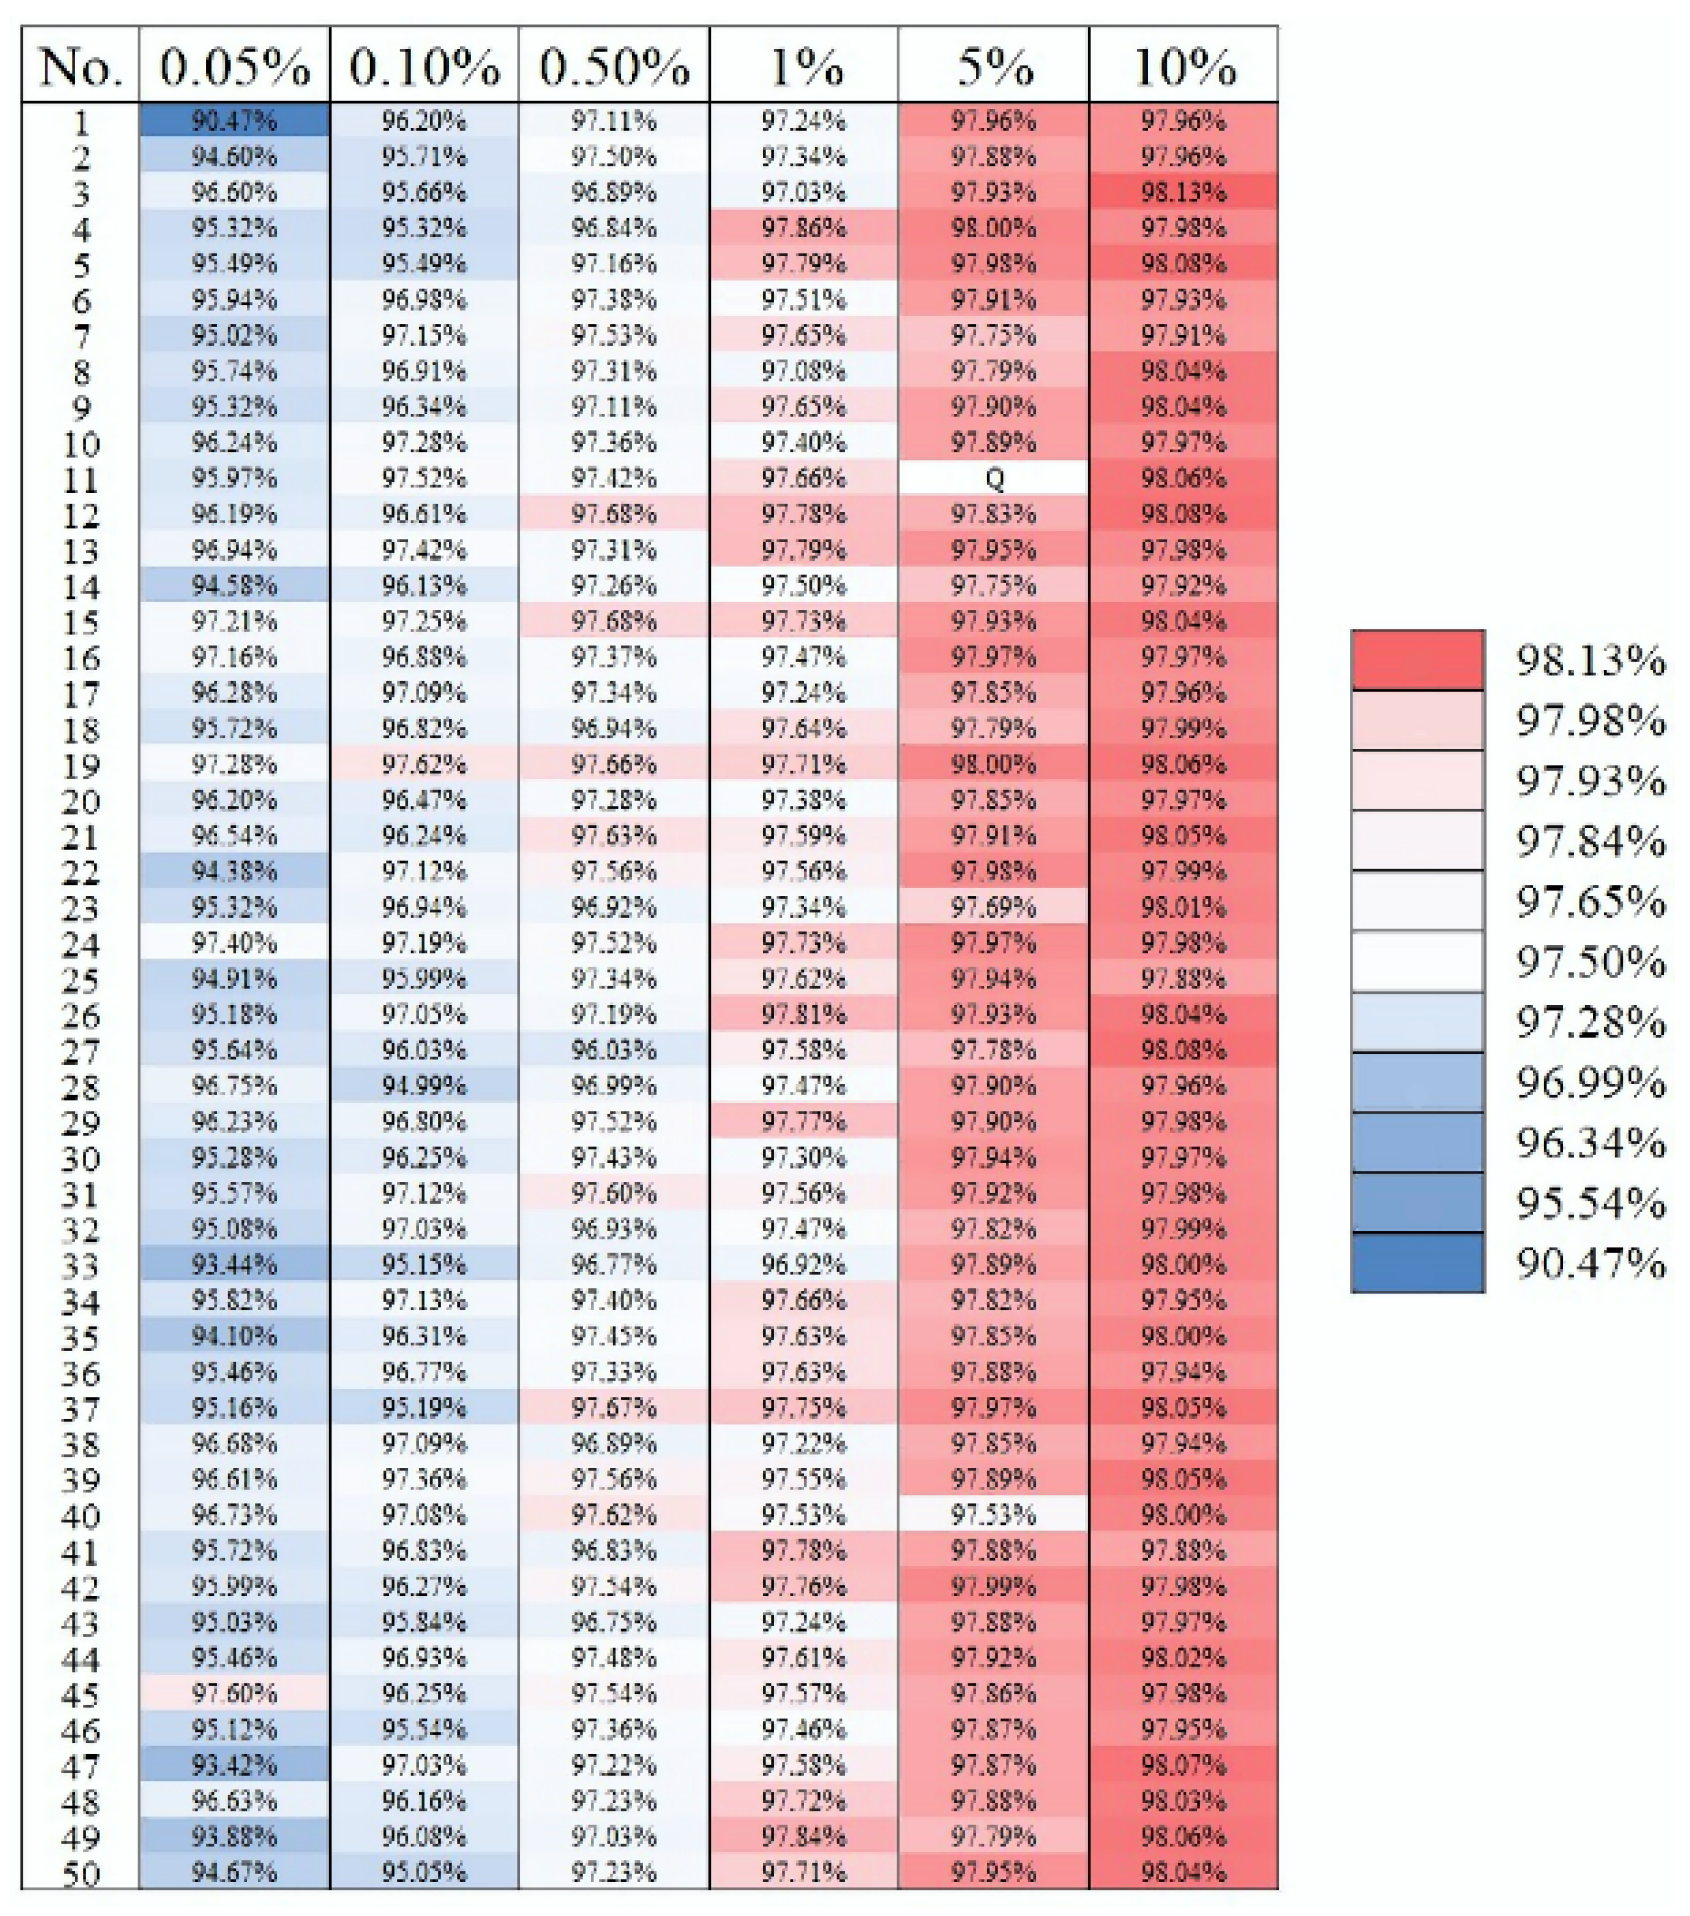
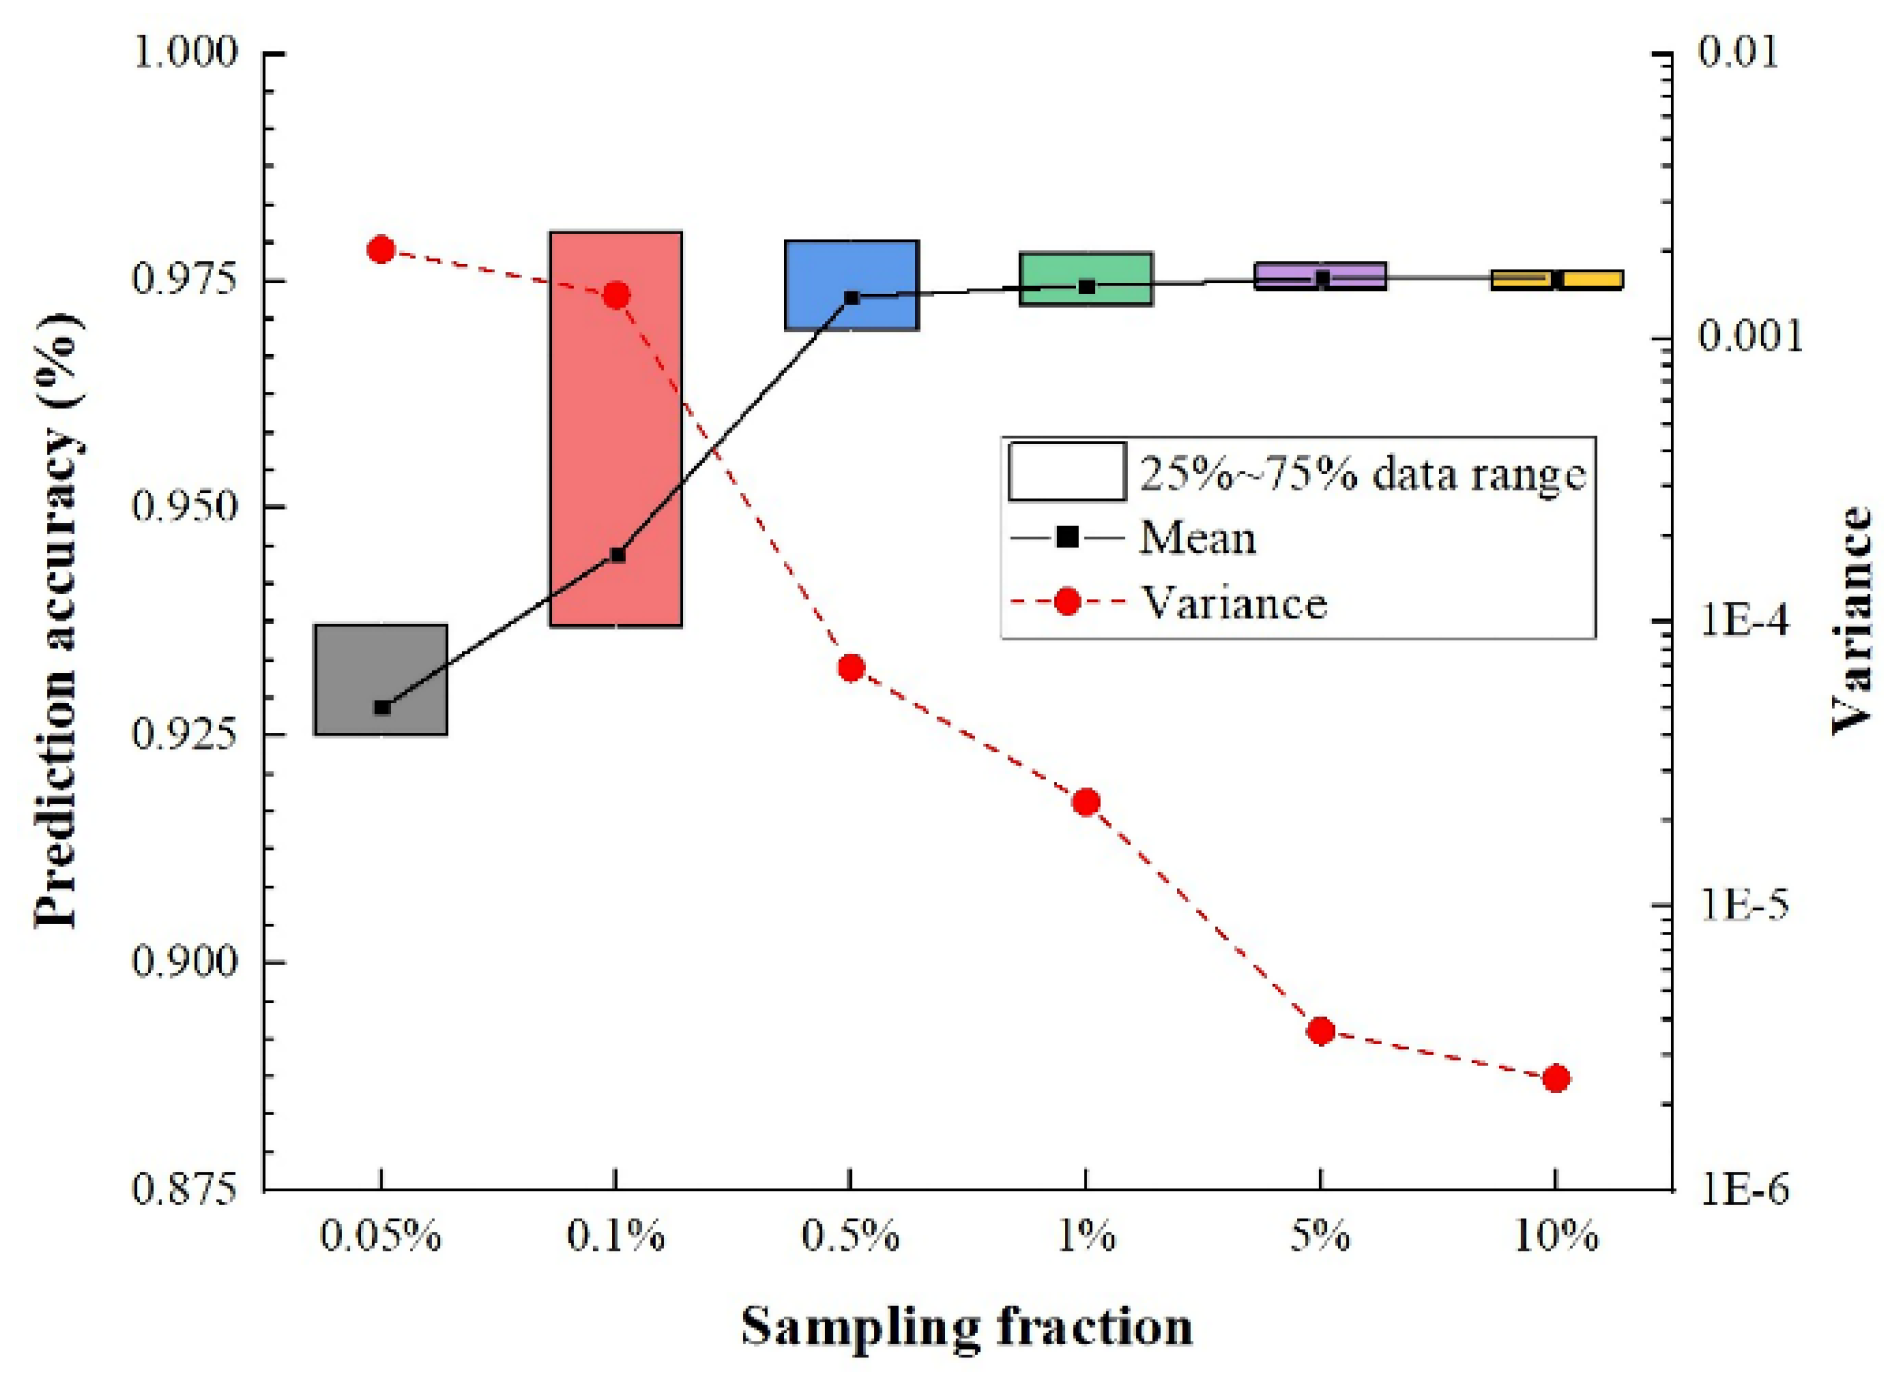
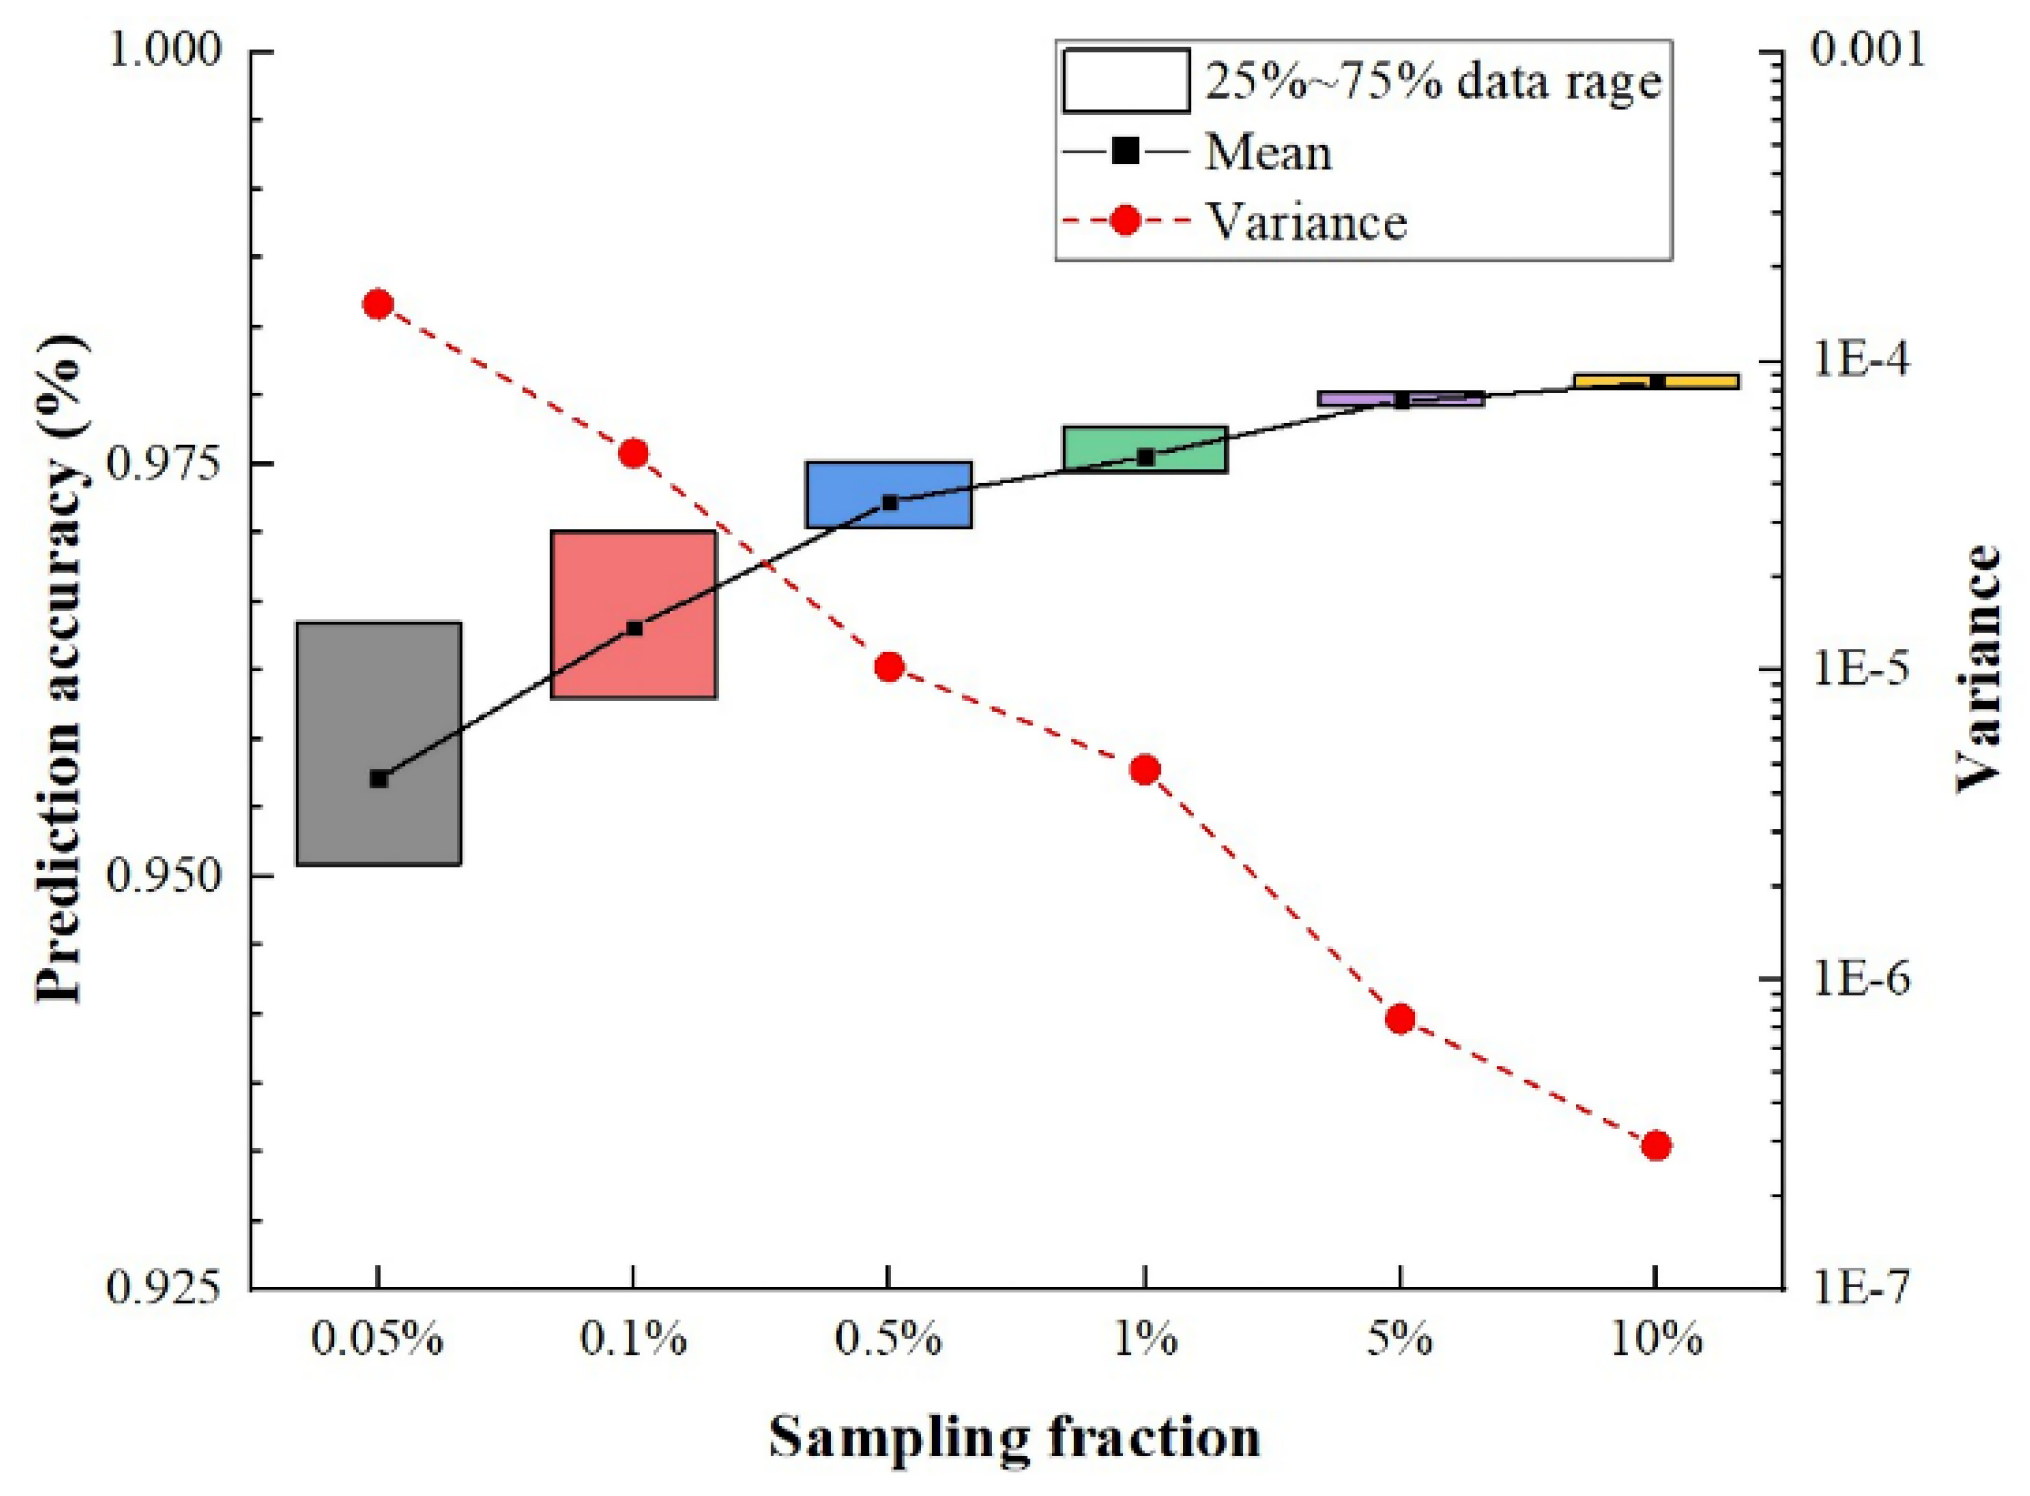
For Taiyuan and Tangshan, the data were randomly sampled 50 times at each sampling fraction, and the corresponding 50 times prediction were performed according to the sampled data. The accuracies of the predictions are shown in Figure 7 and Figure 8. The curves of prediction accuracies and variance with the sampling fractions are illustrated in Figure 9 and Figure 10, respectively.
According to the prediction results of Taiyuan and Tangshan (shown in Figure 9 and Figure 10, respectively), when the sampling fraction is greater than 1%, the prediction is highly accurate (i.e., above 97% in two cases) and the variance of the prediction accuracies decreases. Therefore, the sampling fraction of 1% is recommended for predicting the structural type of a city.

4.2. Semi-Supervised ML Solution

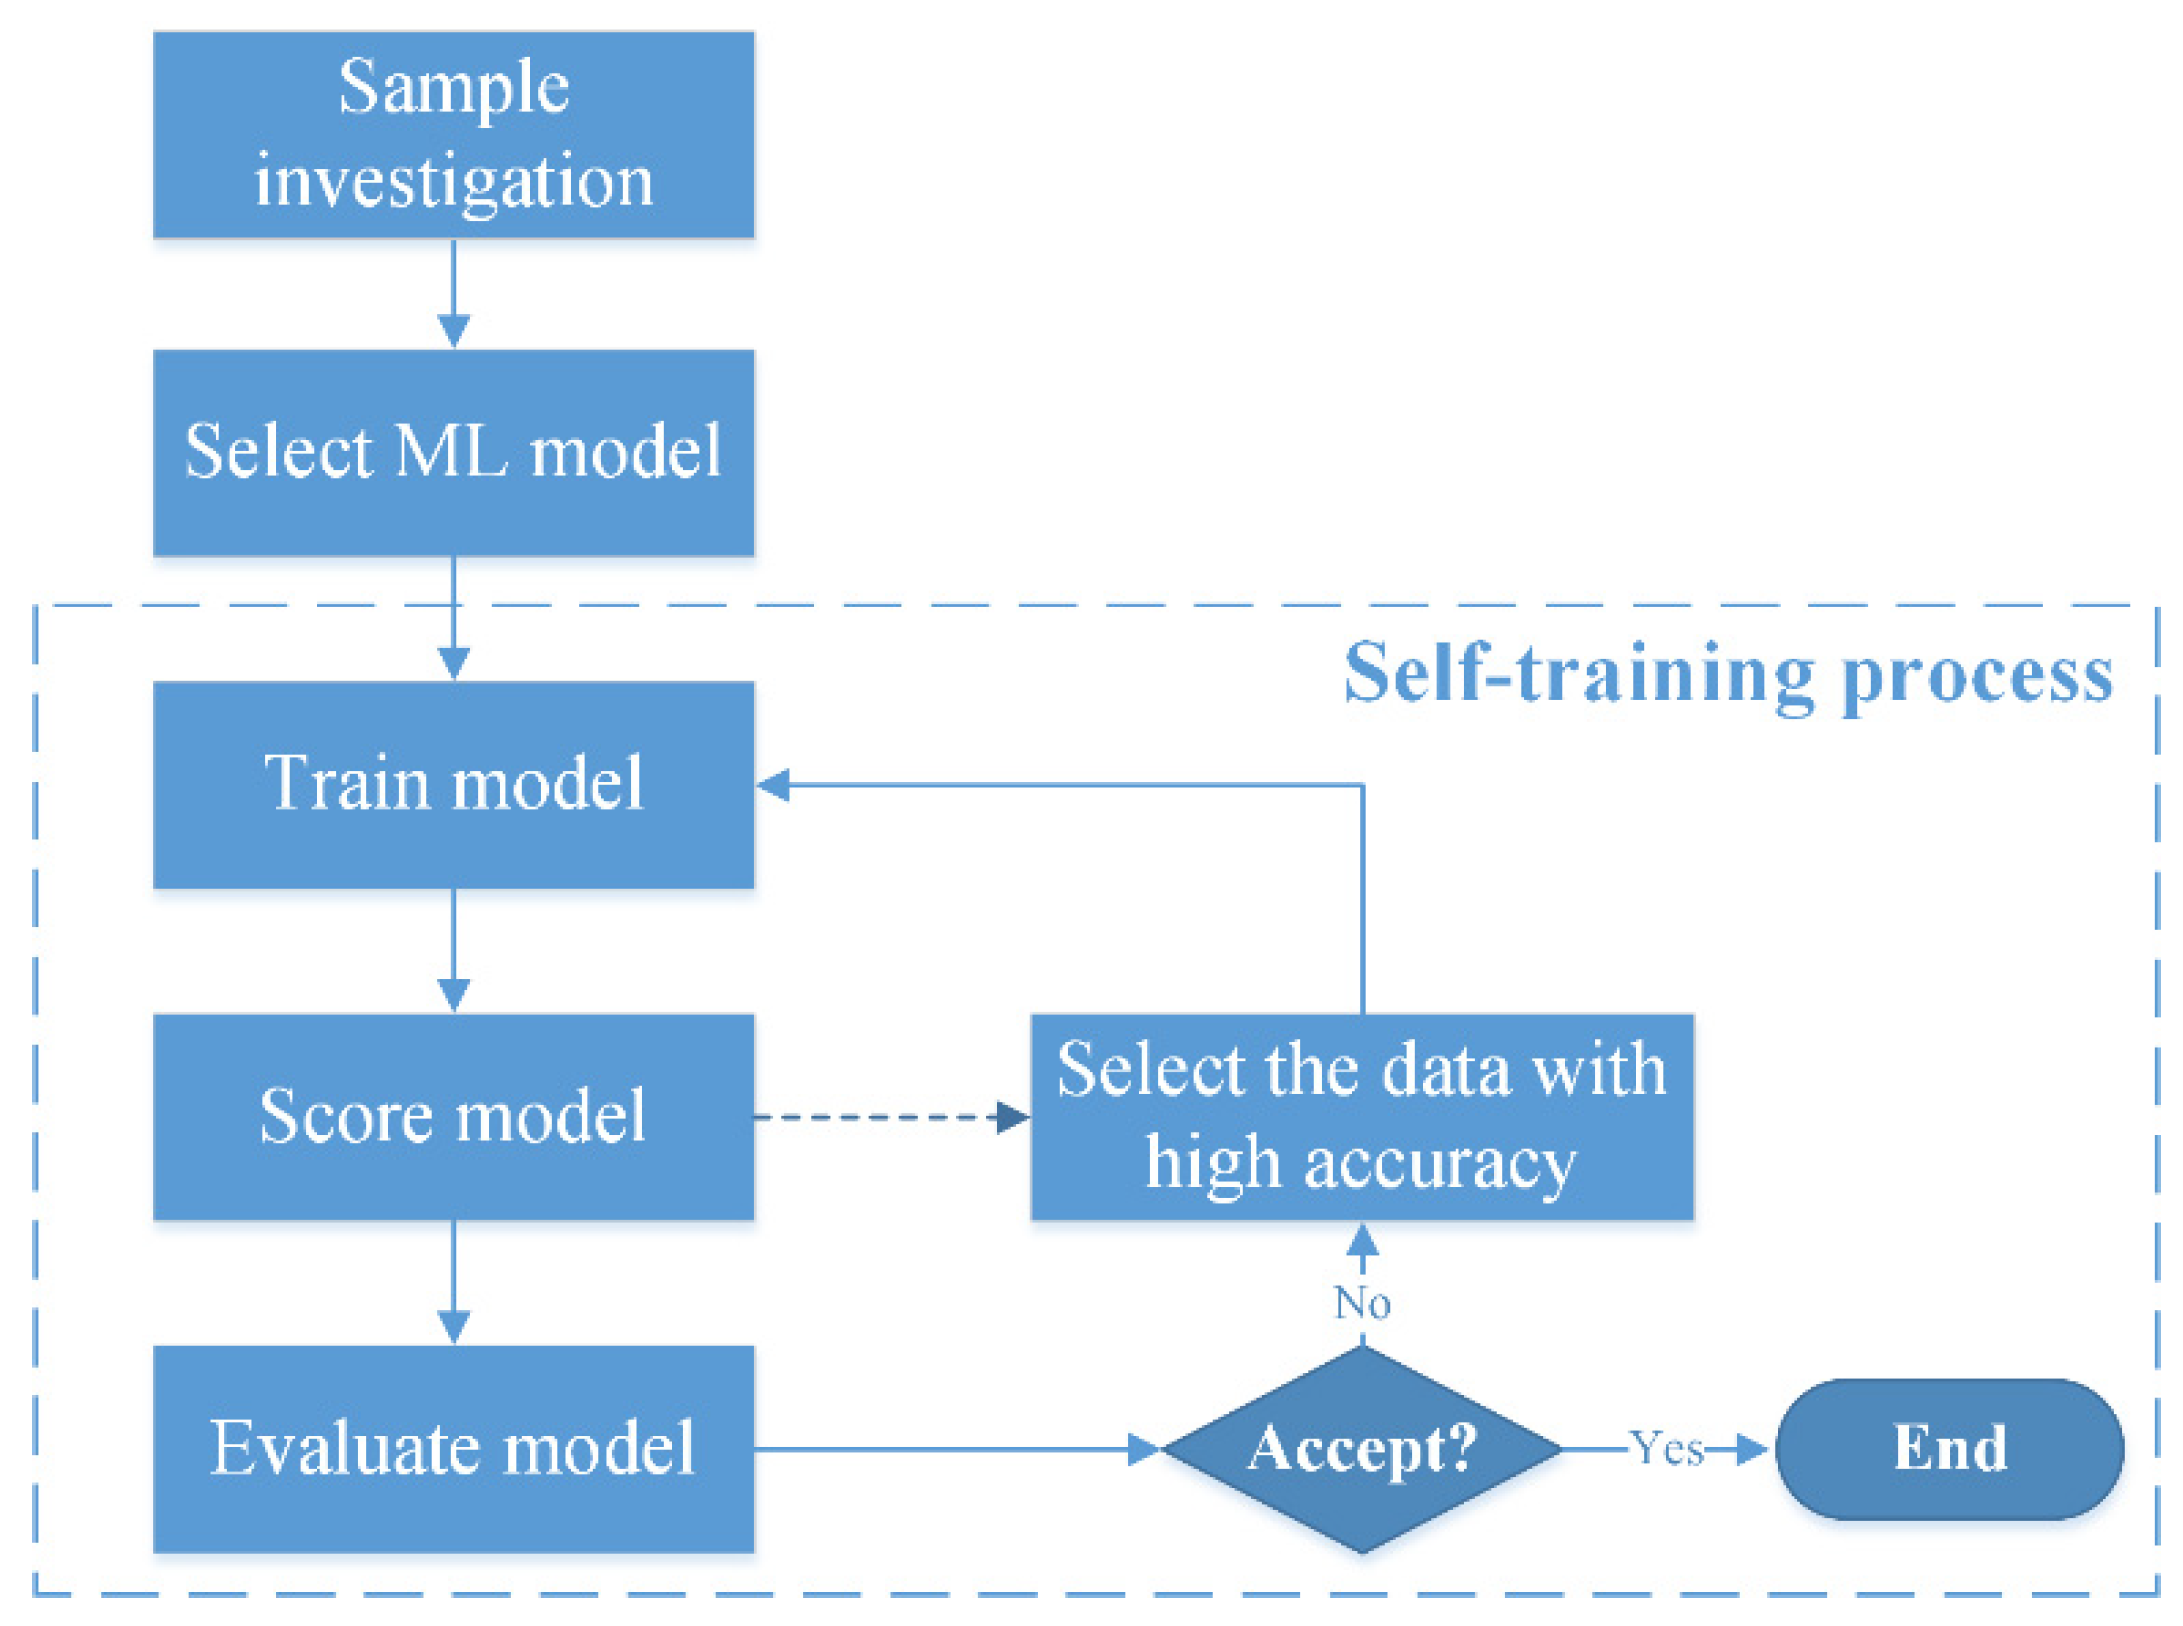
The designed semi-supervised solution is shown in Figure 11. First, the sample data are obtained by the building investigation. The aforementioned prediction results indicate that when the sampling fraction of the building investigation is 1%, the prediction will be highly accurate. In this study, the sampling fraction of 3% was adopted. In detail, 1% of the sample data was used for training the model, while 2% of sample data for assessing the accuracy of the prediction. Subsequently, the designed supervised ML solution indicated that the decision forest model has the best performance for the prediction of structural type; therefore, the decision forest model was selected. Finally, a self-training process [30,31,32] was performed iteratively until the prediction accuracy was accepted. Specifically, the ML model was trained by the sample data, and then the prediction of the trained model was scored and evaluated, separately. If the prediction accuracy of the trained model is accepted, then the training process will end; otherwise, building data with high accuracies will be selected, and these data will be used for the next training to obtain better prediction results. Such an iterative training process is defined as a self-training process.
Using Tangshan as an example, the designed semi-supervised training process is demonstrated as follows.
(1) First self-training
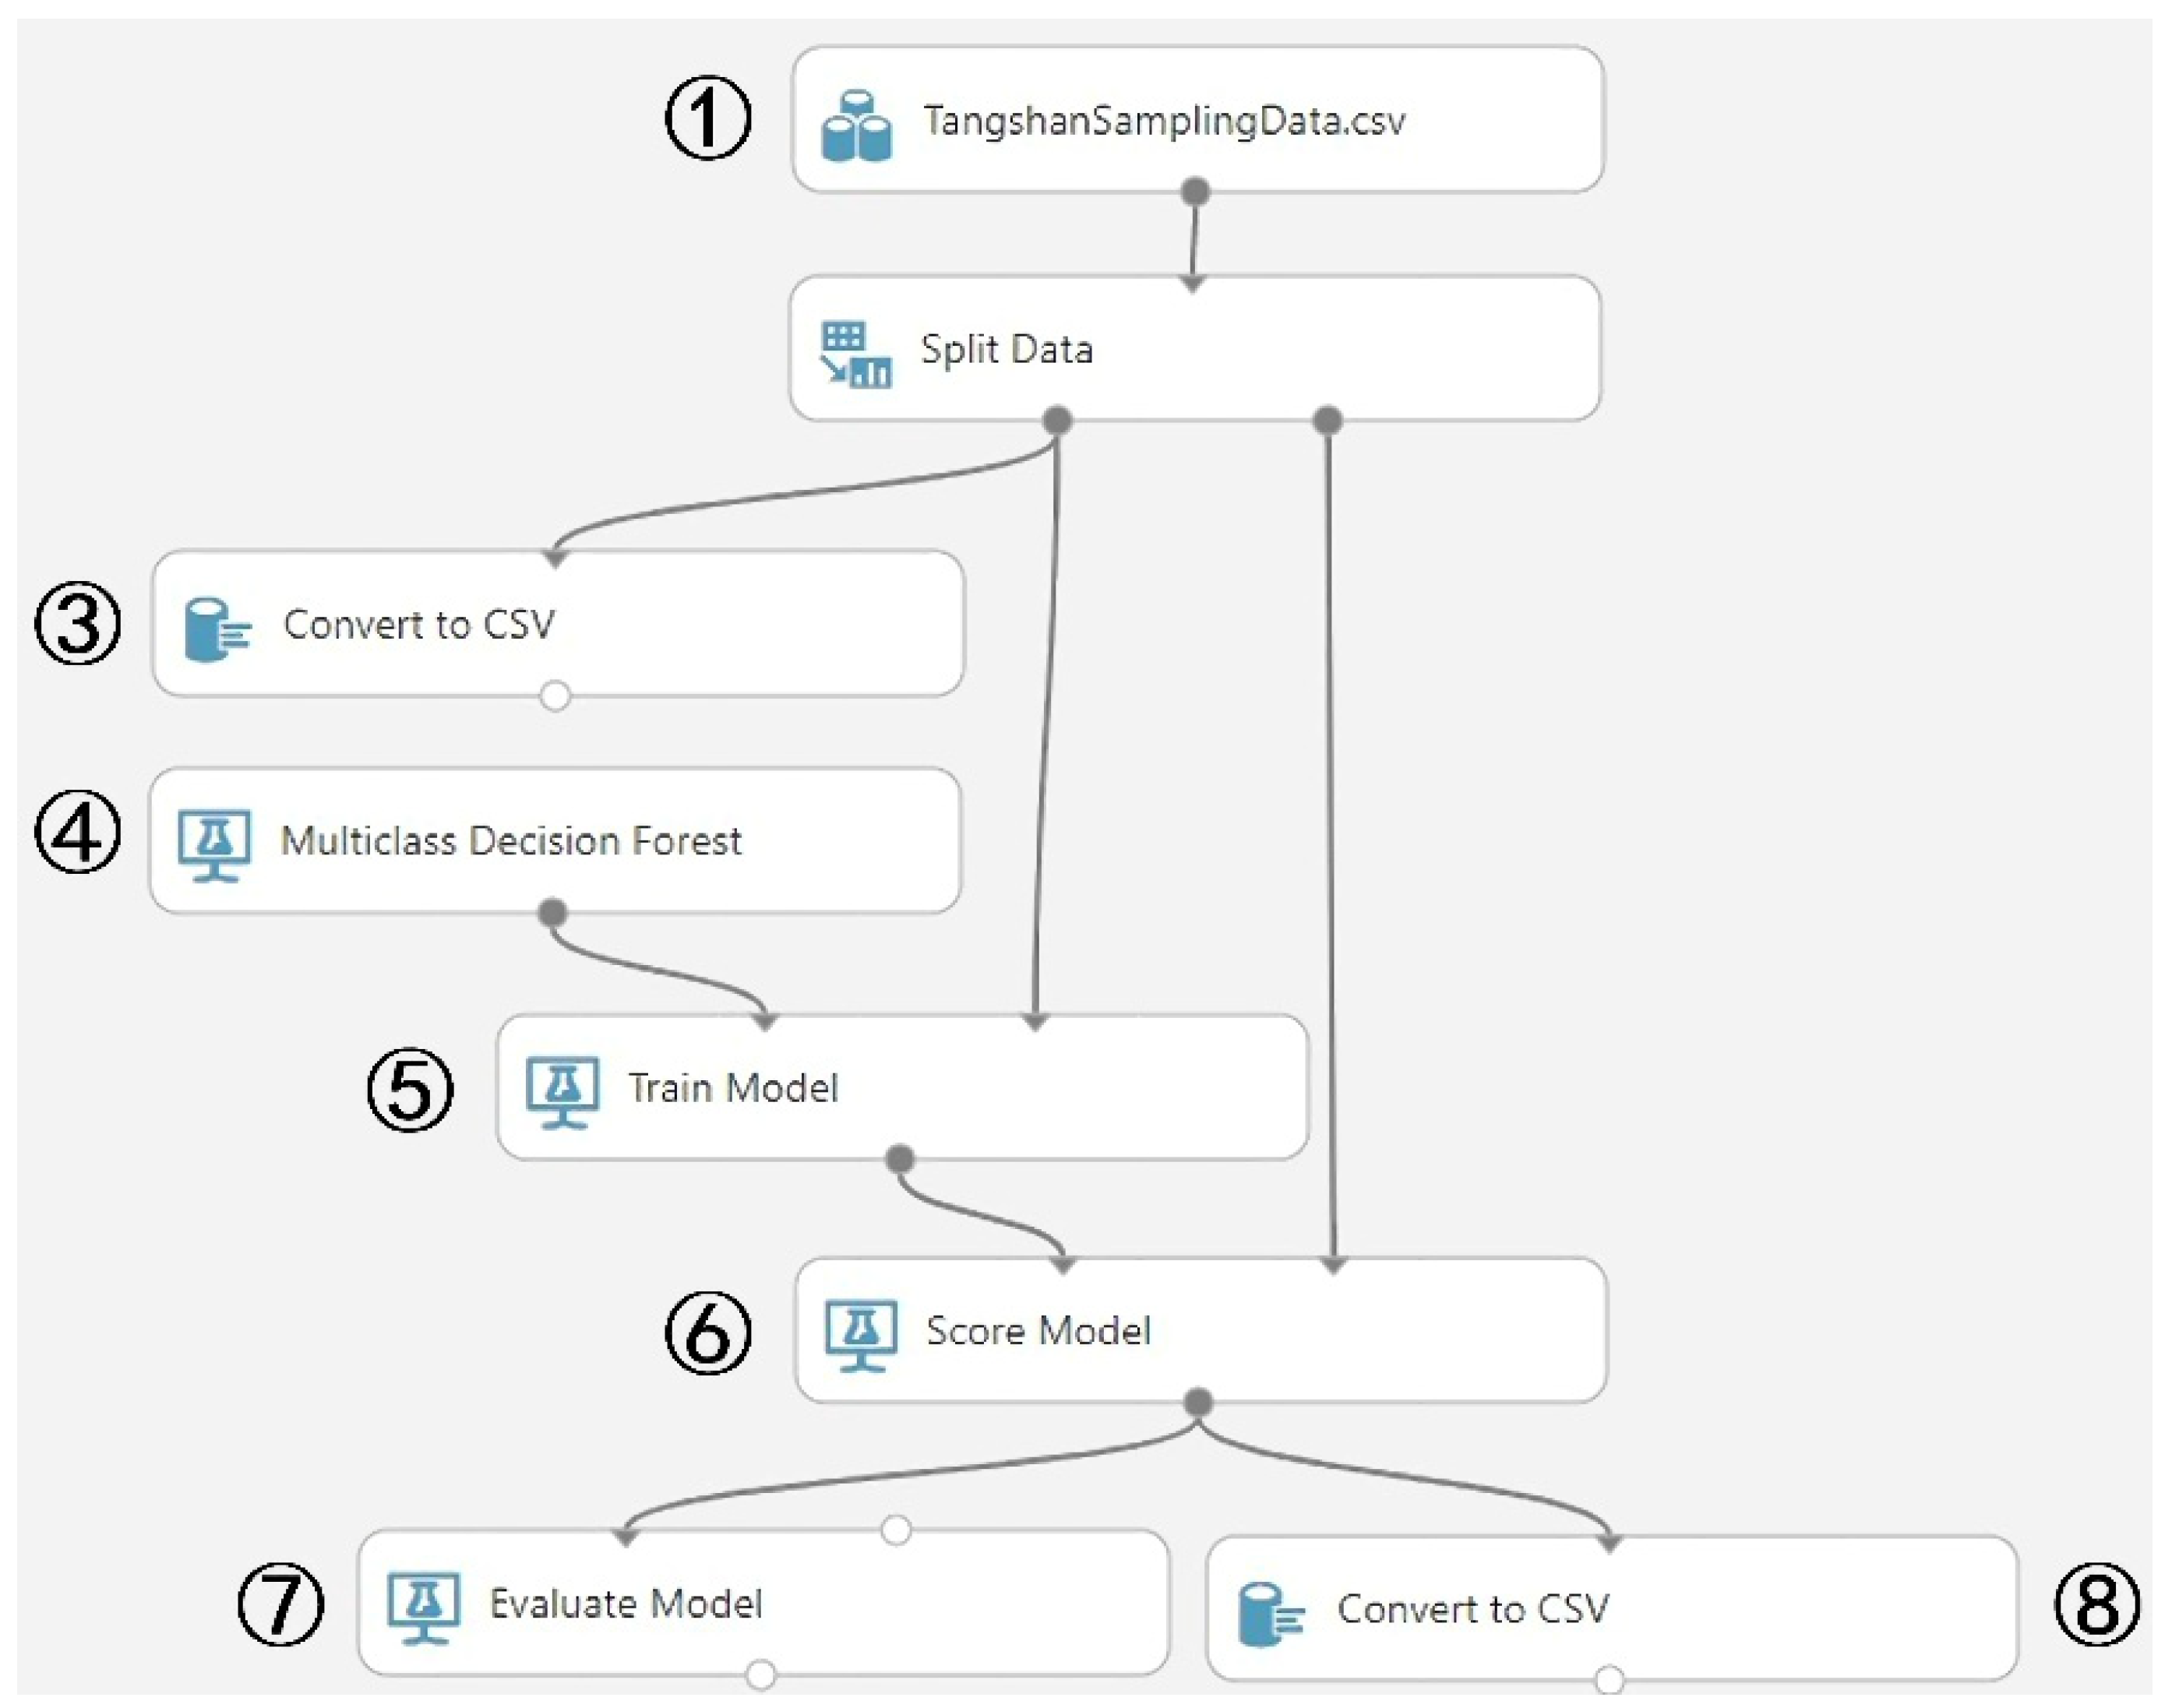
The process of first self-training can be implemented using the components in Azure, as shown in Figure 12.
  • Component 1 (Data Set): Select the sample data from the building investigation, i.e., 3% of buildings in Tangshan.
  • Component 2 (Split Data): 1/3 of the sample data are used for training the model (i.e., Component 5), while the remaining 2/3 of the data are used for scoring the model (i.e., Component 6).
  • Component 3 (Convert to CSV): Export the training data to CSV format for the subsequent training.
  • Component 4 (Multi-class Decision Forest): Select the multi-class decision forest model for prediction.
  • Component 5 (Train Model): Train the selected ML model using the training data.
  • Component 6 (Score Model): Score the accuracies of the prediction results with the assessment data, as shown in Figure 13. By doing this, the building data with high accuracies will be identified. In this study, the building data ranked top 1% in the scored probabilities will be selected for the next training.
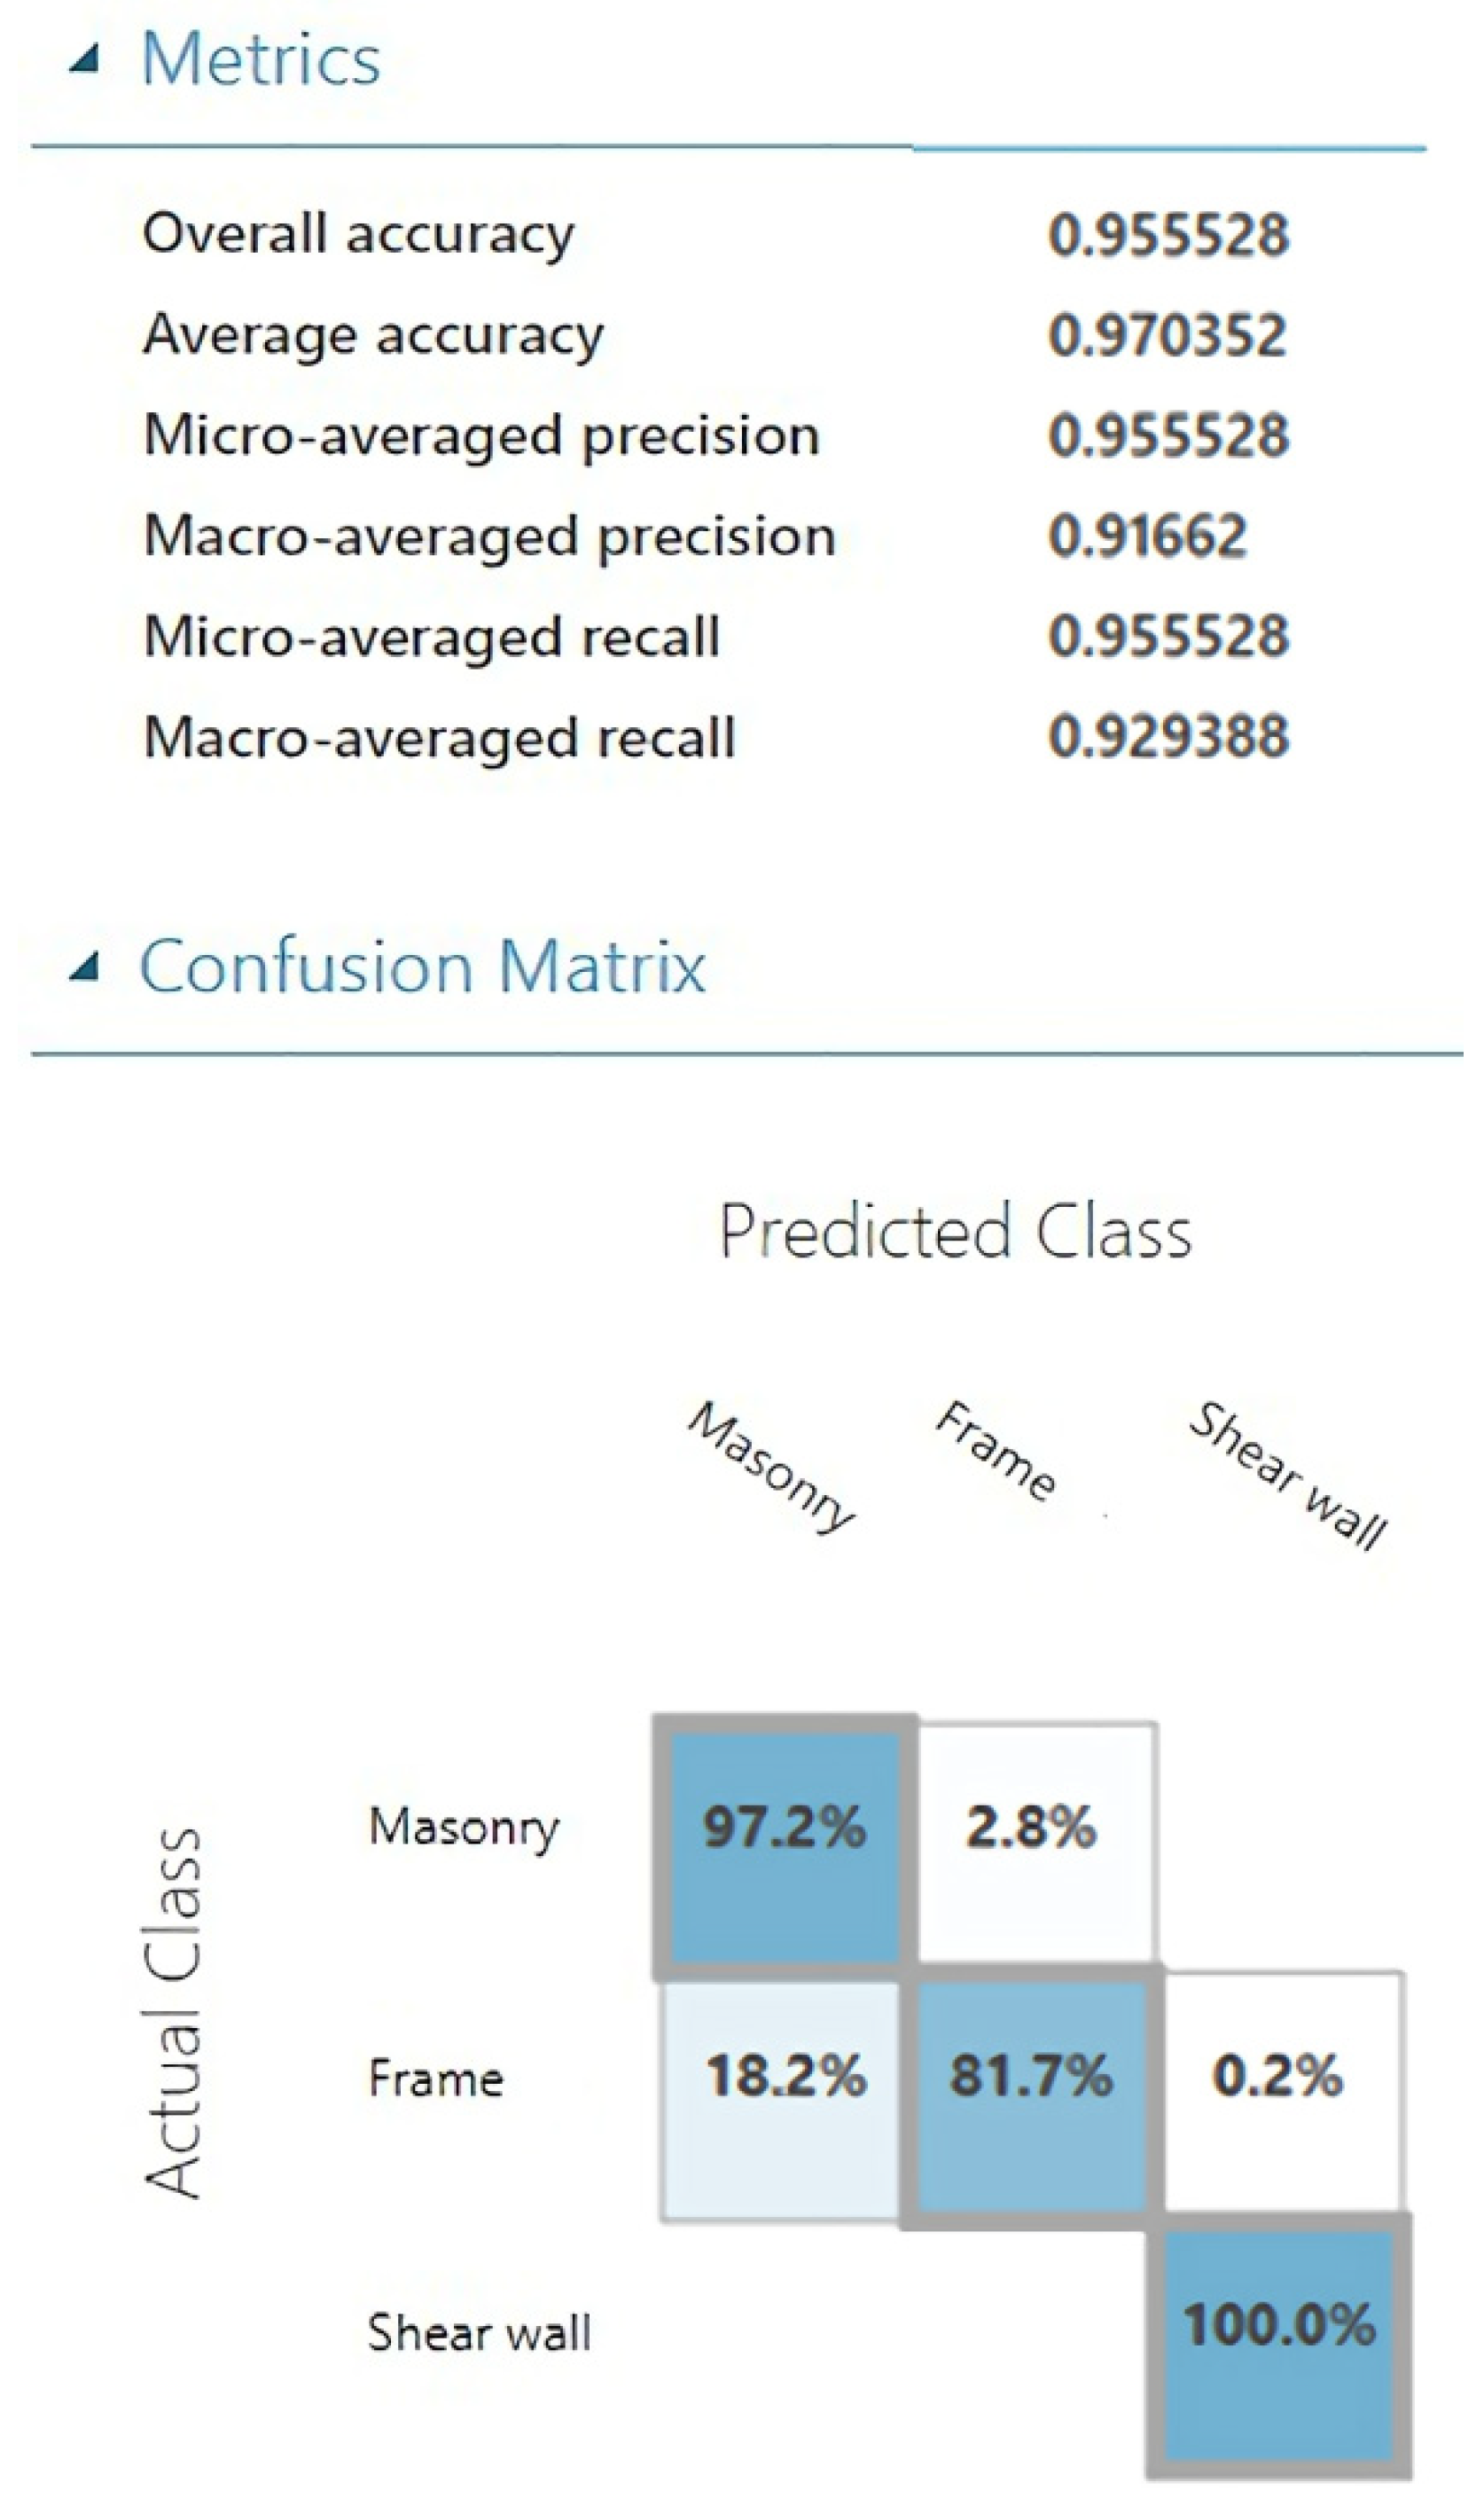
  • Component 7 (Evaluate Model): Evaluate the performance of the prediction model and output the evaluation results. As shown in Figure 14, the overall prediction accuracy of the first self-training reaches 95.5%. However, the accuracy of the frame structure is only 81.7%, which is not acceptable; therefore, a second self-training is required.
  • Component 8 (Convert to CSV): Convert the building data with high accuracies (see Component 6) to CSV format such that these data can be used for the second self-training.
(2) Second self-training
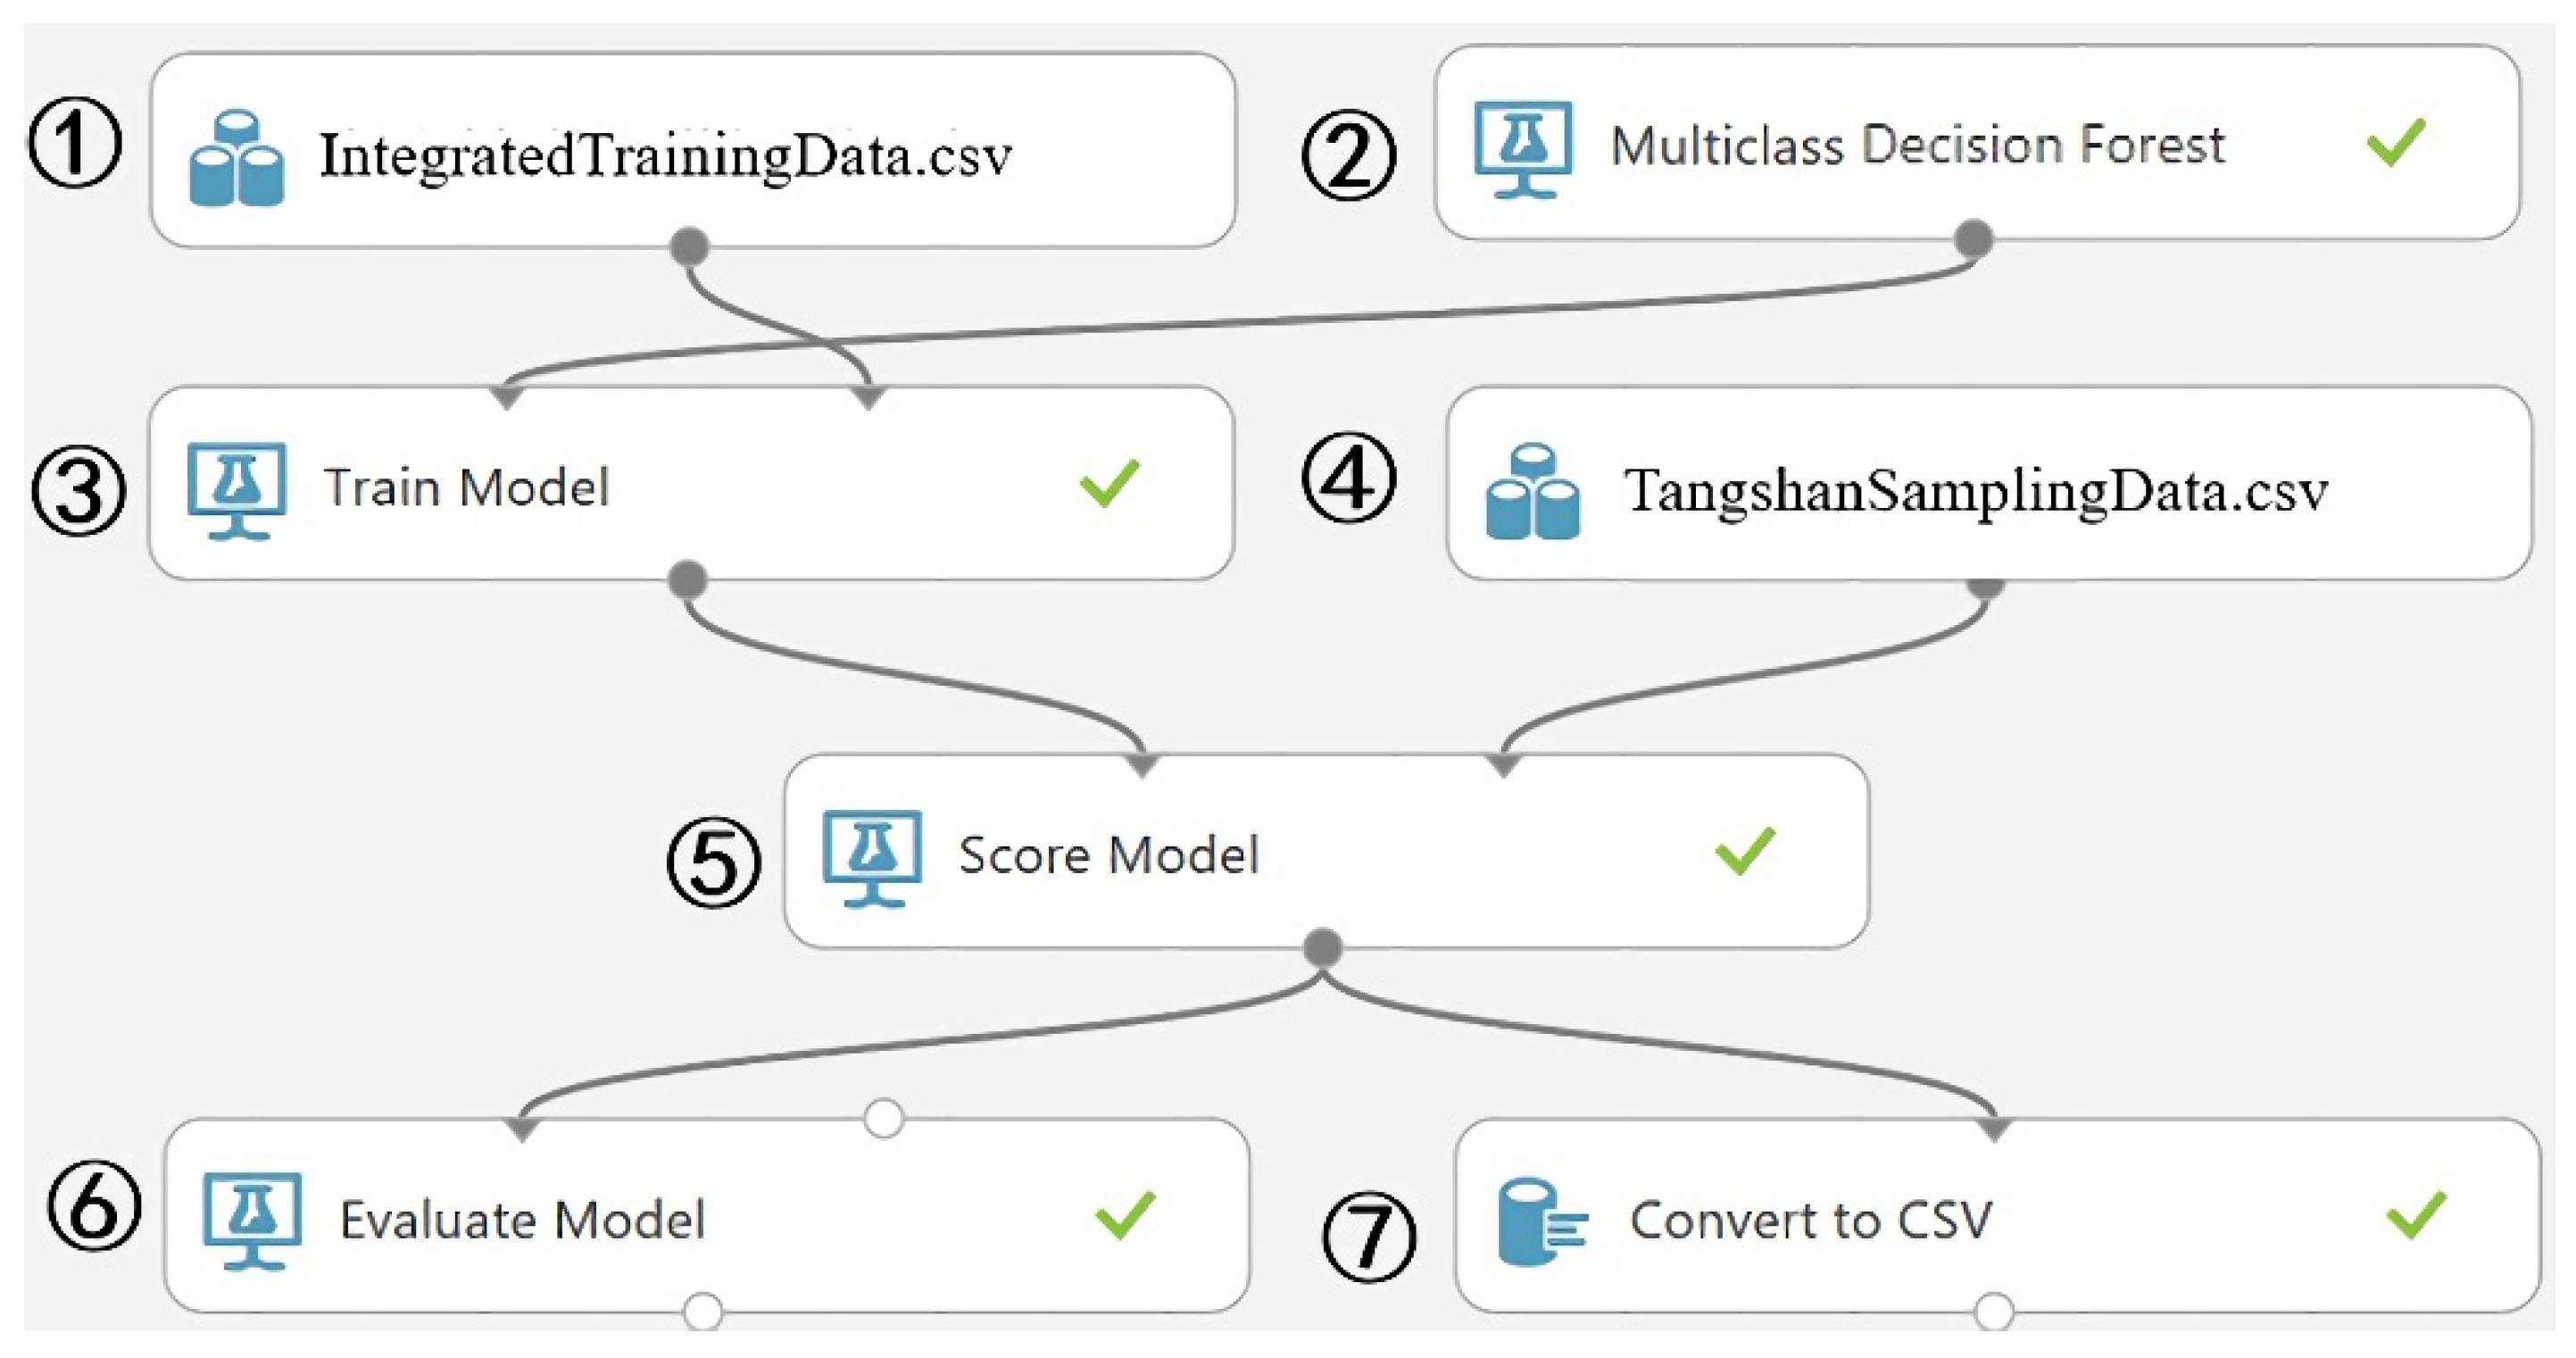
Second self-training was implemented using components in Azure, as shown in Figure 15. However, the training data used were different from those of the first self-training. The original training data (the CSV file in Component 3 in Figure 12) and the identified building data with high accuracy (the CSV file in Component 8 in Figure 12) were integrated as the training data for the second self-training. It is noted that the assessment data (i.e., 2/3 of the sample data) were the same for all self-trainings.
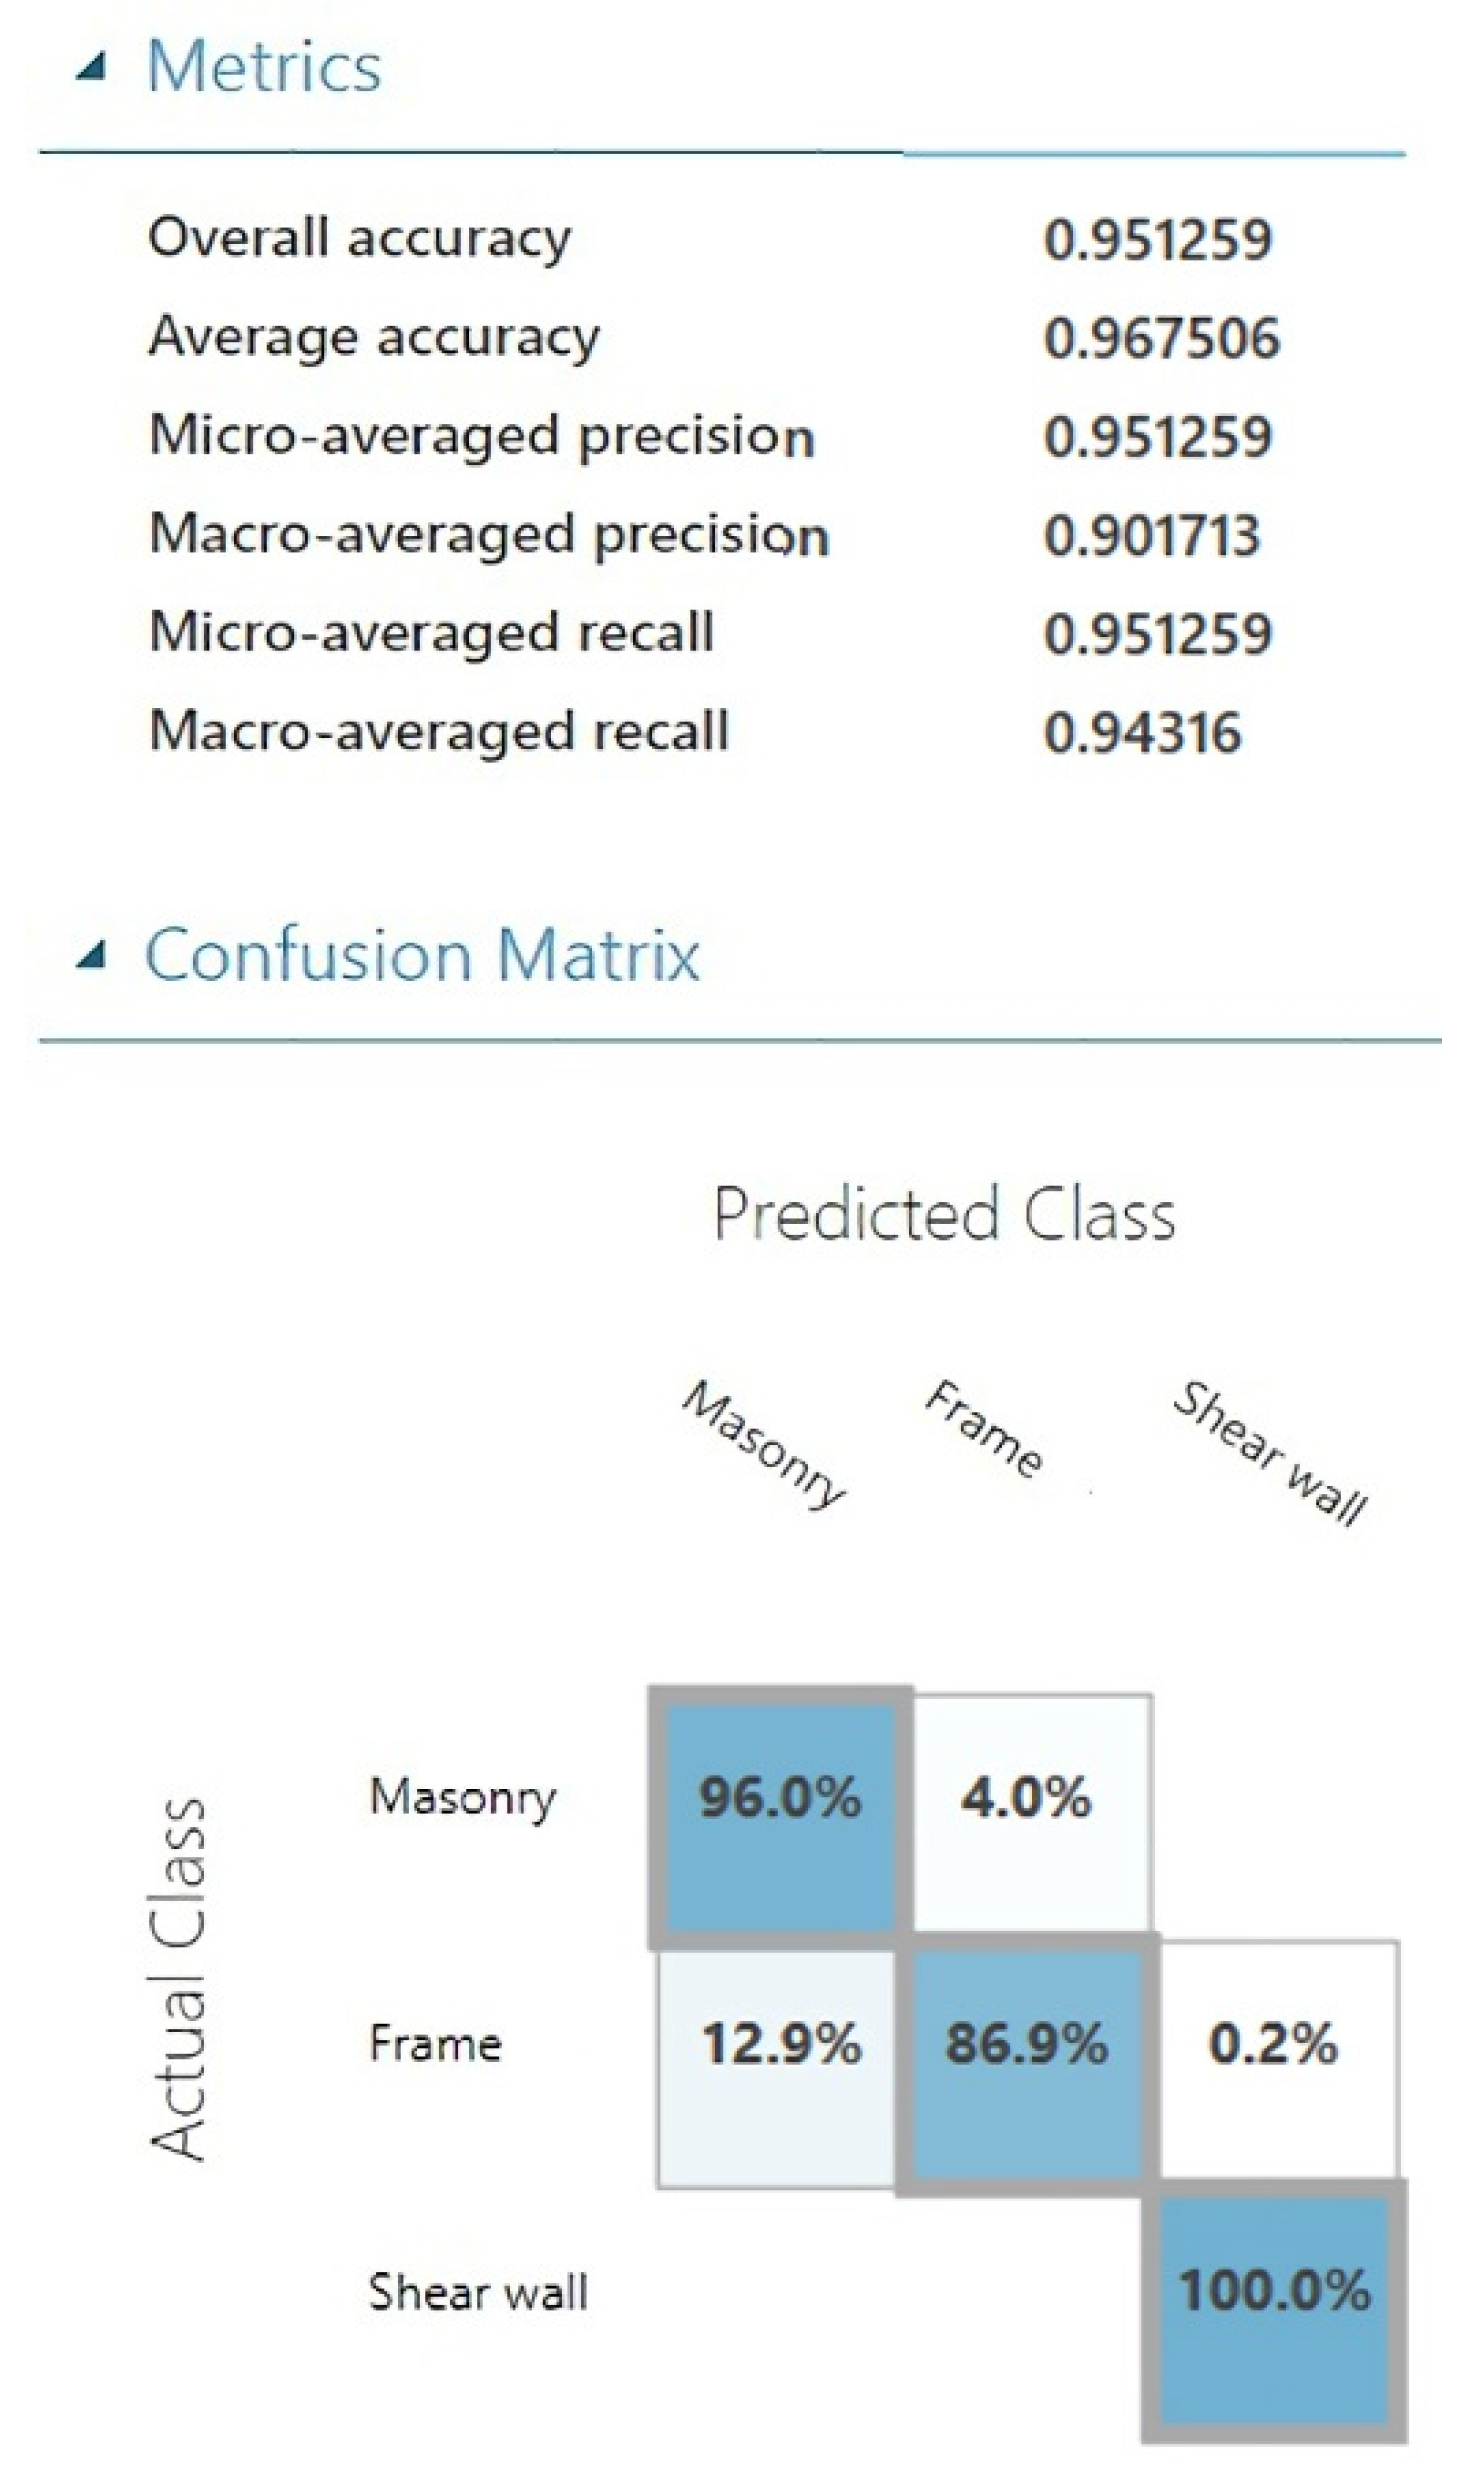
Similar to the first self-training, the model was trained and evaluated. As shown in Figure 16, the overall accuracy rate is above 95.1%, which is similar to that of the first self-training (95.5%). In particular, the prediction accuracy of the frame structure increased from 81.7% to 86.9%, which is an improvement. Similarly, the building data with high accuracies were converted to CSV format for the next self-training.
(3) Third self-training
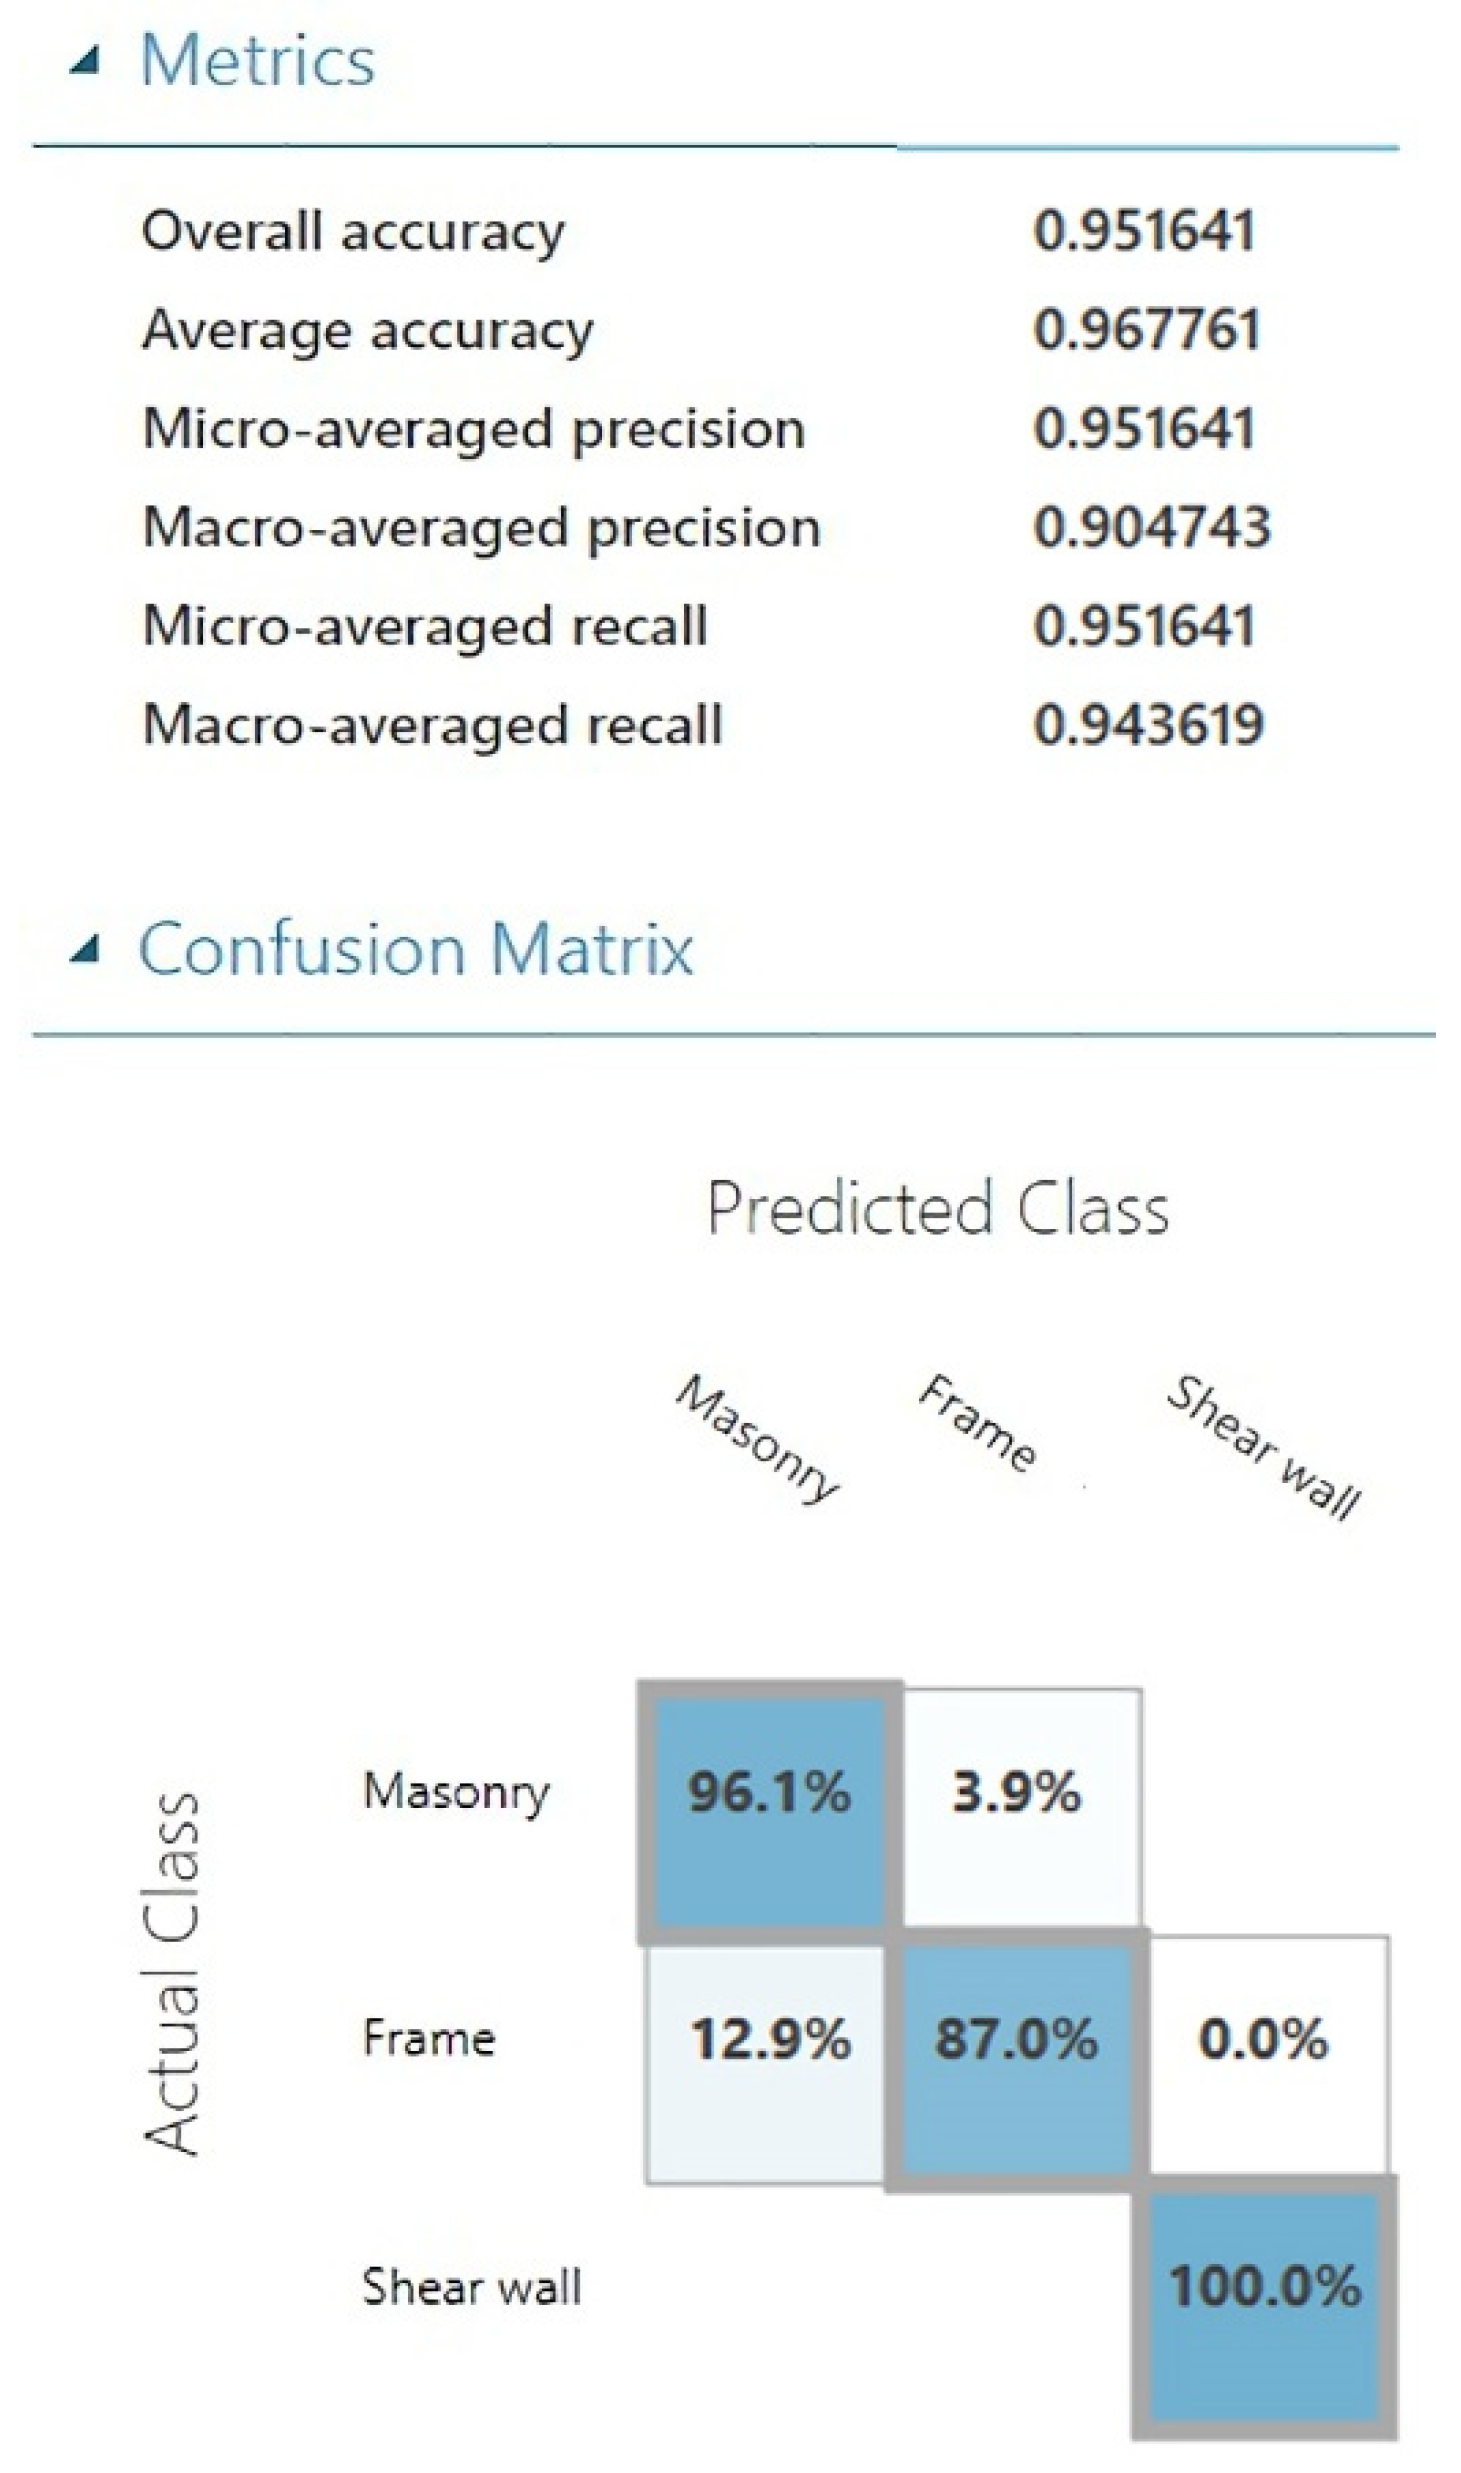
After the third self-training, the prediction results are as shown in Figure 17. The overall prediction accuracy of the model is 95.2%. In detail, the prediction accuracies of the masonry, frame, and shear wall structures are 96.1%, 87.0%, and 100.0%, respectively. The accuracies of the overall prediction and each type of structure will not increase significantly compared with those of the last self-training. In addition, the corresponding precision and recall are also very high, as shown in Figure 17. Therefore, additional self-trainings are not required.
The predicted structural type of all the buildings by the third self-training was compared with the real data in Tangshan, and the error is shown in Table 2. The results indicate that the designed semi-supervised ML solution can achieve a high prediction accuracy even when using 1% of all the building data. Both the other attribute data of buildings and the structural types of the sampling buildings are accurate, which guarantees the prediction accuracy using the designed ML solution. Furthermore, the self-learning process can improve the prediction accuracy. Therefore, the prediction results in Table 2 is exact compared with the real structural types of buildings in Tangshan.

5. Case Study

5.1. Introduction of Case Study

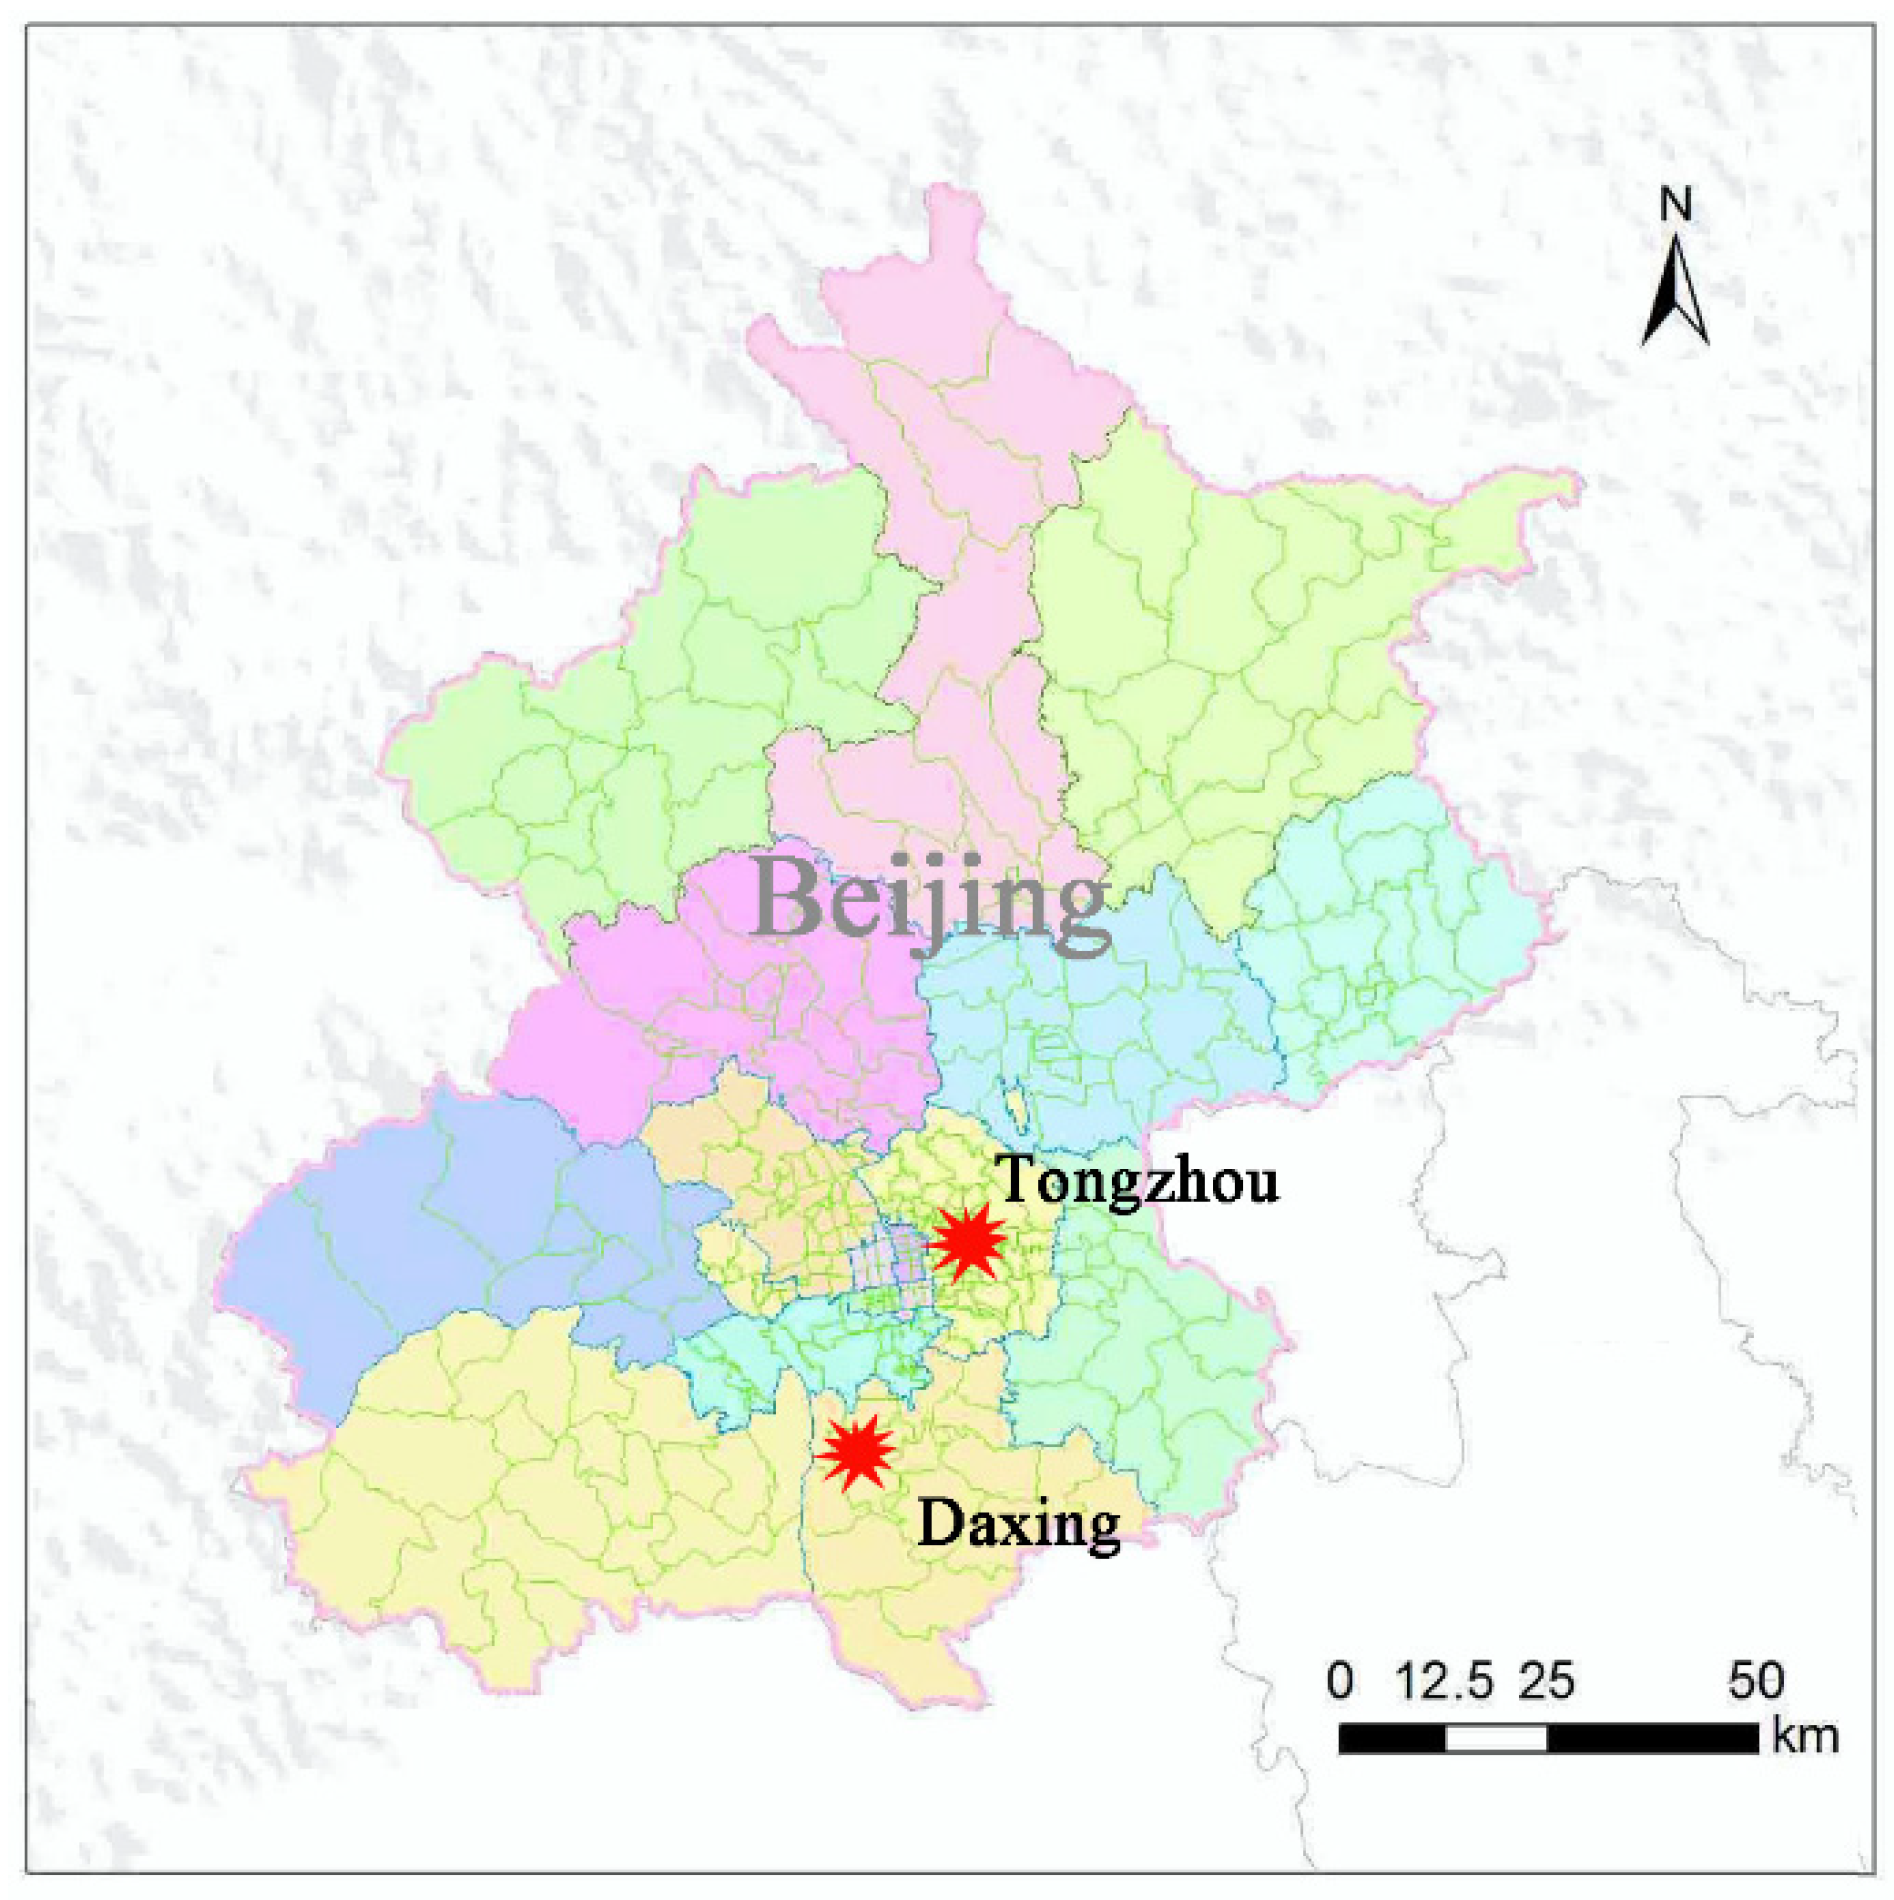
Daxing and Tongzhou are two districts in Beijing, as shown in Figure 18. The earthquake risk of these two districts are very high (i.e., the precautionary seismic intensity is 8). In this intensity, the peak ground acceleration corresponding to the service level earthquake whose probability of exceedance in 50 years is 63.3% reaches 0.2 g [3]. Seismic damage simulation of these two districts will provide the decision-making references for their urban planning on earthquake preparedness. However, the structural types of buildings are unavailable for these two districts. Therefore, the designed ML solution will be applied in the downtowns of Daxing and Tongzhou for obtaining the data of structural types.

5.2. Structural Type Prediction for Daxing Downtown

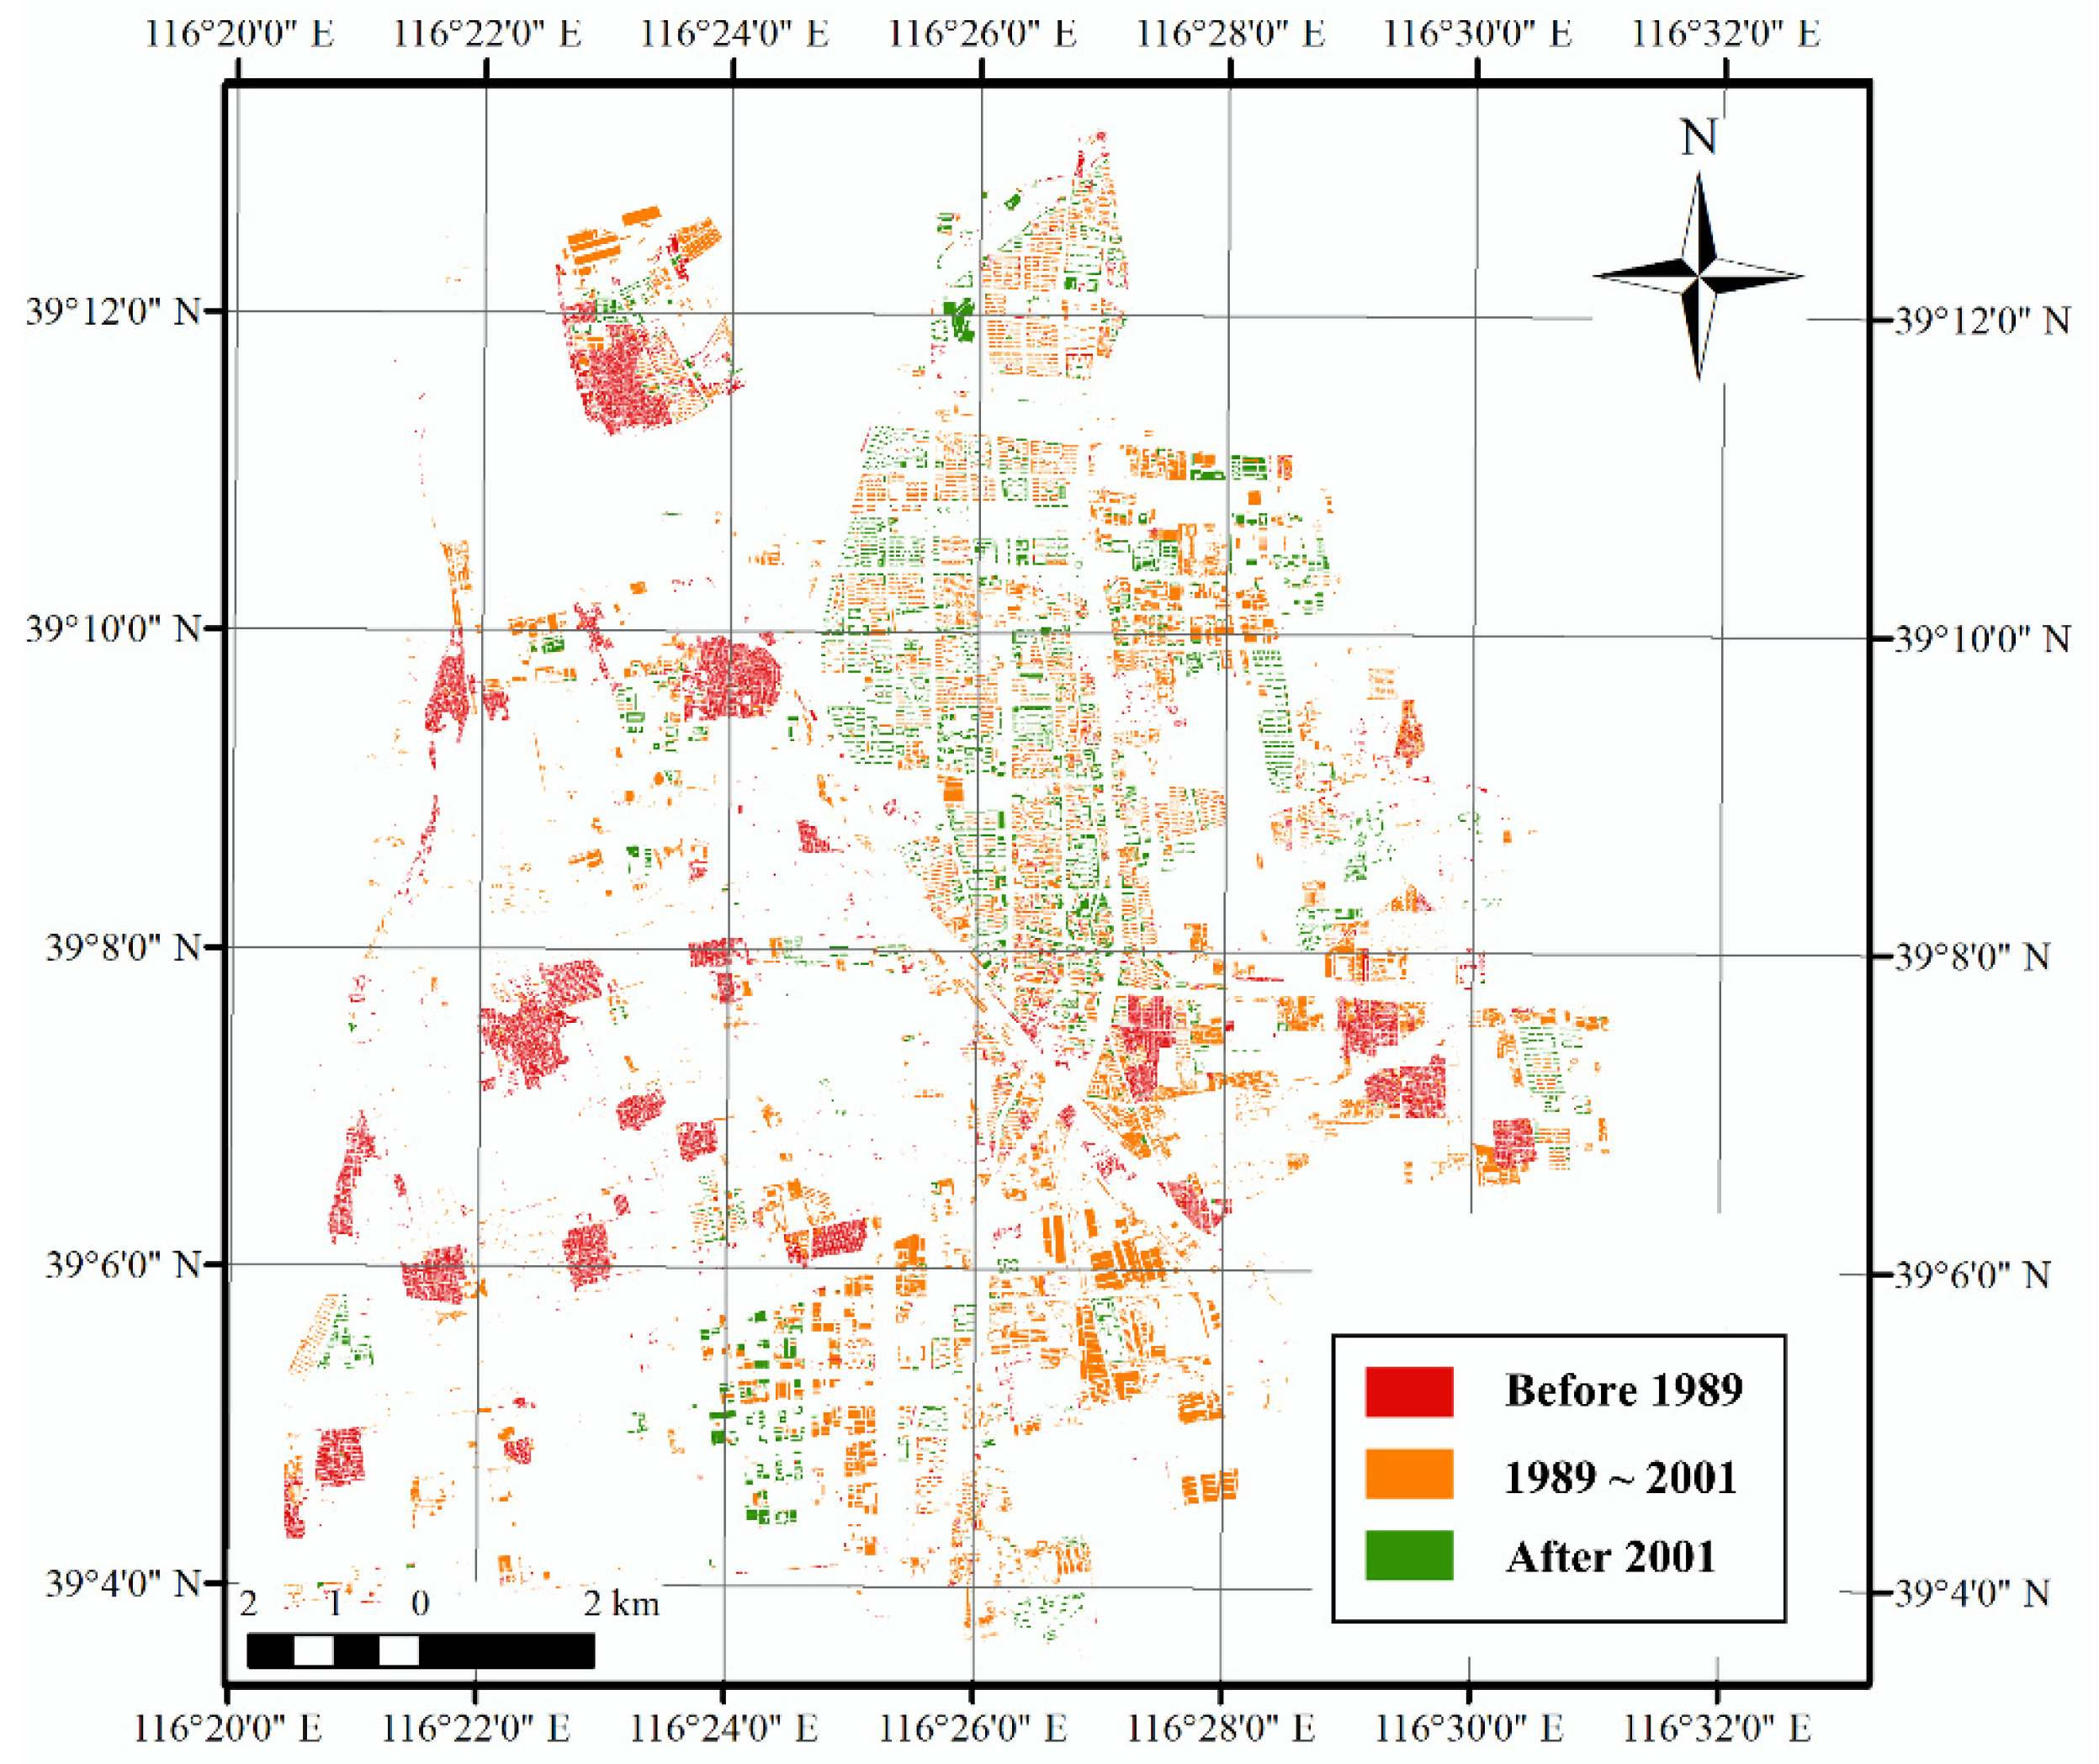
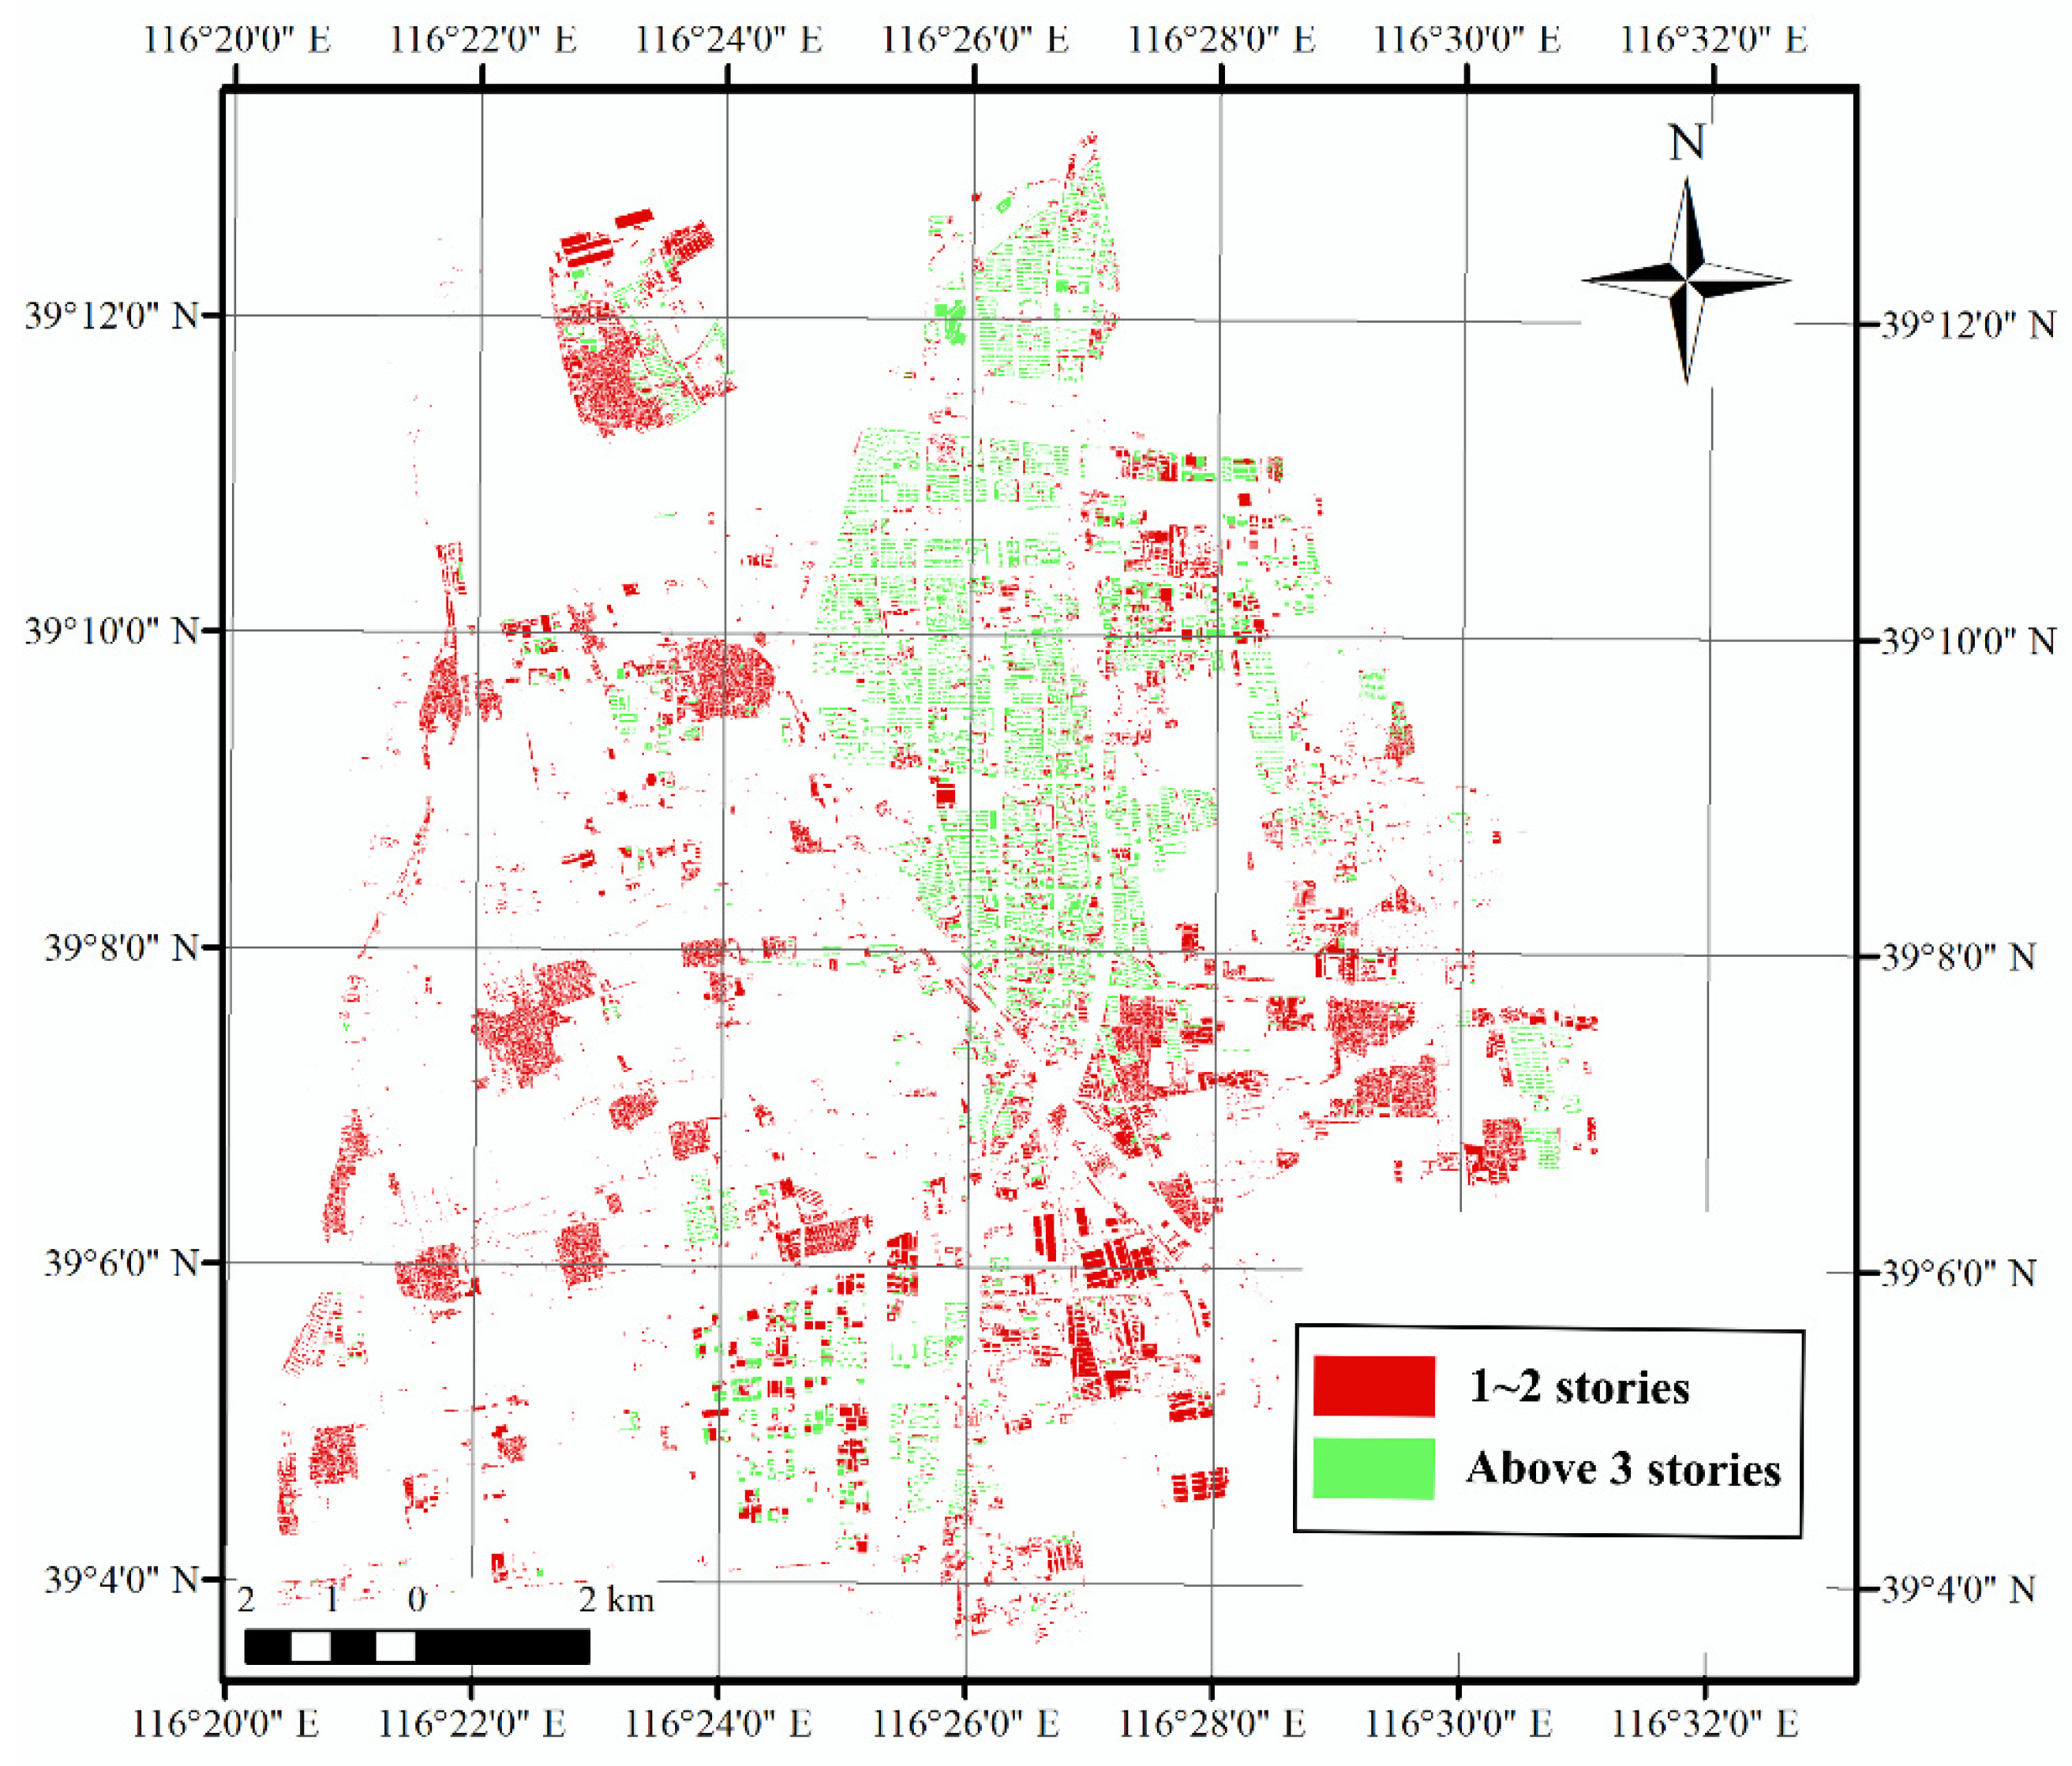
The department of urban planning in the local government has provided the GIS data of building footprints of Daxing downtown, which includes the attributes of story area, construction years, story heights and story numbers. According to the existing GIS data, 69,180 buildings exist in Daxing downtown. In detail, the ratios of buildings constructed before 1989, from 1989 to 2001, and after 2001 are 62%, 32%, and 6%, respectively. The distribution of construction year is shown in Figure 19. It is noted here that the codes for the seismic design of buildings were updated in 1989 and 2001; therefore, buildings that were constructed later exhibit higher anti-seismic capabilities. Additionally, most buildings in this area are low rise, e.g., the number of buildings within two floors constitutes 91% of the total number. The distribution of story number is shown in Figure 20.
No structural type exists in the GIS data of Daxing downtown; therefore, the designed semi-supervised ML solution in this study was used to predict the structural type of buildings.
(1) Building sampling investigation
In this case study, 3% of the total buildings in Daxing downtown was investigated to obtain the complete attribution data of the buildings. According to the recommended sampling fraction in this study, 1% of the total buildings was used for the training model, while the remaining 2% for assessing the model.
As mentioned previously, 69,180 buildings exist in Daxing downtown; therefore, 2075 buildings (i.e., 3% of total buildings) were randomly investigated. The distribution of structural type in the investigated buildings is shown in Table 3.
(2) Training model
The sample data of 2075 buildings were uploaded to the Azure platform. Using the designed semi-supervised ML solution, three self-trainings were performed, and the optimal training results are shown in Figure 21.
As shown in Figure 21, the overall accuracy of the prediction results is 94.8%. The accuracy of the frame structure is 84.0%, whereas, those of other structures are more than 92.2%. In addition, the F1 score can be calculated using precision and recall in Figure 21. In detail, the macro and micro F1 scores are 94.8% and 92.9%, respectively, which are accepted. Generally, the trained model exhibits high accuracy and performance for the prediction of structural type.
(3) Prediction of structural type
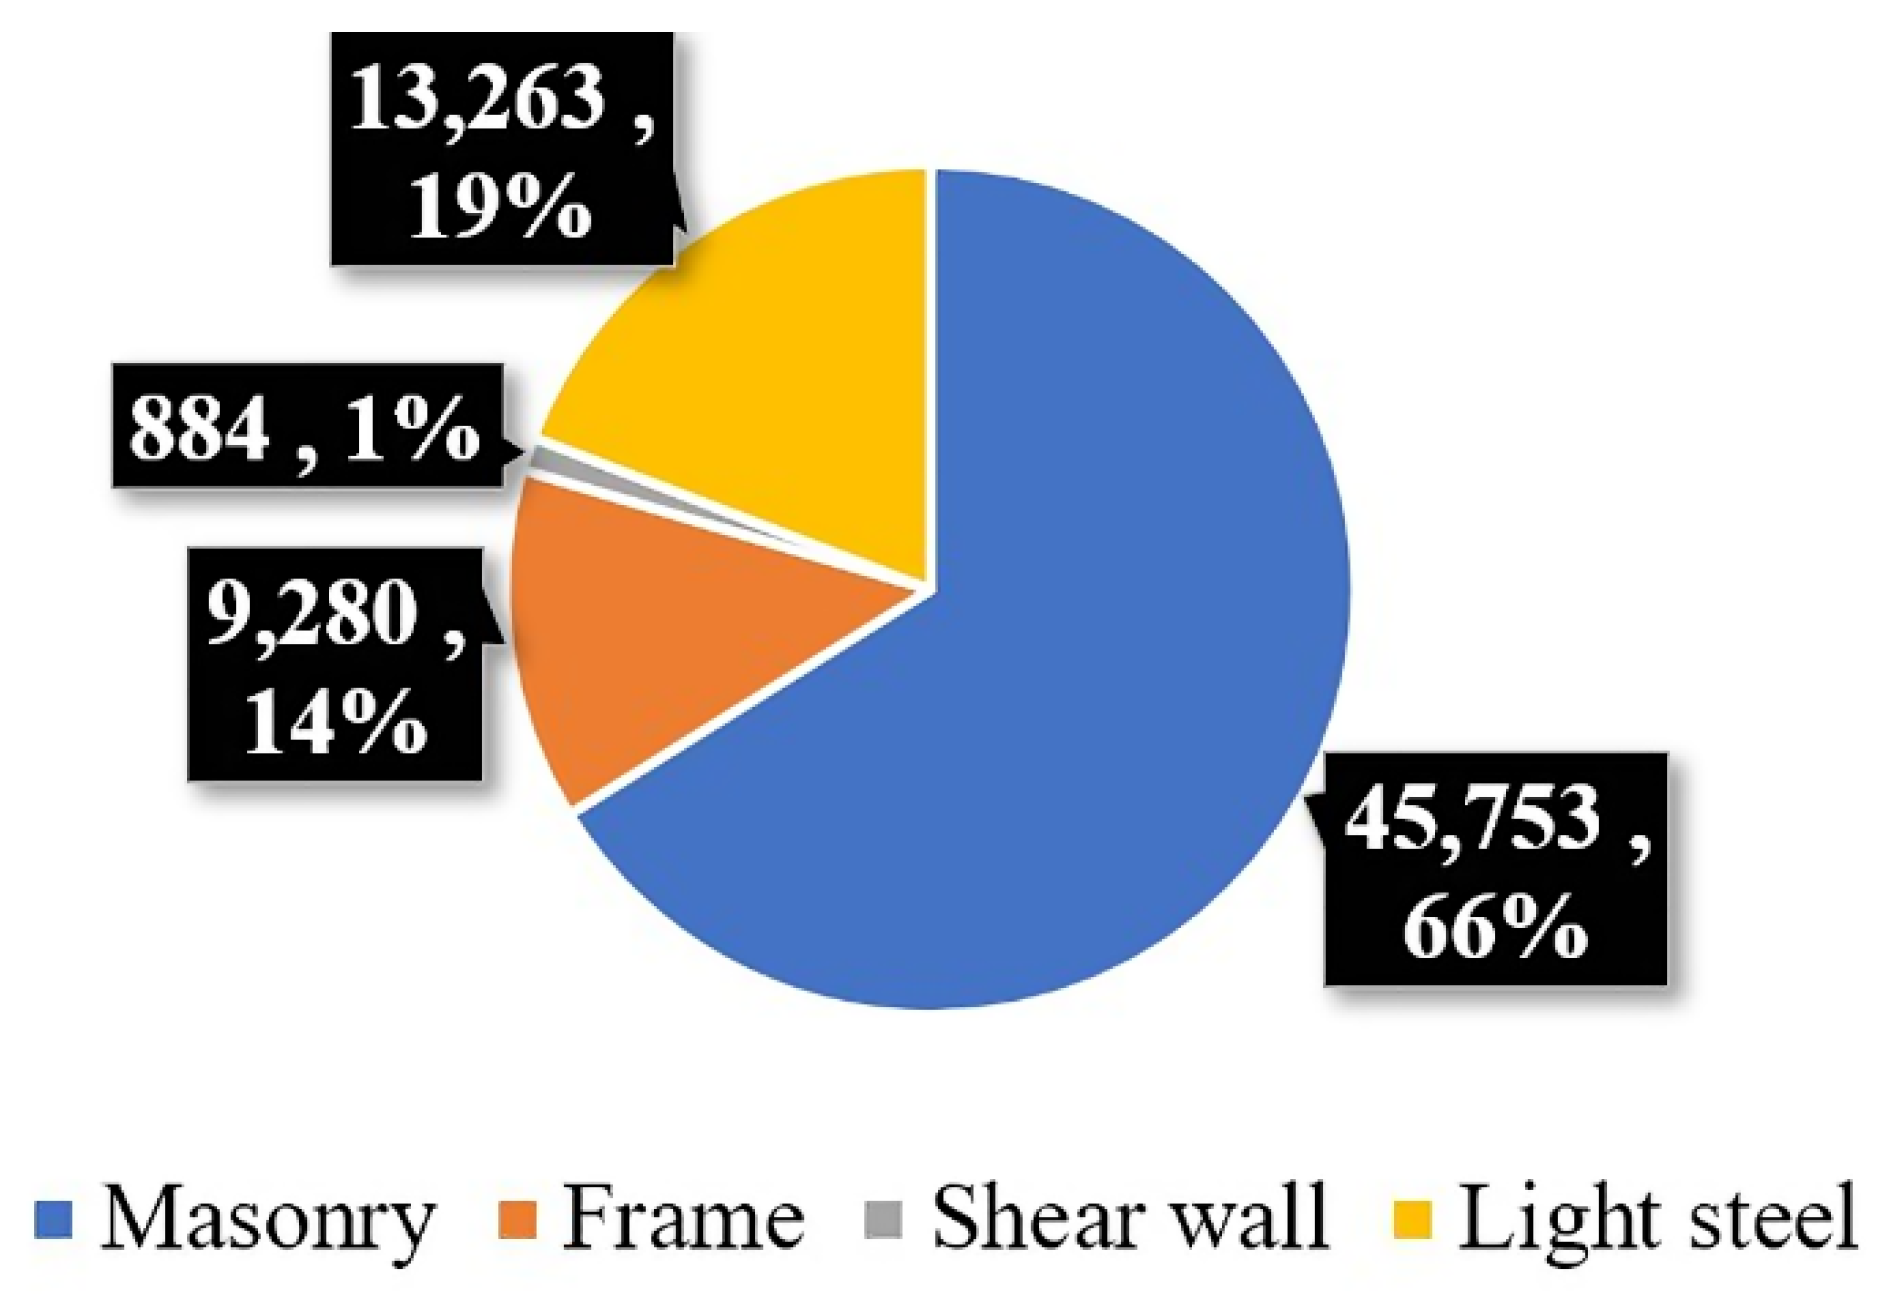
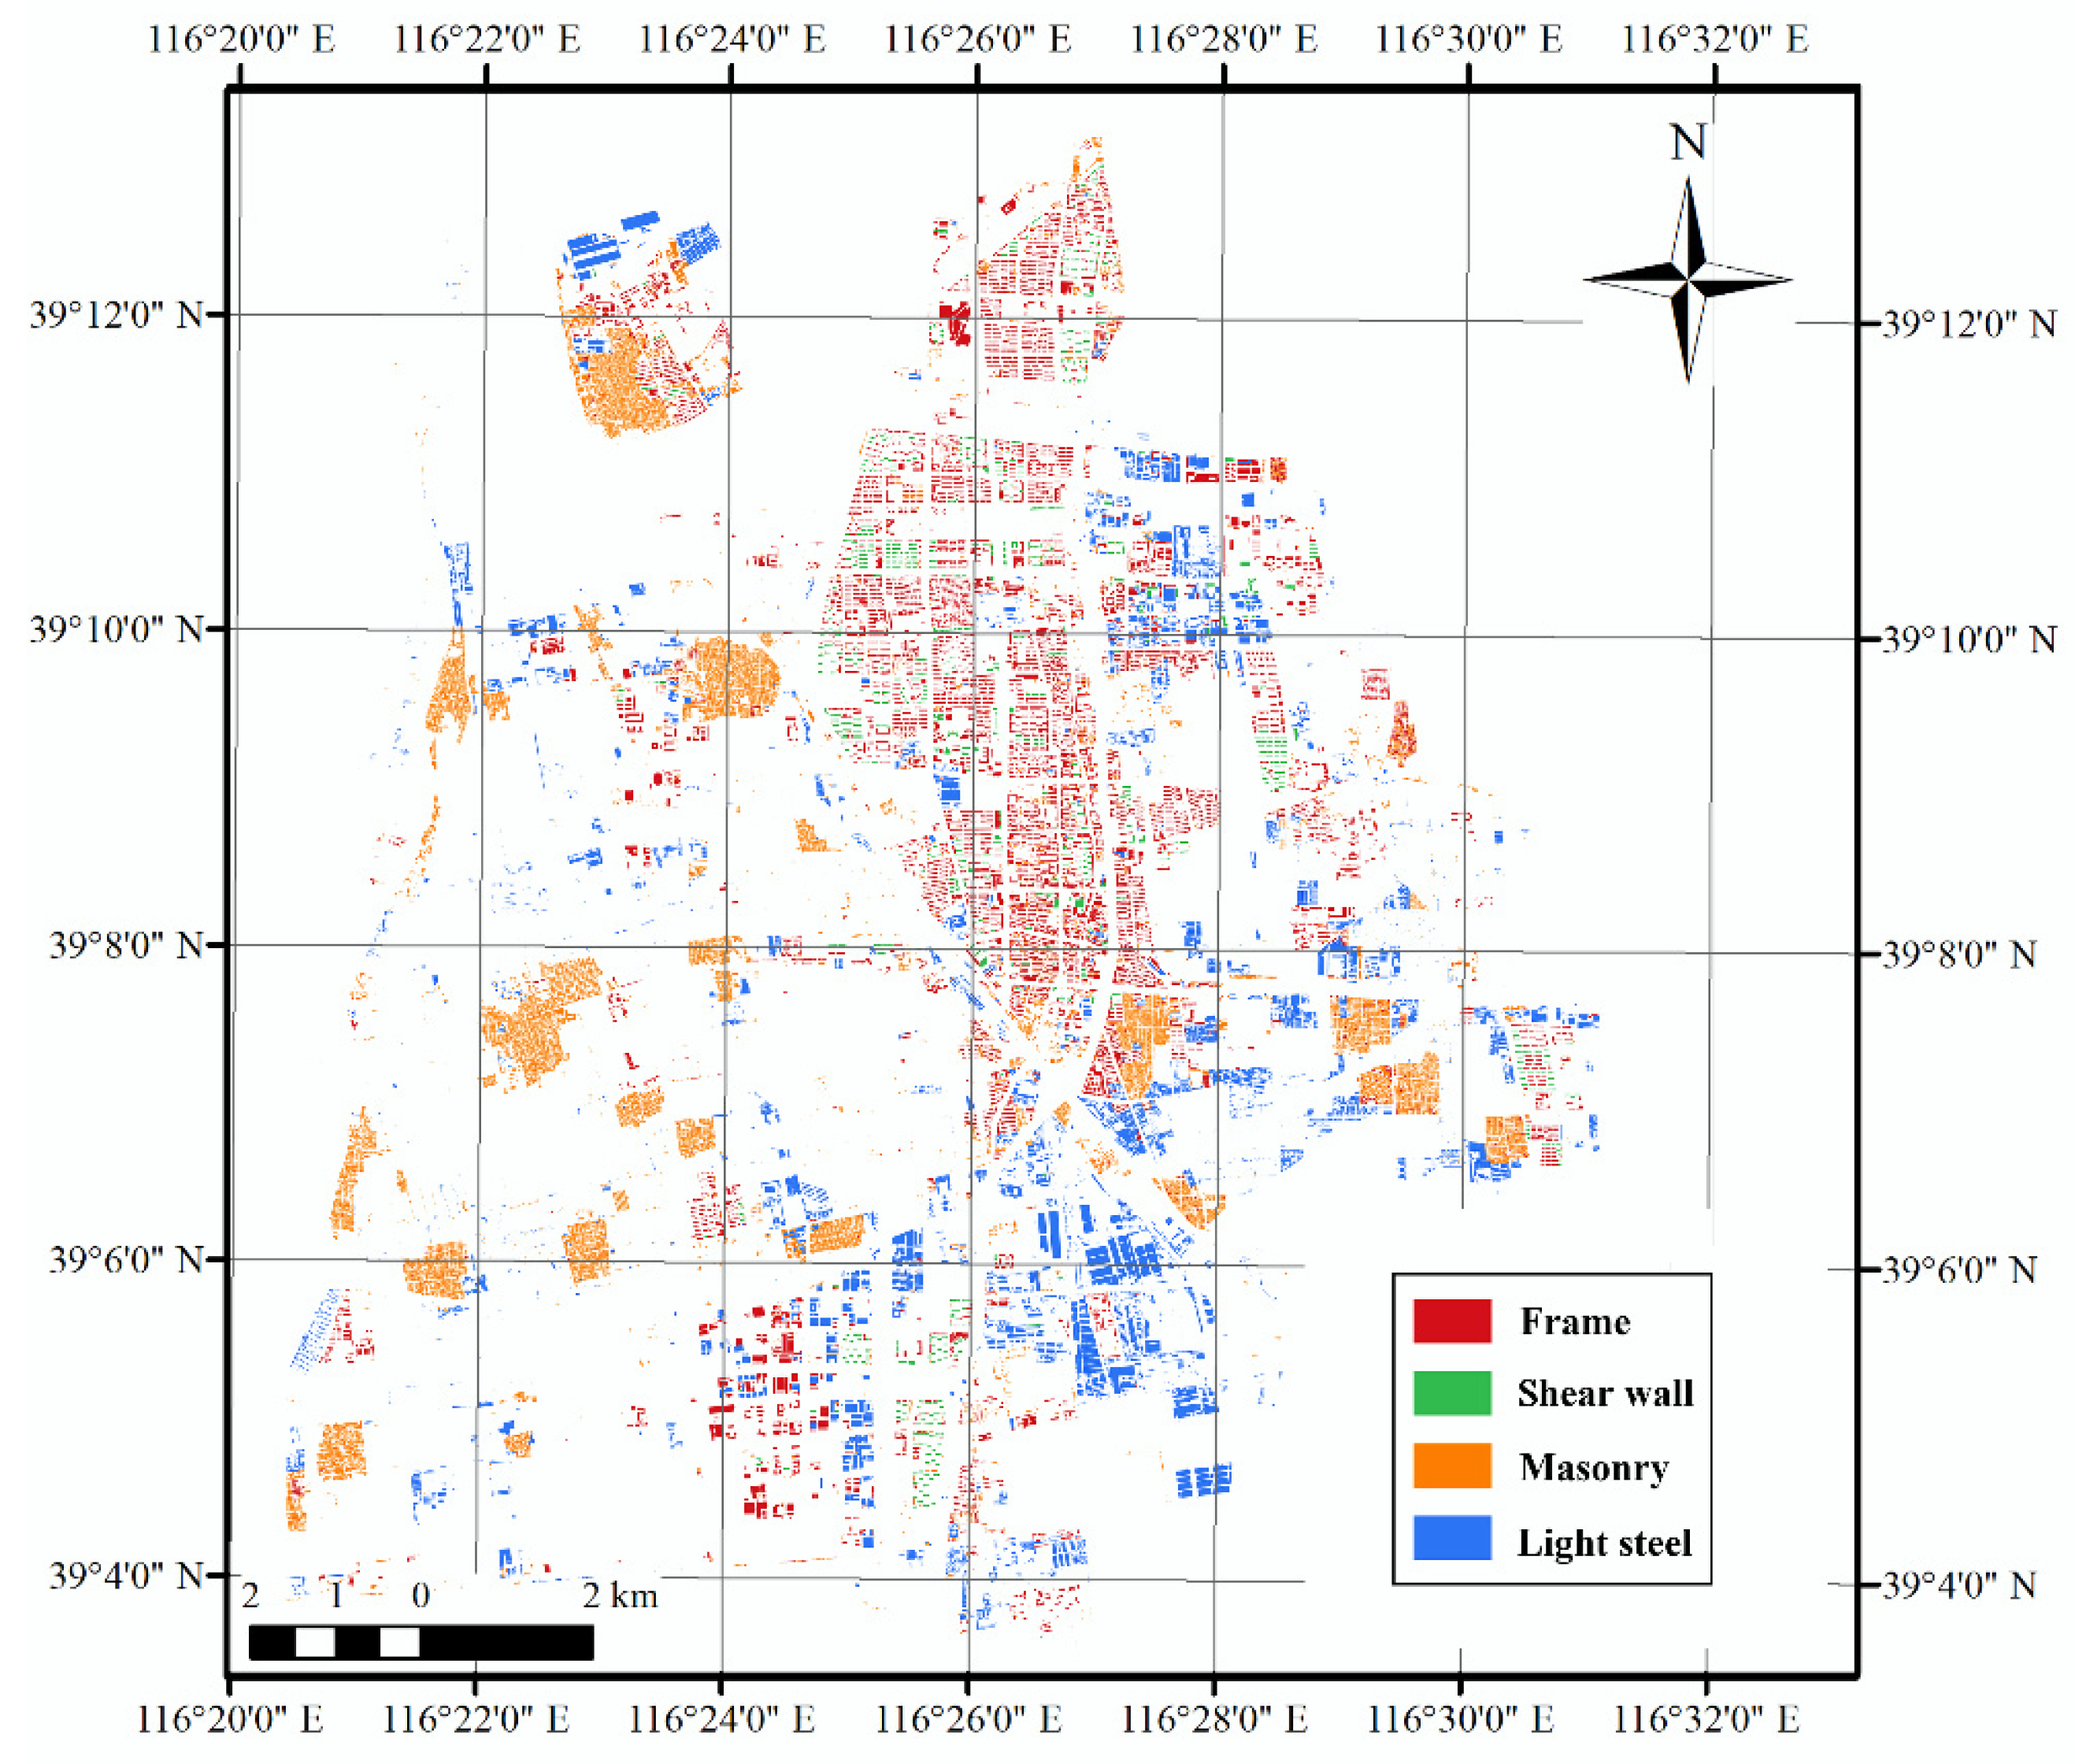
Using the trained model, the structural type of all buildings in Daxing downtown were predicted. The ratios of different structural types are shown in Figure 22. It is clear that most buildings in Daxing downtown are masonry buildings, which account for 66% of the total buildings, while the frame shear wall buildings are the least, i.e., only 1% of the total buildings. The distribution of structural type in Daxing downtown is shown in Figure 23. It is noted that only 3% of all the buildings must be investigated manually when the designed semi-supervised ML solution is used. Compared with the manual investigation of all the buildings (i.e., a total of 69,180 buildings), the designed solution can save 97% of manual work and significantly improve the efficiency for obtaining the data of structural type.

5.3. Seismic Damage Simulation for Daxing Downtown

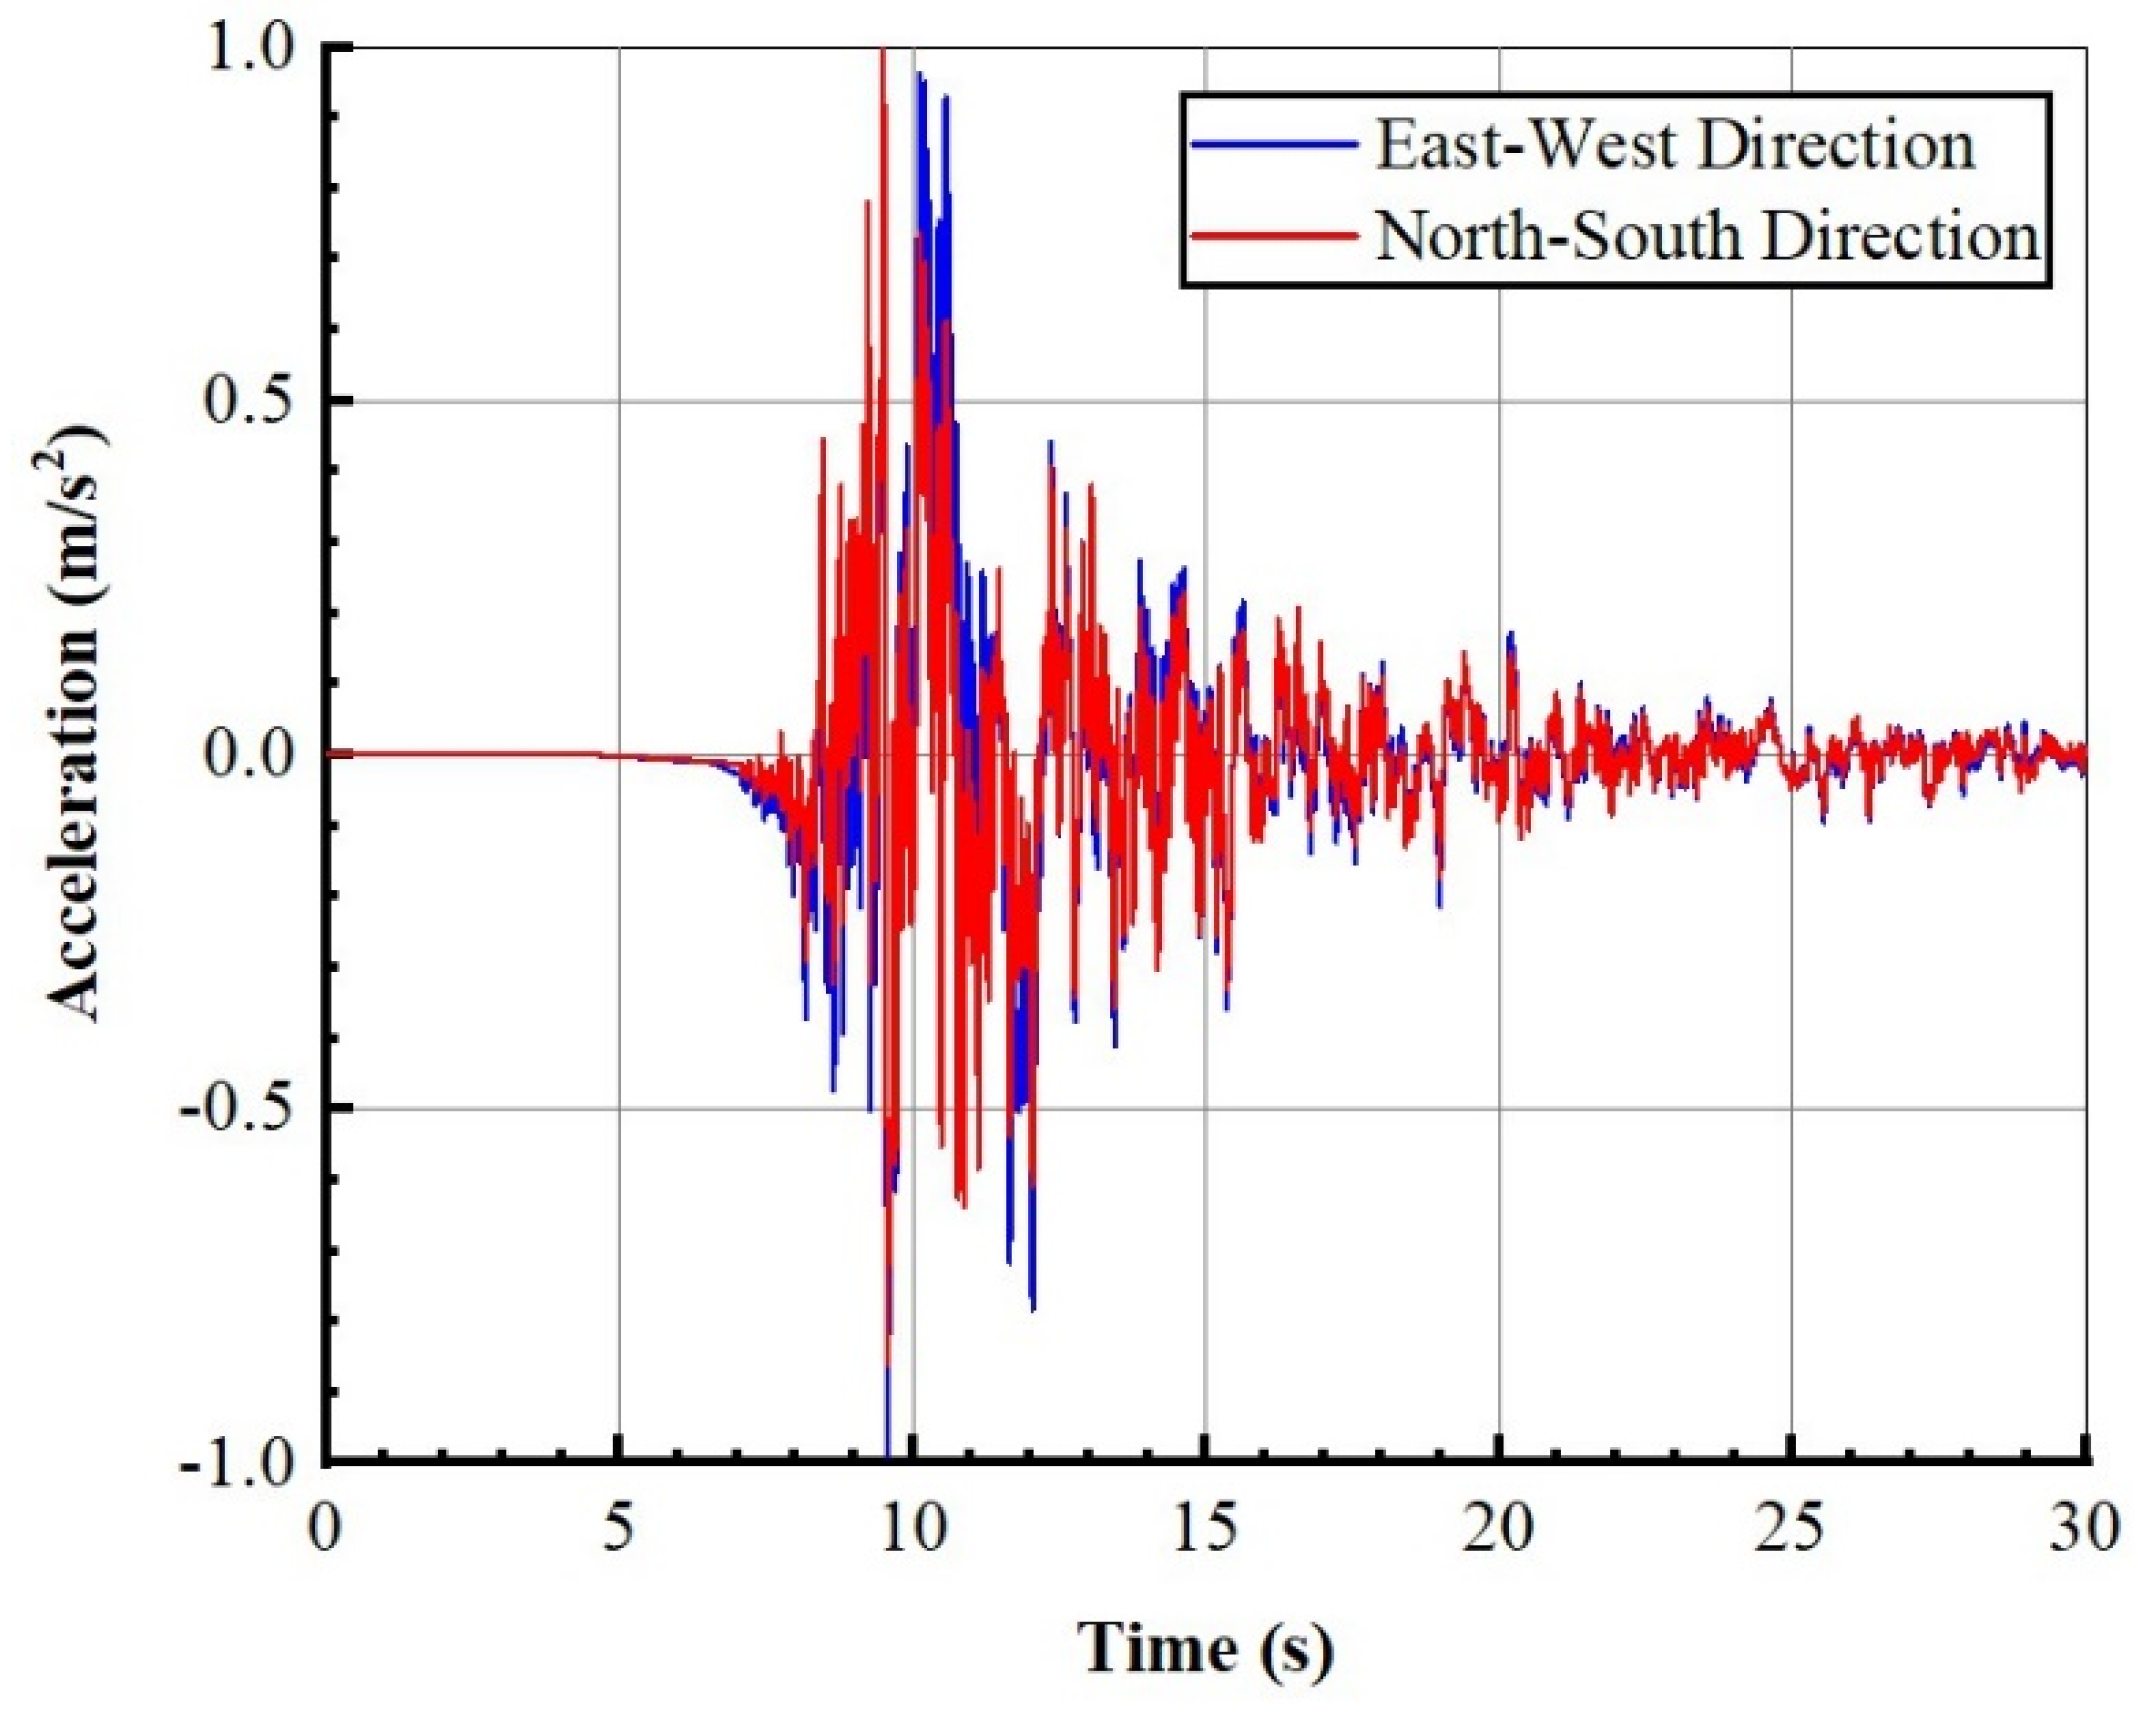
The Sanhe-Pinggu M 8.0 earthquake [33] occurred in 1679, which is the latest M 8.0 earthquake in the history of Beijing. The ground motion of the Sanhe-Pinggu M 8.0 earthquake was simulated [34], and the corresponding time-history accelerations are shown in Figure 24. The time-history accelerations of the Sanhe-Pinggu earthquake will be input for the seismic damage simulation of Daxing downtown.
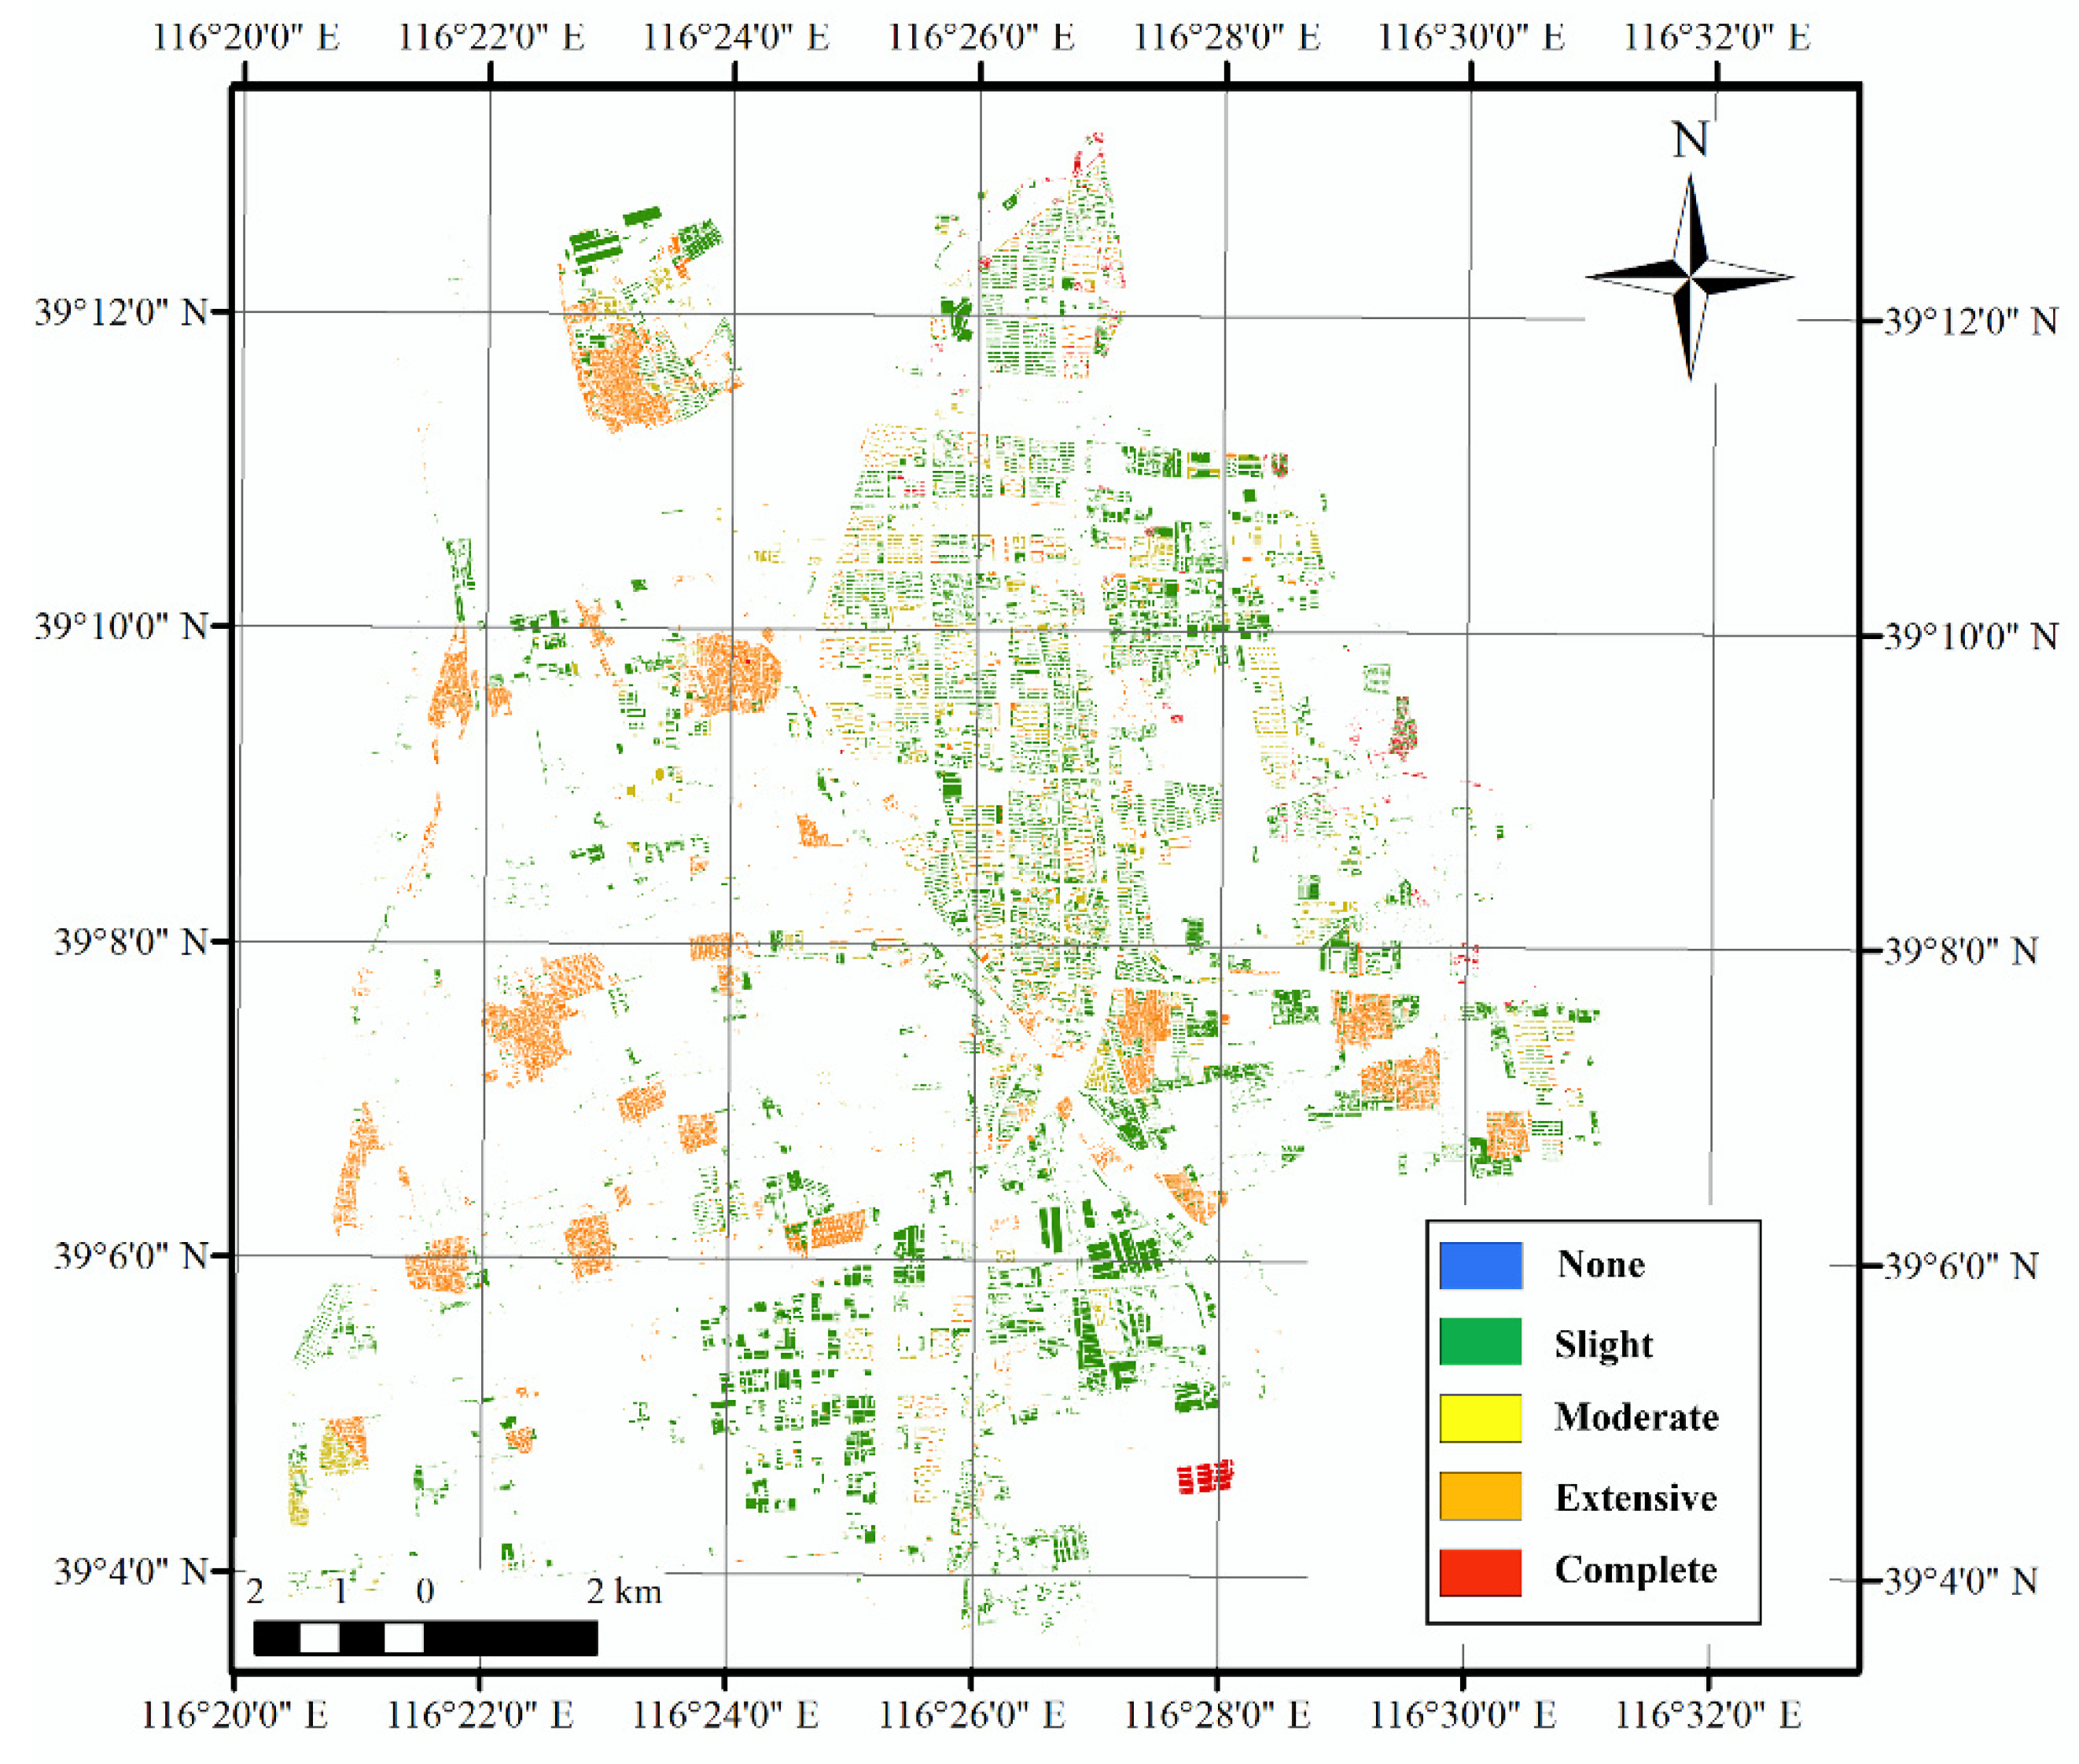
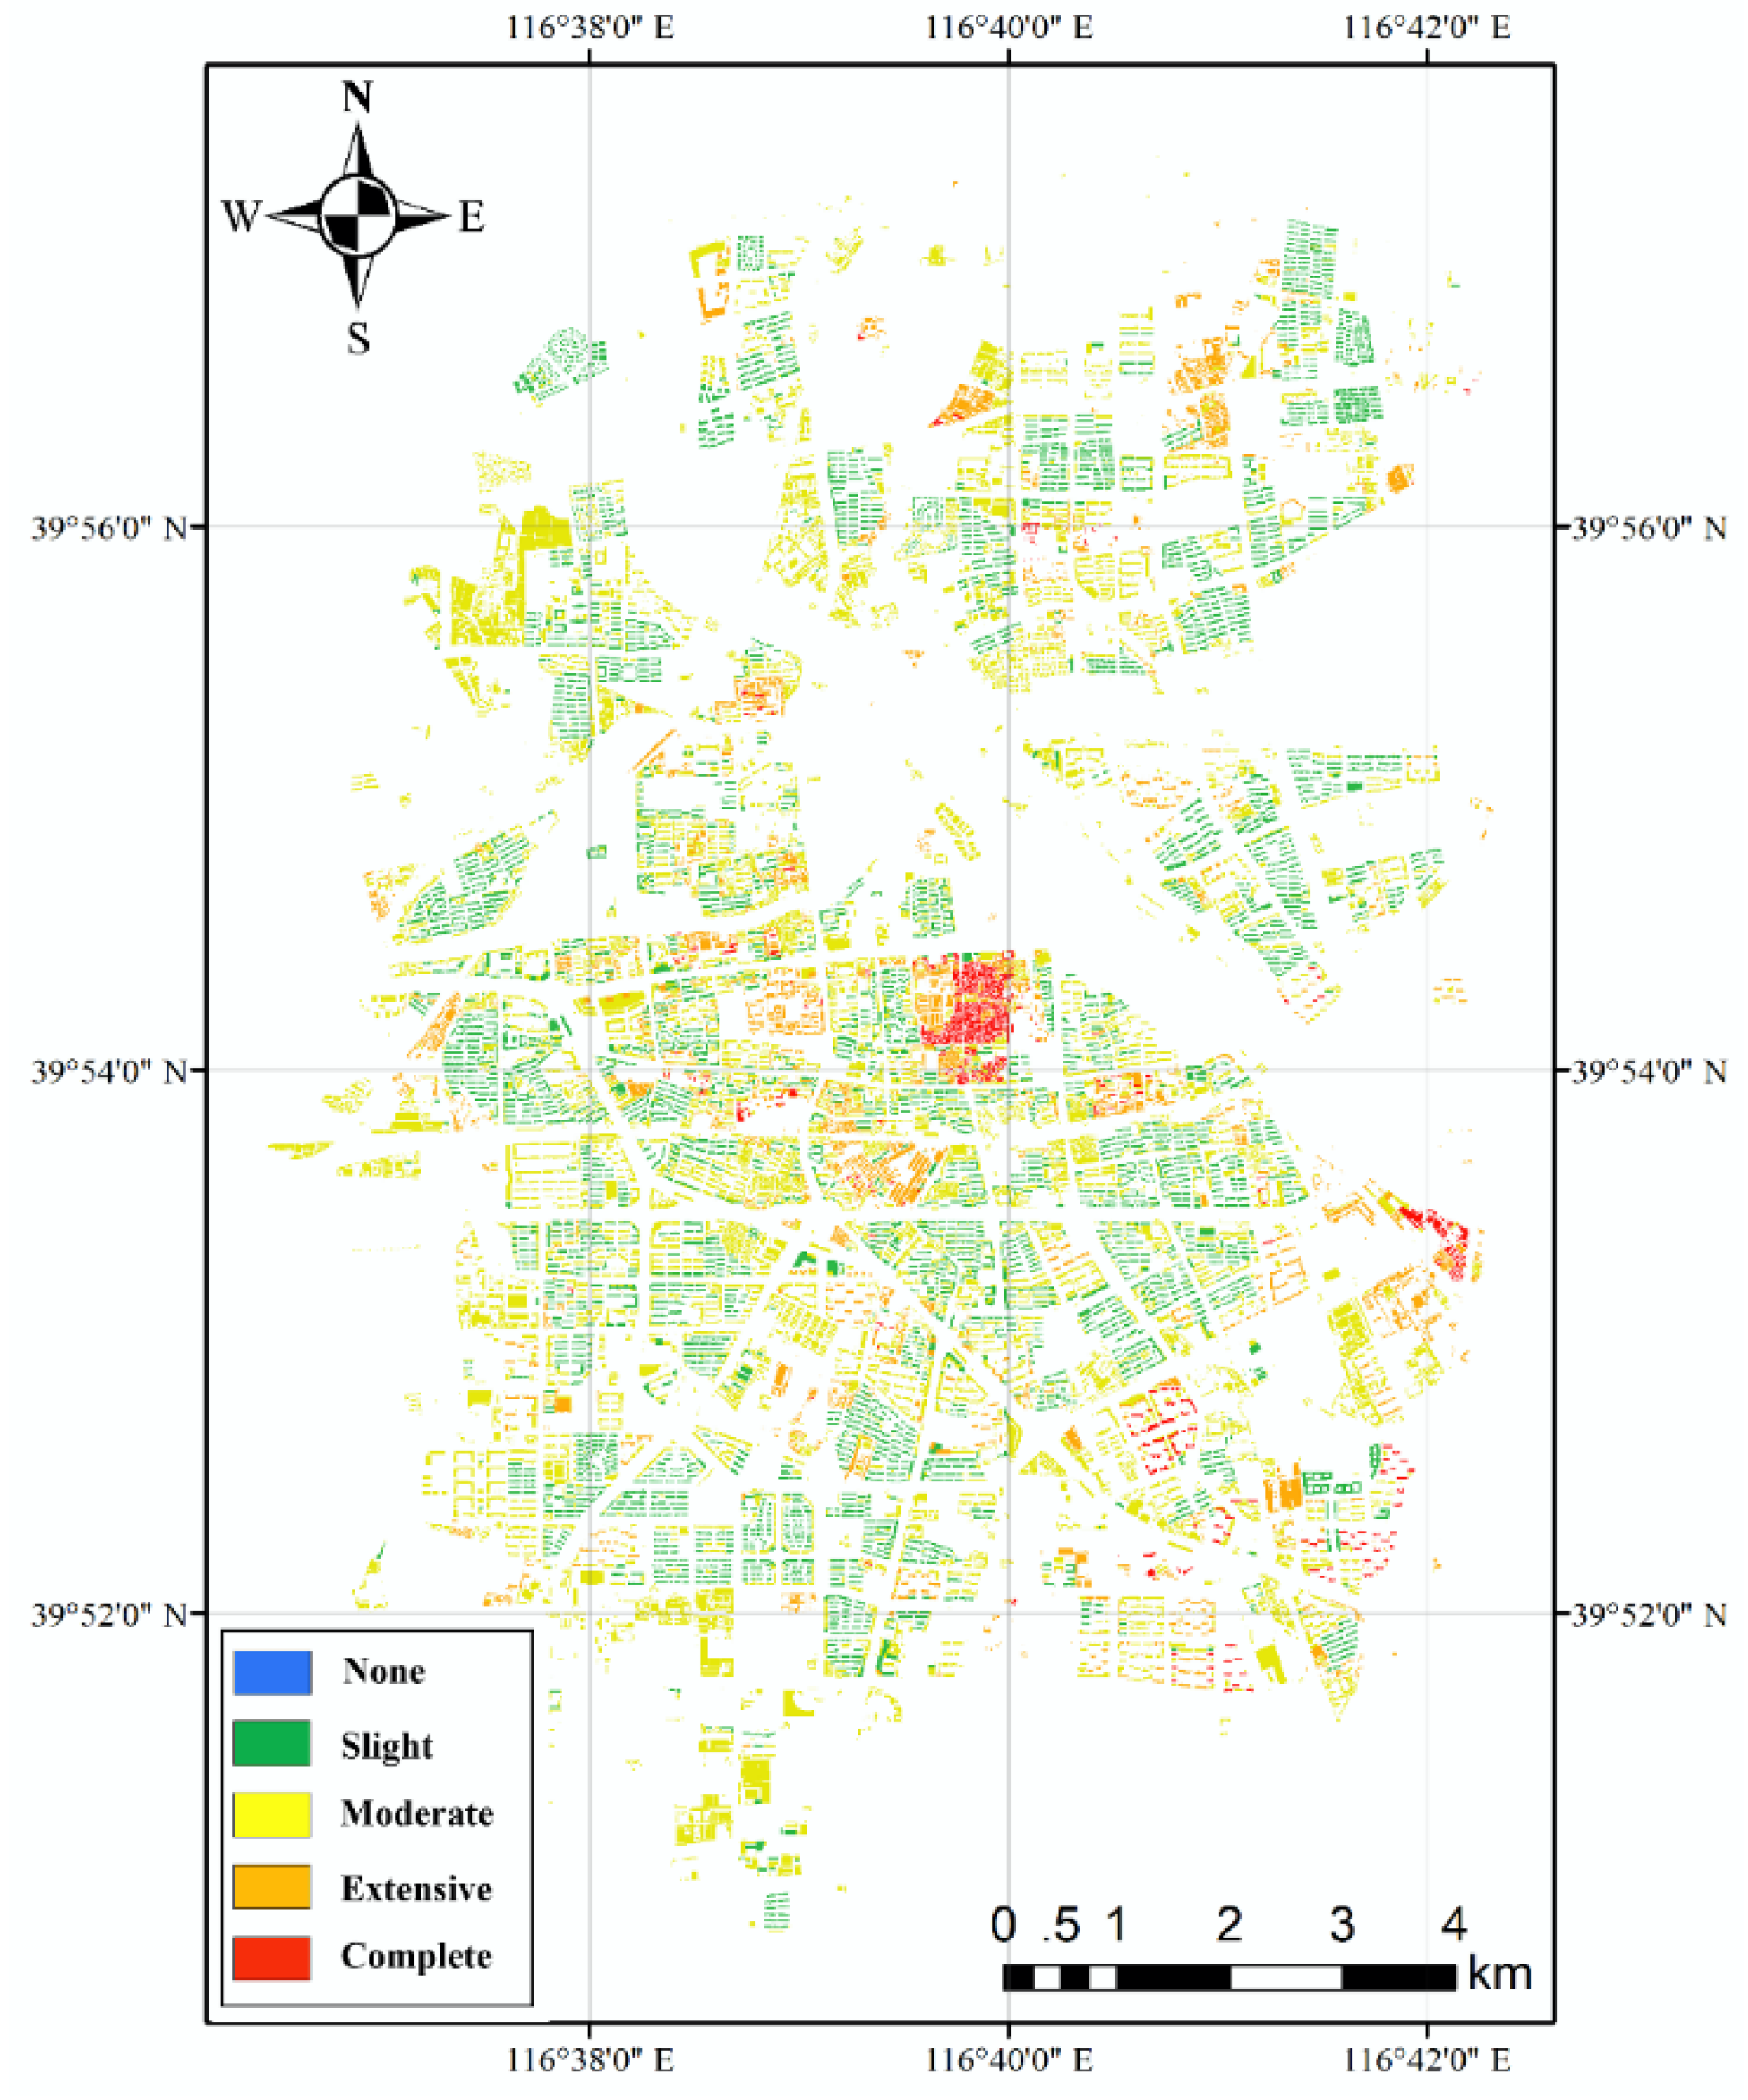
Based on the predicted building data, the MDOF models of buildings were created, and the seismic damage of Daxing downtown was simulated based on the MDOF models and nonlinear time–history analysis. The distribution of seismic damage in Daxing downtown is shown in Figure 25. It is clear that most buildings suffer slight damages. To reveal the features of the seismic damages clearly, the damage ratios of different structural types and construction years are shown in Figure 26. As shown, buildings of masonry structure and constructed before 1989 suffer severe damages, which provides important references for seismic retrofit decisions. It is noted that the seismic damage simulation of a city is implemented based on the designed semi-supervised ML solution, which is useful for improving the seismic capability of the city.

5.4. Structural Type Prediction for Tongzhou Downtown

The GIS data of building footprints of Tongzhou downtown are also from the department of urban planning in the local government. According to the GIS data, Tongzhou downtown has 37,463 buildings.
By the building sampling investigation, the structural types of 3% of the total buildings in Tongzhou downtown were determined. According to the recommended sampling fraction in this study, 1% of the total buildings was used for the training model, while the remaining 2% for assessing the model.
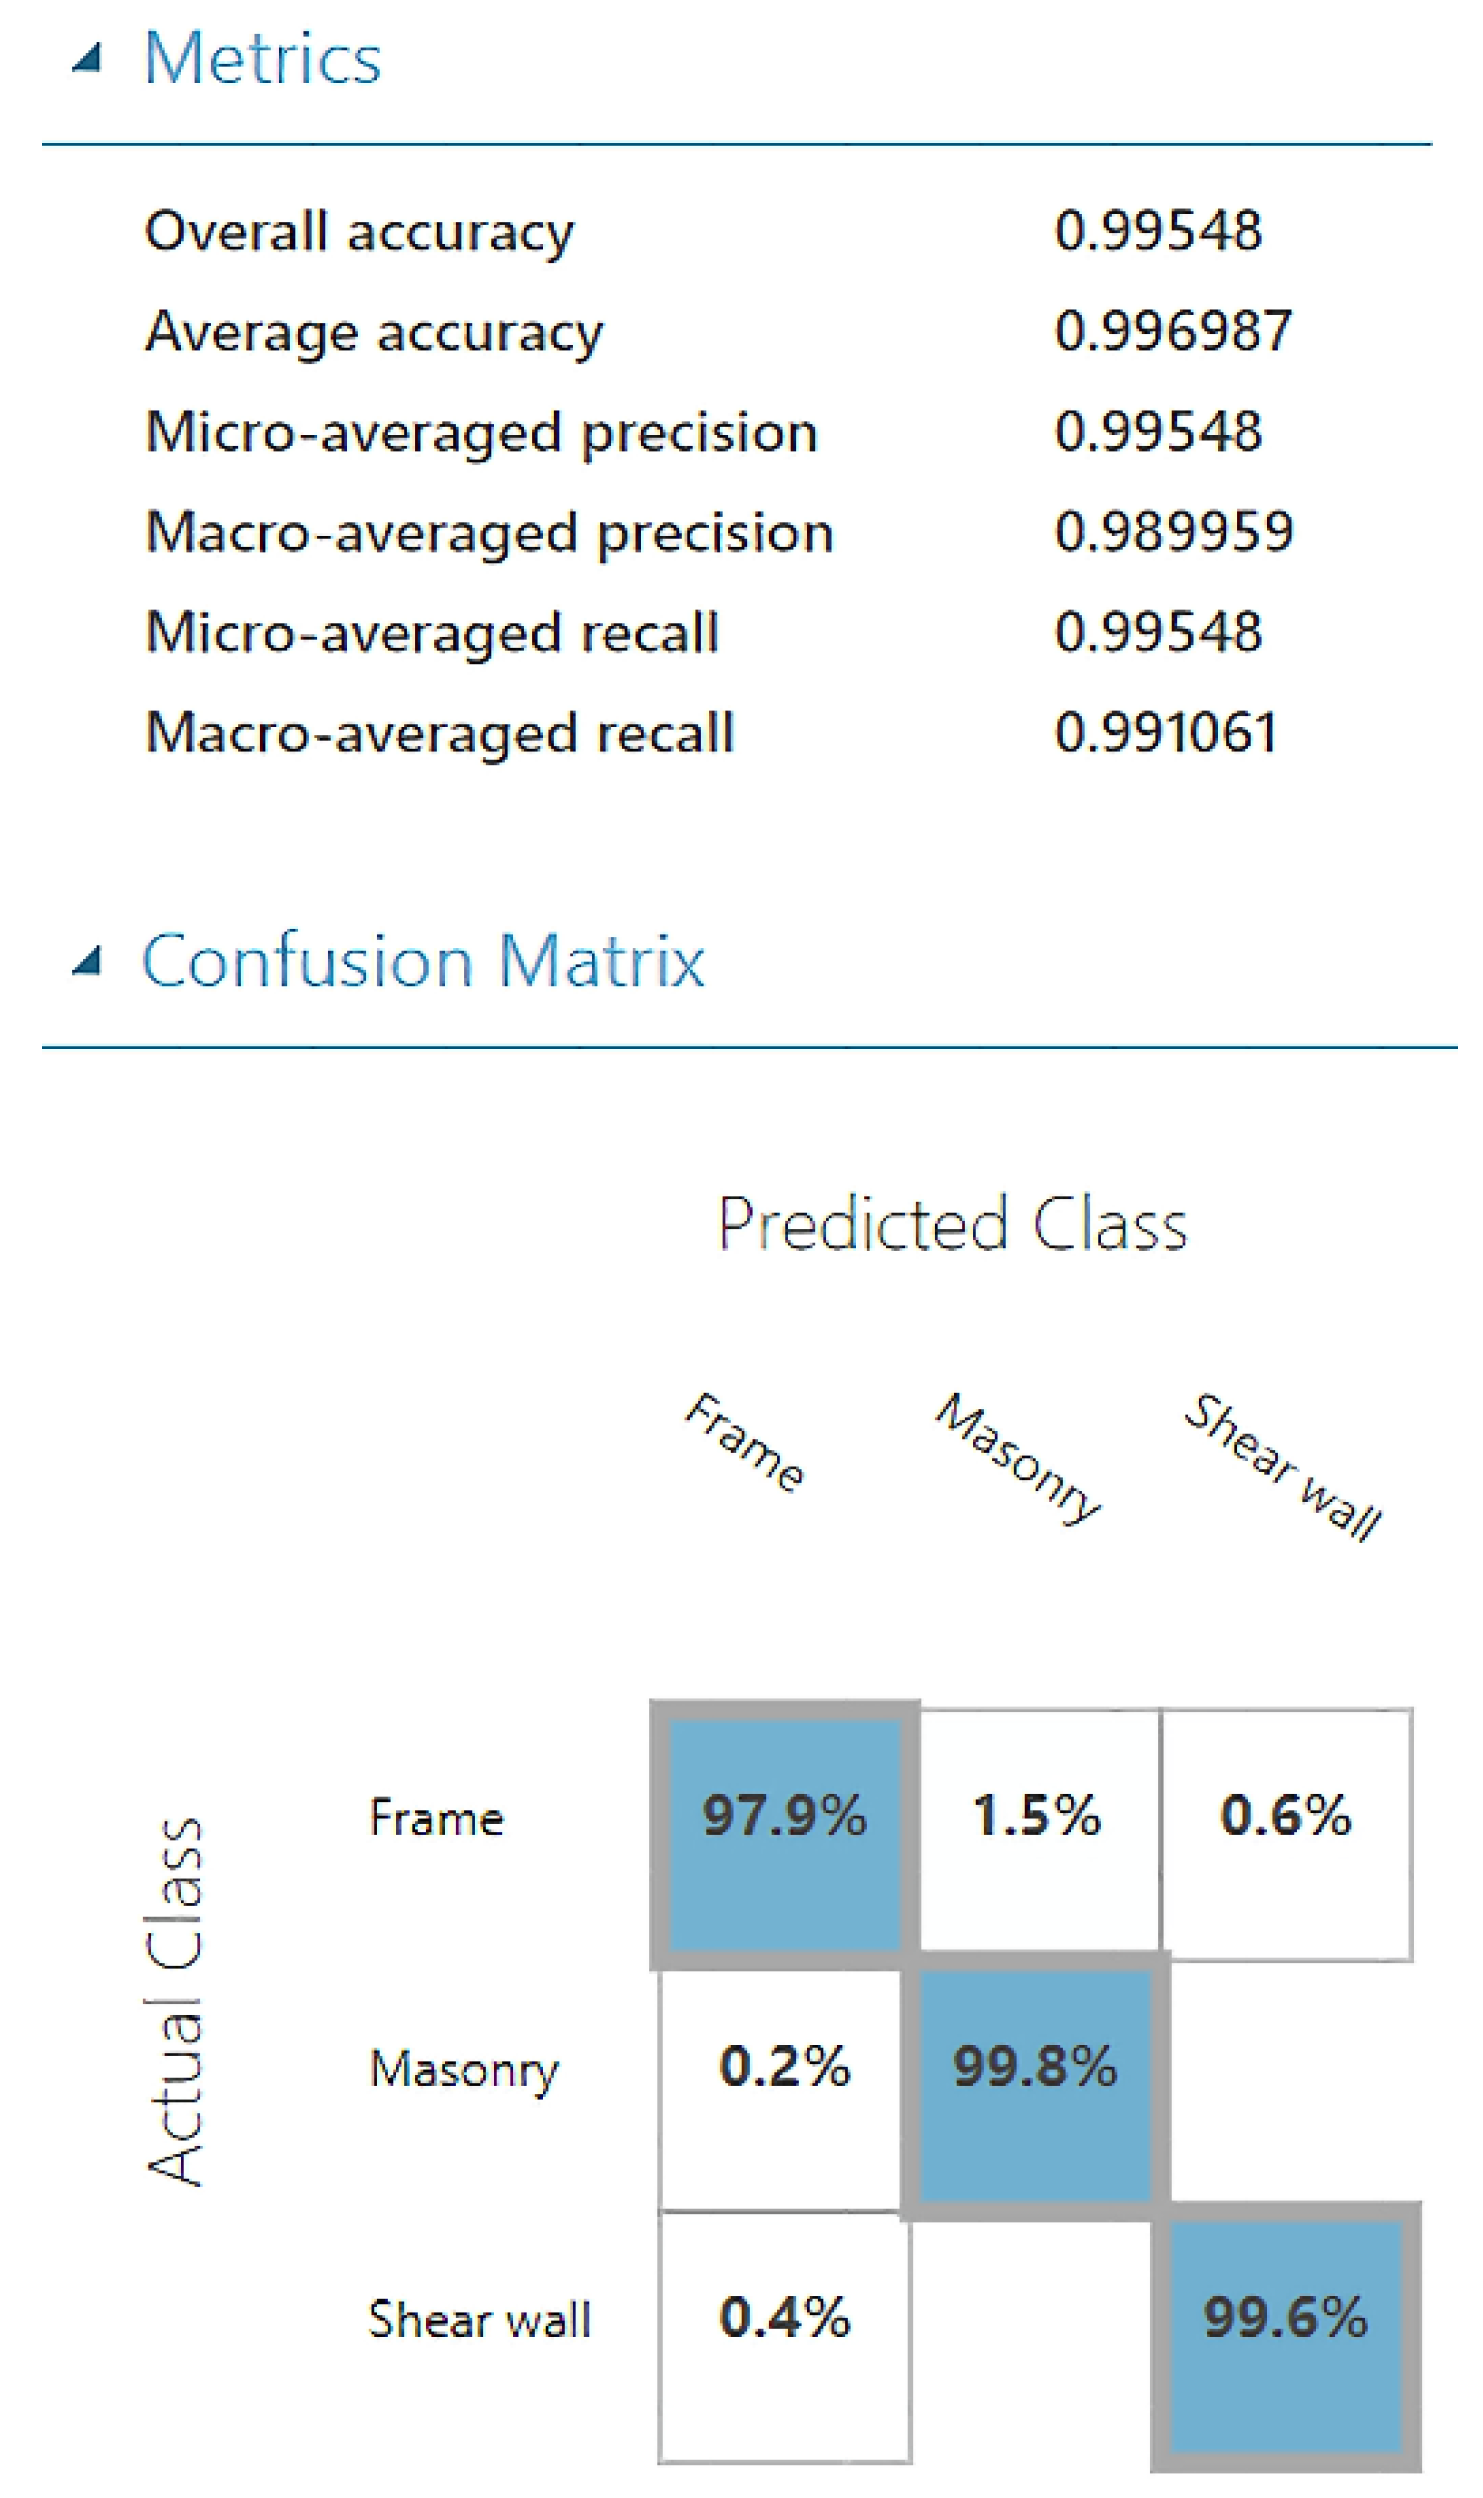
Using the designed semi-supervised ML solution, four self-trainings were performed, and the optimal training results are shown in Figure 27. As shown in Figure 27, the overall accuracy of the prediction results is 99.5%, and the accuracy of each structure type is beyond 97.9%. Obviously, the trained model exhibits a high prediction accuracy. Besides, the corresponding precisions and recalls are beyond 99.0%, as shown in Figure 27.
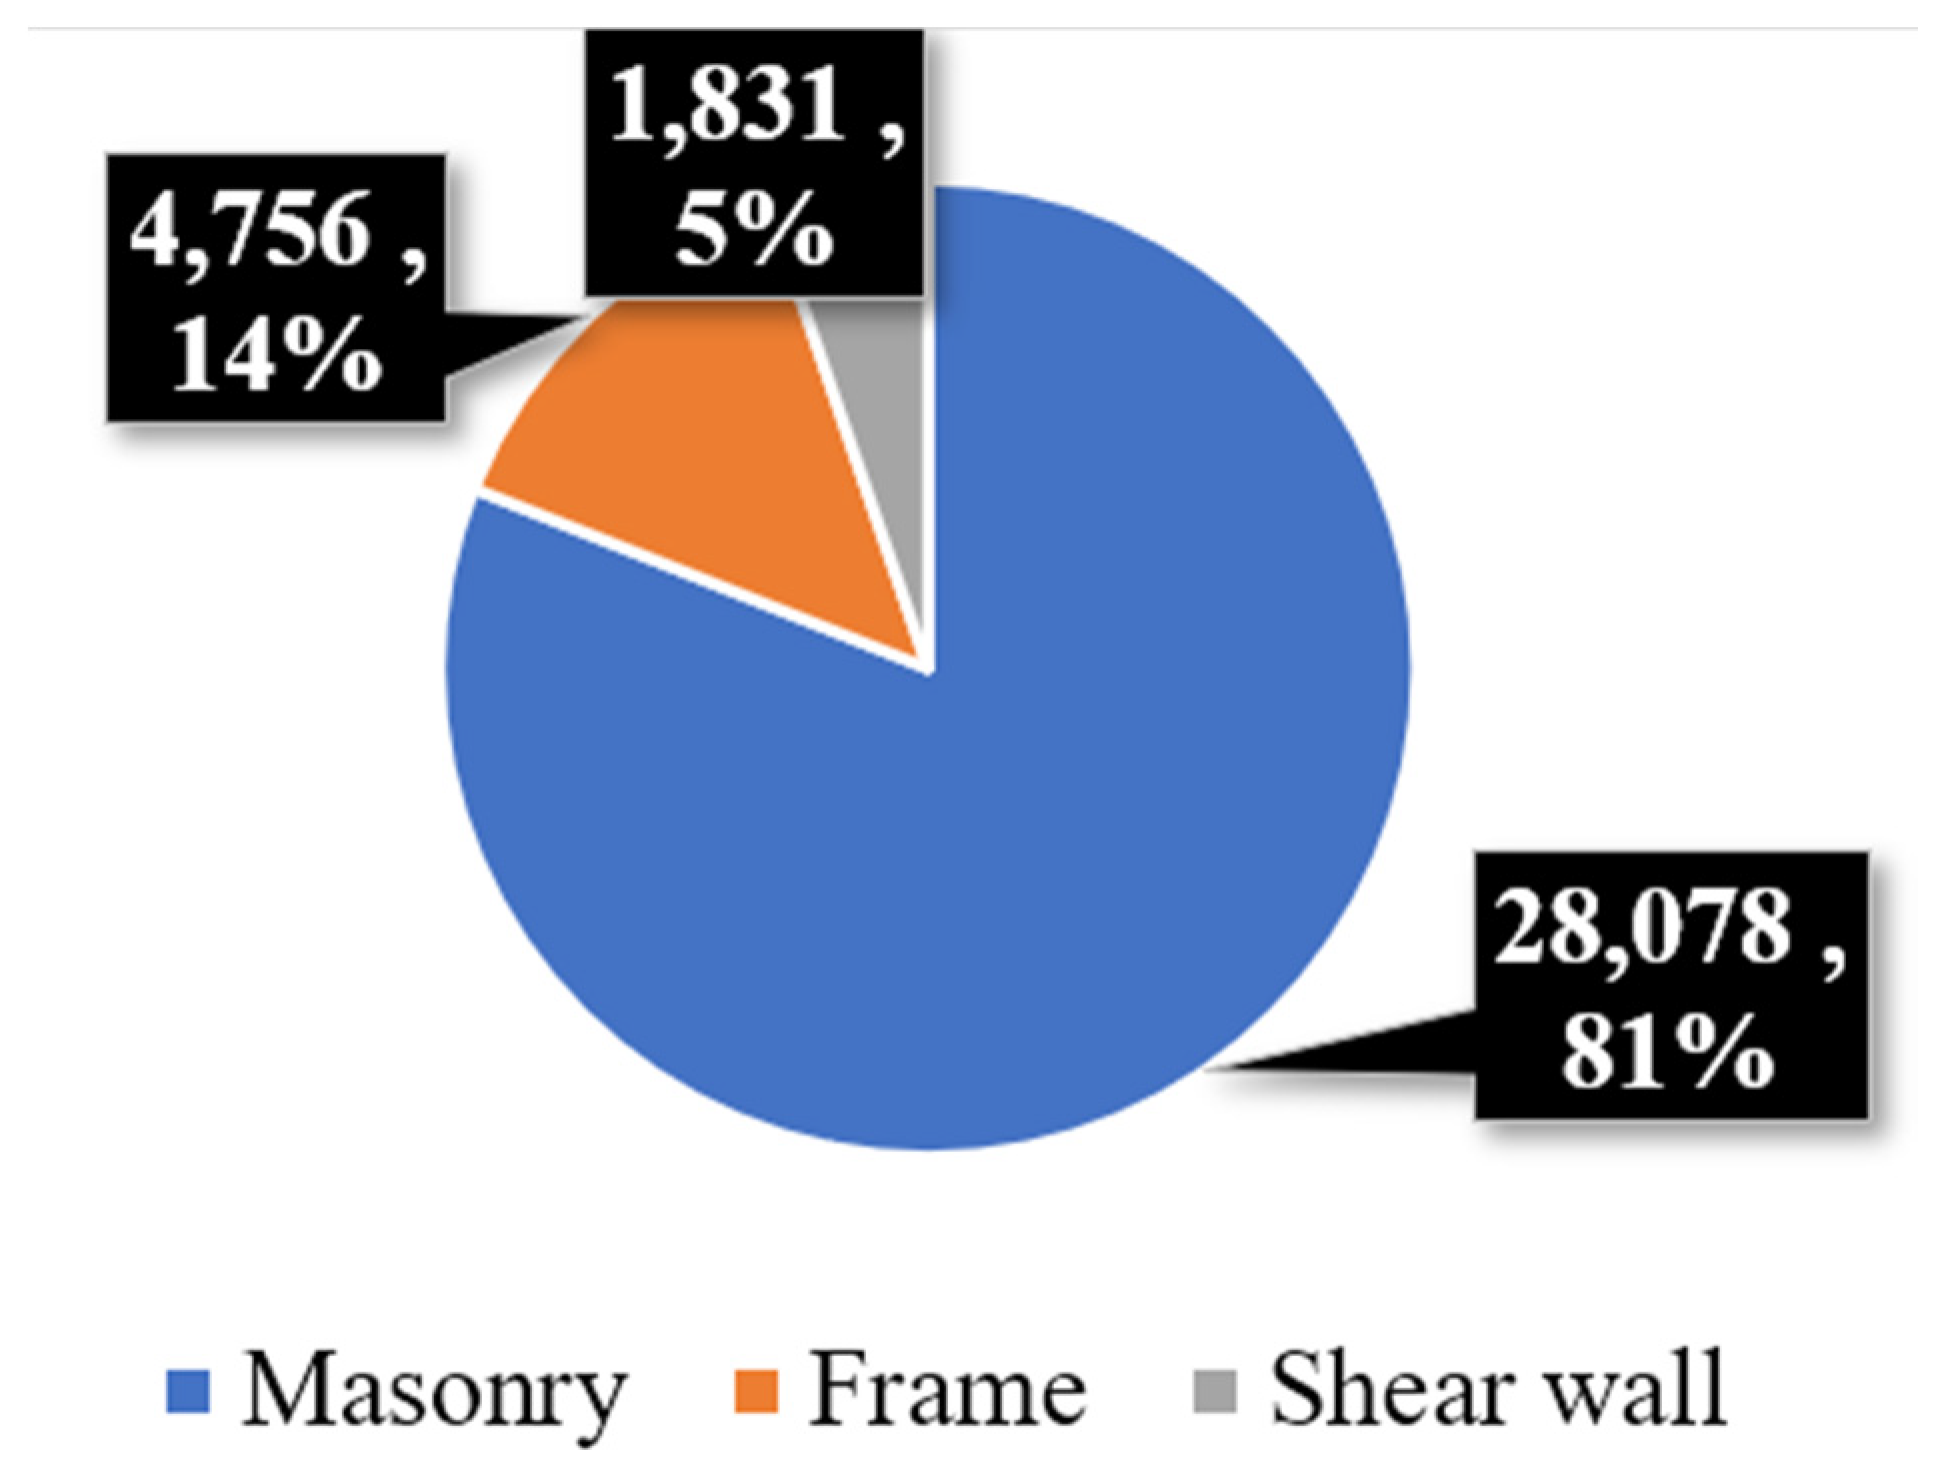
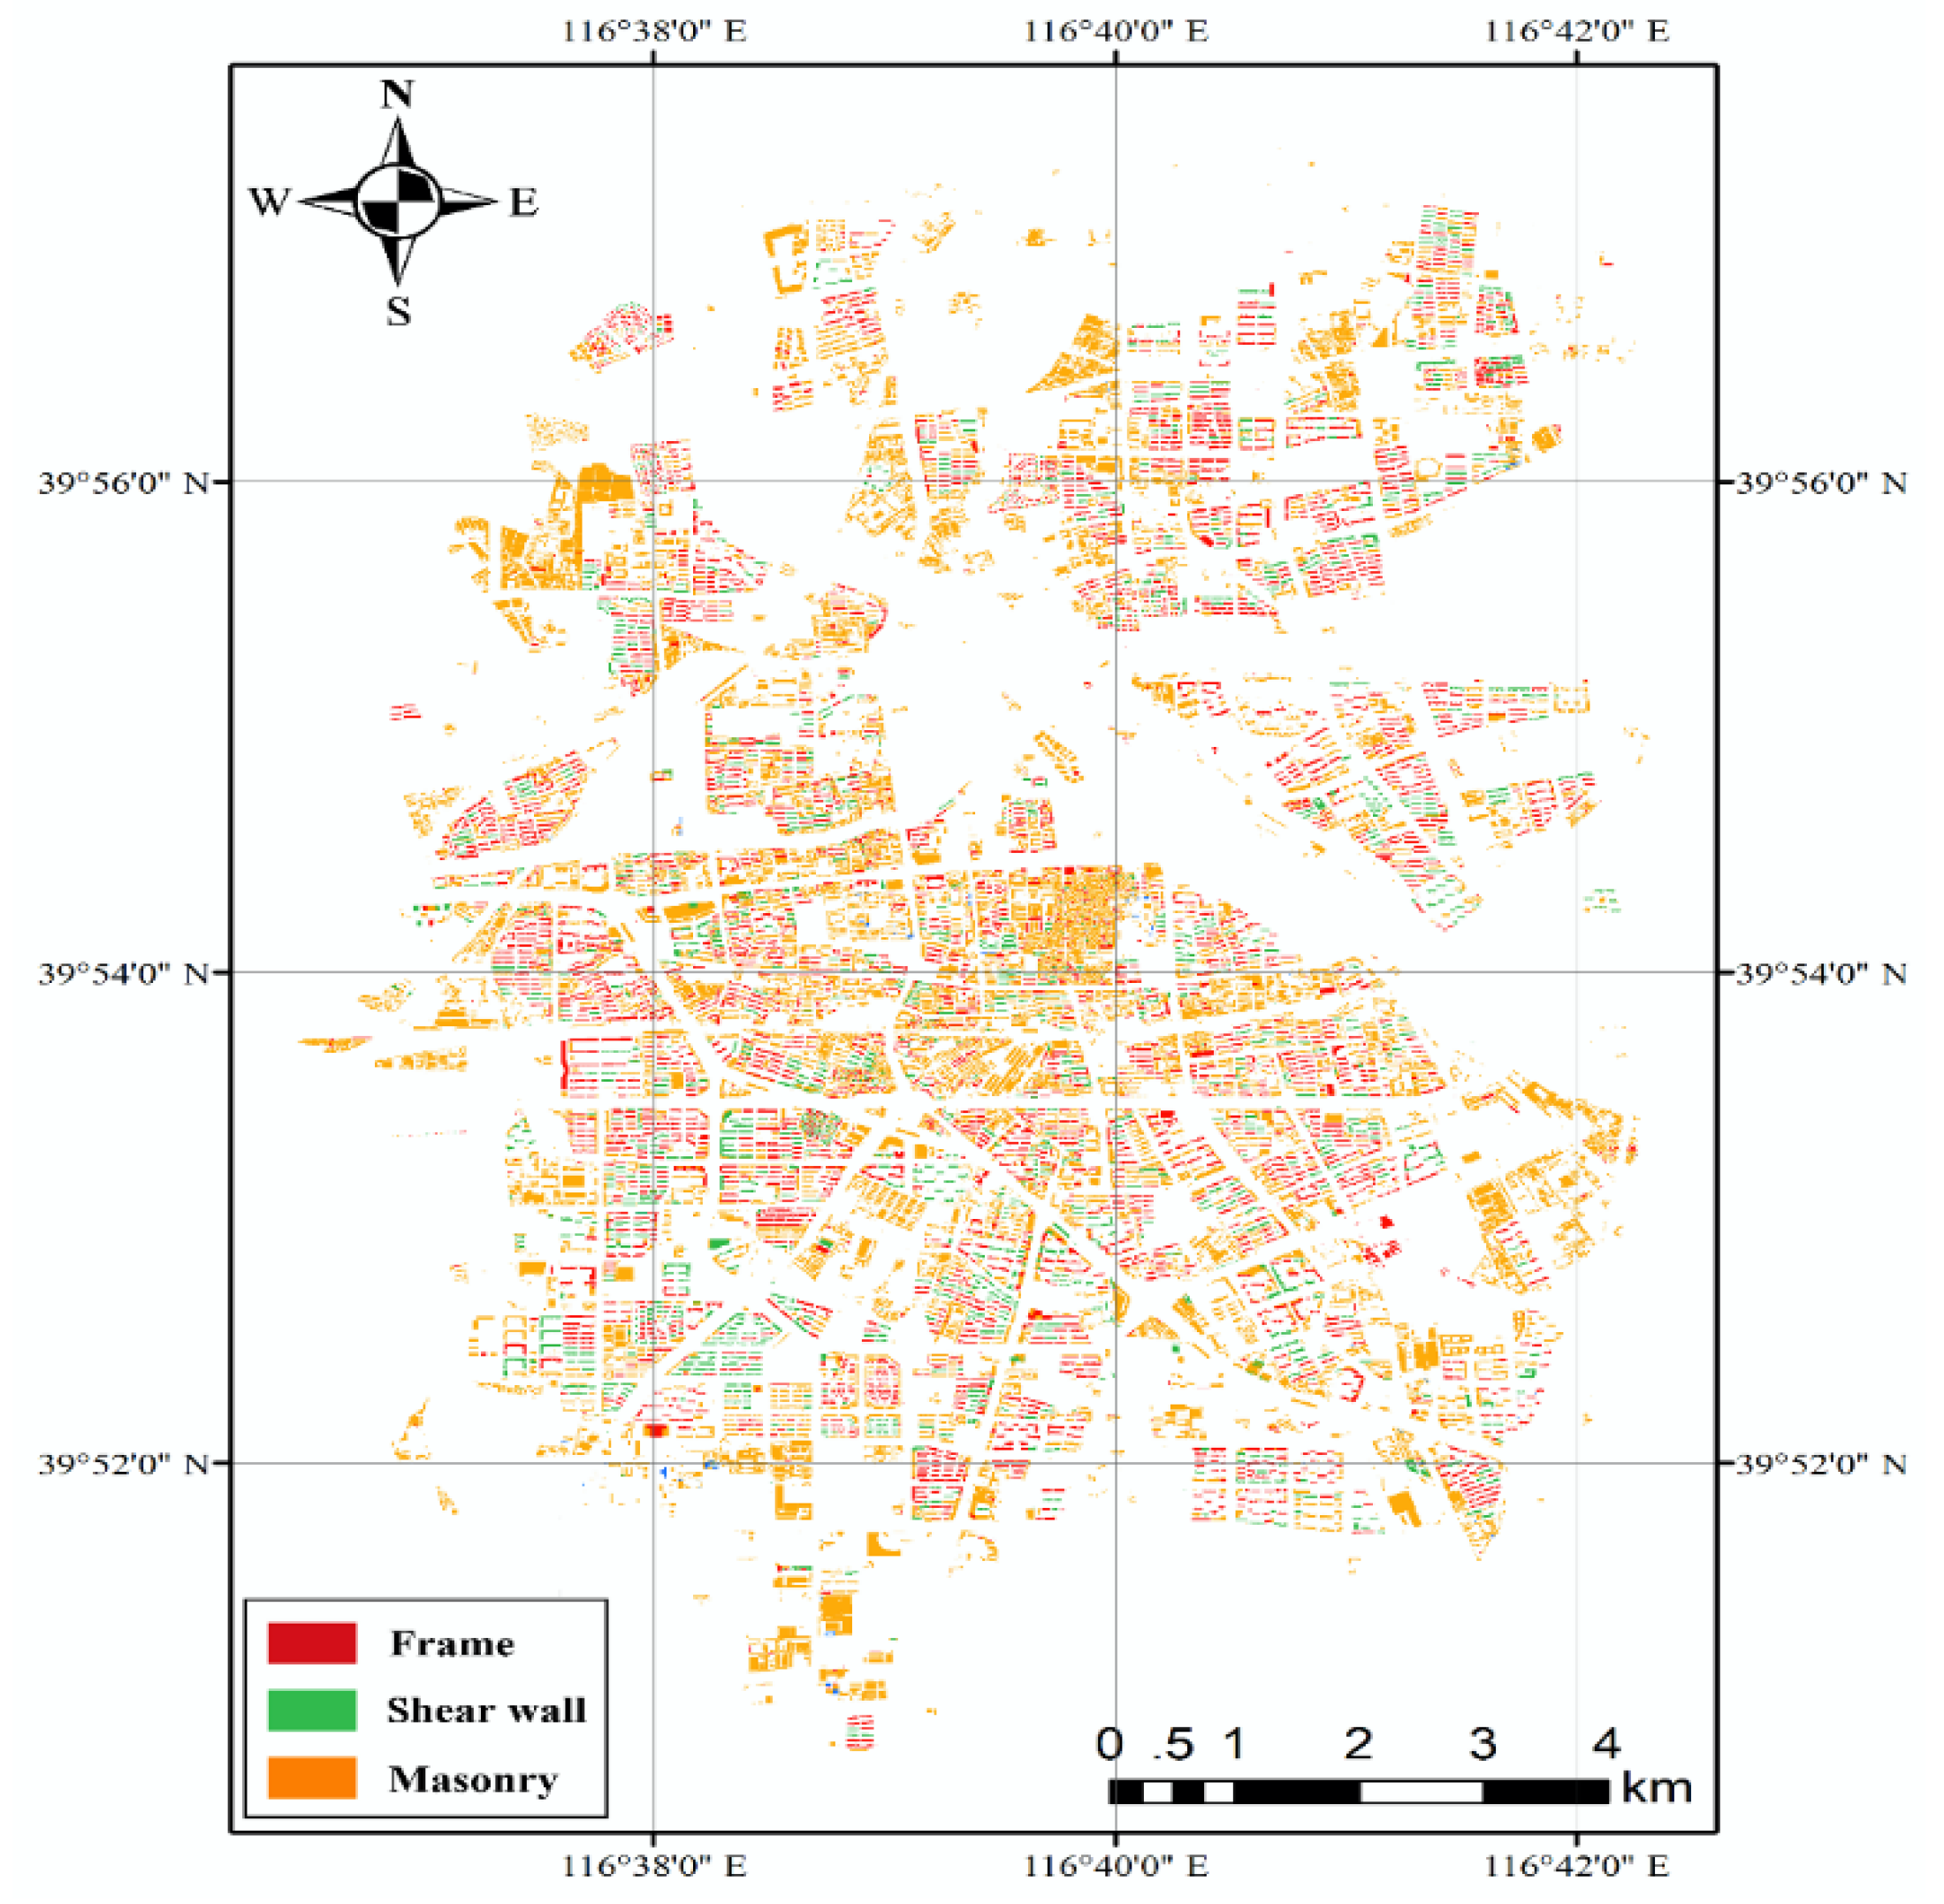
Using the trained model, the structural type of all buildings in Tongzhou downtown were predicted. The ratios of different structural types are shown in Figure 28. It is clear that most buildings in Tongzhou downtown are masonry buildings, which is similar to Daxing downtown. The distribution of structural type in Tongzhou downtown is shown in Figure 29.

5.5. Seismic Damage Simulation for Tongzhou Downtown

The ground motion of the Sanhe-Pinggu M 8.0 earthquake was also used for the seismic damage simulation of Tongzhou downtown. Based on the predicted building data and the MDOF models, the seismic damage of Tongzhou downtown was simulated, as shown in Figure 30. It is clear that most buildings suffer slight and moderate damages. The simulated seismic damage will provide the decision-making references for the urban planning on earthquake preparedness (e.g., seismic retrofitting planning).

6. Conclusions

An ML-based prediction method of the structural type of buildings was proposed, and the case study of Daxing and Touzhou downtowns in Beijing were investigated. Some conclusions are drawn as follows:
(1)
The prediction result of the designed supervised ML solution for Tangshan with 230,683 buildings indicated that decision forest, artificial neural network and logistic regression models exhibited high prediction accuracy. Especially, the decision forest model has the best performance and is recommended to predict structural types.
(2)
The designed supervised ML solution could maintain high prediction accuracy for different building scales; however, it should be applied for cities similar to the sample city.
(3)
The designed semi-supervised ML solution was applicable to different cities, based on a sampling investigation. According to the prediction with different sampling fractions, the sampling fraction of 1% is recommended. Through multiple self-trainings, the semi-supervised ML solution achieved high accuracy for predicting structural types.
(4)
This study provided a smart and efficient method to predict structural type for a city-scale seismic damage simulation.

Author Contributions

Conceptualization, Z.X. and M.Z.; methodology, Y.W.; software, M.-z.Q.; validation, C.X.; resources, X.L.; writing—original draft preparation, Z.X.; writing—review and editing, M.-z.Q. All authors have read and agreed to the published version of the manuscript.

Funding

This research was funded by Scientific Research Fund of Institute of Engineering Mechanics, China Earthquake Administration (Grant No. 2019EEEVL0501), General Program of the National Natural Science Foundation of China (Grant No. 51978049) and Beijing Nova Program of Science and Technology (Grant No. Z191100001119115).

Conflicts of Interest

The authors declare no conflict of interest.

References

  1. Reyners, M. Lessons from the destructive mw 6.3 Christchurch, New Zealand, earthquake. Seismol. Res. Lett. 2011, 82, 371–372. [Google Scholar] [CrossRef]
  2. Li, Z.; Ni, S.; Roecker, S. Seismic imaging of source region in the 1976 M s 7.8 Tangshan earthquake sequence and its implications for the seismogenesis of intraplate earthquakes. Bull. Seismol. Soc. Am. 2018, 108, 1302–1313. [Google Scholar] [CrossRef]
  3. Ministry of Housing and Urban-Rural Development. Code for Seismic Design of Building (GB 50011-2010); China Architecture Industry Press: Beijing, China, 2016. [Google Scholar]
  4. Lu, X.; Han, B.; Hori, M.; Xiong, C.; Xu, Z. A coarse-grained parallel approach for seismic damage simulations of urban areas based on refined models and GPU/CPU cooperative computing. Adv. Eng. Softw. 2014, 70, 90–103. [Google Scholar] [CrossRef]
  5. Lu, X.; Guan, H. Earthquake Disaster Simulation of Civil Infrastructures: From Tall Buildings to Urban Areas; Springer and Science Press: Beijing, China, 2017. [Google Scholar]
  6. Xiong, C.; Lu, X.; Guan, H.; Xu, Z. A nonlinear computational model for regional seismic simulation of tall buildings. Bull. Earthq. Eng. 2016, 14, 1047–1069. [Google Scholar] [CrossRef]
  7. Xiong, C.; Lu, X.; Lin, X.; Ye, L. Parameter determination and damage assessment for THA-based regional seismic damage prediction of multi-story buildings. J. Earthq. Eng. 2017, 21, 461–485. [Google Scholar] [CrossRef]
  8. Xu, Z.; Lu, X.; Guan, H.; Han, B.; Ren, A. Seismic damage simulation in urban areas based on a high-fidelity structural model and a physics engine. Nat. Hazards 2014, 71, 1679–1693. [Google Scholar] [CrossRef] [Green Version]
  9. Xiong, C.; Lu, X.; Huang, J.; Guan, H. Multi-LOD seismic-damage simulation of urban buildings and case study in Beijing CBD. Bull. Earthq. Eng. 2019, 17, 2037–2057. [Google Scholar] [CrossRef]
  10. Lu, X.; Frank, M.; Cheng, Q.L.; Xu, Z.; Zeng, X.; Stephen, M. An open-source framework for regional earthquake loss estimation using the city-scale nonlinear time-history analysis. Earthq. Spectra 2020. [Google Scholar] [CrossRef]
  11. Li, S.; Tang, H.; Huang, X.; Mao, T.; Niu, X. Automated detection of buildings from heterogeneous VHR satellite images for rapid response to natural disasters. Remote Sens. 2017, 9, 1177. [Google Scholar] [CrossRef] [Green Version]
  12. Kadhim, N.; Mourshed, M. A shadow-overlapping algorithm for estimating building heights from VHR satellite images. IEEE Geosci. Remote Sens. Soc. 2017, 15, 8–12. [Google Scholar] [CrossRef] [Green Version]
  13. Ministry of Housing and Urban-Rural Development. Design Code for Residential Buildings (GB 50096-2011); China Architecture Industry Press: Beijing, China, 2011. [Google Scholar]
  14. Tian, J.; Cui, S.; Reinartz, P. Building change detection based on satellite stereo imagery and digital surface models. IEEE Geosci. Remote Sens. Soc. 2013, 52, 406–417. [Google Scholar] [CrossRef] [Green Version]
  15. DataSF. Available online: https://datasf.org/opendata/ (accessed on 22 February 2020).
  16. Bishop, C.M. Pattern Recognition and Machine Learning; Springer: New York, NY, USA, 2006. [Google Scholar]
  17. Krijnen, T.; Tamke, M. Assessing Implicit Knowledge in BIM Models with Machine Learning. In Modelling Behaviour; Springer: Den Dolech, The Netherlands, 2015; pp. 397–406. [Google Scholar]
  18. Dornaika, F.; Moujahid, A.; El Merabet, Y.; Ruichek, Y. Building detection from orthophotos using a machine learning approach: An empirical study on image segmentation and descriptors. Expert Syst. Appl. 2016, 58, 130–142. [Google Scholar] [CrossRef]
  19. Yuan, J.; Cheriyadat, A.M. Combining maps and street level images for building height and facade estimation. In Proceedings of the 2nd ACM SIGSPATIAL Workshop on Smart Cities and Urban Analytics, Burlingame, CA, USA, 31 October 2016; p. 8. [Google Scholar]
  20. Yuan, J. Learning building extraction in aerial scenes with convolutional networks. IEEE Trans. Pattern Anal. Mach. Intell. 2017, 40, 2793–2798. [Google Scholar] [CrossRef] [PubMed]
  21. Bassier, M.; Vergauwen, M.; Van Genechten, B. Automated classification of heritage buildings for as-built BIM using machine learning techniques. ISPRS Ann. Photogramm. Remote Sens. Spat. Inf. Sci. 2017, IV-2/W2, 25–30. [Google Scholar] [CrossRef] [Green Version]
  22. Dreiseitl, S.; Ohno-Machado, L. Logistic regression and artificial neural network classification models: A methodology review. J. Biomed. Inform. 2002, 35, 352–359. [Google Scholar] [CrossRef] [Green Version]
  23. Tao, J.; Klette, R. Integrated pedestrian and direction classification using a random decision forest. In Proceedings of the IEEE International Conference on Computer Vision Workshops, Sydney, Australia, 1–8 December 2013; pp. 230–237. [Google Scholar]
  24. Wang, L. Support Vector Machines: Theory and Applications; Springer: Dordrecht, The Netherlands, 2005. [Google Scholar]
  25. Kleinbaum, D.G.; Dietz, K.; Gail, M.; Klein, M.; Klein, M. Logistic Regression; Springer: New York, NY, USA, 2002. [Google Scholar]
  26. BigML. Available online: https://bigml.com/ (accessed on 17 December 2019).
  27. Microsoft Azure Machine Learning Platform. Available online: https://studio.azureml.net/ (accessed on 17 December 2019).
  28. TensorFlow. Available online: https://tensorflow.google.cn/ (accessed on 17 December 2019).
  29. Amazon Machine Learning. Available online: https://aws.amazon.com/cn/machine-learning/ (accessed on 17 December 2019).
  30. Zhu, X.; Goldberg, A.B. Introduction to semi-supervised learning. Synth. Lect. Artif. Intell. Mach. Learn. 2009, 3, 1–130. [Google Scholar] [CrossRef] [Green Version]
  31. Ali Humayun, M.; Hameed, I.A.; Muslim Shah, S.; Hassan Khan, S.; Zafar, I.; Bin Ahmed, S.; Shuja, J. Regularized Urdu speech recognition with semi-supervised deep learning. Appl. Sci. 2019, 9, 1956. [Google Scholar] [CrossRef] [Green Version]
  32. Khan, J.; Lee, Y.K. LeSSA: A unified framework based on lexicons and semi-supervised learning approaches for textual sentiment classification. Appl. Sci. 2019, 9, 5562. [Google Scholar] [CrossRef] [Green Version]
  33. Wang, X.; Feng, X.; Xu, X.; Diao, G.; Wan, Y.; Wang, L.; Ma, G. Fault plane parameters of Sanhe-Pinggu M8 earthquake in 1679 determined using present-day small earthquakes. Earthq. Sci. 2014, 27, 607–614. [Google Scholar] [CrossRef] [Green Version]
  34. Fu, C.; Gao, M.; Chen, K. A study on long-period response spectrum of ground motion affected by basin structure of Beijing. Acta Seismol. Sin. 2012, 34, 374–382. [Google Scholar]
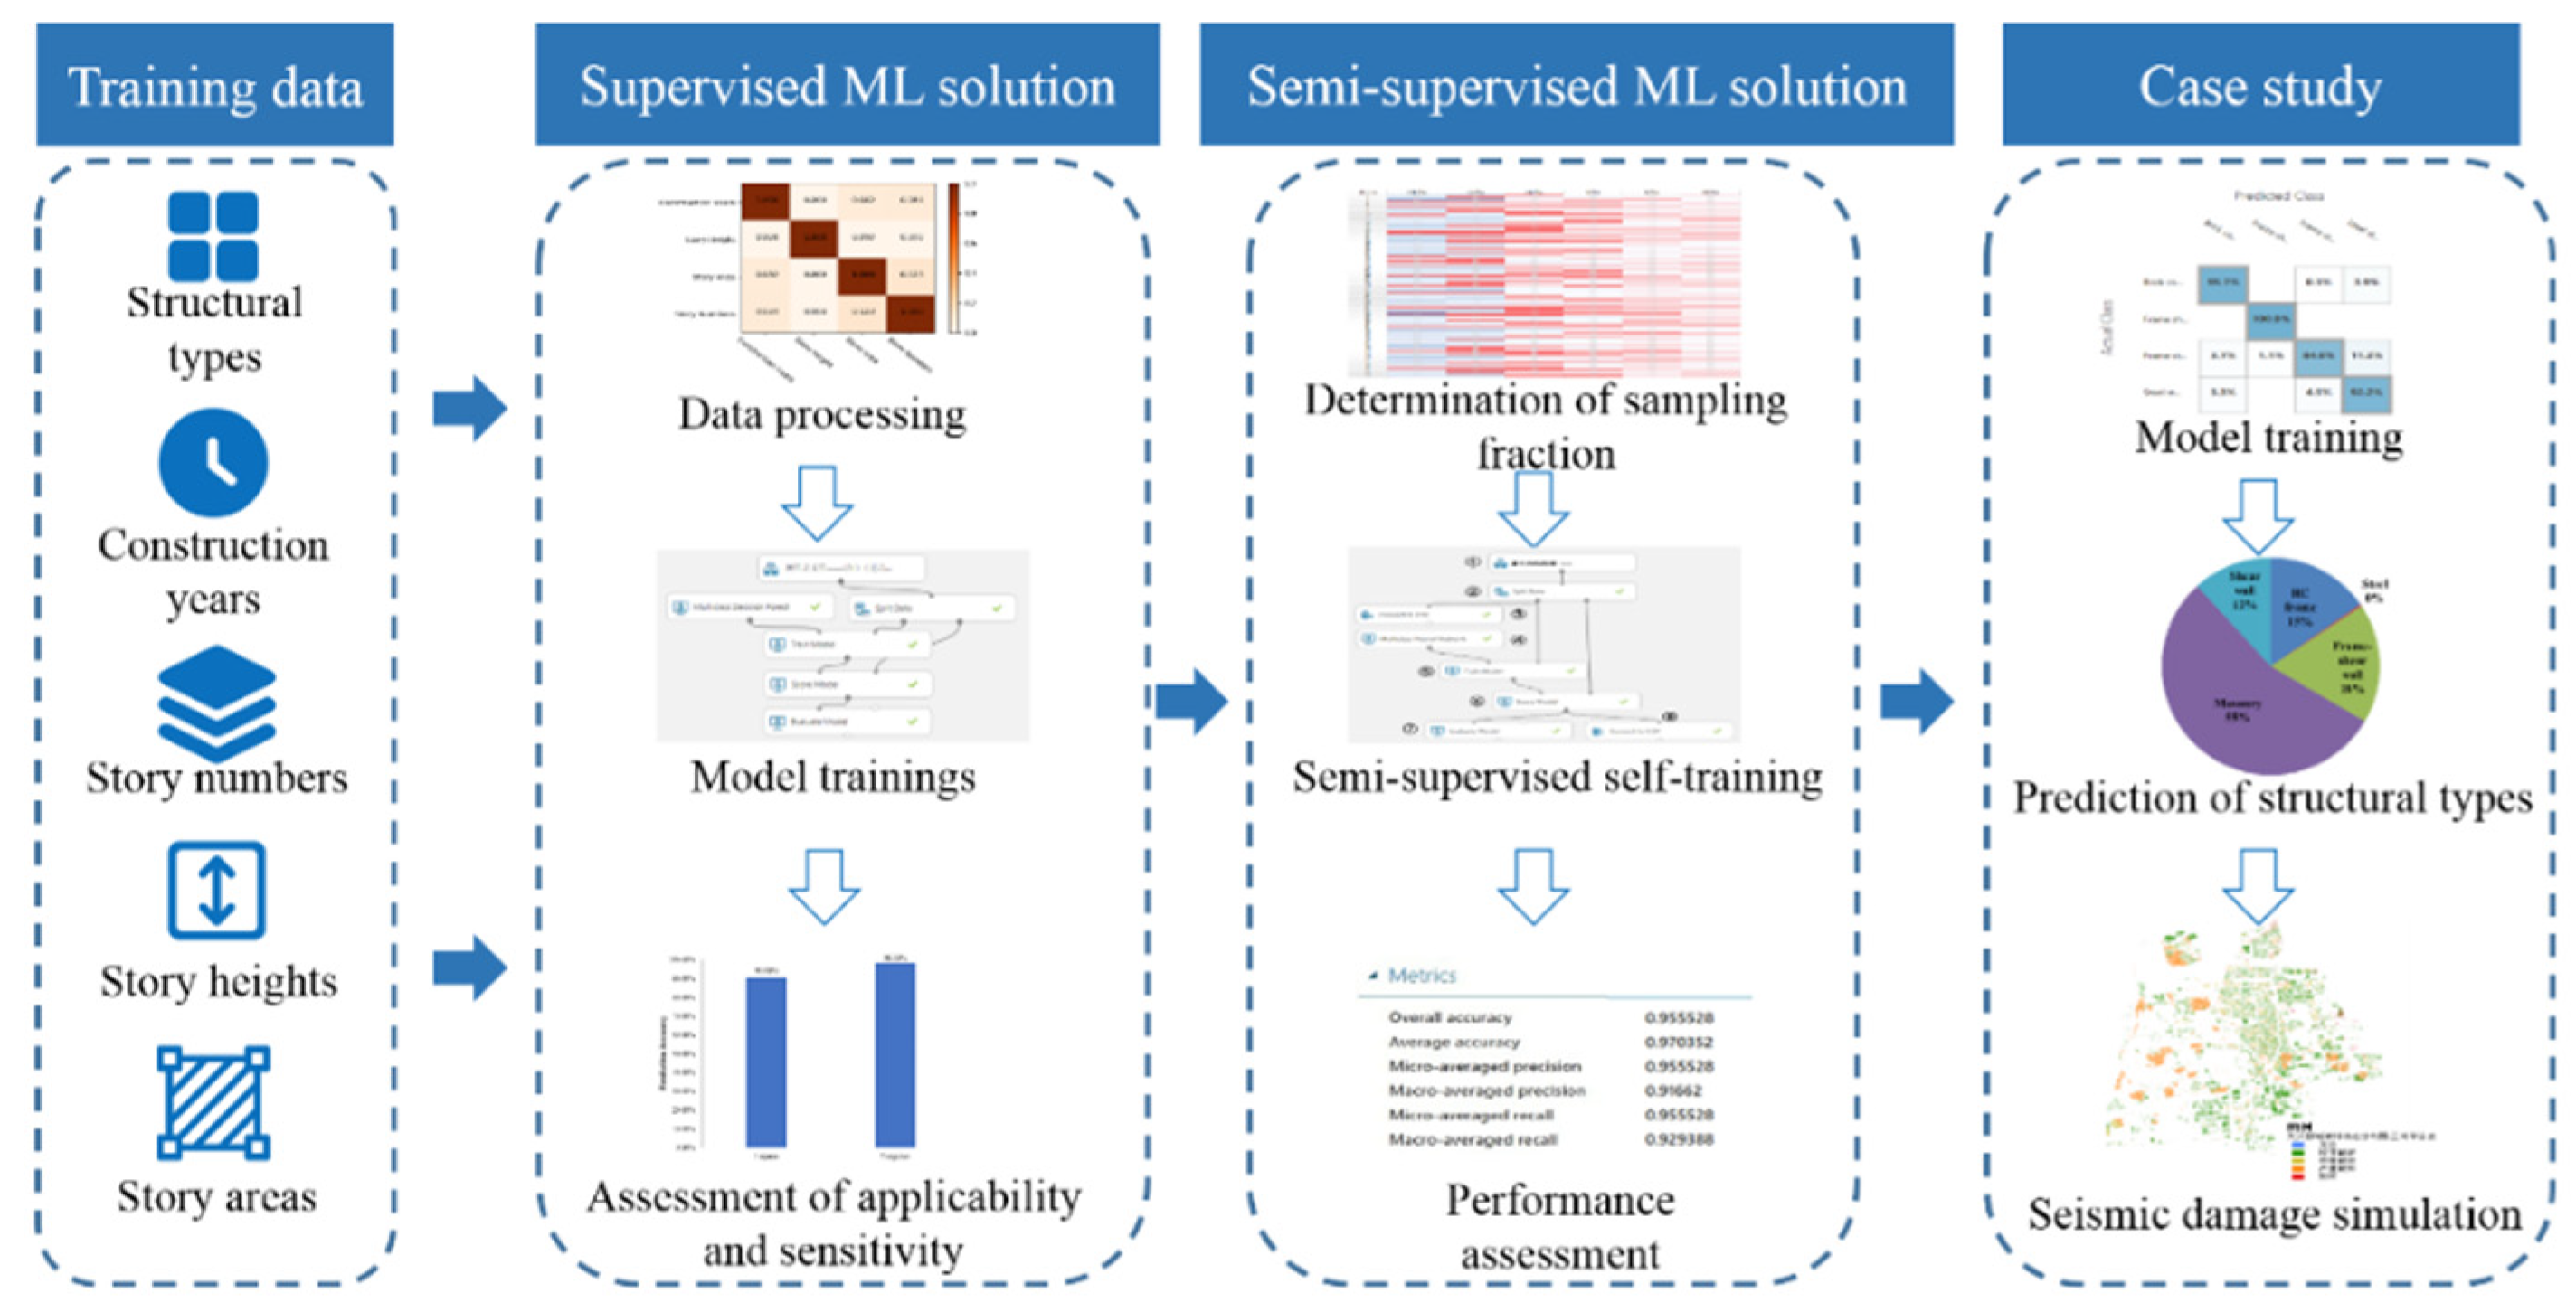
Figure 1. The framework of this study.
Applsci 10 01795 g001
Figure 2. Correlation matrix of the building data.
Applsci 10 01795 g002
Figure 3. Designed supervised machine learning (ML) solution.
Applsci 10 01795 g003
Figure 4. Prediction accuracies and confusion matrices for the designed supervised ML solution using (a) multi-class decision forest model, (b) multi-class neural network model and (c) logistic regression model.
Applsci 10 01795 g004
Figure 5. Prediction accuracies for different building scales.
Applsci 10 01795 g005
Figure 6. Prediction accuracies for different cities.
Applsci 10 01795 g006
Figure 7. Distribution of prediction accuracies with different sampling fractions in Taiyuan.
Applsci 10 01795 g007
Figure 8. Distribution of prediction accuracies with different sampling fractions in Tangshan.
Applsci 10 01795 g008
Figure 9. Prediction accuracy and variance of different sampling fractions in Taiyuan.
Applsci 10 01795 g009
Figure 10. Prediction accuracy and variance of different sampling fractions in Tangshan.
Applsci 10 01795 g010
Figure 11. Designed semi-supervised ML solution.
Applsci 10 01795 g011
Figure 12. Process of first self-training.
Applsci 10 01795 g012
Figure 13. Part of the scored building data.
Applsci 10 01795 g013
Figure 14. Prediction accuracies and confusion matrix for the first self-training scenario.
Applsci 10 01795 g014
Figure 15. Process of second self-training.
Applsci 10 01795 g015
Figure 16. Prediction accuracies and confusion matrix for the second self-training scenario.
Applsci 10 01795 g016
Figure 17. Prediction accuracies and confusion matrix for the third self-training scenario.
Applsci 10 01795 g017
Figure 18. The locations of Daxing and Tongzhou districts in Beijing.
Applsci 10 01795 g018
Figure 19. Building distribution with different construction years.
Applsci 10 01795 g019
Figure 20. Building distribution with different story numbers.
Applsci 10 01795 g020
Figure 21. Prediction accuracies and confusion matrix for the case of Daxing downtown.
Applsci 10 01795 g021
Figure 22. Ratios of structural type in Daxing downtown.
Applsci 10 01795 g022
Figure 23. Distribution of building structure type in Daxing downtown.
Applsci 10 01795 g023
Figure 24. Time-history accelerations in the Sanhe-Pinggu earthquake.
Applsci 10 01795 g024
Figure 25. Distribution of seismic damage in Daxing downtown.
Applsci 10 01795 g025
Figure 26. Seismic damage statistics by (a) structure type and (b) construction year.
Applsci 10 01795 g026
Figure 27. Prediction accuracies and confusion matrix for the case of Tongzhou downtown.
Applsci 10 01795 g027
Figure 28. Ratios of structural type in Tongzhou downtown.
Applsci 10 01795 g028
Figure 29. Distribution of structure type in Tongzhou downtown.
Applsci 10 01795 g029
Figure 30. Distribution of seismic damage in Tongzhou downtown.
Applsci 10 01795 g030
Table 1. The macro and micro F1 scores of the predictions in Tangshan.
ML ModelMacro F1 ScoreMicro F1 Score
Decision forest 96.9%98.3%
Artificial neural network96.3%98.0%
Logistic regression94.6%97.0%
Table 2. Comparison between the real data and prediction result in Tangshan.
Structure TypeReal DataPrediction ResultsError
Masonry87.07%83.68%3.40%
Frame10.78%14.18%−3.40%
Shear wall2.14%2.14%0.00%
Table 3. Structure types and numbers of investigated buildings.
MasonryFrameShear WallLight SteelTotal
3852387616912075