1. Introduction
Hip Implant (HI) has become an important health issue around the world. Around 2 million HI surgeries are made each year in Organizations for Economic Co-operation and Development (OECD) countries, and the growth rate increases every year [
1]. This has pushed the actual market to offer a wide range of prostheses [
2]. One relevant issue in HI is the alignment of the acetabular component during Total Hip Arthroplasty (THA) [
3]. Proper alignment is a crucial step for reducing the chances of joint dislocation [
4], prosthetic component wear [
3], and impingement [
3]. The correction of these types of problems with a new intervention may cost up to
$250,000 USD [
5]. Therefore, the alignment process during HI surgery has been addressed in numerous studies [
3].
Many devices have been developed for helping physicians adequately place HI (
Figure 1). Some of them are mechanical, and others are optical. However, a final approach is the use of devices placed in pelvis and femur. Such devices, best known as Surgical Aid Devices (SADs), interact with a Personal Digital Assistant (PDA) and help the physician to make decisions related to the cut positioning, the type of femoral heads, and others. Hence, the popularity of this type of device has grown considerably in recent years. In addition, they are less invasive, cheaper, and effective.
Considering the impact that SADs can have on HI surgery outcomes, it is important to identify potential ways of performance improvement without increasing the device cost. At the same time, it is important also to consider the design process factors, such as ergonomics [
6], special customer requirements [
7], and both patients’ and physician’s requirements [
8]. These outcomes can be reached by improving the SAD design process. In this sense, it is important to point out that in a typical design process, a designer must consider the complex interactions among products, their various subsystems, the environment, and users [
6,
7,
8]. In the meantime, the design team struggles to find the balance between conflicting needs of end-users with commercial considerations, such as time and financial constraints, that may limit the effective deployment of SADs in the wild. In any environment, this remains a significant challenge. Besides, the design of surgical tools and other medical devices is a very complex task [
7,
9]. Thus, a detailed investigation of user needs and end-user environments remains difficult in medical device development. Nevertheless, a good understanding of this relationship can support the design and provide evidence for the importance of considering design when aiming to influence or change user behavior in a medical context [
8]. Even in scenarios where there are many data available, it is often unclear how they can be best used to improve the design process and device utility [
9]. Furthermore, it is unclear how improvements in any of the product features might impact the usability of the product [
9]. Without the appropriate information, there is limited ability to find an ideal balance between the design needs and the specific interests of the regulatory commission, medical device manufacturer, and end-users [
7,
8,
10]. These challenges call for more robust methods that allow stakeholders to best address the medical device design [
9].
Keeping in mind the above-mentioned situation, it is necessary to look for approaches that allow designers to address, in a better way, the challenges immersed in the designing of medical devices (SAD in this particular case), implying the fulfillment of all end-user needs. These needs, as mentioned above, may conflict with each other. Therefore, it is necessary to strengthen the design process and prioritize the product characteristics so that the user needs are correctly weighted, the impact of each need in overall satisfaction can be estimated, the influence between the different design characteristics (actions) is considered, and the relation between each product characteristic (action) and each customer need can be evidenced. Succeeding in these tasks will reduce the likelihood of inadequate design and increase end-user satisfaction.
There are many methodologies available to address product design. Amongst these methodologies are Analytic Hierarchy Process (AHP), Quality Function Deployment (QFD), Kano Model, and Decision Making Trial and Evaluation Laboratory (DEMATEL). Nevertheless, to the best of our knowledge, these methodologies have not been used together before in product design, and, in the particular case of medical devices, there is little evidence of the integration between each of these different methodologies, and there is no evidence at all of the integration of the four. Addressing the design process of medical devices may imply just the selection of any of these methodologies. However, this decision is challenging, considering that each methodology has its advantages as well as its weaknesses [
11,
12,
13,
14]. Since none of these methodologies dominates the others, it becomes clear that a proper integration of them should overcome their weaknesses and, in doing so, should be able to drive into a robust design process. Therefore, this paper aimed to propose the integration of these methodologies, considering fuzziness in the Kano model, to come up with a robust design procedure. The procedure was validated using the particular case of a SAD due to the difficulty to properly address the design process in this type of product.
The paper is organized as follows:
Section 2 contains a literature review of QFD, Kano Model, AHP, and DEMATEL methods and some of their applications, while
Section 3 describes the proposed hybrid approach.
Section 4 describes a case study of a hip replacement surgery aid device for elderly people whose design process is evidenced in
Section 5. Then,
Section 6 analyzes the results derived from the application, and
Section 7 presents the conclusions.
2. Literature Review
2.1. Quality Function Deployment
QFD, as well as the continuous improvement philosophies, has been developed to address manufacturing companies’ problems, specifically new product development [
15,
16,
17,
18]. These processes have been very tortuous, considering that the customer needs have not been properly identified nor prioritize, and the connection of those needs with the design and production factors has not been established either. This misconnection has avoided also the identification of how each one of the design or production factors has contributed to fulfilling each customer need. Therefore, QFD aims to provide a methodology that takes costumers’ requirements as the main driver in the design process [
15,
16,
19].
The problem lies in the existing misconnection between the what’s and the how’s. This misconnection can be found in all the company’s processes, and it causes a waste of money and delays in product development and project implementation. Therefore, it is important for companies the implementation of a tool, which can help them to do the link between what´s and the how´s whether the application is a quality system or a product. This tool is Quality Function Deployment (QFD), also known as the House of Quality (HoQ) [
20]. QFD can help companies and processes to close the gap between what is required and how to achieve those requirements. In the specific case of SAD, QFD will be a great approach to achieve proper product quality.
Usually, QFD starts by collecting the costumers’ needs or the Voice of the Customer (VOC). These customer needs are identified through surveys and are correlated with the design factors or specifications. This correlation process is performed in a matrix with the shape of a house [
15]. When developing a new product, QFD has to be applied successively, to define the required process technology, specifications, and materials, for example [
20,
21].
QFD, like many other methodologies, in which people must rank or weigh a particular group of aspects, has suffered from a lack of consistency when assigning weights, whether to the customer requirements or the design factors/actions (QFD in a design process). The opinions or preferences of the clients are presented in terms of numerical or linguistic scales, which are subjective, vague, and imprecise, and QFD does not perform in the best way if these aspects are not considered adequately [
22]. Original QFD has been considered a manual approach and has also been known for having several limitations, such as long implementation time and subjective decision aid [
22].
The weight given to each need by the customer gains reliability when estimated with AHP, considering that AHP has a consistency index that helps in identifying when corrupt data is going to be introduced to the model. In this way, it is possible to eliminate such data from the decision process, assuring the fact that data is trustable [
23].
QFD’s lack of consistency related to the translation of linguistic expressions of the customer needs into numeric satisfaction influence values has been also tackled integrating QFD with the Kano model. The importance of this integration is that though customer can assign a particular weight to a need (scoring, AHP, among others), customer is not truly aware of the type of need he/she is weighing, and, therefore, customer is not truly aware of the impact the absence or presence of the need in the product will have on its overall satisfaction. Kano model classifies each customer need in one of five main categories. Depending on which category the particular need is classified, it will have a particular influence on customer satisfaction [
24,
25]. This situation is related to the fact that customers take some features for granted, and others are not even expressed, so the impact that each Kano category has on customer satisfaction or dissatisfaction will differ from the other categories.
Some of these disadvantages have been identified by Wolniak [
12]. In his study, Wolniak [
12] pointed out that one of the major limitations of QFD laid on in the fact that it is unable to identify the importance of each customer’s need and its impact when fulfilled or not in the end-user satisfaction. Wolniak [
12] also mentioned the excessive degree of subjectivity in the process, without a tool that helped to alert in case the induced bias was too strong. Finally, Wolniak [
12] pointed out that the method might suffer a lack of flexibility in some occasions.
As it is mentioned by Wolniak [
12], one of the drawbacks of QFD is the subjectivity of the process. One of the steps, in which the presence of subjectivity is evident, is analyzing the influence and relation that each design action has on each other. In this sense, it is important to point out that this analysis aims to obtain the weights of each design action. This process can be addressed in a better way by integrating DEMATEL to QFD. DEMATEL focuses on the decision-making processes, where the influence each criterion has on the others should be considered [
13,
14]. DEMATEL has been integrated before with QFD, mainly to have a better understanding of the relationships between the different customer needs and to have a better understanding of their impact on customer satisfaction [
18].
Finally, QFD has been integrated with fuzzy logic to include the vagueness of human thinking when comparing or rating different alternatives [
26]. In this sense, fuzzy logic is often integrated with QFD to generate a more precise and objective approach for QFD implementation [
26].
As mentioned above, QFD has been often integrated with different tools, such as the multicriteria decision method (AHP, DEMATEL, etc.), the Kano model, and fuzzy logic. The output of these integrations has been critical for increasing the reliability of QFD as a relevant input of companies´ decision-making processes [
18,
25]. Considering the positive impact each one of these methodologies can have on QFD, a review of them and its applications has been done from the next section on.
2.2. Kano Model
The first tool QFD is traditionally integrated with, is the Kano Model. The use of the Kano Model aims to debug the expressed customer requirements to make the QFD analysis simpler. Kano’s proposal to assess customer needs has been a great contribution to the evaluation of the impact of the degree of fulfillment of these needs on customer satisfaction. Traditionally, researchers have assumed a linear relationship between the achievement of quality attributes and customer satisfaction [
24,
27,
28,
29,
30,
31]. More specifically, before Kano’s approach, it was assumed that customers would be satisfied if a certain quality attribute of a product or service was provided; otherwise, they would be dissatisfied [
24,
27,
28,
32]. However, the assumption of linearity has been proven to be inaccurate. This allows understanding that product and service quality is composed of various attributes, and some of them serve to fulfill minimum customer requirements, while others provide additional value. In other words, the achievement of some quality attributes, in particular, does not necessarily involve an improvement of overall customer satisfaction. Additionally, it is important to point out that not all customer needs are viewed as equally important to them [
24,
27,
28,
32].
The situation described above implies that there is a non-linear relationship between the performance of quality attributes and overall customer satisfaction. Therefore, the effects of the fulfillment of the different customer needs have to be taken into consideration from manufacturers or service providers to adequately allocate resources via prioritizing design factors to increase customer satisfaction or minimize dissatisfaction [
24,
27,
28,
32].
Applications of the Kano Model include all types of product and service design [
33], healthcare services improvement [
34], as well as Information and Communications Technology (ICT) devices improvement [
35], among others. Nevertheless, the Kano Model does not work well when implemented alone. The problem is that companies need not only to identify customer needs but also to align these needs with some design features/actions, to identify which actions will have a bigger impact on customer satisfaction, so the implementation of each one of them can be prioritized [
31,
33]. Therefore, it is necessary to integrate the Kano model with QFD, and other Multi-criteria Decision Making (MCDM) methods to have a more robust decision support system when prioritizing design features/actions.
2.3. Analytic Hierarchy Process (AHP)
QFD matrix assumes that the importance given by the customer for each one of its needs is known. Nevertheless, the process used to identify those customer preferences is crucial for the design factor prioritization. Therefore, to properly estimate the degree of importance of each customer’s need, many authors have used AHP to determine this customer-need importance factor (weight).
AHP was developed by Thomas Saaty, aiming to solve complex multiple criteria decision problems by ranking decision alternatives and selecting the best one when the decision-maker has multiple objectives or criteria [
36]. This methodology allows users to assess the relative weight of multiple criteria or multiple options against given criteria in an intuitive manner [
37,
38]. In case quantitative ratings are not available, decision-makers or assessors can still recognize whether one criterion is more important than another. Therefore, pairwise comparisons are done by users. Saaty established a consistent way of converting such pairwise comparisons (X is more important than Y) into a set of numbers, representing the relative priority of each of the criteria [
39].
AHP applications are wide and include almost all fields in decision-making problems. For example, AHP has been used as a prioritization tool in the process of selecting the best ICT service in a school in Chile [
40], adoption of ICT in different industries [
41,
42], and evaluation of software [
43,
44], among others. AHP has also been used in healthcare to select equipment [
45], to analyze the performance of healthcare services [
26], to select the most suitable prosthesis [
46], among others.
The integration of AHP with QFD has been evidenced in several studies. This integration has been made in an effort to address the disadvantages of single methods. The applications are focused on weighting the customer needs. This weighting process tries to determine the impact each customer/decision-maker needs will have on customer decision/maker satisfaction. Nevertheless, though the person conducting the decision-making process can give weights to each need/criteria AHP, the person is not truly aware of the impact this need will have on his/her satisfaction. This happens because the absence of a particular feature in a product does not necessarily drive to customer dissatisfaction, nor its presence necessarily implies customer satisfaction [
26]. Therefore, for the adequate impact determination of customer needs, it is important also to consider its impact on customer satisfaction [
26]. Another important consideration that makes relevant the integration of AHP to QFD is the need for identifying customer needs and, consequently, propose actions and/or features to fulfill these requirements. This guarantees that each customer’s need can be paired with at least one design feature or action, which also should have a positive impact on customer satisfaction [
36].
2.4. Decision-Making Trial and Evaluation Laboratory (DEMATEL)
DEMATEL method was originally developed by the Science and Human Affairs Program of the Battelle Memorial Institute of Geneva. It was intended to study and resolve the complicated and intertwined problem group [
18,
23,
47]. Unlike the traditional techniques, such as AHP with the assumption that elements are independent, DEMATEL method uses the structural modeling technique to identify the interdependence among the elements of a system through a causal diagram using digraphs to portray the basic concept of contextual relationships and the strengths of influence among the elements [
48,
49].
DEMATEL has the following advantages:
It effectively analyzes the mutual influences (both direct and indirect effects) among different factors and understands the complicated cause and effect of relationships in the decision-making problem [
14].
It can visualize the interrelationships between factors and enable the decision-maker to clearly understand which factors have mutual influences on one another. The DEMATEL can be used not only to determine the ranking of alternatives but also to find out critical evaluation criteria and measure the weights of evaluation criteria [
14].
Although the AHP can be applied to rank alternatives and determine criteria weights, it assumes that the criteria are independent and fails to consider their interactions and dependencies. The Analytic Network Process (ANP), an advanced version of the AHP, can deal with the dependence and feedback between criteria; but the assumption of equal weight for each cluster to obtain a weighted supermatrix in the ANP is not reasonable in practical situations [
14].
On the other hand, in comparison to other MCDM methods, the possible disadvantages of the DEMATEL technique may be the following:
It determines the ranking of alternatives based on interdependent relationships, but other criteria are not incorporated in the decision-making problem [
14].
The relative weights of experts are not considered in aggregating personal judgments of experts into group assessments [
14].
It cannot take into account the aspiration level of alternatives as in the Vlse Kriterijumska Optimizacija Kompromisno Resenje (VIKOR) method or obtain partial ranking orders of alternatives as in the Elimination et Choix Traduisant la Realité (ELECTRE) approach [
14].
Therefore, DEMATEL has been integrated with other MCDM methods (i.e., QFD) to combine their desired properties [
18,
50]. On a different note, DEMATEL has been applied for underpinning a wide range of decisions. Indeed, the literature reports several DEMATEL applications like identifying customer preference factors when buying a particular good [
51], identifying the best improvement action in a quality management system [
52], assessing and selecting different strategic decisions [
53], supplier selection [
50,
54], and others. DEMATEL has been also used to pinpoint drivers for ICT [
55] and create an evaluation system for healthcare management [
56]. Additionally, DEMATEL has been also integrated into QFD to find the relationship among different customer needs [
57].
Table 1 depicts relevant related researches integrating different techniques. From that table, it could be observed that the proposed approach differed from others found in the literature. Specifically, although there are many models related to the design process, many of them fail in translating words into requirements and actions effectively. Additionally, many of them do not consider the fuzzy nature of human judgments, the interrelations among criteria, and the use of satisfaction indexes. The proposed model included all these features, as detailed in the following description:
Adequate relative importance (weight) of customer requirements with the implementation of AHP.
Real impact estimation of customer requirements (fuzzy Kano)
The dependence relationship between design actions (DEMATEL)
The relation between design action and customer needs (QFD)
3. Proposed methodology
The above considerations were incorporated into a novel methodology (
Figure 2), supporting the smart product design process:
Step 1: Identification of customer needs. These customer needs were identified through an evaluation of customer claims and recommendations, but also by the permanent contact with physicians.
Step 2: The design department at the company analyzed the needs and proposed some design features/actions to fulfill customer expectations.
Step 3: The fuzzy Kano survey was implemented to the physicians. This survey allowed the team to classify each need as must-be, one dimensional, and excitement. The relevance of this classification laid in identifying the influence that each need would have on customer satisfaction or dissatisfaction.
Step 4: Implementation of AHP. With the implementation of AHP, the perceived weights of each need would be identified.
Step 5: Implementation of DEMATEL. With the implementation of DEMATEL, the overall influence for each one of the design actions/features would be identified.
Step 6: All the collected information was compiled in the QFD matrix. AHP and Kano influence values would be located next to its corresponding customer needs (rows). The columns would have the design actions/features and also its corresponding weight (calculated with DEMATEL).
Step 7: The design team filled a survey to identify the relationship between each customer’s needs and each design action.
Step 8: Calculation of satisfaction influence for each design action, through the information in the QFD matrix.
Step 9: Prioritization of design actions/features.
The concepts of the calculations behind each one of the integrated methodologies are explained below:
3.1. Kano Model
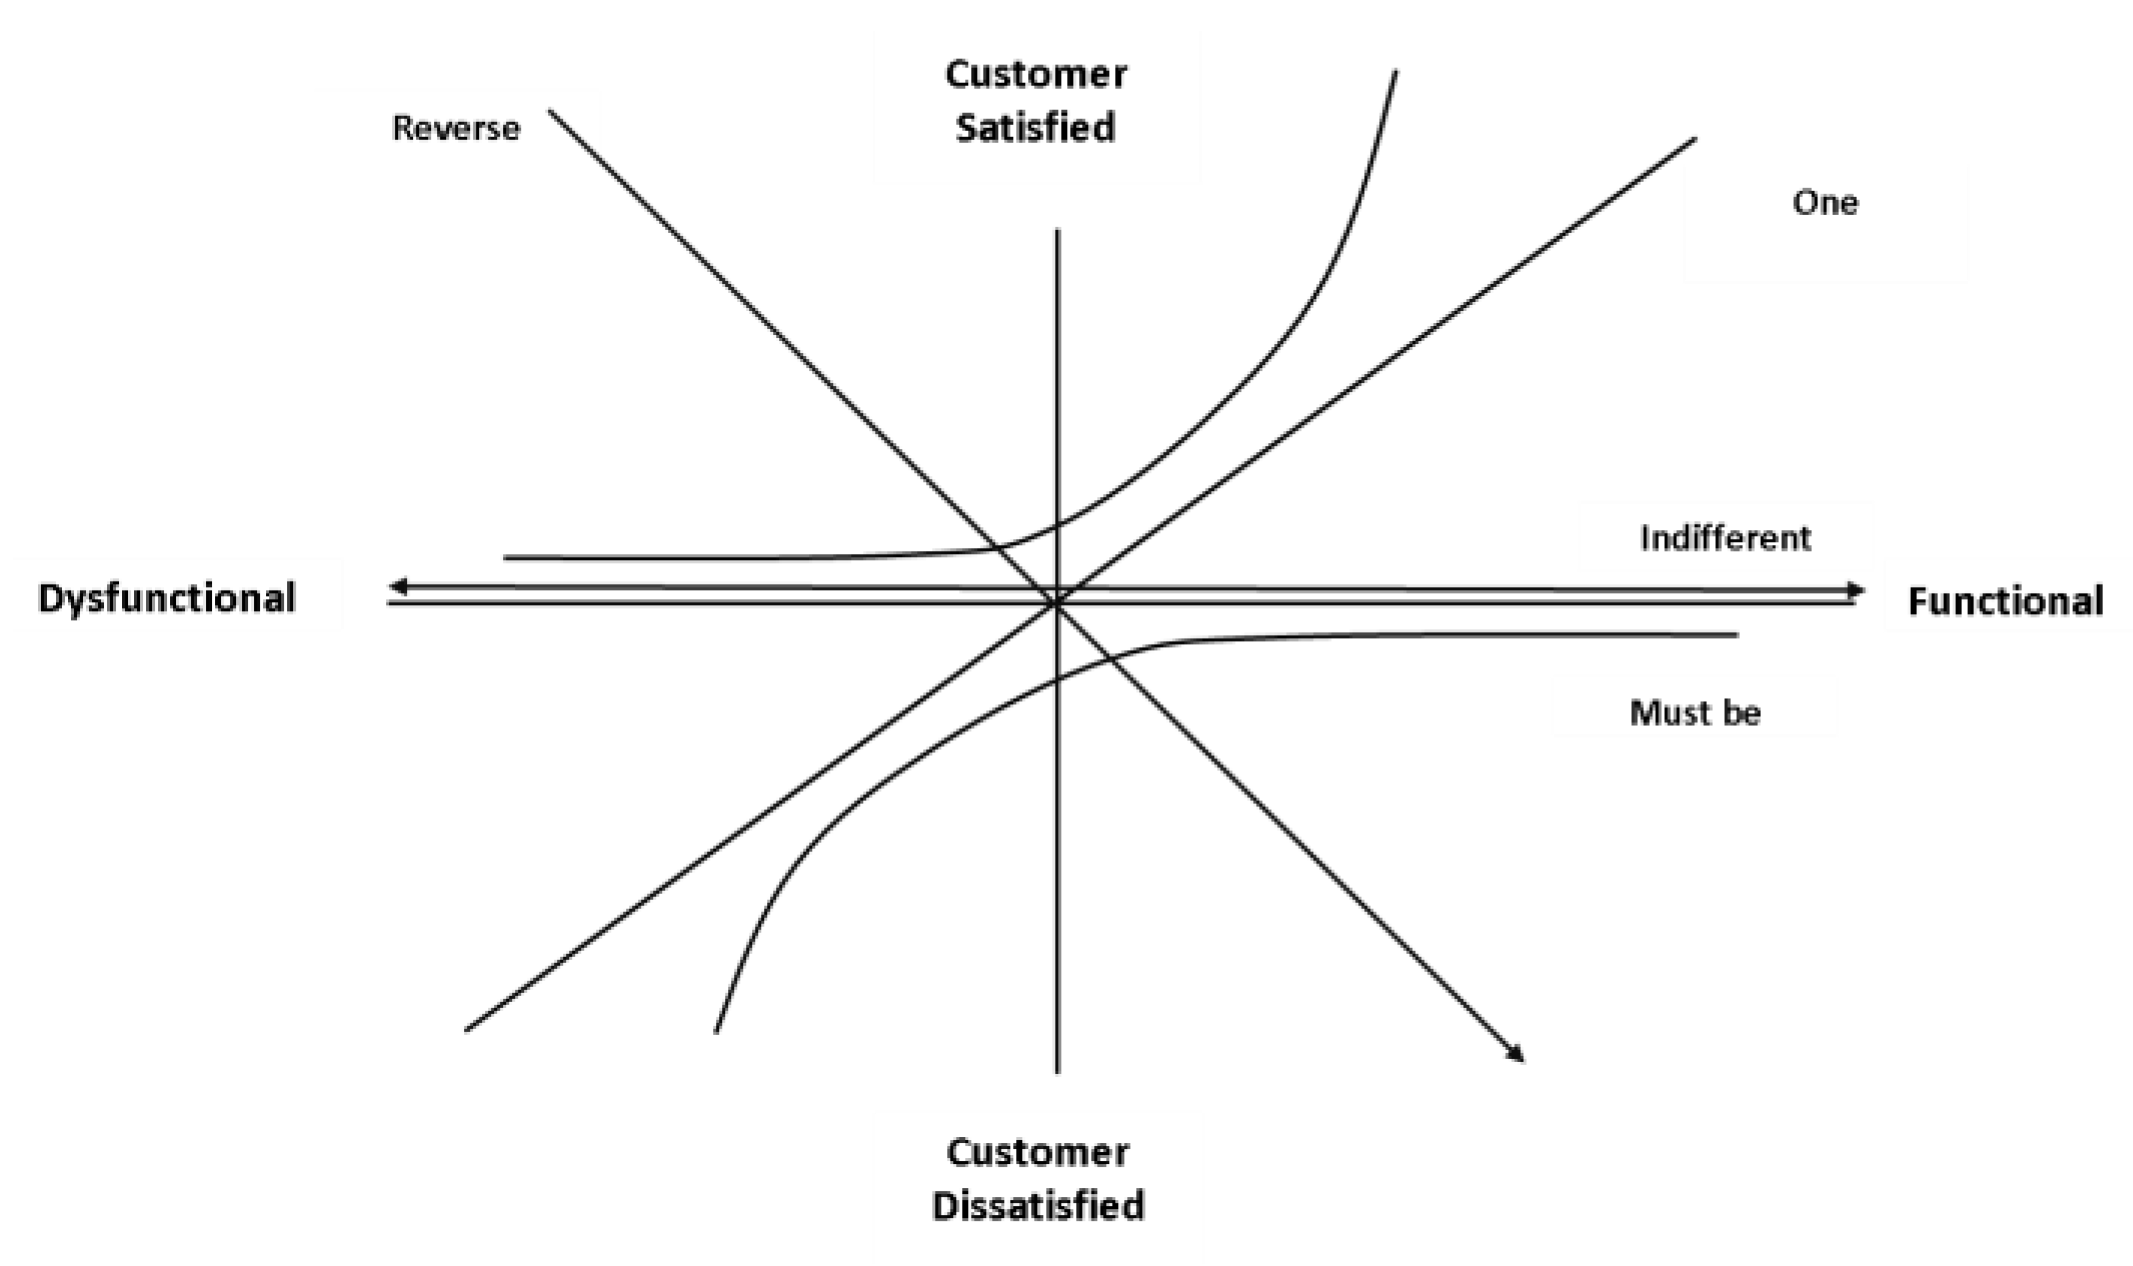
The approach used by Kano to address the non-linear relationship between the fulfillment of customer needs (
Figure 3) and overall customer satisfaction consists of three steps as follows: Kano questionnaire, Kano evaluation table, and Kano category result [
24].
• Kano questionnaire:
The Kano questionnaire contains a set of question pairs for each product attribute. The question set includes a functional (product or service having a particular feature) and a dysfunctional (product or service not having a particular feature) form, capturing customers’ responses in both scenarios of a particular feature. The questionnaire is deployed to several customers, and each answer pair is aligned with the Kano evaluation table, highlighting the individual customer’s perception of a product attribute. There are five possible responses for each question, whether it is in the functional or dysfunctional form [
24].
Kano evaluation table consists basically of a template where each pair of answers for the functional and dysfunctional question for certain customer need is allocated. The location of the customer response, in a particular cell of this template (
Table 2), allows the surveyor to place that customer need in one of the five requirement categories Kano has established [
24].
I like it this way
Must be this way
Indifferent
Live with it this way
I dislike it this way
• Kano category result:
This step consists of the allocation of each of the customer needs (product/service feature) in one of the categories of the Kano evaluation table, after obtaining the Kano questionnaire from the different customers. The allocation usually is made considering the most frequent pair of answers.
Indifference and reverse factors are quality attributes that have not much relevance to fulfill the improvement of overall satisfaction.
Nevertheless, the Kano diagram provides a rough understanding of the customer’s satisfaction, and it only allows a qualitative assessment of product attributes [
24]. To translate this qualitative understanding into a more convenient and objective way, quantitative measures are incorporated by assigning some scales in terms of customer satisfaction/dissatisfaction level [
24]. However, the resulting Kano category is still qualitative and cannot precisely reflect the extent to which customers are satisfied [
24]. Even if the Kano categories can enhance designers’ understanding of customer needs, they are short as concrete decision criteria. So, considering resource limitations, managers are called to understand the priorities of improving the performance of these quality attributes. The described Kano model is useful to place the customer needs in each one of these categories and has been proven to be very important for a better understanding the customer needs. Nevertheless, it still isn´t able to determine how much the partial or complete absence or fulfillment of a customer need impacts its overall satisfaction [
24].
To deal with this situation, Wu and Wang [
24] proposed a modified Kano model. Their model works, in general terms, the same as the original model, except for two aspects:
Inclusion of an influence table: The inclusion of this table is directly linked with the Kano evaluation table (
Table 3). The objective of this table is to determine the influence of each one of the Kano table cells on customer satisfaction. It is important to point out that though cells ((2.5—expect, dislike), (3.5—neutral, dislike), (4.5—live with, dislike)) are in the must-be category, their influence on customer satisfaction is different, considering that cell ((3.5—neutral, dislike)) is the pure state of a must-be feature. On the other hand, it can be said that cells ((2.5—expect, dislike) and (4.5—live with, dislike)) as not being the pure state of the must-be feature, their influence on their satisfaction will not be the same as the cell ((3.5—neutral, dislike)). This is the reason why though the three cells are in the same category, their influence is different.
The influence in customer satisfaction of the three pure pairs ((cell 3.5—must-be), (cell 1.5—one dimensional), and (cell 1.3—attractive)) is based on the proposal of Tan and Shen [
60] and Chen and Ko [
61]. Wu and Wang took those values and adapted them to each one of the Kano table cells. They introduced zeros in the table diagonal and positive values in the superior cells, depending on its influence on customer satisfaction, and the influence values of lower cells were calculated using Equation (1).
An important effect of this procedure is that it tacitly includes concepts of fuzzy logic, considering that each category is not rigid, and each cell has a certain degree of two different pure Kano categories. This is very relevant, considering the nature of human thinking and perception.
• Inclusion of a fuzzy scale for the five Kano responses.
Wu and Wang used a modified wording of the original five standard answers in the traditional Kano’s questionnaire, and hence wording seems odd to many respondents [
62,
63]. The wording makes the questions easier to understand [
24,
62]. The new wording is shown as follows:
I enjoy it that way instead of I like it this way.
I expect it that way instead of must be this way.
I am neutral instead of indifferent.
Dislike but can live with it instead of living this way.
Dislike and cannot accept it instead of I dislike it this way.
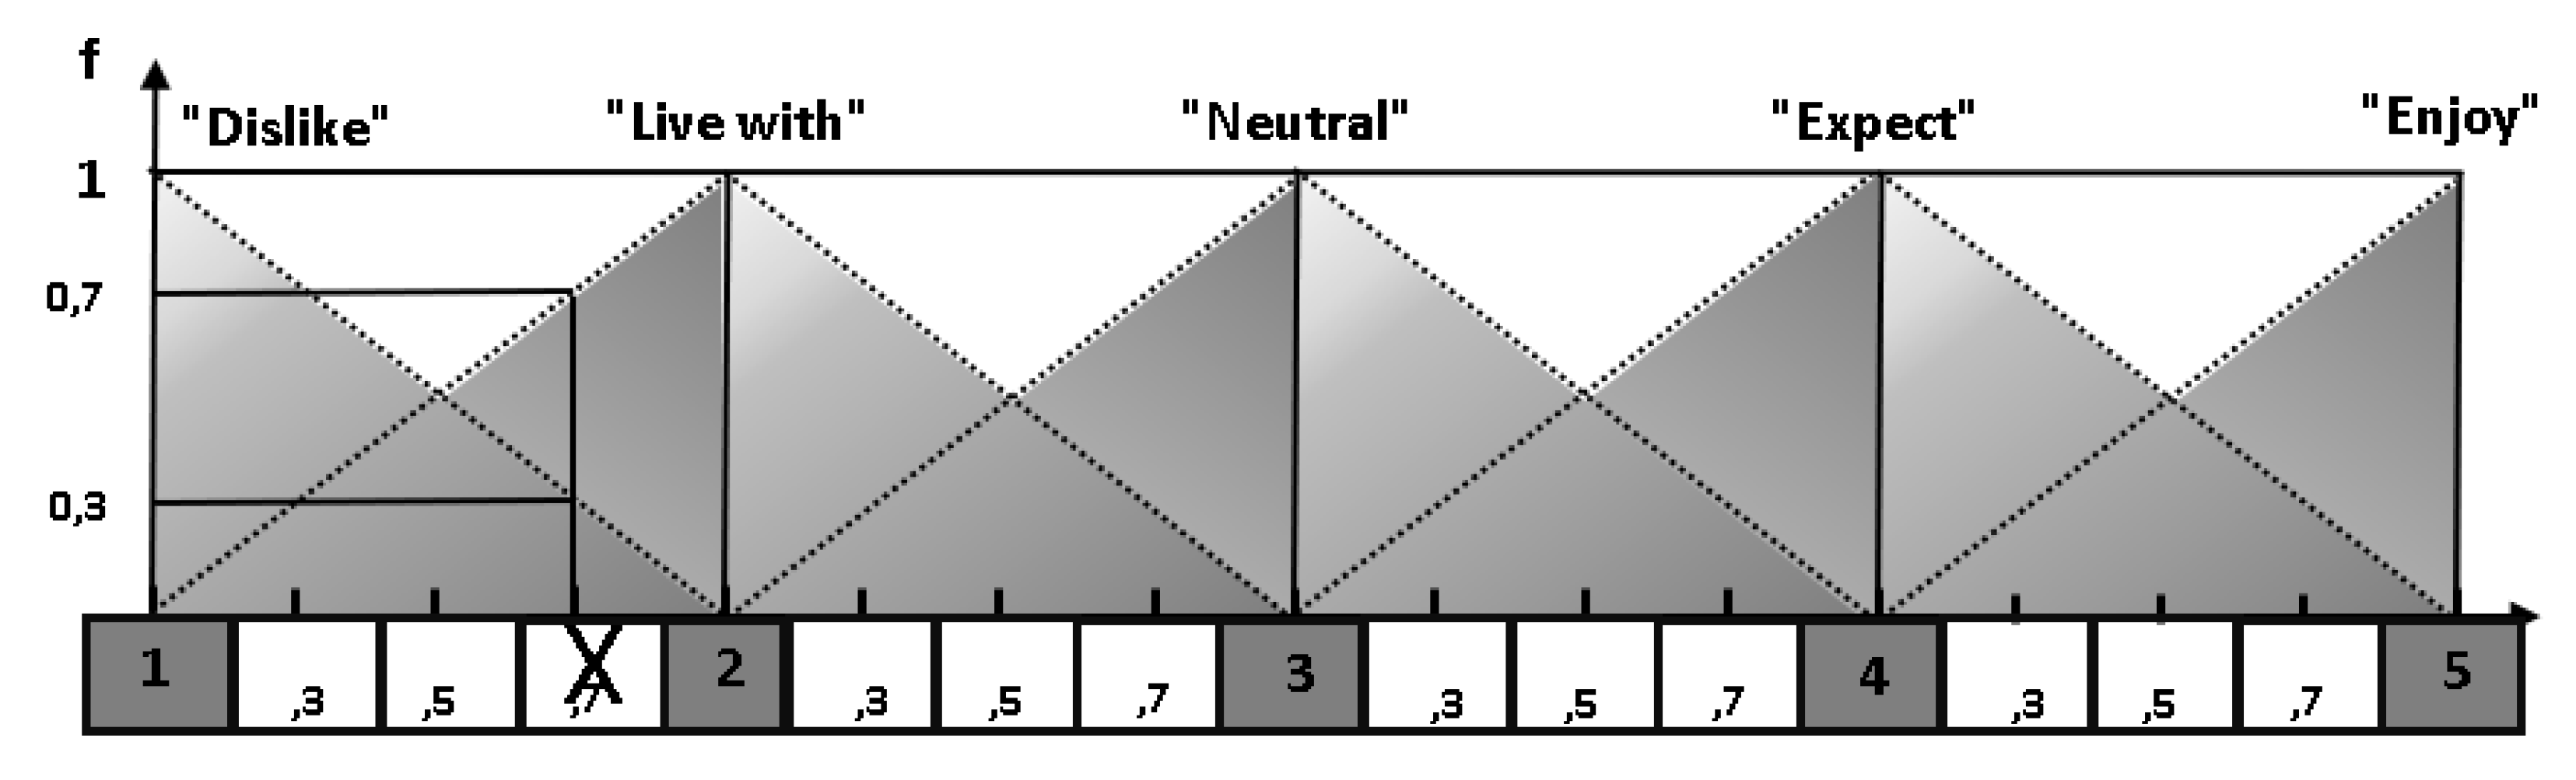
The respondent simply needs to choose one point to each question. For example, while one’s perception of a certain question is between ‘dislike’ and ‘live with’ and a small preference to ‘live with’, the respondent may choose the point ‘1.7’ as his/her answer (
Figure 4).
Wu and Wang [
24] used a triangular fuzzy function to determine the membership degree of respondents’ answers to each adjacent original Kano scale. The graphic presentations of the membership functions are shown in
Figure 5. The membership degrees of a respondent’s preference to the standard answers can be obtained through the membership functions. For instance, while a respondent chooses the point ‘1.7’ as his/her answer to a certain question, the membership degrees of his/her preference to ‘dislike’ and ‘live with’ are 0.3 and 0.7, respectively (
Figure 5).
3.2. Analytic Hierarchy Process
AHP assumes complete aggregation among criteria and develops a linear additive model. The weights and scores are achieved basically by pairwise comparisons between all options with each other [
64]. The basic procedure to carry out the AHP consists of the following steps:
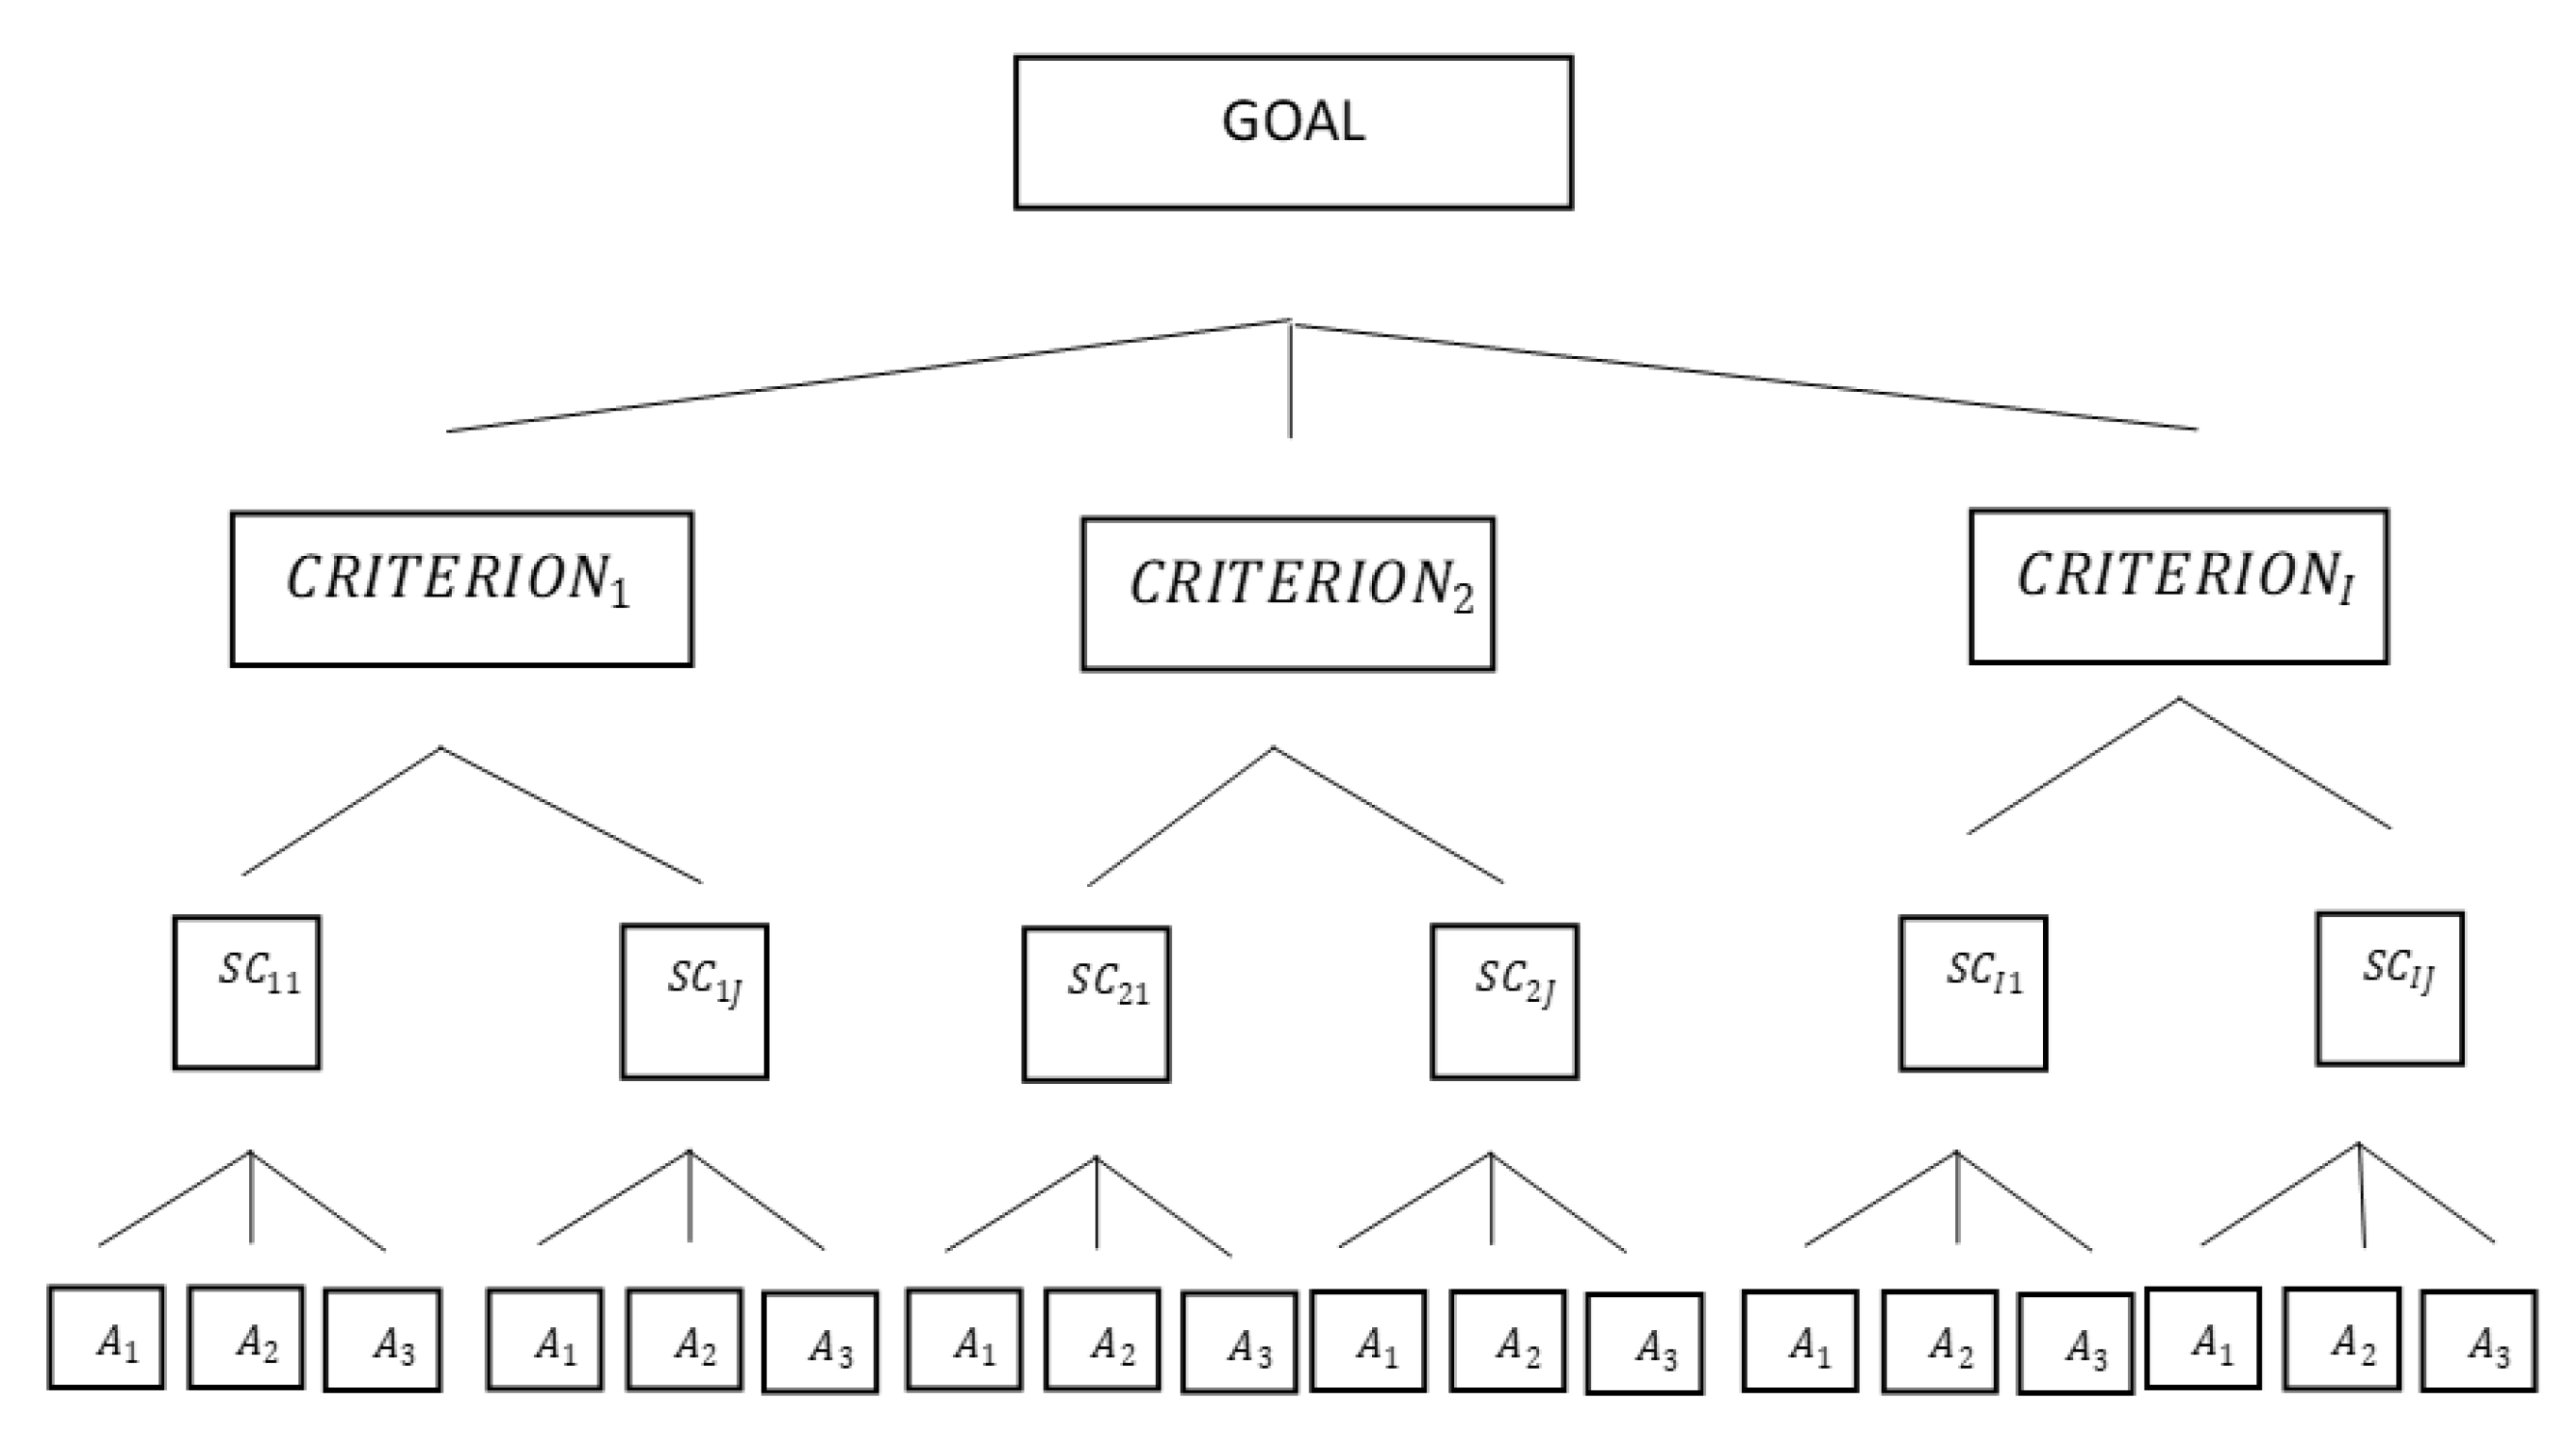
Structuring a decision problem and selection of criteria: The first step is to decompose a decision problem into its constituent parts. In its simplest form, this structure comprises a goal or focus at the topmost level, criteria (
), subcriteria (
) at the intermediate levels, while the lowest level contains the alternatives available for the decision-maker (
) (
Figure 6).
Arranging all the components in a hierarchy provides an overall view of the complex relationships and helps the decision-maker to assess whether the elements in each level are of the same magnitude so that they can be compared accurately [
64]. An element in a given level does not have to function as a criterion for all the elements in the level below. Each level may represent a different cut at the problem, so the hierarchy does not need to be completed [
64]. When constructing hierarchies, it is essential to consider the environment surrounding the problem and to identify the issues or attributes that contribute to the solution, as well as to identify all participants associated with the problem.
- 2.
Construct a set of pairwise comparison matrices for criteria, sub-criteria, and alternatives (Equation (2)).
- 3.
Perform computations to find the importance of each criterion and alternative (Equation (3)).
- 4.
Calculate the maximum eigenvalue, consistency index, Consistency Ratio (
CR), and normalized values for criteria and alternatives to ensure that the calculated weights derived from the pairwise comparison matrix are acceptable. Obtaining
CR implies the previous calculation of the maximum eigenvalue (
λmax) by applying Equation (4).
Additionally,
CV represents the consistency values for factors, and it is defined as:
CV =
, where
(i = 1, 2, …, n) (refer to Equation (5)). On the other hand, matrix
C (refer to Equation (6)) denotes an n-dimensional column vector, representing the total of the weighted values for the important intensity of criteria. Then,
CR (Consistency Ratio) (refer to Equation (7)) is computed using the
RI (Random Consistency Index, depending on the size of the problem) [
19]. If the
CR < 0.10, the matrix is considered consistent, and the derived weights are then reliable for supporting decision-making.
When AHP is applied in group decision-making processes, two different approaches are used, including the aggregation of individual judgments and the aggregation of individual priorities.
3.3. DEMATEL
The procedure of DEMATEL method can be described by the following four steps:
Calculate the sum of the rows (
) and the sum of the columns (
) of the total relation matrix
T. Suppose that
is the sum of the
i-th row in matrix
T, then
summarizes both direct and indirect effects given by factor
i to the other factors. If
denotes the sum of the
j-th column in matrix
T,
shows both direct and indirect effects by factor j from the other factors. When
j =
i, the sum (
+
) illustrates the total effects given and received by factor
i. Thus, (
+
) represents the importance degree of factor
i in the entire system. On the other hand, the difference (
−
) indicates the net effect that factor
i contributes to the system. Moreover, if (
−
is positive, factor
i is a net cause, while factor
i is a net receiver or result if (
−
) is negative [
65].
- 4.
Set up a threshold value to obtain the digraph: Since matrix
T provides information on how one factor affects another, a decision-maker must set up a threshold value to filter out some negligible effects. Only the effects greater than the threshold value are chosen and depicted in a digraph. The threshold value is usually set up by computing the average of the elements in Matrix
T. The digraph can be acquired by mapping the dataset described in step 3 [
65].
3.4. Quality Function Deployment
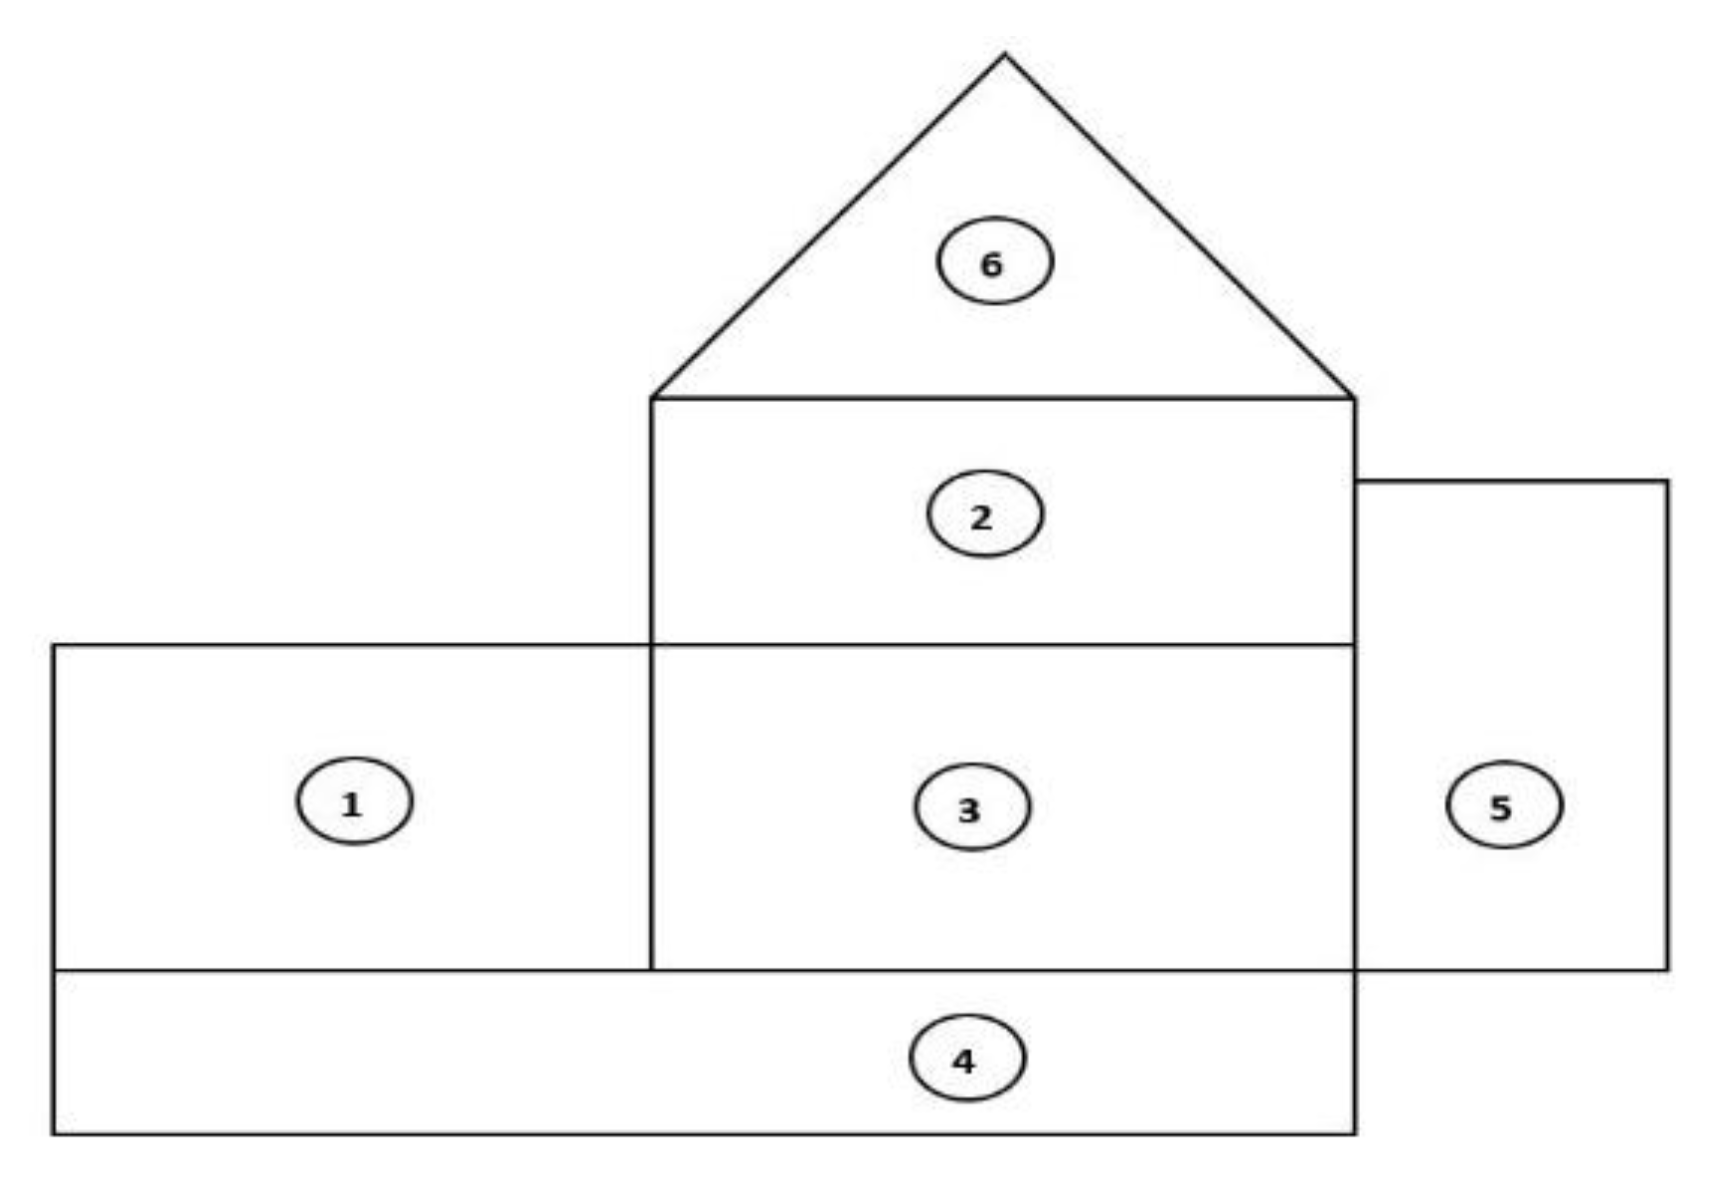
According to Moubachir and Bouami [
15], there are small differences in the representation of QFD, depending on the process being addressed, the scope of the analysis, and the criteria of the decision-maker, but QFD is usually divided into six regions as follows (
Figure 7).
The first region: Known as the “what region”, is the region where the costumers’ requirements are organized. It is divided into two columns. The customers’ requirements can be found in the first column, and the weight or importance that each requirement represents to the customer can be found in the second column. Each weight is denoted as
[
19].
The second region: Known as the “how” region, contains design factors. This region is divided into two lines. The design factors can be found in the first line, whereas the second line indicates the net correlation or influence of each design factor. The net influence of each factor can be denoted by
[
15].
The third region: Known as the “what vs. how” region. In this region, it is defined how much impact design factors have on customer needs. The scores in this region can go from 0 (no influence or relation) to nine (total influence relation). Each score is denoted by
[
15].
The fourth region: Known as the “how much” region. The net importance of each design factor can be found in this region. This net importance considers the influence between the different design factors, the weight of the customer needs, and the impact that the design factor has on customer needs. In this region, the target values and specifications tolerances can also be expressed. The net effect of each design factor in customer satisfaction can be obtained by
. The design factor’s priorities are obtained by organizing them in a descending trend of this calculation [
15].
The fifth region: The “benchmarking” region where the product or service delivered by the company is compared with products or services of competitors in terms of how much the own product or service can perform against the competitors regarding the customer needs [
15].
The sixth region: Known as the “how vs. how” region. In this region, the type of correlation between each two design factors (DF) is defined. It can be in terms of how strong is the relation or just indicating if it is positive, negative, or neutral, depending on which way of improvement we have fixed for each DF. In this last case, it would represent the impact of improving one specification on the other one [
15].
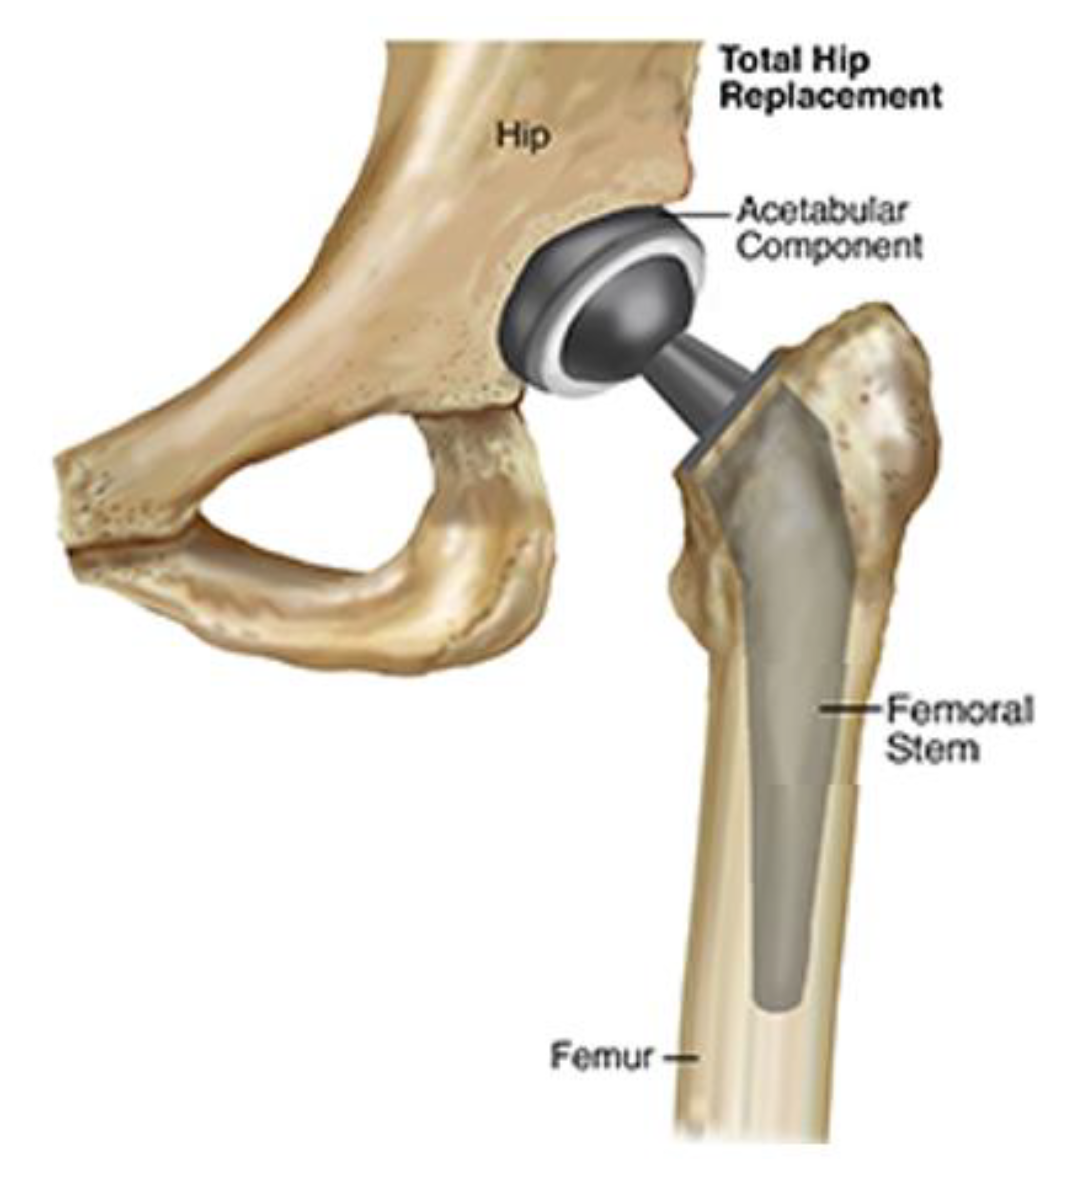
4. Case Study: A Hip Replacement Surgery Aid Device for Elderly People
The only available alternative for people with the hip joint condition is Total Hip Replacement (THR) (
Figure 1). THR consists of a surgical procedure that reconstructs the hip joint. In particular, the acetabulum is substituted by a cup fixed to the basin, while the femur head is removed and replaced by a spherical head and a stem fixed in the femur. In this case, the focus of the study was SAD, which allows the physician to properly position the hip implant. This includes alignment, suggestions related to the cutting points, the size of acetabular coupling, and other relevant information for the successful positioning of the hip implant.
In this process, physicians are considered as the final customers, considering that they have collected the fears and concerns of the patients and also are aware of the need to have a good product at a price it can be affordable for the majority of the people. The company produces installation aid kits that can be used with different prosthesis manufacturers.
The company wishes to improve the current installation aid kit, considering the feedback given by physicians and prosthesis manufacturers. The installation aid kit consists of a measuring and aligning device that is disposable and fixation elements for the measuring devices and femur head cut. These fixation elements are not disposable. The components of the installation kit were analyzed by a design team of the company, considering the feedback of the customers, letting the team define the following customer needs for the kit:
R-Reliability: It refers to the fact that the device should be in good condition at the moment of use. That means, it has enough batteries; it is complete, calibrated, and in good condition.
UF-User friendly (easy to use): This refers to the fact that the device should have less auxiliary pieces as possible, they are correctly marked, and has an error-proved design (only can be assembled correctly).
FI-Friendly interface (friendly user-software interface): Relates with the fact that the physician can interact easily with the application, in terms that can find the data fast, and the answer of the application is clear for the physician.
LI-Low invasion (less invasive possible): This refers to the fact that the installation should preferably not require a bigger surgical incision, or additional exposure of the bones or flesh, to reduce the risk of infections or trauma.
QI-Quick installation (place device into an operating area): This issue is related to the fact that the installation and use of the device require fewer operations and equipment as possible, so the device parts can be assembled and disassemble quickly and safely so that the physician can focus on the surgical procedure.
SS-Software stability: This refers to the fact that the software should make the calculations properly without mistakes and should have some warning alerts to prevent mistakes by the physician.
CI-Collateral issues (low bone wearing): The installation of the device should not weaken the areas where it will be installed. This means no excess drilling (number of holes and size of holes). In case screws are used to fix the tool to the bone, screws should measure ten millimeters or less.
A-Accuracy (quality of measures): This refers to the fact that the software should provide the proper measure related to the length and offset so that the physician can use the data to make decisions related to the head and neck to be used.
C-Communication: Communication between sensors and devices should be stable. This means the communication between the iPad and the device must be stable, and, in case there is a sudden interruption, data should be recovered by the system without affecting the related results. This communication must not be affected by cellular electromagnetism of the devices in the area, mobile phones, or any other electronic device in the operating room.
TD-Trustable data: This relates to the fact that the information shown on the iPad depends on the data sent by the device. In case there is a bad device functioning, it should be possible that the systems detect the problem and gives an alert. The results must have a 5 mm tolerance both for offset and length.
SU-Software upgrade: This relates to the fact that if there are newly available sizes of the head, neck, and cup, these measures can be easily integrated into the software.
OU-Operating system: In the case of actualization of the iPhone operating system (IOS), this actualization does not affect software performance.
OS-Open system: This relates to the fact that the system could operate with different operational systems, for example, Android.
DM-Data management: This relates to the fact that the system could save some data to have statistics that can be useful to perform future analysis, or that the device has an interface with the hospital software to transfer the data.
Once the main customer requirements were defined and debugged, the design team identified some factors, aiming to fulfill customer needs. It is important to point out that considering that the product already exists, the company’s actions are mostly focused on the aspects that they have detected some problems (defective products). The design factors were defined as follows:
BT-Battery type: At the moment, the battery is expected to have at least 3 h of charge. At the same time, this charge level is guaranteed for 2 years. This allows the company and customer to use the device after two years of its production. This is important because the company is a supplier of the prosthesis companies, so the device may be stocked in the company, the prosthesis company—in some cases—a dealer, and the hospital. The defined action is to change the type of battery to reduce the number of cases in which the physician finds out that the device is discharged, and to improve the warehouse life of the device due to long supply change.
MP-Microprocessor: The company could use a different microprocessor to improve the performance of the device (speed, energy consumption, among others), considering that the current microprocessor is overdesigned.
SA-Software accuracy: The company could modify some software features to increase the accuracy of the system and software and to ease calibration.
SA-Standards accomplishments: The company cannot enter the market without having particular ISO certification, for medical device software, the biocompatibility of the components, among others.
BT-Bluetooth technology: Modifying the Bluetooth technology may help with the interaction of Android technology.
DB-Database: Inclusion of a module in the software (data collection and a data manager module) to store some information about the surgery, such as gender, age, used cup, stem and head, and other aspects, that the physician may consider useful in the future.
3I- Triple integration: The company could integrate the accelerometer, the gyroscope, and the microprocessor in one device to reduce the probability of failure due to welding.
BT-Bluetooth technology: The company can modify the software to make the device suitable to other Bluetooth technology, not only apple devices.
C-Consistency: The company could modify some software features to guarantee that data sent and shown on the iPad are trustable.
IF- Installation features: The company could modify the device fixation system to the body to improve the firmness of it.
5. Implementation of the Proposed Approach
The proposed approach is described in
Figure 2. The process described from now on is the application of the approach to the situation described in which the company wants to improve the performance of the produced SAD.
The outcomes of step1 and step2 of the proposed approach are shown in
Section 4 (design features and customer needs).
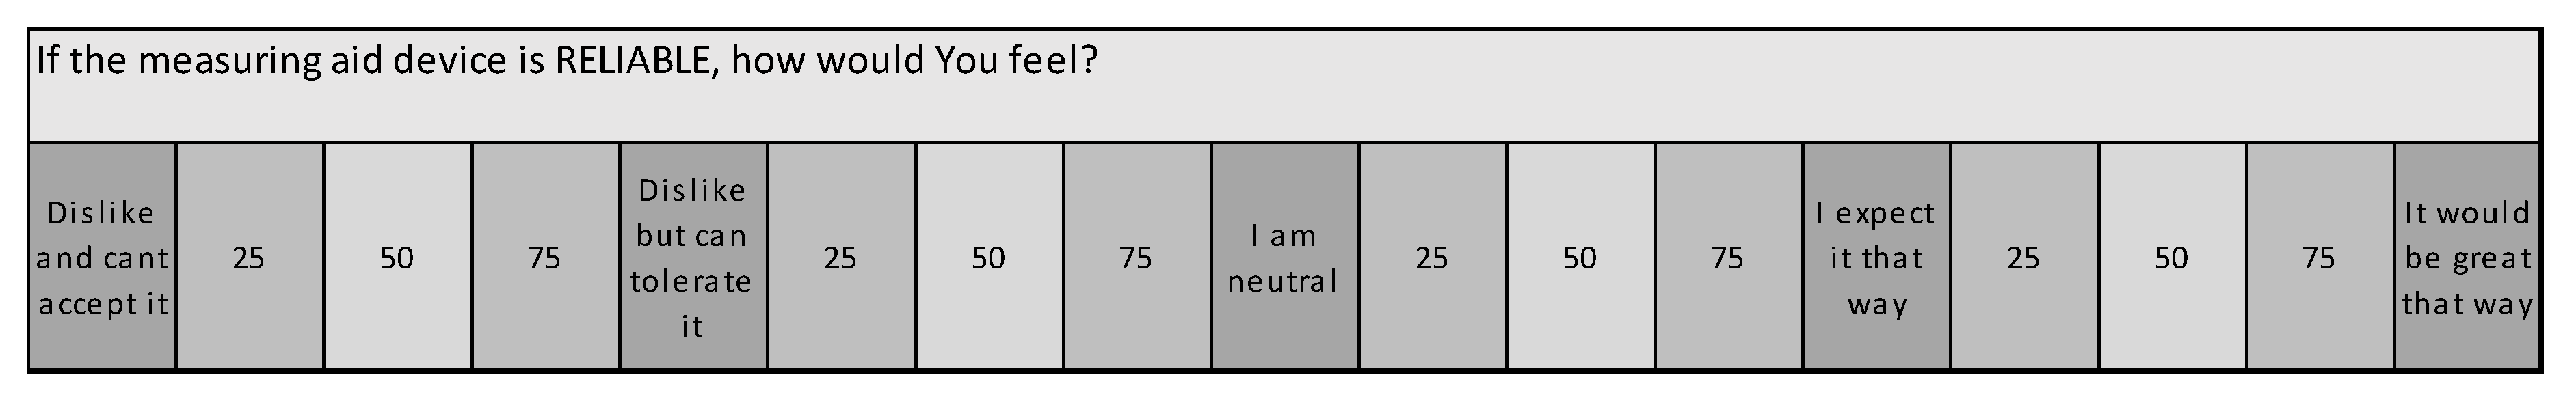
The third step to improve the product and maximize customer satisfaction was the implementation of the Kano survey (
Figure 8). This survey aimed to determine the impact that each need would have on customer satisfaction.
In the case of the question in
Figure 8, the answers obtained for the functional and dysfunctional questions are shown in
Table 4.
The membership degree (
) of preference to combination
(i, j) of the table shown in
Table 2 was determined by the following formula [
24]:
where the subscript n represents respondent n;
and
(
i,
j = 1, 2, 3, 4, 5) are the membership degrees to the
ith standard answers to the functional questions and the
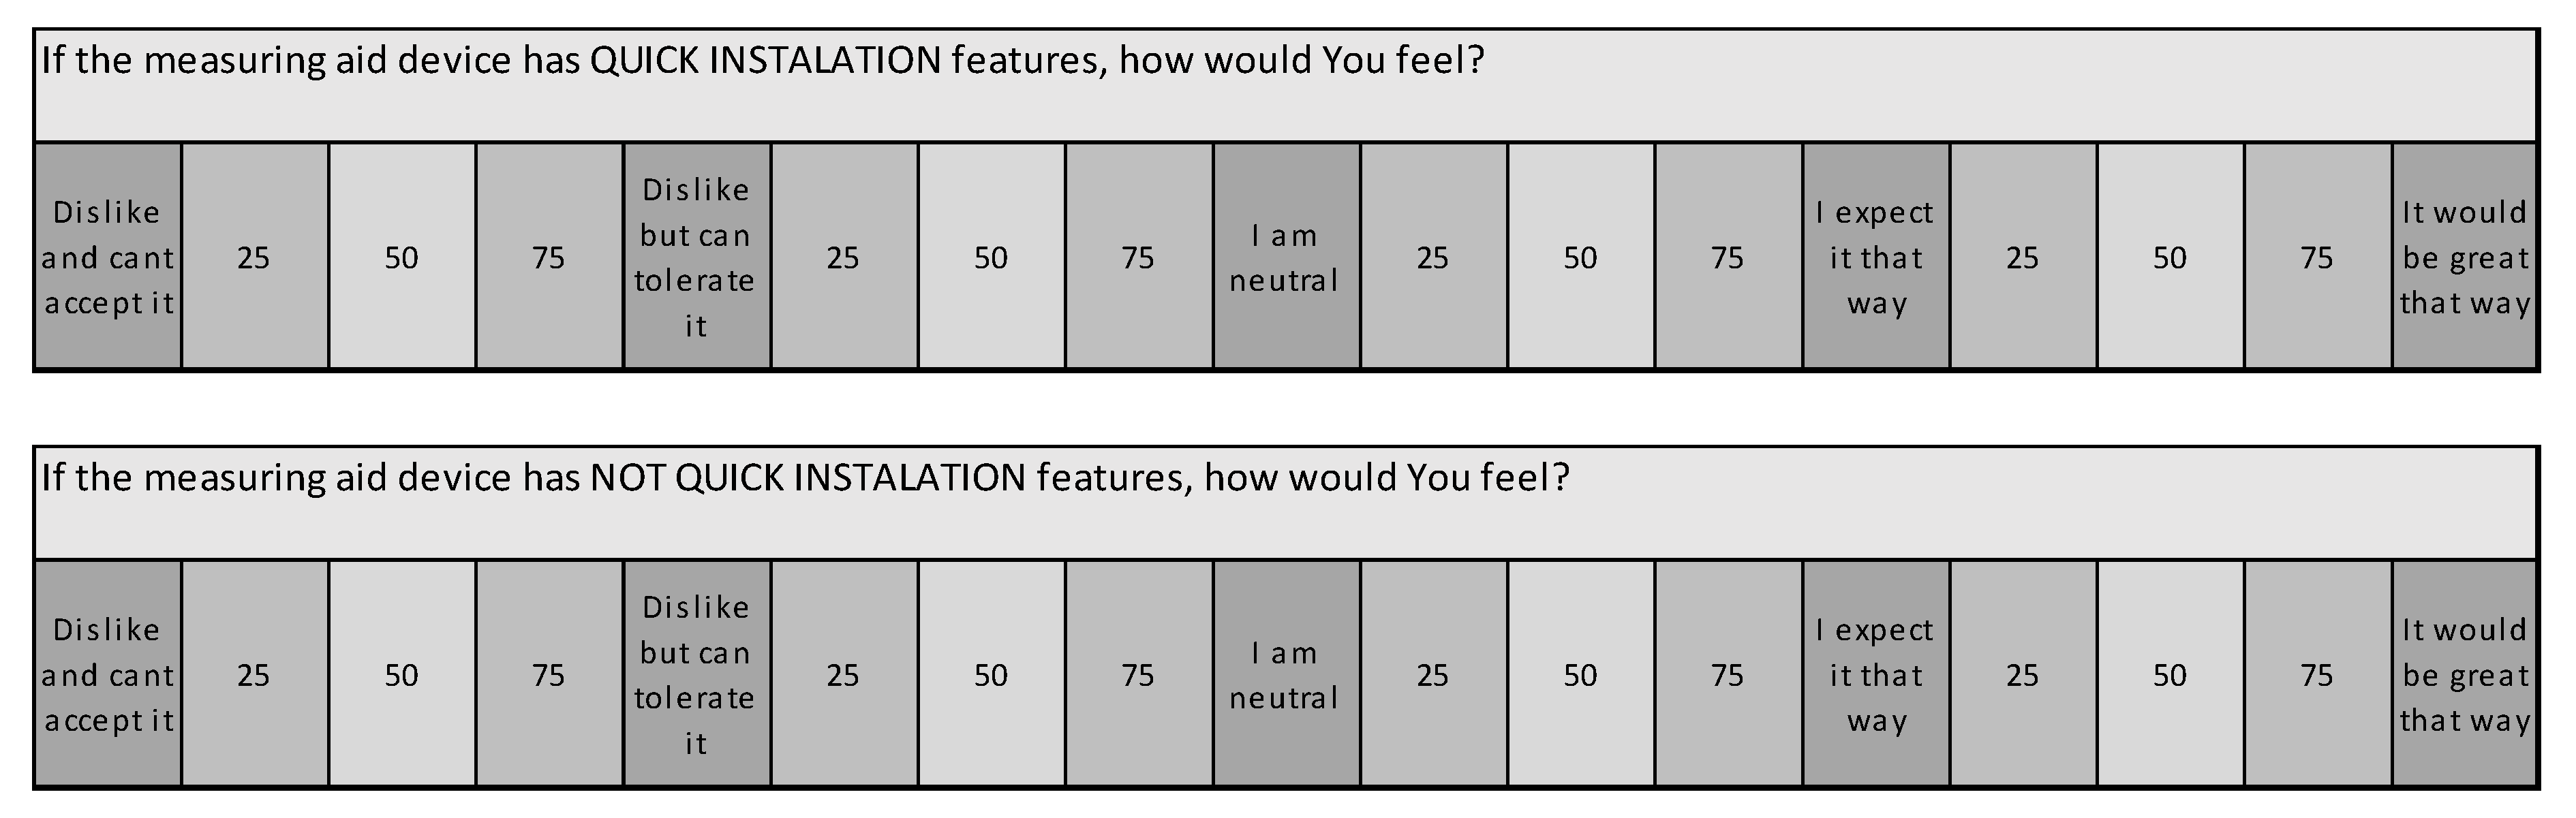
jth standard answers to dysfunctional questions, respectively. In the case of the functional and dysfunctional questions of
Figure 9, the values of
and
are presented in
Table 5.
With the values of
m(
) and
m(
) shown in
Table 5, the calculation of the values of
could be easily done (
Table 4). Then,
Table 5 was compared with the Kano evaluation table (refer to
Table 2), concluding that the customer needs (quick installation) were 25% must-be and 75% indifferent. Now the effect of this customer need in customer satisfaction was calculated using the values on the Kano influence table (
Table 3) with the following equation:
where
S represents the satisfaction level with a particular customer need, and
represents the corresponding value of the Kano influence table.
In the case of question in
Figure 9,
S = (1.8 × 0.25 + 0.15 × 0.75) = 0.5625. So, this customer need could be classified as indifferent, and its impact on global satisfaction was 0.5625. The classification of each customer need was made according to the Kano scale, and its impact on customer satisfaction could be observed in
Table 6. The survey was implemented to orthopedic physicians working in a partner hospital.
Step 4 consists of the determination of the importance (weight) of each customer requirement. To accomplish this task, AHP was used. In this case, the survey was again implemented to a group of orthopedic physicians working in a partner hospital.
The implemented survey could be observed in
Figure 10. Once it was implemented, the weight obtained for each customer need could be observed in
Table 7.
In this case, the consistency index (0.071) was found to be less than 0.1; the obtained weights could be, therefore, considered trustable to do further analysis. Once the AHP was finished, the data from steps 3 and 4 were consolidated, as shown in
Table 6.
The product of
and
represented the net effect of customer need in overall customer satisfaction. Once the survey was made, it was possible to calculate the total relation matrix (
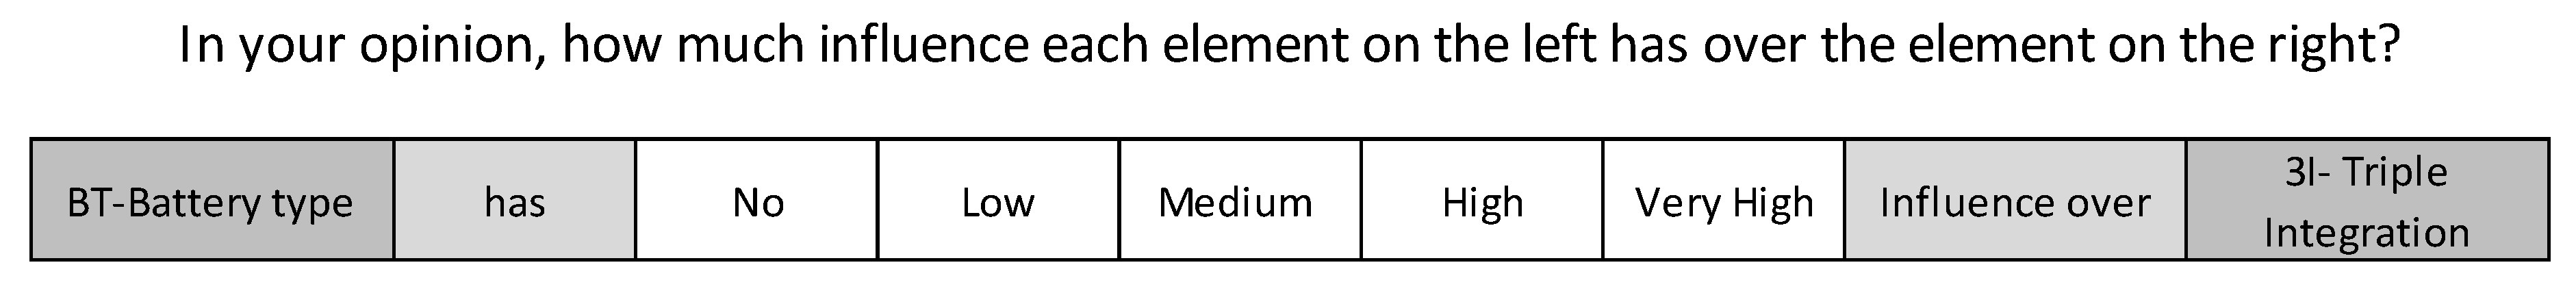
Table 8). Step 5 of the approach would help to obtain the other parameter required to construct the QFD matrix. This missing parameter is the relation between the different design actions (characteristics). In this case, this relationship would be calculated with the implementation of a DEMATEL survey. This survey was applied to design area personnel. An example of the questions used in the survey is shown in
Figure 11:
Once the survey was made, it was possible to calculate the total relation matrix (
Table 8):
The value of D + R was the one to be used in QFD in sector 2 of the matrix.
The next step (Step 6) was the allocation of the parameters obtained with fuzzy Kano, AHP, and DEMATEL in the QFD matrix. In Step 7, a QFD survey was implemented to determine how much each design action was related to each customer’s needs. This survey was made to the people of the design area.
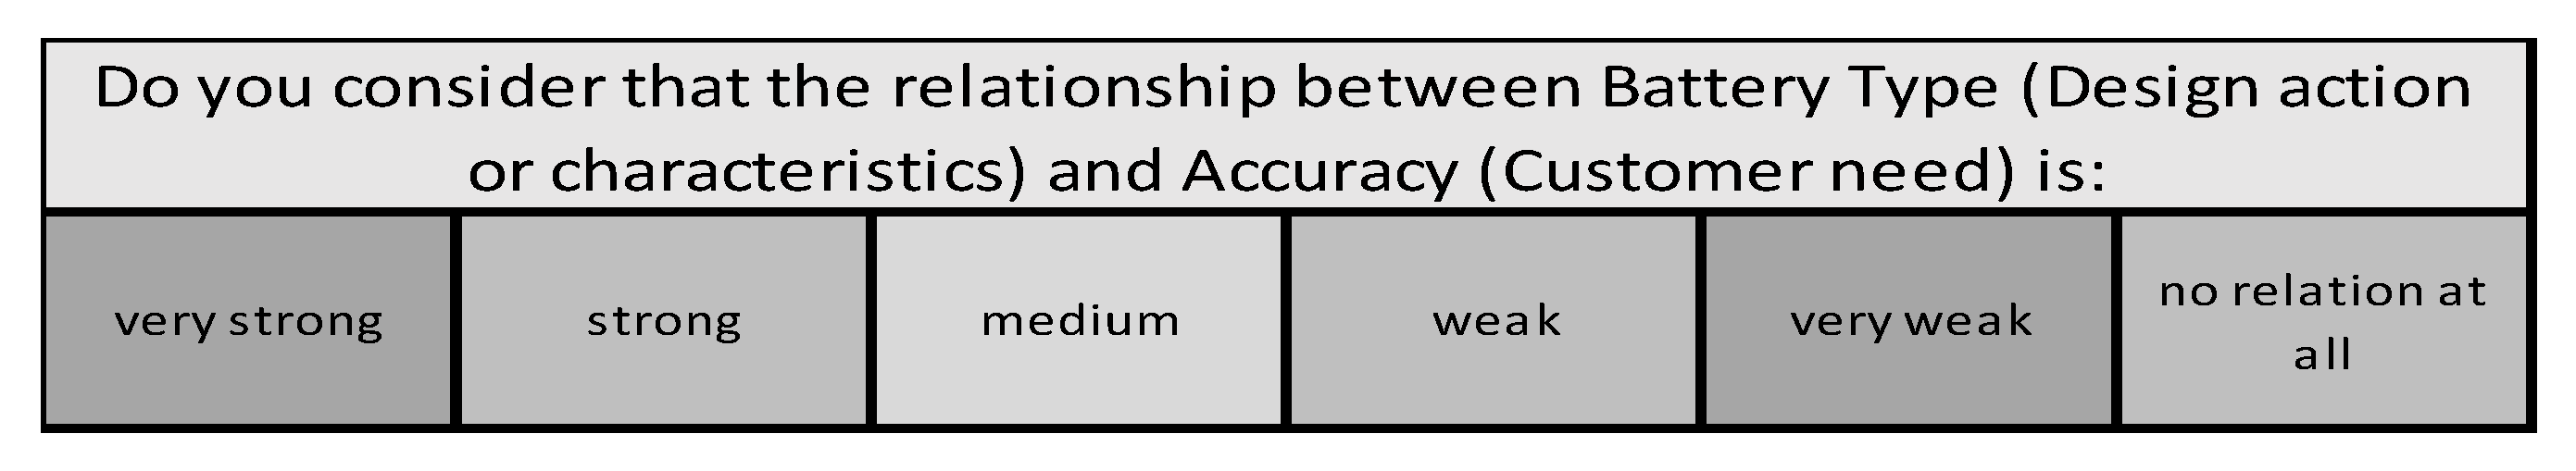
In
Figure 12, an example of the used question is shown.
The conversion from the linguistic scale to a numerical scale is: Very strong (9), Strong (7), Medium (5), Weak (3), Very Weak (1), No Relation at All (0). The values corresponding to each answer were located in the corresponding cell of the QFD matrix.
Steps 8 and 9 of the QFD matrix could be observed in
Table 9. The values
and
were included in the matrix, as well as
. The values
and
indicated the importance given by the customer to each need and the impact on the satisfaction of each customer need, respectively. The value
showed the total relation of each design action with the other design actions, both as deliverer and receiver. The impact of the satisfaction of each design action (ISDA) on customer satisfaction as calculated as follows:
where
rij indicates the relation between each design action and each customer need. The value
allowed the company to rank the design actions according to its influence on customer satisfaction. The ranked design actions could be seen in
Table 10.
6. Discussion
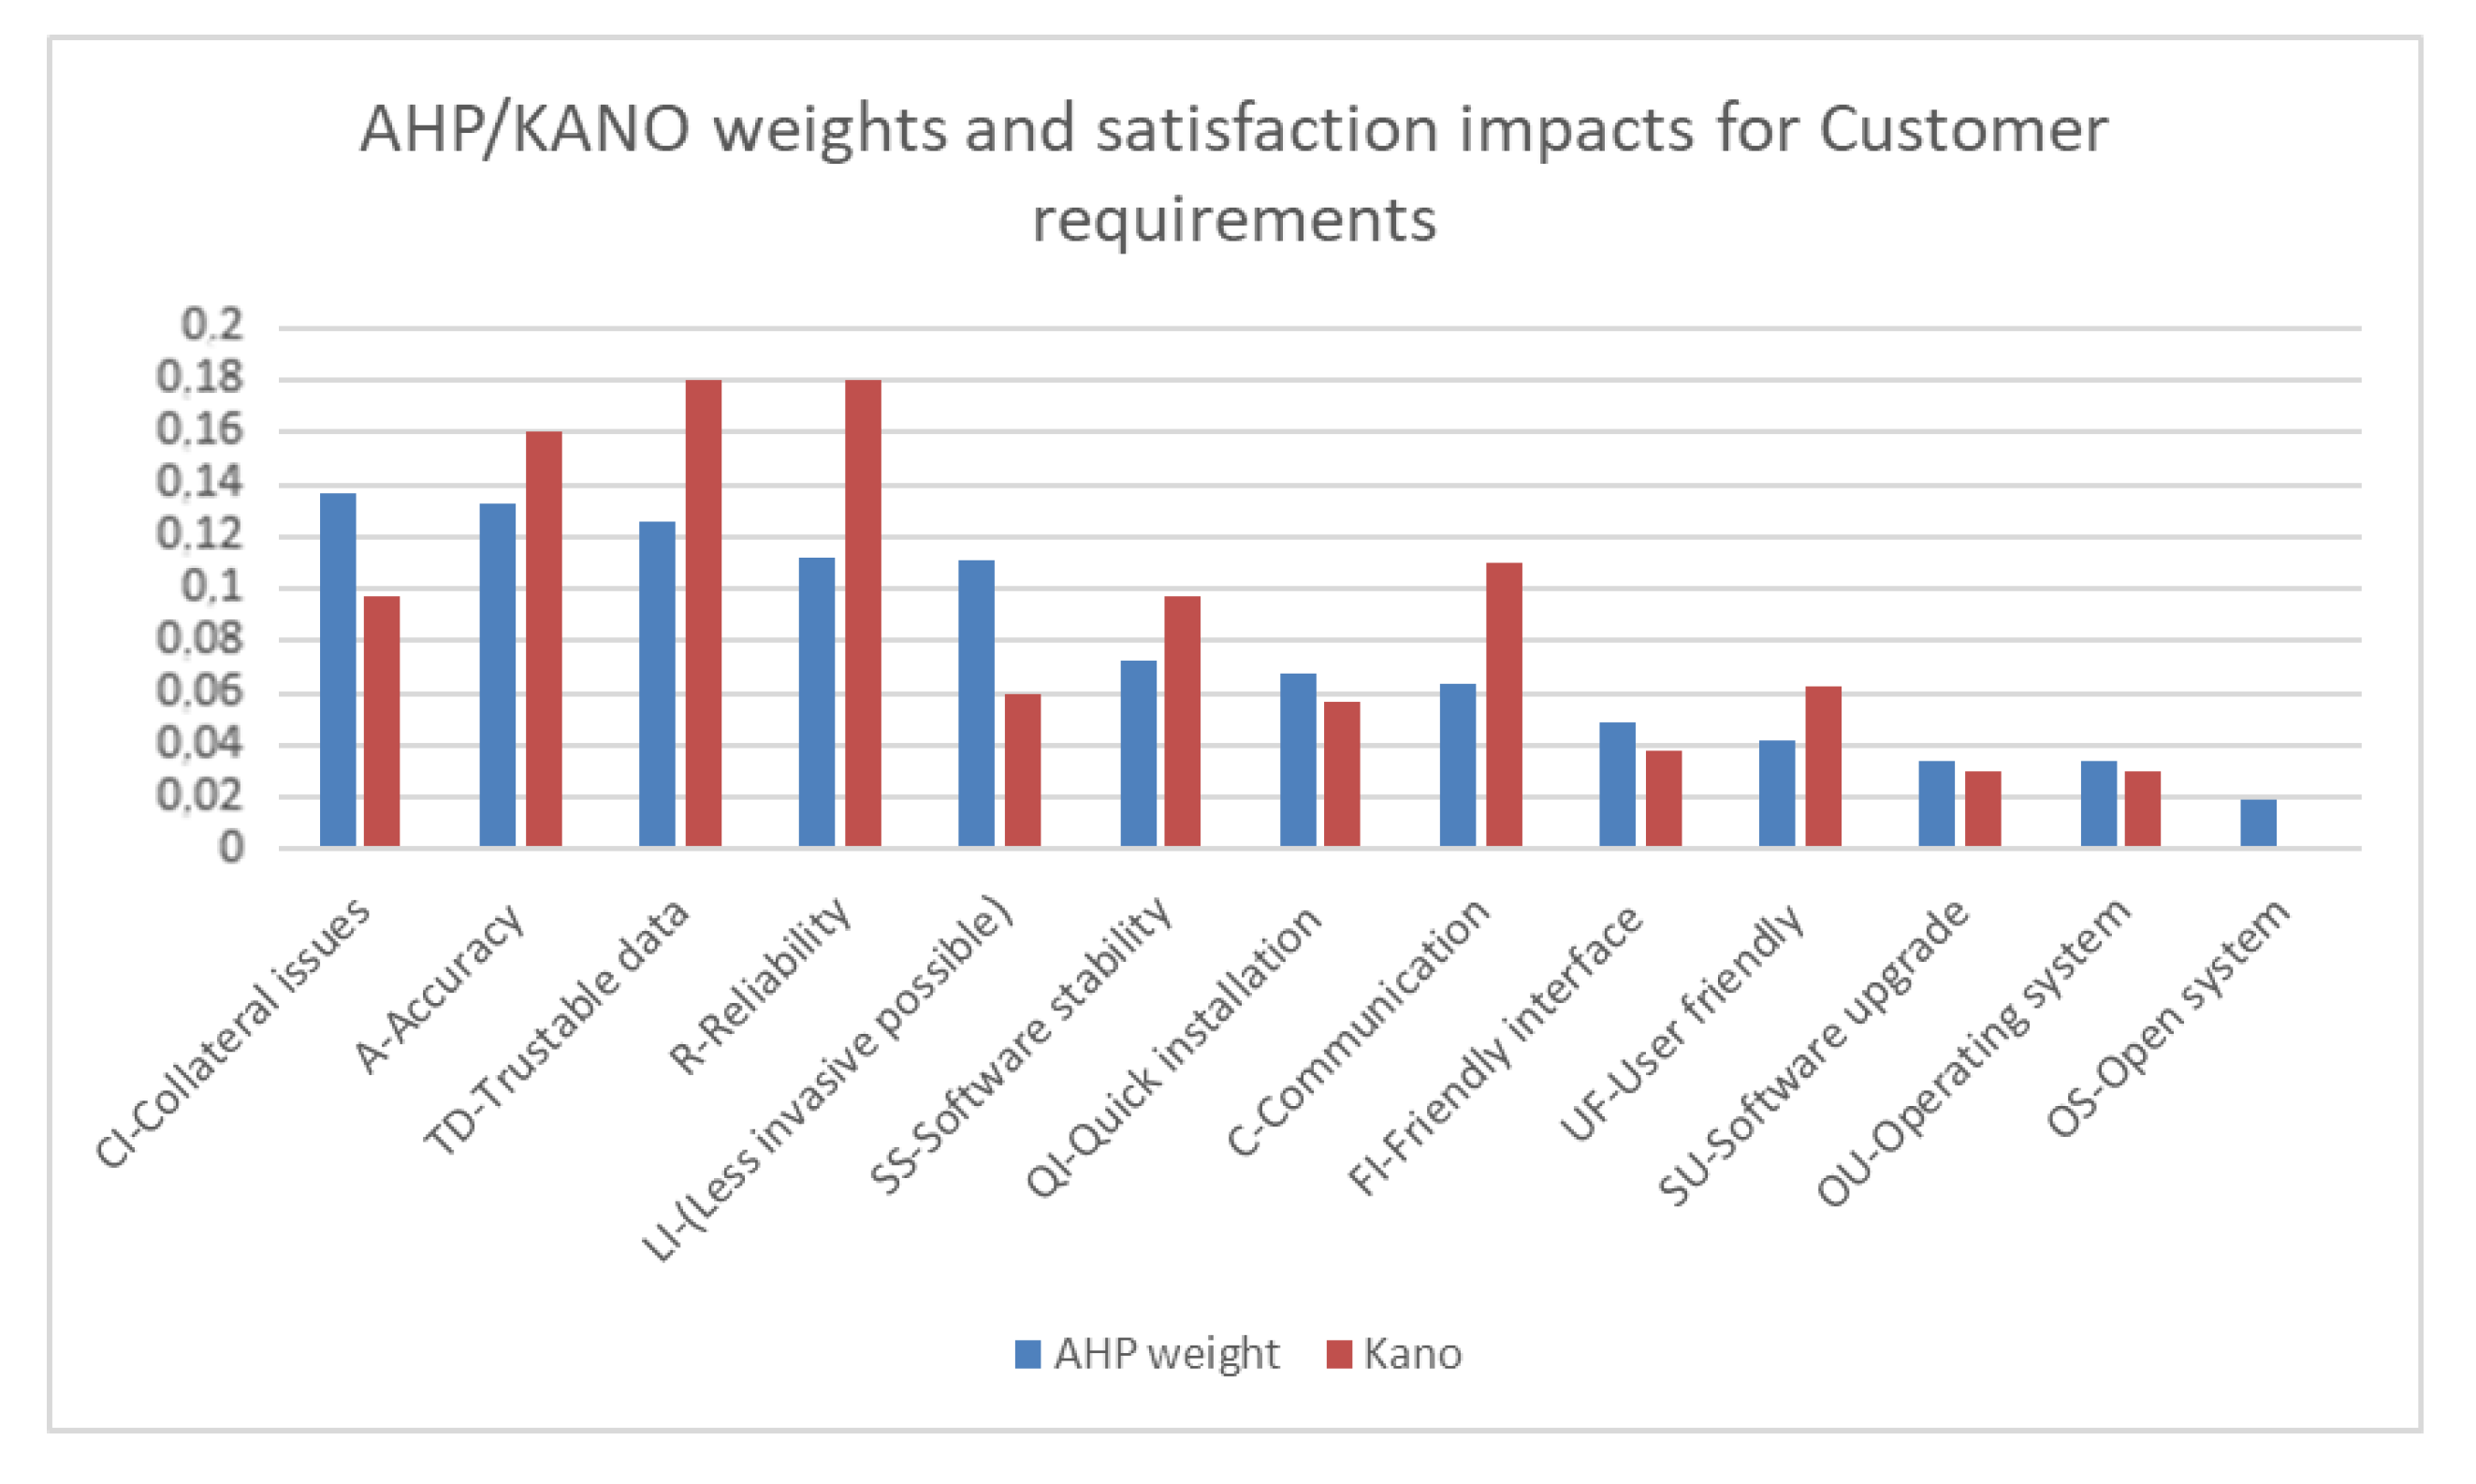
Initially, the strength of the proposed approach could be evidenced when a better understanding of customer needs and expectations is required. To reach this goal, the proposed approach used the integration of AHP and a fuzzy Kano model. The results derived from this hybrid method could be seen in
Figure 13.
From this picture, it could be concluded that the results obtained with AHP and Kano were not the same. In this sense, AHP required the customer to perform pairwise comparisons, whereas Kano let the customer free to voice his preference without any restriction. Both scenarios were necessary to understand customer thinking and desires, considering that this adequate understanding would affect how the design actions/characteristics are going to be prioritized. In
Figure 13, it could be observed that in AHP and Kano, the preferences were similar but not equal, and the differences were more evident on the importance given to the following customer needs: reliability, less invasive, collateral issues, and communication. Additionally, for AHP, the most important customer needs were collateral issues and accuracy. On the other hand, Kano ranked trustable data and reliability as the most important customer needs. These results evidenced how customer preferences might vary depending on the scenario they are placed in.
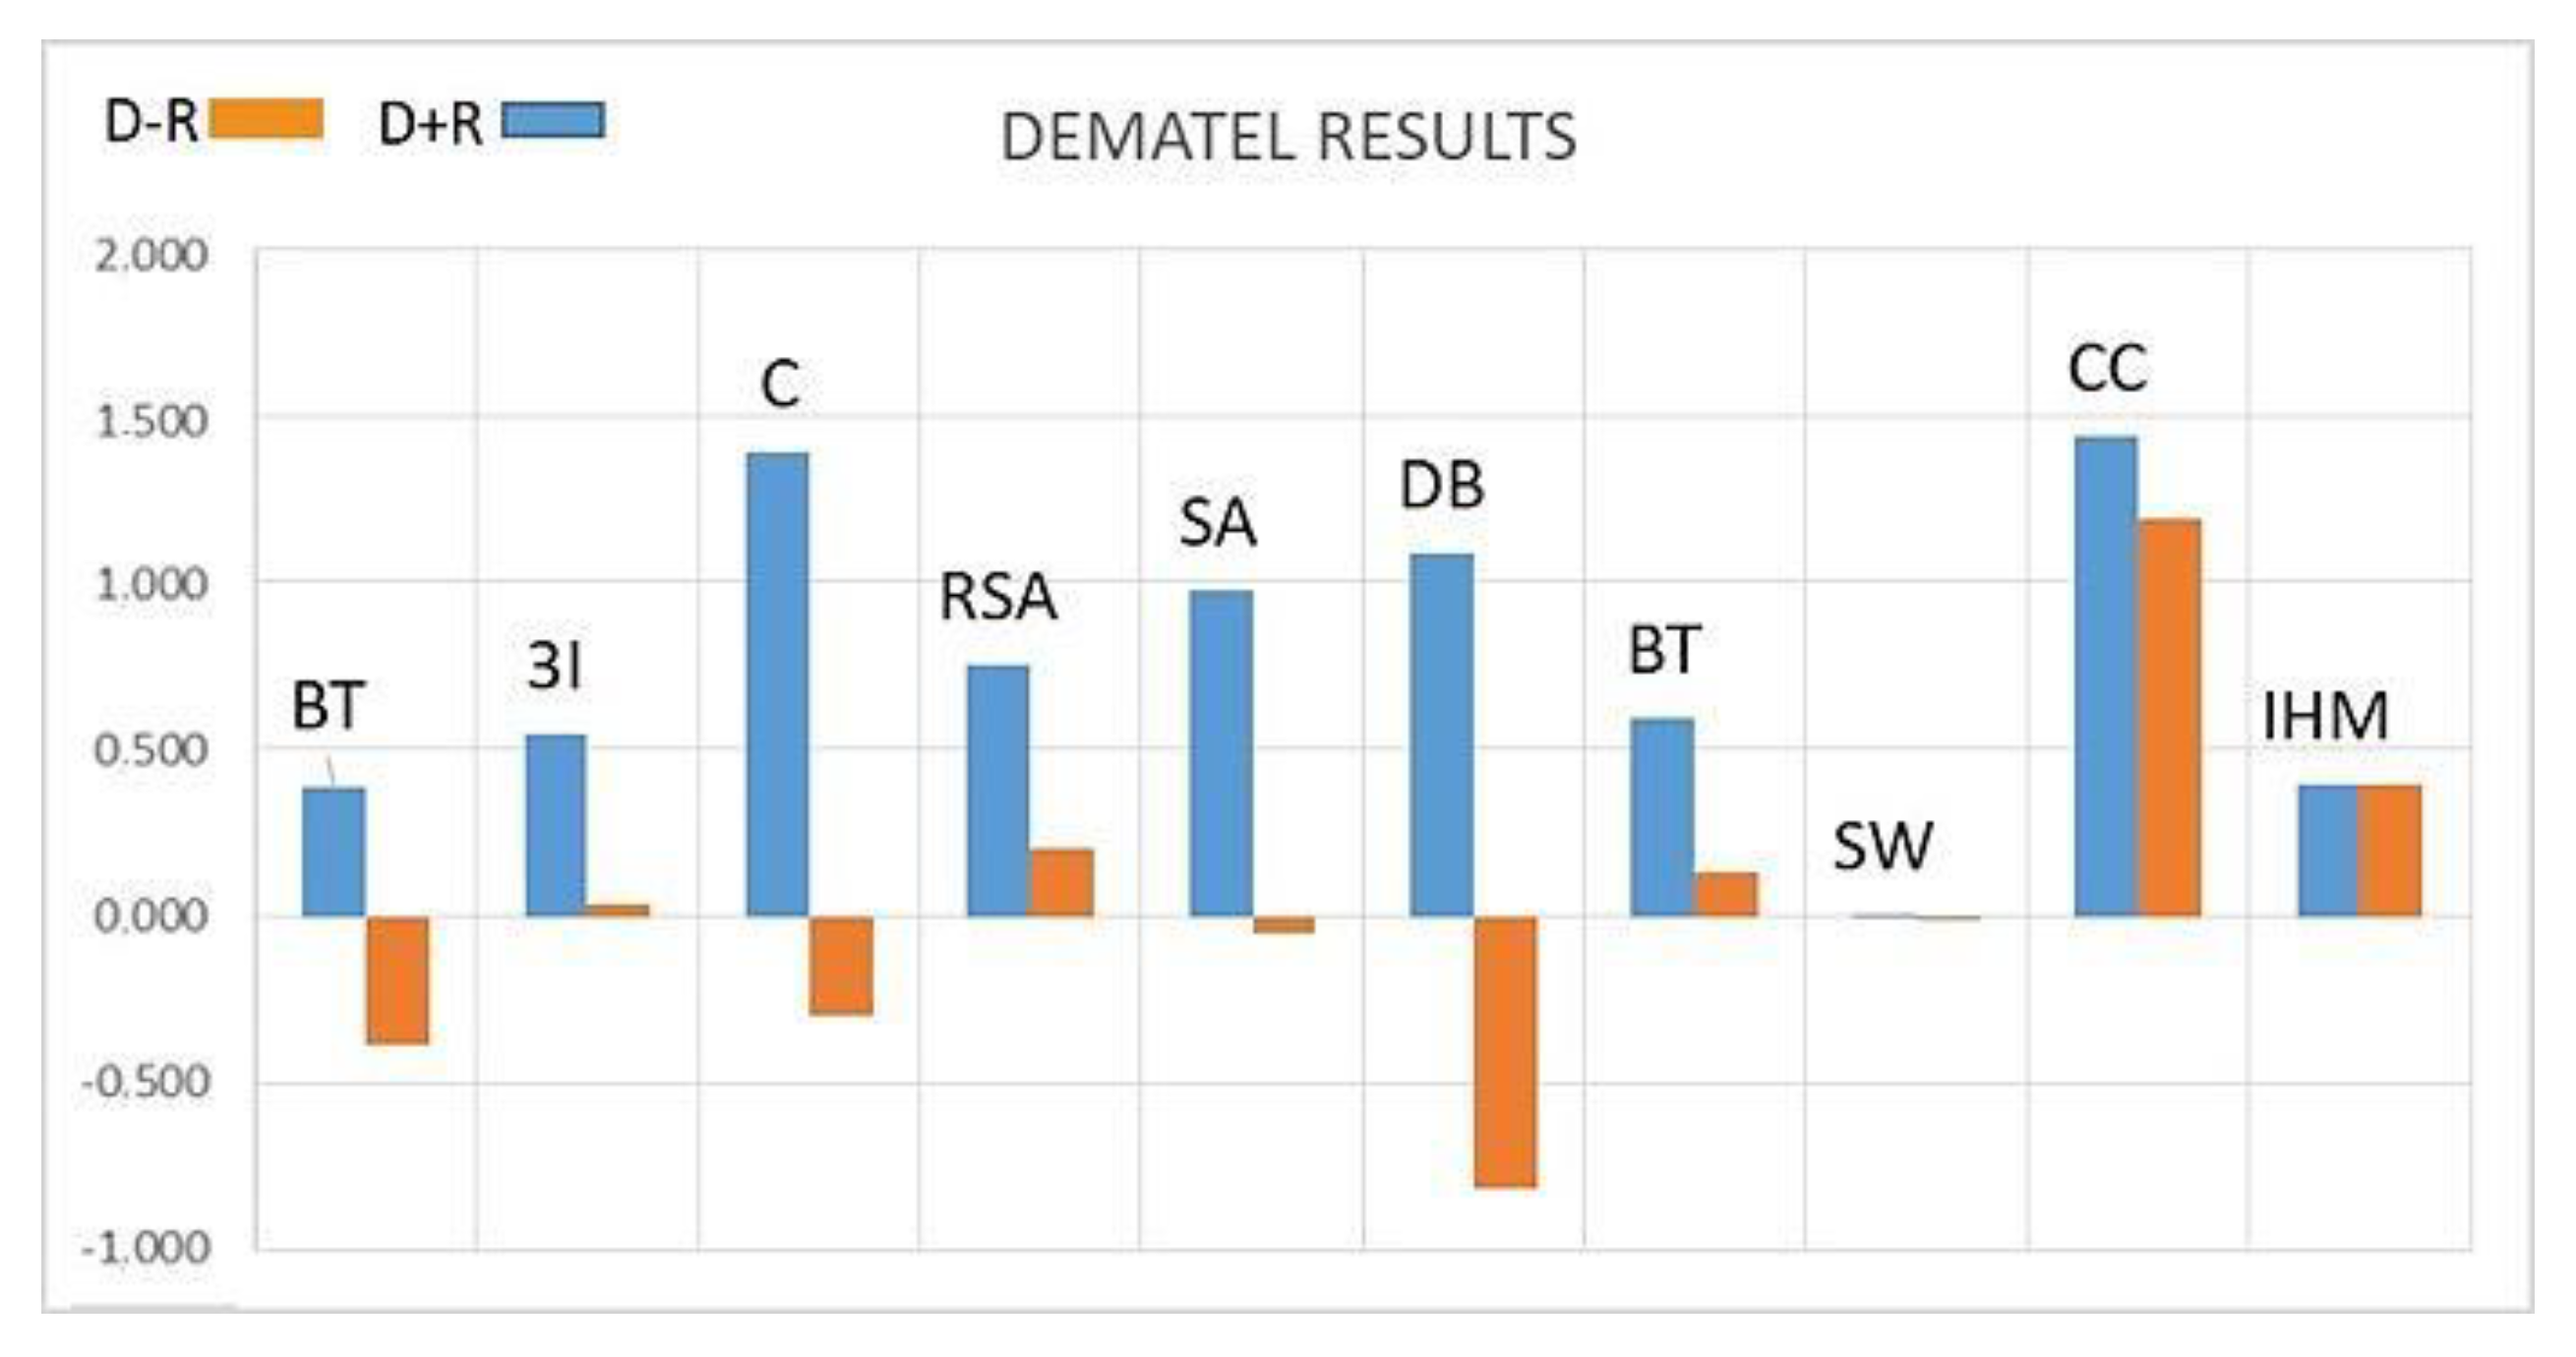
On the other hand, once the design characteristics/actions options were defined, it was necessary to detect how much each one of these impacts on the others; this is very important, considering that one action may potentiate others. That is very important when implementing these characteristics or actions, especially when implementation would be one after the other or when not all of them would be implemented. In this case, it was important to pick in the first place the code change, considering that was a very strong deliverer and had the strongest overall influence (
D + R). The graphic containing the values of
D + R and
D − R could be found in
Figure 14.
The aforementioned results allowed the company to identify that “code change” is the design action that mostly impacts customer satisfaction while entailing low investment. On the other hand, other actions, such as “triple integration” and “battery time”, required an additional cost and did not impact clients significantly. In this case, the initial perception was that design actions, such as battery type and 3I, were the more relevant ones. Nevertheless, the proposed QFD process showed that the company should firstly focus on actions like code change that could impact customer satisfaction in a better way. This process could help the company to make better decisions relating to product improvement and development.
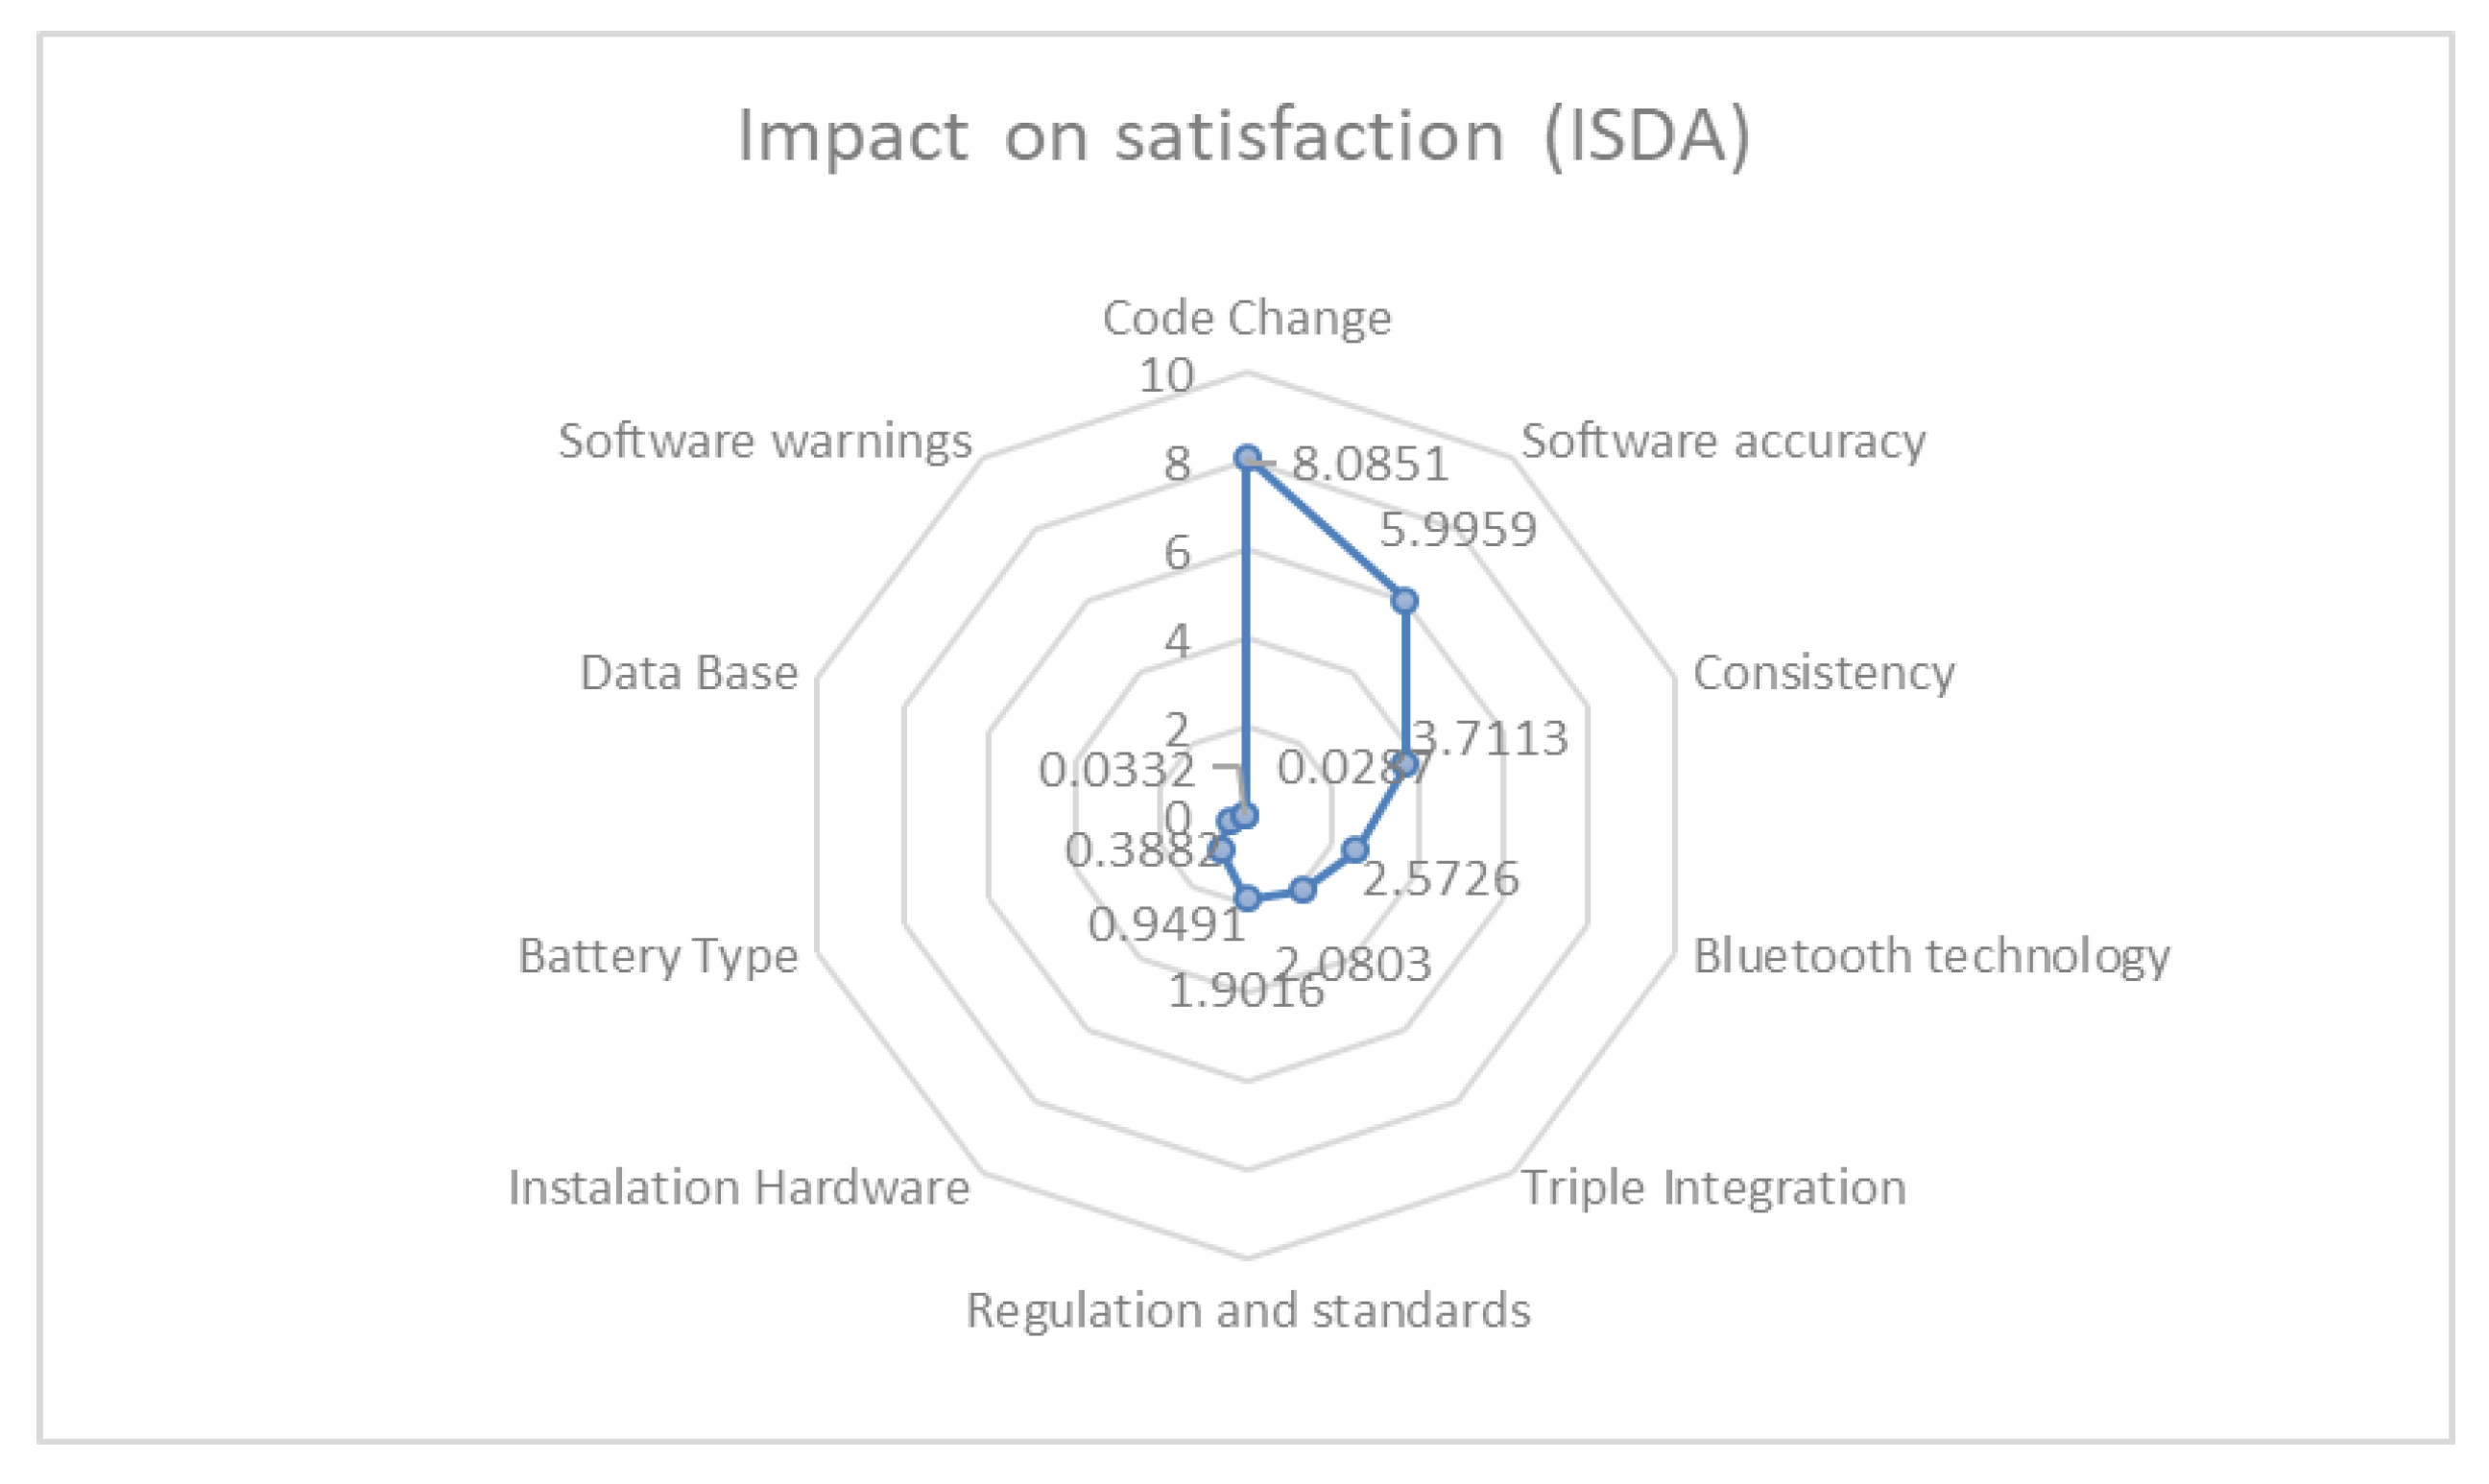
Figure 15 describes how the impact on satisfaction decreased below 1 from installation hardware, and it continued dropping until it became almost zero. This was an important finding because the company now knows that those last four design features do not contribute to customer satisfaction. Now they could focus their attention and effort on implementing actions that would have a relevant impact on customer satisfaction.
Additionally, the company could now use the cost of each action and relate it to its satisfaction impact. With this information and calculating the money needed to implement each characteristic or action, the company could estimate how much money is needed to invest to increase in one point the customer satisfaction in each design characteristic and maybe compare future actions, to implement actions only if, for example, this relation is greater than a threshold value (dollars/ISDA). This could encourage the design team to work with a target of the impact their actions should have if they imply some money investment.
7. Conclusions
Software and ICT smart industries have a strong relation with vagueness in the development of new products, which, when not properly defined or addressed, may cause over costs, delay in product delivery, among other problems. In the case of healthcare products or services, it is necessary to avoid improper functioning (misalignment, for example), which, in this case, could generate additional costs of around USD 29000 and low-quality healthcare.
The proposed approach yielded information that was important for underpinning the smart product design process within the case company. Step1 is the initial driver of the process, where the customers let the company know their perception, in general, of the product and what features they consider need to be improved. This information was gathered through surveys and direct contact with customers.
In step 2, the design and sales departments of the company analyzed the needs and proposed some design features/actions to fulfill the customer needs. These actions, as well as the identified customer needs, are listed and defined in
Section 4.
The implementation of step 3 (fuzzy Kano) allowed the company to understand that many features were considered as must-be´s by the customers, and others were just indifferent to them. A very important finding in this step was the fact that some times, customers could not decide between two pure categories and need the option of being able to choose simultaneously a degree of sympathy with two pure categories to express in a better way how they feel with a particular feature. This situation would positively impact the reliability of the process due to the better representation of its inputs. The results of this step were a key element for measuring and monitoring the satisfaction level. Satisfaction index (SI) is a metric that shows how a particular need will impact customer satisfaction. This was very important because, based on
Table 7, two needs might have a different satisfaction level though they belonged to the same type of need. For example, both communication and trustable data belonged to the must-be’s category. Nevertheless, trustable data had a higher satisfaction level (1.8 vs. 1.1), i.e., it would have a stronger effect on customer satisfaction.
With the implementation of AHP in step 4, the company was able to know customer perception relating to each need in a different way. Moreover, customers were able to express their preferences related to customer needs but comparing each one with the others. The process allowed the company to obtain the weight assigned by the customers in this situation. Obtaining the values of satisfaction level and weight for each need was critical for the company because, with the integration of the two measures, the company would be able to include in the process a better representation of customer preferences, which would impact the outcome of the smart product design process.
On a different tack, with the implementation of DEMATEL, the company was able to identify the real impact of each design feature/action on the fulfillment of the customer needs. The fact is that on many occasions, a particular action might cause a chain reaction due to the influence/relation between the different design features/actions. With the implementation of DEMATEL, the overall influence for each one of the design actions/features would be identified. For example, in this case, it became clear that the design action code change had a total effect of 1.44, considering both how it influenced the rest of the actions, and how the rest of the actions influenced code change.
In steps 6 and 7, the QFD matrix was constructed, and the relationship between the different design actions/features and the different customer need was identified. Finally, steps 8 and 9 allowed the company to rank the design actions/features.
The proposed approach allowed the company to have a better understanding of customer needs, concluding at the end of the process that the design action ranking was not as they expected. Although the company would implement almost all actions in this case, now they are aware of the impact the action they would implement should have. It is also important to point out that in the case of future developments, the company has now a framework that would help them to improve products and design new ones more effectively. In this intervention, code change was found to be the most important design action, and it was then recommended for implementation in the practical scenario.
Another important issue was that the incorporation of MCDM methods, such as AHP, DEMATEL, and Kano influence factors to satisfaction, in the QFD process made it more robust, so QFD could reflect in a better way vagueness of human perception, and in this way, allowing decision-maker to make better decisions. The inclusion of fuzzy Kano was also important because it allowed classifying customers’ needs and impact on satisfaction effectively. In this case, the proposed approach was used to improve an existing device.
It is important to note the restrictions of this work. Specifically, the proposed approach does not consider the interrelations among customer needs. It is also not possible to discriminate the weaknesses and strengths of each design action. Future investigation should address these limitations to better underpin the smart product design process. Future work may also include the validation of the proposed approach in new products and services. Furthermore, the design process can be improved by including human thinking vagueness through performing a complete fuzzy QFD process. On the other hand, the proposed approach can be implemented in other medical devices, considering the product purpose and the impact that an inappropriate design process can have on customer satisfaction, customer wellbeing, and companies’ reputation.

 ,
, 


