Featured Application
Front-face fluorescence spectra of honey samples can be used as authentication and quality assessment method.
Abstract
Honey is a natural pure food produced by honeybees from the nectar of various plants, and its chemical composition includes carbohydrates, water, and some minor compounds, which are very important for honey quality and authentication. Most of honey’s minor components are related to the botanic origin, climate, and geographic diversity. In this work, we report an original case study on monofloral honey samples of twelve different botanic origins produced in Tuscany (Italy) based on the ‘semi-quantitative’ analysis of emission, excitation, and synchronous front-face fluorescence spectra. This is the first front-face fluorescence study of Italian honey samples and, to our knowledge, the first fluorescence investigation of honey from inula (Inula viscosa (L.) Aiton), marruca (Paliurus spina-christi Mill.), lavender (Lavandula L. 1753), sulla (Hedysarum coronarium L.), arbutus (or strawberry tree) (Arbutus unedo L., 1753), and alfalfa (Medicago sativa L.) plants. Results obtained from fluorescence spectroscopy are discussed in terms of characteristic spectral emission profiles typical of honey of different botanic origins. Moreover, the spectral analysis based on the decomposition of the front-face fluorescence (FFF) spectra in terms of single main fluorophores’ components is here proposed to identify several minor compounds, such as amino acids, phenolic acids, vitamins, and other fluorescent bioactive molecules.
1. Introduction
Honey is one of the oldest untreated natural foods, part of cooking traditions, and used as a sweet additive in many cultures throughout the world [1]. Due to its particular chemical content and nutraceutical properties, honey has been also used in medicine; its anti-inflammatory, anti-microbial, and anti-oxidant properties have been demonstrated in specific studies about honey’s ability to reduce cardiovascular and gastrointestinal diseases, as well as to positively influence human health [2,3]. Honey is produced by honeybees from the nectar of plants, as well as from honeydew, and can be distinguished into monofloral or polyfloral honey, depending on whether it is derived mostly from one plant species or if it derives from different botanic sources. According to international food standards (Codex Alimentarius Commission., 2001) [4], monofloral honey should possess organoleptic, physical, chemical, and microscopic properties related to the plant of origin. However, these characteristics are not easily determined and, until now, a univocal and unambiguous method to clearly identify the botanic origin of honey is still missing [5]. Nevertheless, one of the most used technique to assess the botanic origin of honey is the traditional microscopic analysis of pollens present in honey samples, called melissopalynology [6,7].
Focusing on its chemical composition, honey can be considered a viscous fluid made of sugars (saccharides) (70%–80%), water (10%–20%), and about 200 different minor components, such as minerals, proteins, amino acids and enzymes, vitamins, phenolic and other organic acids, flavonoids, lipids, and volatile compounds. Despite these general chemical features, honey is a very complex food matrix, since the presence of particular molecular markers and their concentration depend on many factors: not only the botanic and geographic origin of the plants, but also the season and climate conditions, the bee species, and soil characteristics [5].
Over the last twenty years, numerous analytical methods were proposed to investigate the chemical and physical properties of honey with the aim to discriminate among different botanic and geographic origins [8,9,10,11,12,13]. Sugars’ components and saccharides’ profiles are mainly determined by chromatographic methods, such as gas chromatography coupled with mass spectrometry (GC-MS) [8], ion chromatography with an amperometric pulsed detector (HPAEC-PAD) [10], and high performance liquid chromatography (HPLC) [5,8]. Several analytical methods were optimized to study proteins and the enzymatic content in honey, as well as the amino acids profile, mainly by means of HPLC methods and high-resolution two-dimensional electrophoresis [8]. As also reported in a comprehensive review [5], the combination between chromatographic techniques and multivariate statistical analysis identified several amino acids as possible floral origin markers (i.e., phenylalanine and tyrosine as characteristic markers for lavender honey). Among volatile and semi-volatile organic compounds, whose interests are related to the aroma and fragrance quality of honey, seven groups of compounds were identified: aldehydes, ketones, acids, alcohols, esters, linear hydrocarbons, and cyclic compounds [5]. The determination of volatile compounds in honey is not an easy task, since different isolation and extraction techniques, which usually precede the GC analysis [5,8], have proved to largely influence the final quantification of these minor components. Several progresses both in the multivariate data analysis and extraction techniques are at the basis of recent studies on the correlation between the presence of specific volatile compounds (i.e., derivatives of α-ionone) and the botanic origin (i.e., Eucalyptus plant) of honey samples [13]. Another fundamental class of minor bioactive compounds is that of polyphenols, which can be classified into three sub-groups: flavonoids, cinnamic acids, and benzoic acids [14]. Alternatively, phenolic compounds are usually divided into two groups: phenolic acids including phenolic esters (i) and flavonoids (ii) [15]. As observed also for other minor chemical compounds, the composition of polyphenols in honey depends on many factors: the botanic source, seasonal and environmental factors, geographic origin, and storage conditions [5,8,16]. Typical analytical methods used to determine polyphenols in honey are based on a two-step approach [17]: isolation and extraction of phenolic compounds from the honey matrix (i.e., by solid-phase extraction) followed by the identification of chemical compounds by chromatographic analysis (i.e., HPLC) with various different detectors (i.e. diode-array detector - DAD, fluorescence and MS detectors) [14,15,16,17,18,19,20]. The determination of polyphenols’ content in honey of different botanic origin has also been associated to the antioxidant activities of honey in several countries, as reported for Turkish [18], Greek [19], and Italian [20] honey samples. During the years, several destructive analytical methods were developed to characterize the chemical composition of honey, to discriminate honey samples of different botanic and geographic origin, and to detect adulterations with sugar or fake honey. However, these classical analytical methods have several limitations [5,8]: they are usually expensive, time consuming, and the extraction of minor compounds from the raw matrix may be critical for their quantification. For these reasons, non-destructive approaches, based on infrared (IR), Raman, ultraviolet–visible (UV–Vis), and near infrared (NIR) spectroscopic techniques [21,22], as well as several fluorescence spectroscopic methods [23,24,25,26,27,28] were developed to investigate honey samples and to detect eventual adulterations in an easier and faster way. On the other hand, fluorescence spectroscopy has become quite popular in recent years to study food matrices and for quality assessment of food processes and conservation [29]. This is related to the high sensitivity and selectivity of fluorescence spectroscopy, which are able to detect very small concentrations of fluorophores [30], and to the natural presence of several kinds of fluorescent molecules in food [23,24,25,26,27,28,29,31,32,33,34]. In particular, fluorescence properties of honey have been related mainly to the presence of free amino acids, enzymes and proteins, flavonoids and phenolic acids, vitamins, and Maillard reaction products [23,24,25,26,27,28,29,31,35,36,37,38,39,40,41]. Some of the fluorescent compounds naturally found in honey (i.e., tryptophan, tyrosine and phenylalanine, among free amino acids [31]; and 2′-methoxyacetophenone, among organic ketophenone derivatives; and 3-phenyllactic acid, produced by the metabolism of phenylalanine [26]) have also been identified as biomarkers of honey of different botanic and geographic origins.
Since honey is a viscous, opaque and multi-fluorophoric matrix, most fluorescence-based methods use the reflectance or front-face fluorescence (FFF) approach [23,24,25,27,35,36,37,38,39,40,41]. Right-angle fluorescence (RAF) spectroscopy, however, has been recently applied for discriminating among different botanic origins in Croatian honey samples, previously solubilized in buffer solutions and methanol solutions as well [28]. The first FFF studies of honey [23,24,36] put in evidence the specificity of the spectral profiles (i.e., emission, excitation, and synchronous spectra) of honey samples with different floral origin. In particular, synchronous spectra, obtained from the simultaneous scan of excitation and emission wavelengths (λex, λem), maintaining a constant wavelength interval (Δλ) between them [30], demonstrated to be useful to study multicomponent fluorescent systems being very sensitive to both the presence of specific fluorophores and their relative concentrations [23]. Spectral parameters such as peaks’ intensity ratio in emission (em)/excitation (ex) spectra of honey samples were also used to quantify the total protein/total phenolic contents [35,37], as well as to detect eventual adulterations with syrups and cane sugar [23,24,36]. Sometimes, to reduce spectral overlapping problems due to the presence of many fluorophores, three-dimensional plots reporting both excitation and emission spectra, the so-called emission-excitation matrices (EEM), are recorded and further analyzed in combination with multivariate statistical methods, to characterize honey samples of different geographic and botanic origins [25,35,36,37,38,39,40,41].
In the present work, an original investigation based on front-face fluorescence (FFF) of honey produced in Tuscany (Italy) from twelve different floral plants (acacia (Robinia pseudoacacia L.) also known as “false acacia” or “black locust”, sulla (Hedysarum coronarium L.), clover (Trifolium L.), marruca (Paliurus spina-christi Mill.), sunflower (Helianthus annuus L., 1753), chestnut (Castanea sativa Mill., 1768), heather (Erica scoparia L., 1753), lavender (Lavandula L. 1753), arbutus (or strawberry tree) (Arbutus unedo L., 1753), inula (Inula viscosa (L.) Aiton), forest honeydew and alfalfa (Medicago sativa L.)) is reported. In particular, the fluorescence spectral profiles of sixteen monofloral honey samples are analyzed in terms of different fluorescence contributions due to main fluorophores, such as phenolic acids, flavonoids, amino acids, and vitamins. An original “semi-quantitative” spectral analysis was proposed in order to identify specific bioactive compounds from the fluorescence spectra. Results reached from this spectral analysis are compared with those obtained by means of various analytical and chemical-physical methods on Italian honey samples (i.e., acacia, chestnut, arbutus, sulla, and heather) [20,22,42,43,44,45] and on some of the Tuscan samples investigated here (i.e., heather, marruca, sulla, acacia, clover, chestnut, and sunflower) [17,46]. The approach presented here opens to future perspectives for a quantitative analysis of fluorescence in terms of main fluorophores’ content. Moreover, in the discussion part of the paper, the results obtained for the twelve different monofloral honey types are discussed in view of possible identification of groups of minor compounds whose presence, and relative concentrations, may be correlated to honey of specific botanic origins.
2. Materials and Methods
2.1. Honey Samples
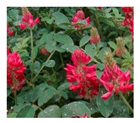
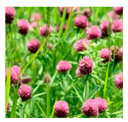
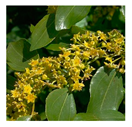
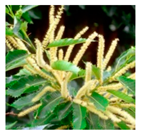
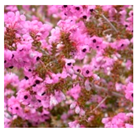
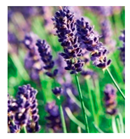
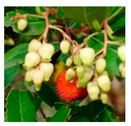
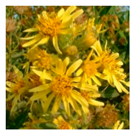
Sixteen honey samples were produced in different areas of Tuscany (Italy) (see Figure 1), between 2013 and 2016, during the flowering season, by four different honey producers [47]. Honey samples were classified as monofloral honey by the producers and this was confirmed by melissopalynology and sensorial analysis (not reported here) [47,48]. After being collected, all honey samples were stored in the dark at 4 °C and thereafter they were analyzed with different methods as described in the following sections. Since Tuscany presents various climatic and geographic features, from Mediterranean to mountain ones [42], typical Tuscan honey floral types range from typically Mediterranean ones, such as heather (Erica scoparia L., 1753—labeled H), clover (Trifolium L.—labeled CL), marruca (Paliurus spina-christi Mill.—labeled MA) and lavender (Lavandula L. 1753—labeled L), to sub-Mediterranean floral types, such as chestnut tree (Castanea sativa Mill., 1768—labeled C), arbutus (or strawberry tree) (Arbutus unedo L., 1753—labeled AR) and acacia or false acacia (Robinia pseudoacacia L.—labeled AC), to mountain floral types, such as the forest honeydew (labeled FH). Other botanic species investigated in this work are: sulla (Hedysarum coronarium L.) (labeled SU), sunflower (Helianthus annuus L., 1753) (labeled S), inula (Inula viscosa (L.) Aiton) (labeled IN), and alfalfa (Medicago sativa L.) (labeled AA). Floral images of the twelve botanic species and basic information of the honey samples investigated in this work are reported in Table 1 and Table 2, respectively.
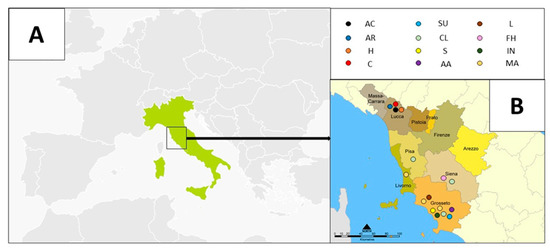
Figure 1.
Monofloral honey samples from Tuscany (Italy). On the left (A), the Italian map, and on the right (B), the Tuscany map. Colored circles indicate the twelve different monofloral honey types, as reported in the text. Geographical areas of production of honey samples [47,48] are shown.

Table 1.
Flowers and plants of monofloral honey samples investigated in this work: (a) acacia or “false acacia” (Robinia pseudoacacia L.); (b) sulla (Hedysarum coronarium L.); (c) clover (Trifolium L.); (d) marruca (Paliurus spina-christi Mill.); (e) sunflower (Helianthus annuus L., 1753); (f) chestnut tree (Castanea sativa Mill., 1768); (g) heather (Erica scoparia L., 1753); (h) lavender (Lavandula L. 1753); (i) arbutus (or strawberry tree) (Arbutus unedo L., 1753); (l) inula (Inula viscosa (L.) Aiton); (m) forest honeydew; (n) alfalfa (Medicago sativa L.). Most of the photos below were taken by the authors. Some of them are free images taken from the web. No copyright was indicated.

Table 2.
Sixteen honey samples analyzed in this work. Label, botanic origin, geographic origin (name of the local Tuscan province), year of production, and a photograph of the honey are reported for each sample.
2.2. Chemical Standards
Methanol (>99%, Fluka, Bucharest, Romania), n-hexane (99%, Carlo Erba, Milano, Italy), and water (Carlo Erba, Milano, Italy) were used to prepare the standard solutions. Standard solutions were prepared from solids: salicylic acid (>99.9%, Sigma-Aldrich, Milano, Italy), 4-hydroxybenzoic acid (99%, Aldrich, Milano, Italy), 3,4-dihydroxybenzoic acid (97%, Fluka, Bucharest, Romania), gallic acid (98%, Aldrich, Milano, Italy), vanillic acid (97%, Aldrich, Milano, Italy), syringic acid (98%, Sigma-Aldrich, Milano, Italy), t-cinnamic acid (97%, Aldrich, Milano, Italy), caffeic acid (97%, Sigma-Aldrich, Milano, Italy), o-coumaric acid (>98%, Fluka, Bucarest, Romania), p-coumaric acid (>98%, Sigma, Milano, Italy), ferulic acid (99%, Aldrich), sinapinic acid (>99%, Sigma), rutin (95%, Fluka, Bucharest, Romania), quercetin (>98%, Sigma-Aldrich Milano, Italy), naringerin (95%, Fluka, Bucharest, Romania), chlorogenic acid (96%, Sigma, Milano, Italy), abscisic acid (98%, Sigma-Aldrich, Milano, Italy), β-carotene (99%, Sigma-Aldrich, Milano, Italy), ellagic acid (98%, Sigma, Milano, Italy), tryptophan (98%, Fluka, Bucharest, Romania), folic acid (vitamin B9) (98%, Fluka, Bucharest, Romania), ascorbic acid (95%, Fluka, Bucharest, Romania), riboflavin (vitamin B2) (95%, Fluka, Bucharest, Romania), nicotinic acid (vitamin B3) (98%, Fluka), and pyridoxine (vitamin B6) (95%, Fluka, Bucharest, Romania).
2.3. Spectroscopic Investigations
2.3.1. UV–Vis Absorption Spectroscopy
UV–Vis spectra were acquired by means of a Jasco V-550 spectrophotometer, between 200 nm and 800 nm, with a scanning speed of 400 nm/s, and bandwidth and data pitch of 1 nm and 0.5 nm, respectively. Absorbance spectra of standard solutions were acquired on a quartz cell of 1 cm of optical path, while UV–Vis absorbance spectra of honey samples in the bulk were recorded by putting a small amount of honey (less than about 50 mg), homogenized by gently heating at T <30 °C for a few minutes, between two quartz windows of 1 mm optical path. The two-quartz windows cell was held against a homemade support in the spectrophotometer by a laminar spring during the spectral acquisition.
2.3.2. Front-Face Fluorescence Spectroscopy
Front-face fluorescence (FFF) spectra were recorded using an ISA Fluoromax II photon counting spectrofluorometer with xenon arc lamp, equipped with a device for reflectance measurements with a cell holder designed to set the incident angle of the excitation beam at 31° [49]. The angle of reflectance was regulated and optimized [47,48] in order to eliminate or reduce self-absorption effects, light-reflected, and scattering phenomena [30,50]. All spectra of both honey samples and standard solutions were acquired by inserting the sample in a quartz cell (1 cm × 1 cm) with 1 cm of optical path. In the case of measurements on honey samples in the bulk, honey was previously heated in a water bath at a temperature less than 30 °C in order to homogenize the sample. For each honey sample in the bulk, emission spectra (em), excitation spectra (ex), and synchronous (syn) spectra were recorded. The excitation and emission slits were fixed to 2 nm and 5 nm, respectively. After optimization, the integration constant time was chosen at 0.5 s; the wavelength increment was 1 nm. The intensity of the emission spectra was determined as the ratio between the emission signal (counts per second, cps) and the intensity of light from the excitation monochromator (mA). In most of the cases, as reported in the text, spectra were normalized and arbitrary units (a.u.) used. For each honey sample, emission spectra with λex ranging between 250 nm to 550 nm, excitation spectra with λem fixed in correspondence with the maximum position of fluorescence emission spectra, and synchronous spectra with fixed wavelength interval, Δλ, ranging from 20 nm to 120 nm, were recorded. Before the spectral analysis and spectral deconvolution, emission spectra were corrected taking into account the light scattering contribution, estimated by using a light diffuser (dried Na2SO4) as previously reported [49].
2.3.3. Data Analysis
UV–Vis absorption and FFF spectra were elaborated using Excel. A homemade package working on Excel was used for spectral analysis and spectral simulation, following the mathematical approach already reported [33,34,51].
3. Results
3.1. UV–Vis Absorption of Honey of Different Botanic Origin
UV–Vis absorption spectra of honey in the bulk were acquired for all investigated samples (see Table 3). Honey obtained from acacia (Robinia pseudoacacia L.), clover (Trifolium L.), marruca (Paliurus spina-christi Mill.), lavender (Lavandula L. 1753), arbutus (or strawberry tree) (Arbutus unedo L., 1753), inula (Inula viscosa (L.) Aiton), heather (Erica scoparia L., 1753), forest honeydew, and alfalfa (Medicago sativa L.) presented an intense absorption peak around 270–280 nm and a less intense, but well pronounced, absorption peak in the region 325–335 nm. Sulla (Hedysarum coronarium L.) honey sample shows a very broad peak between 250 and 340 nm and small peaks in the visible region (centered around 451 nm and 690 nm). Chestnut (Castanea sativa Mill. 1768) honey sample is the only one with a large and intense peak centered around 240 nm, and a minor structured absorption band in the range 318–355 nm. Sunflower (Helianthus annuus L., 1753) honey has an intense absorption peak centered at 269 nm and a less intense structured band with a profile very similar to that of carotenoids, as will be discussed later on, with peaks at 425, 450, and 485 nm. The very weak peak at 690 nm observed in several honey samples is related to the presence of chlorophyll derivatives, while the eventual presence of absorption in the region centered at 450 nm (observed only in sulla and sunflower honey) is due to carotenoids.

Table 3.
Maximum UV–Vis absorption wavelengths of honey samples investigated in this work. Minor peaks are indicated between parentheses, as explained in the text.
3.2. FFF Spectral Profiles of Honey of Different Botanic Origin
A selection of FFF emission spectra of the twelve monofloral honey samples produced in Tuscany (Italy) is reported in Figure 2. The most significant emission bands are observed by fixing the excitation wavelength at 280 nm (Figure 2a), 340 nm (Figure 2b), and 420 nm (Figure 2c), respectively [23,24,25,35,36].
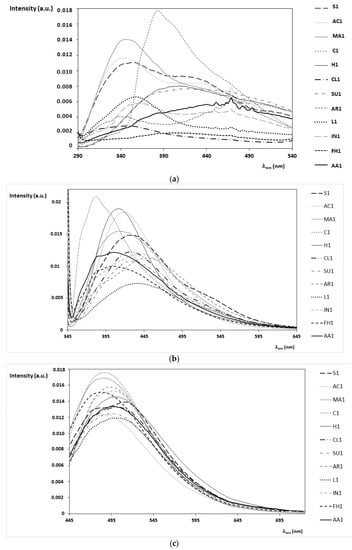
Figure 2.
Front-face flourescense (FFF) emission spectra of honey samples in the bulk obtained with excitation wavelength (λex) fixed at 280 nm (a), 340 nm (b), and 420 nm (c). Twelve honey samples of different botanic origins are reported here, as indicated in the legend on the right. The intensity of the emission spectra is normalized (arbitrary units, a.u.). In (a) the sharper peaks from 440 to 500 nm are due to the xenon lamp.
To help in the discussion of typical spectral profiles of honey of different botanic origin, the wavelengths of the maximum emission at the three selected excitation wavelengths, namely λex = 280, 340, and 420 nm, are summarized in Table 4.

Table 4.
Wavelength of the maximum emission bands observed by fixing the excitation wavelength, λex, equal to 280, 340, and 420 nm. In the parentheses, the wavelengths relative to secondary maxima emission bands as well as to emission shoulders are also reported for each honey sample.
As a general comment, the emission/excitation profiles of honey are quite complex due to the contemporary presence of several fluorophores with different concentrations and to the presence of eventual quenching phenomena. However, the comparison among emission spectra recorded at different wavelengths can be used to underline differences and analogies among honey samples of different botanic origin and to support the identification of possible markers. As discussed in detail in Section 4, significant information can be obtained by simulating the emission spectra, in particular those obtained by exciting the sample at 280–290 nm (Figure 2a) and at 330–340 nm (Figure 2b). On the contrary, at higher exciting wavelengths (λex > 420 nm) the emission spectra are quite similar among different honey samples (Figure 2c).
In particular, chestnut honey presents very peculiar emission spectra at λex = 280 nm and 340 nm (Figure 2a,b), while sunflower honey differentiates from others for the emission spectrum at λex = 420 nm (Figure 2c) and for the absorption in the visible interval (Table 3). The other honey samples are grouped into three sub-classes:
- -
- the first group (lavender, clover, acacia, and marruca honeys) is characterized by emission spectra with a maximum emission around 330–360 nm (at λex = 280 nm);
- -
- the second group (sulla and heather honeys) presents similar emission spectra with a maximum emission around 410–440 nm (at λex = 280 nm);
- -
- the third group (arbutus, inula, alfalfa honey, and forest honeydew honeys) is characterized by different emission spectra (at λex = 280 nm), but similar emission spectra are obtained exciting the sample at λex = 340 nm, with a typical shoulder around 360–385 nm.
In Section 4, these spectral features are correlated with the presence of specific fluorophores. The complexity of the honey matrix in terms of fluorescent molecules is also evident by observing the synchronous spectra. For simplicity, we are reporting only synchronous spectra obtained by fixing the wavelength interval, Δλ, equal to 20 nm (see Figure 3).
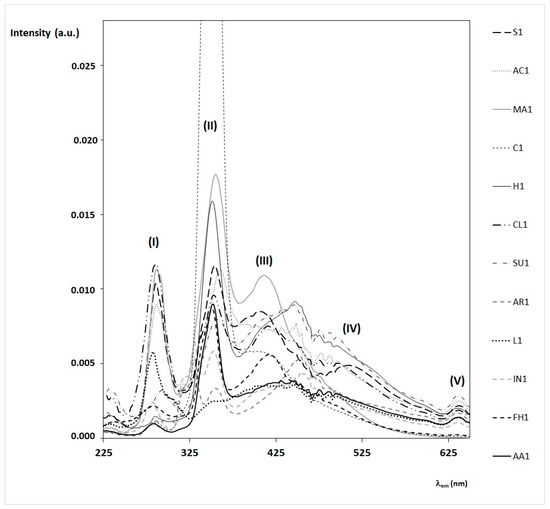
Figure 3.
FFF synchronous spectra of honey samples in the bulk obtained with fixed wavelength interval, Δλ, of 20 nm. Synchronous spectra of twelve honey samples of different botanic origin are here reported as indicated in the legend on the right. The intensity of the synchronous spectra is normalized (a.u.). Note that the spectrum of the chestnut honey sample (C1) is cut due to the very high intensity of the signal centered at 350 nm. Note that the sharp oscillations in the range between 420 and 480 are due to the xenon lamp.
Synchronous spectra of honey are often used to discriminate among botanic and geographic origin in combination with multivariate statistical analysis [25,35,36,37,38,39,40,41], mostly due to the high sensitivity of this spectrometric technique and the possibility of identifying the emission bands specific to each sample. Moreover, synchronous spectra are used to support the identification of single fluorophore’s contributions to the emission spectra [30]. By observing the synchronous spectra of the twelve honey samples reported in Figure 3, several general considerations can be drawn. In almost all honey samples, synchronous spectra are characterized by two well-defined and intense bands:
- -
- the first intense band (I) has a maximum at λex = 280–290 nm, mostly due to amino acids (mainly tryptophan), proteins, and some phenolic acids;
- -
- the second intense band (II) has a maximum at λex = 340–350 nm, mostly due to other phenolic acids, flavonoids, and vitamins, such as vitamin B6 (see in particular, chestnut, marruca, heather, and sunflower honeys).
Additionally, some honey samples present a third band (III), with maximum at λex = 410–420 nm due to the presence of other fluorophores, such as pigments and vitamin B9 (see, for instance, chestnut, marruca, sunflower, and forest honeydew). Almost all honey samples have broad emission bands around 500–550 and only sunflower honey has a defined forth band (IV), with a maximum at λex = 520–530 nm, probably due to vitamin B2 and other pigments.
A fifth band (V) centered around λex = 640–650 nm, due to chlorophylls and their derivatives, is present in almost all honey samples, with the exception of chestnut and marruca honeys and forest honeydew.
3.3. Fluorescence Properties of Minor Compounds Present in Honey
The emission/excitation properties of several fluorescent minor compounds typical of honey are here reported. As observed in Section 3.1, honey samples obtained from sulla and sunflower plants, contain pigments, such as β-carotene, in large amounts. Carotenoids are known to have small fluorescence yield [52] and, due to their large molar extinction coefficient, they are usually responsible for self-absorption and quenching phenomena. For instance, β-carotene has a typical near UV–Vis absorption band centered from 380 to 480 nm (Figure 4a), while a large emission band with two relative maxima at 520 nm and 570 nm is obtained by exciting at wavelengths in the near UV–Vis region (350–420 nm) (Figure 4b). Among other pigments, chlorophylls and their derivatives have very strong fluorescence emission, with a relative sharp peak in the interval 670–690 nm, and despite their concentrations are usually small; almost all honey samples present sharp emission peaks in this region [53].
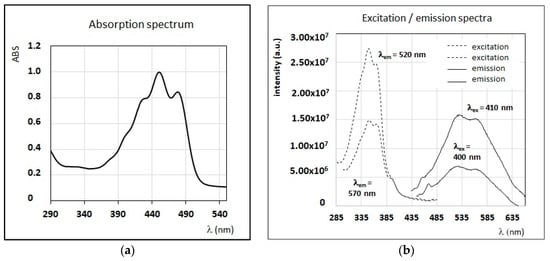
Figure 4.
(a) Absorption spectrum of a solution of β-carotene in n-hexane (C = 0.2 mg/mL). (b) A selection of FFF emission and excitation spectra of the same solution of β-carotene. Intensity of emission and excitation spectra are scaled and reported in arbitrary units.
Among antioxidant phenolic compounds, ellagic acid, which was suggested as a fluorescent marker of Belgian polyfloral honey [54] and also found in very small amounts in some Tuscan honey samples [47], has a strong and characteristic emission band with a maximum at 420 nm (by exciting with λex = 255 or 360 nm; see Figure 5A).
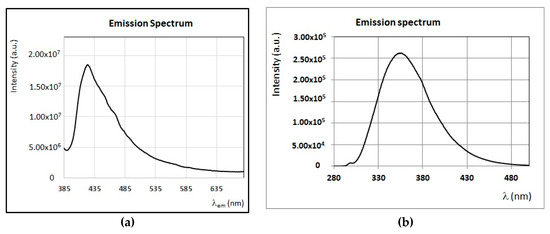
Figure 5.
(a) FFF emission spectrum (λex = 360 nm) of a solution of ellagic acid in water/methanol (90% v/v) (C = 0.02 mg/mL). (b) FFF emission spectrum (λex = 280 nm) of a solution of tryptophan in water (C = 0.02 mg/mL). Intensity of emission spectra is scaled and reported in arbitrary units.
As reported in several papers about FFF investigations of honey [23,24,35,36], the typical fluorescence emission of honey samples centered around 340–380 nm (with excitation at λex = 270–290 nm) is partially due to amino acids, such as tryptophan, tyrosine, and phenylalanine. In particular, the emission spectrum of tryptophan, which are the amino acids with higher fluorescence yield, is reported in Figure 5B.
Other minor compounds responsible for a fluorescence emission band with a maximum between 320 and 380 nm (with excitation at λex = 270 nm) are the hydroxybenzoic phenolic acids, such as those indicated in Figure 6A. The 4-hydroxybenzoic acid has indeed a maximum at 320 nm, while the vanillic and gallic acids have a maximum at ~350 nm, and the syringic acid has a maximum at 360 nm. As discussed in Section 4, these hydroxybenzoic phenolic acids were found in some of the honey samples analyzed in this work [17], and they were suggested as possible markers of some botanic origins.
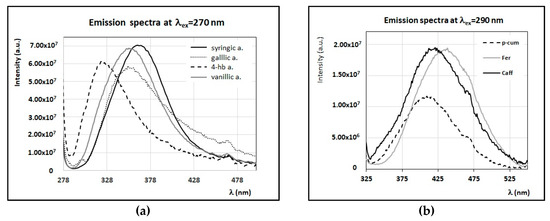
Figure 6.
FFF emission spectra of solutions of hydroxybenzoic (a) and hydroxycinnamic (b) phenolic acids in water/methanol (90% v/v) (C = 0.02 mg/mL). (a) FFF emission spectra (λex = 270 nm) of gallic acid (gallic a.), syringic acid (syringic a.), vanillic acid (vanillic a.), and 4-hydroxybenzoic acid (4-hb a.). (b) FFF emission spectra (λex = 290 nm) of ferulic acid (Fer), caffeic acid (Caf), and p-coumaric acid (p-cum). Intensity of emission spectra is scaled and reported in arbitrary units.
Another class of fluorescent minor compounds present in honey is that of hydrocinnamic phenolic acids. When excited at wavelengths around 270–290 nm, a strong emission band centered between 410 and 440 nm is observed (see Figure 6B). These compounds were found in most of the samples investigated here [17], and their concentrations, in particular those of ferulic, p-coumaric, and caffeic acids, change depending on the botanic origin; this was also reported in several papers focusing on characteristic phenolic profiles [14,16,17,19,55].
A derivative of caffeic acid, chlorogenic acid has also been found in monofloral sulla, acacia, and wildflower honey samples [17,35,55]. Its typical fluorescence emission is centered at 450 nm, by exciting with wavelengths in the intervals 270–290 nm and 320–340 nm (see Figure 7a). The o-coumaric acid (see Figure 7b), showing a maximum of emission around 500 nm (with λex = 280 nm and 330 nm), was found in very small concentrations only in some of the honey samples investigated here (i.e., acacia, sulla, heather, and clover honey) [17,47,48]. The trans cinnamic acid, despite identification by analytical investigations in acacia and chestnut honey samples, has a very weak fluorescence [47,48].
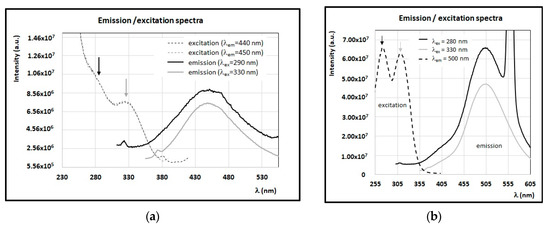
Figure 7.
FFF emission and excitation spectra of solutions of (a) chlorogenic acid in methanol (C = 0.029 mg/mL) and (b) o-coumaric acid in methanol (C = 0.041 mg/mL). Intensity of FFF spectra is reported in arbitrary units.
Among additional phenolic derivatives affecting the fluorescence of honey, 3,4-dihydroxybenzoic acid and sinapinic acid are responsible for a strong emission in the region between 320 and 460 nm, when exciting the sample with λex in the interval 270–290 nm (Figure 8a). These phenolic acids were found in samples of acacia, sulla, chestnut, sunflower, heather, arbutus, and alfalfa plants [17,47,48]. Other polyphenols, such as the flavonoids isorhamnetin, quercitrin, hesperetin, naringenin, and luteolin, despite their presence in some of the investigated honey samples [17,47,48], are not fluorescent or present a very low fluorescence quantic yield. Quercetin compound was found in some of the honey samples and is characterized by an emission band centered at 520–530 nm, when excited at 330–350 nm.
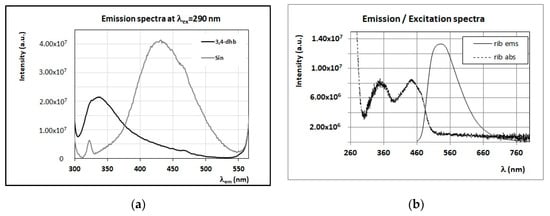
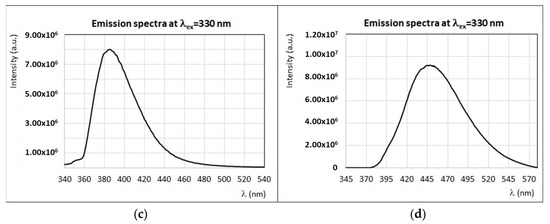
Figure 8.
(a) Emission spectra (λex = 290 nm) of a solution of 3,4-dihydroxybenzoic acid (3,4-dhb) and sinapinic acid (Sin) in water/methanol (90% v/v) (C = 0.02 mg/mL). (b) FFF emission (λex = 445 nm) and excitation (λem = 520 nm) spectra of riboflavin (rib) in water (C = 0.02 mg/mL). (c) Emission spectrum (λex = 330 nm) of a solution of vitamin B6 in water (C = 0.02 mg/mL). (d) Emission spectrum (λex = 330 nm) of a solution of vitamin B9 in water (C = 0.02 mg/mL). Intensity of emission and excitation spectra is scaled and reported in arbitrary units.
Another class of minor compounds typical of honey is that of vitamins, including ascorbic acid (vitamin C), thiamine (vitamin B1), pantothenic acid (vitamin B5), niacin (vitamin B3), folic acid (vitamin B9), pyridoxine (vitamin B6), and riboflavin (vitamin B2) [8,56,57]. Ascorbic acid was found in some honey samples, but it is not fluorescent. Among fluorescence vitamins, riboflavin (vitamin B2) presents a typical emission/excitation profile with an emission band around 520–530 nm (see Figure 8b), pyridoxine (vitamin B6) has quite a sharp fluorescence peak centered at 380–390 nm (with λex = 330 nm) (see Figure 8c), and folic acid (vitamin B9) has an emission band at 450 nm (with λex = 330 nm) (see Figure 8d).
4. Discussion
In this section, the main features of the emission/excitation spectra of honey samples from Tuscany (Italy) were investigated and discussed in terms of the main fluorophores’ contributions. The spectral interpretation and identification of molecular compounds responsible for the fluorescence properties of honey of different botanic origin are indeed fundamental steps for future practical applications in the field of honey authentication. In the following, the experimental spectral profiles are analyzed in terms of the main fluorophores’ contributions, by using a rather simple spectral deconvolution approach. In the first approximation, the experimental emission/excitation spectra are indeed reproduced as a linear combination of the emission/excitation spectra of different molecular contributions, similarly to what was recently reported for fluorescence emission spectra of red wines [34] and for UV–Vis absorption spectra of olive oils [51]. Before the spectral deconvolution, base line correction and subtraction of eventual scattering contributions were done [49]. Although the quantification of fluorescent compounds is out of the scope of the present work, the mathematical deconvolution of FFF spectra in terms of different spectral contributions, in principle, could not only be used for identification, but also quantification of the minor components of honey. This aspect will be the topic of future investigations.
For simplicity, in the following subsections, honey samples of different botanic origin are grouped on the basis of similar spectral features and the main results obtained from the spectral analysis of FFF spectra are discussed taking into account results already published about the fluorescent properties of honey. A summary of the main fluorophores’ contributions to the fluorescence emission of the honey samples investigated is reported in Table 5.

Table 5.
Main fluorophores contributing to fluorescence emission of honey samples, divided into four groups, and characteristic spectral features, as described in detail in the following sections. Underlined fluorophores represent the highest contribution to fluorescence emission at the indicated wavelength.
4.1. Identification of Main Fluorophores in Sunflower and Chestnut Honey Samples
Fluorescence studies of sunflower honey were reported in previous works [25,41] with the main purpose of discriminating among different botanic origins in combination with multivariate statistical approaches. However, to our knowledge, the interpretation of emission/excitation matrices in terms of main fluorophores is missing. As seen in Figure 2, sunflower honey presents a characteristic emission spectral profile when excited at λex > 420 nm. At lower wavelengths, the spectral features of sunflower honey are similar to other kinds of honey. For instance, the emission spectrum at λex = 290 nm (Figure 9a) is mainly determined by phenolic acids, such as vanillic, ferulic, p-coumaric, 4-hydroxybenzoic, and caffeic acids, which also affect the emission spectrum at λex = 340 nm (Figure 9b), with the additional contributions of vitamin B9 (with a maximum around 450 nm) and quercetin (maximum at ~520–530 nm). This is in agreement with the phenolic profile of Tuscan sunflower honey samples, as obtained by chromatographic methods [17,47]. The spectral deconvolution of emission spectra of sunflower honey at these wavelengths can be easily obtained as a linear combination of the experimental spectra of these minor compounds, as shown in Figure 9a,b.
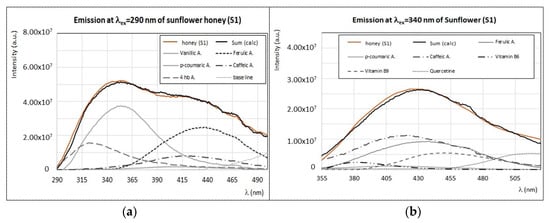
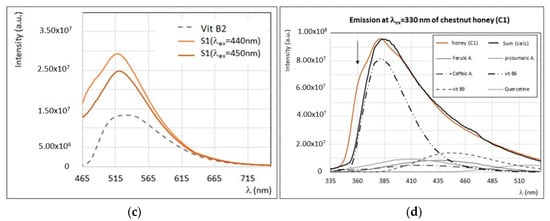
Figure 9.
(a) Experimental (brown) and calculated (black) emission spectra (λex = 290 nm) of sunflower honey (S1) with the contribution of main fluorophores as indicated in the legend. (b) Experimental (brown) and calculated (black) emission spectra (λex = 340 nm) of sunflower honey (S1) with the contribution of main fluorophores as indicated in the legend. (c) Experimental emission spectra (λex = 450 nm and λex = 440 nm) of sunflower honey (S1) and experimental emission spectra (λex = 445 nm) of vitamin B2 (see Figure 8b). (d) Experimental (brown) and calculated (black) emission spectra (λex = 330 nm) of chestnut honey (C1) with the contribution of main fluorophores as indicated in the legend. Intensity of emission and excitation spectra is scaled and reported in arbitrary units.
The emission spectrum of sunflower honey by exciting at λex > 420 nm (Figure 9c) is different from all other honey samples (see also Figure 2c), since it presents a maximum emission at ~520 nm and a second local maximum (or emission shoulder) at ~480 nm, whose intensity varies sensibly by moving to larger excitation wavelengths. A fluorophore responsible for intense emission centered at 520 nm, with a similar spectral profile to sunflower honey, is vitamin B2 [8,47,57]. Moreover, the particular structure and shaped emission band of sunflower honey at excitation wavelengths in the range 400–500 nm (see Figure 9c) are probably due to the presence of self-absorption by carotenoids [42]. This interpretation is in agreement with the presence of large amounts of β-carotene and other carotenoids, such as lutein, in sunflower honey [47], as observed by UV–Vis absorption spectroscopy (see Table 3). The synchronous spectrum of sunflower honey (see Figure 3) presents well defined and intense bands (I, II, III, IV, and V), thus confirming the presence of a rich variety of fluorophores.
Emission/excitation properties of chestnut honey were the objects of several works [24,28,36]. In all cases, chestnut honey emission spectra recorded with excitation wavelengths in the region 270–290 nm and 320–340 nm present very distinctive spectral profiles, similarly to what was observed in the present study. In particular, as shown in Figure 2, chestnut honey emission is characterized by a sharp emission band centered at 380–385 nm with an asymmetric band, and the position of this peak remains the same when exciting in a wide interval of excitation wavelengths (from 260 to 370 nm). In a previous work [24], this particular spectral profile was explained by the presence of high levels of hydroxycinnamates such as caffeic, p-coumaric, and ferulic acids. However, the very sharp and structured spectral profile of chestnut honey cannot be reproduced by considering only the polyphenolic components, which are usually characterized by larger and smoother emission bands, with a decreasing intensity when exciting at wavelengths λex > 330 nm. As seen in Figure 9d, a good reproduction of the experimental emission spectrum of chestnut honey by exciting at 330 nm is obtained by considering vitamins as a major contribution; in particular, vitamin B6, and, in smaller amounts, vitamin B9. The shoulder observed at ~355–365 nm (see the black arrow in Figure 9d) could be due to proteins (mainly tryptophan residues), as suggested by Karoui et al. [36]. Synchronous spectra of chestnut honey are very peculiar too; for instance, the synchronous spectrum, with Δλ = 20 nm, presents a very intense band (II) and a smaller band (III), while other bands characteristic of honey are almost missing (see Figure 3). As noted in previous works [24,28,36], the emission profile of chestnut honey is so characteristic that it can be used for a direct authentication of this specific botanic origin. Further investigations are in progress to quantify vitamin B6, which could be identified as a botanic marker, from the FFF spectra of chestnut honey.
4.2. Identification of Main Fluorophores in Clover, Acacia, Marruca, and Lavender Honey
Among these botanic origins, only acacia [25,35,36,39] and clover [40] honey samples were investigated by means of fluorescence spectroscopy in previous works. In our study, the emission/excitation spectral profile of acacia honey (AC1) is rather similar to those obtained for three marruca honey samples (MA1, MA2 and MA3) produced in the south of Tuscany. As reported in Figure 10a,b, the emission spectra obtained by exciting the samples at λex = 280 nm, present a typical maximum at 345 nm, with a spectral profile very similar to that of tryptophan, thus suggesting the presence of a large fluorescence contribution from proteins, enzymes, and free amino acids (mainly tryptophan residues). A second less intense emission band centered around 440–450 nm, which can be ascribed mostly to ferulic acid or to chlorogenic acid, has a very similar fluorescence profile (see Figure 6b and Figure 7a). A very good reproduction of these spectral profiles is obtained by including smaller contributions of 4-hydroxybenzoic, p-coumaric, and vanillic acids, which were found in these samples in smaller amounts by means of chromatographic methods [17]. Although ellagic acid was found only in acacia honey [17], it seems that its fluorescence contribution (see the typical asymmetric emission band centered at 420 nm, in Figure 5a) is not evident in our case. At larger excitation wavelengths, both acacia and marruca honey samples present emission profiles similar to other samples, such as clover and lavender honeys, with a typical band centered at 420–435 nm (λex = 340 nm) and 475–490 nm (λex = 420 nm). In previous FFF studies, the emission bands of acacia honey were explained with the presence of flavonoids [35] or Maillard reaction products [36]; however, our investigations [47] indicate that these compounds, with the exception of quercetin, have very low fluorescence emission. As shown for other honey samples, it is likely that vitamins may significantly affect fluorescence intensity of honey at λex > 330 nm.
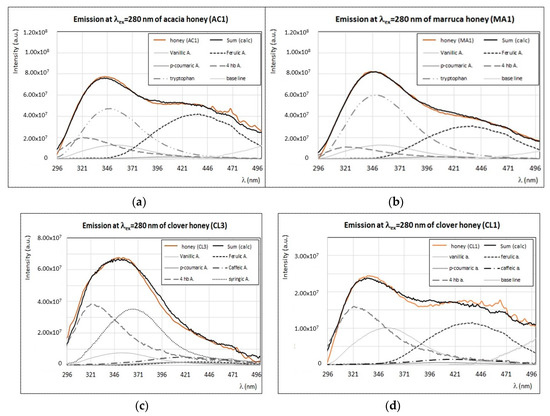
Figure 10.
Experimental (brown) and calculated (black) emission spectra (λex = 280 nm) of acacia honey—AC1 (a), marruca honey—MA1 (b), clover honey—CL3 (c), and CL1 (d) samples, with the contribution of main fluorophores as indicated in the legend. Intensity of emission and excitation spectra is scaled and reported in arbitrary units.
The case of clover honey, which was studied by fluorescence spectroscopy only in a previous paper dealing with honey from New Zealand [26], is rather significant. The emission spectra recorded by exciting at λex = 280 nm in our samples from Tuscany (CL1, CL2, and CL3) present different profiles with a common spectral feature: an emission band centered at 335–340 nm with a shoulder (more or less pronounced depending on the sample) around 320 nm (Figure 10c,d). This peak can be ascribed to 4-hydroxybenzoic acid (see Figure 6a), which was found in large amount in these samples [17,47]. Interestingly, the differences among the emission/excitation properties of these three clover honey samples can be explained by the different concentrations of caffeic, vanillic, ferulic, syringic, and p-coumaric acids, in agreement with the different phenolic profiles of the same clover honey samples determined by chromatographic techniques [17,47]. The good reproduction of the emission spectra of clover honey samples by using the sole phenolic acids’ spectral contributions is shown in Figure 10c,d. On the other hand, the presence of large amounts of phenolic acids is also confirmed by the very intense band (I) in the synchronous spectrum (see Figure 3).
To our knowledge, lavender honey was never investigated by fluorescence spectroscopy before. In Figure 11, the emission spectra of lavender honey from Tuscany (L1) obtained by exciting at λex = 280 nm (a) and at λex = 340 nm (b) are reported. The emission profile of lavender honey at λex = 280 nm (Figure 11a) is very similar to that of vanillic acid. A good reproduction of this spectrum can be indeed reached by using a combination of the emission spectra of vanillic and syringic acids, with the addition of smaller contributions from caffeic, p-coumaric, and 4-hydroxybenzoic acids. At higher exciting wavelengths, the emission intensity of lavender honey is much lower and broader than all other samples. For instance, the emission spectrum obtained at λex = 340 nm (Figure 11b) can be reproduced as a combination of emission spectra of vitamin B9 and quercetin, and smaller contributions from phenolic acids, such as caffeic and ferulic acids. As seen in Figure 3, the synchronous spectrum of lavender honey (Δλ = 20 nm) is different from all other samples, since it presents only the first defined band (I) and a broad band (III) without the second band (II). This is in agreement with the fact that only few fluorophores are present in lavender honey, such as the vanillic and syringic acids (responsible for band (I)) and vitamin B9 (responsible for band (III)).
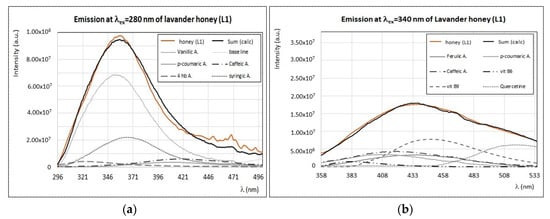
Figure 11.
Experimental (brown) and calculated (black) emission spectra of lavender honey—L1—by exciting at λex = 280 nm (a) and at λex = 340 nm (b), with the contribution of main fluorophores as indicated in the legend. Intensity of emission and excitation spectra is scaled and reported in arbitrary units.
4.3. Identification of Main Fluorophores in Sulla and Heather Honey
Sulla and heather honeys are typical of Tuscany and other regions of Italy [42]; their chemical composition and phenolic profiles were the objects of several studies [20,22,43,44,45], while front-face fluorescence investigations were performed on heather honey samples from other European countries only [35,36]. In the present study, fluorescence properties of these two types of monofloral honey showed similar features (Figure 2). For instance, emission spectra of sulla and heather honey obtained by exciting at 280–290 nm have a maximum smooth band centered at 410–420 nm (Figure 12).
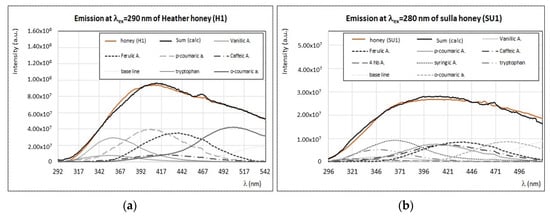
Figure 12.
(a) Experimental (brown) and calculated (black) emission spectra (λex = 290 nm) of heather honey (H1) with the contribution of main fluorophores as indicated in the legend. (b) Experimental (brown) and calculated (black) emission spectra (λex = 280 nm) of sulla honey (SU1) with the contribution of main fluorophores as indicated in the legend. Intensity of emission and excitation spectra is scaled and reported in arbitrary units.
A good spectral reproduction of these large bands is obtained by considering the contributions of several fluorophores with similar fluorescence intensities, but different positions of maximum emission. As shown in Figure 12, the best reproduction of the emission profile of both sulla and heather honey samples is obtained by considering proteins’ residues (i.e., tryptophan), vanillic, ferulic, syringic, p-coumaric, and o-coumaric acids. In particular, o-coumaric acid distinguishes from other phenolic acids, since it shows a maximum emission at ~500 nm, when excited at λex = 280–290 nm, as well as at λex = 330–340 nm (see Figure 7b). This compound could be indeed identified as a possible marker for these two botanic plants. The synchronous spectra of heather and sulla honeys (Δλ = 20 nm) present similar features (see Figure 3), with the sole difference that bands (I) and (II) of heather honey are more intense than those of sulla honey. The spectral profiles of these two honey samples are almost the same at λem > 375 nm (Figure 3), thus indicating a similar composition in terms of pigments and vitamins.
4.4. Identification of Main Fluorophores in Arbutus, Inula and Alfalfa Honey, and Forest Honeydew
Inula and alfalfa honeys are rare in Italy, however, a few local productions are known in Tuscany. Arbutus (or strawberry tree) honey is more common in Sardinia (Italy) and the chemical composition of arbutus honey from this region was reported in the literature [45]. Forest honeydew is produced in several area of Italy, but Tuscan forest honeydew was never studied before. All these samples are characterized by low intensity of fluorescence when excited at λex < 300 nm (see Figure 2) and this aspect is evident from the low intensity of band (I) in the synchronous spectra, too (Figure 3). Interestingly, at higher exciting wavelengths, these four samples present similar spectral emission features.
In Figure 13, the experimental emission spectra of these samples (AA1, FH1, AR1, and IN1) obtained by exciting at 340 nm are reported showing in all cases an emission band (or shoulder) at ~375 nm. This feature is distinctive of these honey samples, as seen in Figure 2b and Figure 13. Emission spectra of inula and arbutus honey, at λex = 340 nm, are very similar and a good reproduction is obtained by considering vitamin B6, vitamin B9, and quercetin as the main fluorophores (Figure 13a,c). In the case of alfalfa honey, the emission spectrum has a large band with a smooth maximum centered at 400 nm and a shoulder at 375 nm (Figure 13b), which can be reproduced with the same fluorophores than inula and arbutus honeys, but with a different relative contribution. Alfalfa honey is indeed obtained more in vitamin B6 and p-coumaric acid than others. Forest honeydew has the lowest fluorescence (Figure 13d), indicating a low content of bioactive compounds. Moreover, as shown in Figure 3, forest honeydew has a very low content of pigments and absence of chlorophyll derivatives. As a general feature, these samples seem to have very low content in phenolic acids and this aspect will be further investigated.
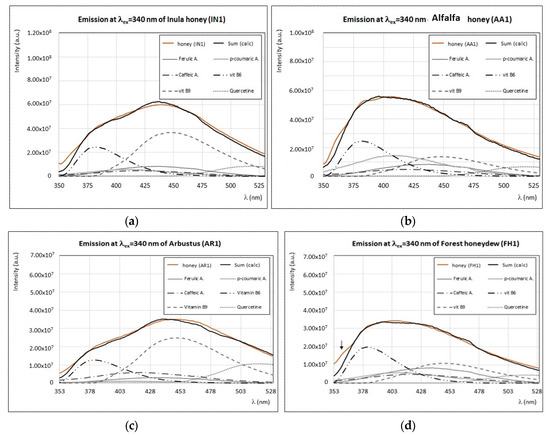
Figure 13.
Experimental (brown) and calculated (black) emission spectra (λex = 340 nm) of inula honey—IN1 (a), alfalfa honey—AA1 (b), arbutus—AR1 (c) honey samples, and forest honeydew—FH1 (d) samples, with the contribution of main fluorophores as indicated in the legend. Intensity of emission and excitation spectra is scaled and reported in arbitrary units.
5. Conclusions
In this work, we reported the first front-face fluorescence study of Italian honey samples. To our knowledge, this is the first fluorescence investigation of honey obtained from inula (Inula viscosa (L.) Aiton), marruca (Paliurus spina-christi Mill.), lavender (Lavandula L. 1753), sulla (Hedysarum coronarium L.), arbutus (or strawberry tree) (Arbutus unedo L., 1753), and alfalfa (Medicago sativa L.) plants.
Twelve different monofloral honey types produced in Tuscany were investigated focusing on the possibility of identifying the main fluorescent contributions from the analysis of the emission/excitation and synchronous spectra recorded on the honey samples, in the bulk, thus without sample treatments. In particular, in this work we reported a “semi-quantitative” approach to analyze the FFF spectrum of honey as the sum of different contributions of the main fluorophores’ components. This approach allowed us to identify a group of fluorophores for each honey sample investigated whose presence and relative concentrations determine the particular spectral FFF profile. The good reproduction of the emission spectra recorded on these samples as a linear combination of different fluorophores’ contributions is of help in the identification of specific bioactive compounds, such as vitamins B6, B9 and B2, phenolic acids, tryptophan residues, pigments, and flavonoids. In some cases (i.e., heather, marruca, sulla, acacia, clover, chestnut, and sunflower), our findings are in agreement with previous studies performed by more classical analytical methods. The spectral analysis proposed represents a step toward future quantitative analysis of FFF spectra for the identification and quantification of specific compounds, such as vitamin B9, vitamin B6, vitamin B2, and o-coumaric acid, whose presence and relative concentrations could be specific to botanic origin. This aspect will be the object of future research.
Author Contributions
Conceptualization, V.D.; data curation, E.P. and V.D.; formal analysis, E.P.; investigation, E.P., G.S., and V.D.; methodology, E.P., G.S., and V.D.; resources, V.D.; supervision, V.D.; validation, E.P.; writing—original draft, V.D; writing —review and editing, G.S. and V.D. All authors have read and agreed to the published version of the manuscript.
Funding
This research received no external funding.
Conflicts of Interest
The authors declare no conflicts of interest.
References
- Crane, E. The Archaeology of Beekeeping, 1st ed.; Cornell University Press: Ithica, NY, USA, 1981. [Google Scholar]
- Ramli, N.Z.; Chin, K.Y.; Zarkasi, K.A.; Ahmad, F. A Review on the Protective Effects of Honey against Metabolic Syndrome. Nutrients 2018, 10, 1009. [Google Scholar] [CrossRef] [PubMed]
- Cianciosi, D.; Forbes-Hernandez, T.Y.; Yuliett, T.; Afrin, S.; Gasparrini, M.; Reboredo-Rodriguez, P.; Manna, P.P.; Zhang, J.J.; Lamas, L.B.; Florez, S.M.; et al. Phenolic Compounds in Honey and Their Associated Health Benefits: A Review. Molecules 2018, 23, 2322. [Google Scholar] [CrossRef] [PubMed]
- Codex Alimentarius Commission. Revised Codex Standards for Honey. Codex Standard 12-1981, Rev. 2; Codex Alimentarius Commission: Rome, Italy, 2001. [Google Scholar]
- Kaskoniene, V.; Venskutonis, P. Floral markers in honey of various botanical and geographical origins: A review. Comp. Rev. Food Sci. Food Saf. 2010, 9, 620–634. [Google Scholar] [CrossRef]
- Louveaux, J.; Maurizio, A.; Vorwohl, G. Methods of melissopalynology. BEE World 1978, 59, 139–157. [Google Scholar] [CrossRef]
- Von der Ohe, W.; Persano Oddo, L.; Piana, M.L.; Morlot, M.; Martin, P. Harmonized methods of melissopalynology. Apidologie 2004, 35, 18–25. [Google Scholar] [CrossRef]
- Anklam, E. A review of the analytical methods to determine the geographical and botanical origin of honey. Food Chem. 1998, 63, 549–562. [Google Scholar] [CrossRef]
- Serrano, S.; Villarejo, M.; Espejo, R.; Jodral, M. Chemical and physical parameters of Andalusian honey: Classification of Citrus and Eucalyptus honeys by discriminant analysis. Food Chem. 2004, 87, 619–625. [Google Scholar] [CrossRef]
- Moralesa, V.; Corzoa, N.; Sanzb, M.L. HPAEC-PAD oligosaccharide analysis to detect adulterations of honey with sugar syrups. Food Chem. 2008, 107, 922–928. [Google Scholar] [CrossRef]
- Padovan, G.J.; De Jong, D.; Rodrigues, L.P.; Marchini, J.S. Detection of adulteration of commercial honey samples by the 13C/12C isotopic ratio. Food Chem. 2003, 82, 633–636. [Google Scholar] [CrossRef]
- Persano Oddo, L.; Piazza, M.G.; Sabatini, A.G.; Accorti, M. Characterisation of unifloral honeys. Apidologie 1995, 26, 453–465. [Google Scholar] [CrossRef]
- Patrignani, M.; Fagundez, G.A.; Tananaki, C.; Thrasyvoulou, A.; Lupano, C.E. Volatile compounds of Argentinean honeys: Correlation with floral and geographical origin. Food Chem. 2018, 246, 32–40. [Google Scholar] [CrossRef] [PubMed]
- Amiot, M.J.; Aubert, S.; Gonnet, M.; Tacchini, M. Les composés phénoliques des miels: Étude préliminaire sur l’identification et la quantification par familles. Apidologie 1989, 20, 115–125. [Google Scholar] [CrossRef]
- Martos, I.; Ferreres, F.; Yao, L.; Darcy, B.; Caffin, N.; Tomas-Barberan, F.A. Flavonoids in monospecific Eucalyptus honeys from Australia. J. Agric. Food Chem. 2000, 48, 4744–4748. [Google Scholar] [CrossRef] [PubMed]
- Ramanauskiene, K.; Stelmakiene, A.; Briedis, V.; Ivanauskas, L.; Jakštas, V. The quantitative analysis of biologically active compounds in Lithuanian honey. Food Chem. 2012, 132, 1544–1548. [Google Scholar] [CrossRef] [PubMed]
- Mattonai, M.; Parri, E.; Querci, D.; Degano, I.; Ribechini, E. Development and validation of an HPLC-DAD and HPLC/ESI-MS2 method for the determination of polyphenols in monofloral honeys from Tuscany (Italy). Microchem. J. 2016, 126, 220–229. [Google Scholar] [CrossRef]
- Özcan, M.M.; Ölmez, C. Some qualitative properties of different monofloral honeys. Food Chem. 2014, 163, 212–218. [Google Scholar] [CrossRef]
- Karabagias, I.K.; Vavoura, M.V.; Nikolaou, C.; Badeka, A.V.; Kontakos, S.; Kontominas, M.G. Floral authentication of Greek unifloral honeys based on the combination of phenolic compounds, physicochemical parameters and chemometrics. Food Res. Int. 2014, 62, 753–760. [Google Scholar] [CrossRef]
- Pichichero, E.; Canuti, L.; Canini, A. Characterisation of the phenolic and flavonoid fractions and antioxidant power of Italian honeys of different botanical origin. J. Sci. Food Agric. 2009, 89, 609–616. [Google Scholar] [CrossRef]
- Frausto-Reyes, C.; Casillas-Peñuelas, R.; Quintanar-Stephano, J.L.; Macías-López, E.; Bujdud-Pérez, J.M.; Medina-Ramírez, I. Spectroscopic study of honey from Apis mellifera from different regions in Mexico. Spectrosc. Acta Part A Mol. Biomol. Spectrosc. 2017, 178, 212–217. [Google Scholar] [CrossRef]
- Mignani, A.G.; Ciaccheri, L.; Mencaglia, A.A.; Di Sanzo, R.; Carabetta, S.; Russo, M.T. Dispersive Raman spectroscopy excited at 1064 nm to classify the botanic origin of honeys from Calabria and quantify the sugar profile. In Advanced Environmental, Chemical, and Biological Sensing Technologies XII; VoDinh, T., Lieberman, R.A., Gauglitz, G.G., Eds.; Book Series: Proceedings of SPIE; SPIE-INT Soc. Optical Engineering Publisher: Bellingham, WA, USA, 2015; Volume 9486, p. 94860E. [Google Scholar]
- Ghosh, N.; Verma, Y.; Majumder, S.K.; Gupta, P.K. A Fluorescence Spectroscopic Study of Honey and Cane Sugar Syrup. Food Sci. Technol. Res. 2005, 11, 59–62. [Google Scholar] [CrossRef]
- Ruoff, K.; Luginby, W.; Kunzlis, K.; Bogdanov, S.; Bosset, J.-O.; Von der Ohe, K.; Von der Ohe, W.; Amado, R. Authentication of the Botanical and Geographical Origin of Honey by Front-Face Fluorescence Spectroscopy. J. Agric. Food Chem. 2006, 54, 6858–6866. [Google Scholar] [CrossRef] [PubMed]
- Lenhardt, L.; Bro, R.; Zekovic, I.; Dramicanin, T.; Dramicanin, M.D. Fluorescence spectroscopy coupled with PARAFAC and PLS DA for characterization and classification of honey. Food Chem. 2015, 175, 284–291. [Google Scholar] [CrossRef] [PubMed]
- Bong, J.; Loomes, K.M.; Lin, B.; Stephens, J.M. New approach: Chemical and fluorescence profiling of NZ honeys. Food Chem. 2018, 267, 355–367. [Google Scholar] [CrossRef]
- Lastra-Mejíasa, M.; Torreblanca-Zanca, A.; Aroca-Santosa, R.; Cancilla, J.C.; Izquierdo, J.C.; Torrecilla, J.S. Characterization of an array of honeys of different types and botanical origins through fluorescence emission based on LEDs. Talanta 2018, 185, 196–202. [Google Scholar] [CrossRef] [PubMed]
- Strelec, T.; Brodar, L.; Flanjak, I.; Kenjerić, F.C.; Kovač, T.; Kenjerić, D.C.; Primorac, L. Characterization of Croatian Honeys by Right-Angle Fluorescence Spectroscopy and Chemometrics. Food Anal. Methods 2018, 11, 824–838. [Google Scholar] [CrossRef]
- Karoui, R.; Blecker, C. Fluorescence Spectroscopy Measurements for quality assessment of food systems—A review. Food Bioprocess Technol. 2011, 4, 364–386. [Google Scholar] [CrossRef]
- Lakowicz, J.R. Principles of Fluorescence Spectroscopy, 3rd ed.; Kluwer Academic/Plenum Publishers: New York, NY, USA, 2007; Chapter 3. [Google Scholar]
- Biluca, F.C.; Bernal, J.; Valverde, S.; Ares, A.M.; Gonzaga, L.V.; Costa, A.C.O.; Fett, R. Determination of Free Amino Acids in Stingless Bee (Meliponinae) Honey. Food Anal. Methods 2019, 12, 902–907. [Google Scholar] [CrossRef]
- Zandomeneghi, M.; Carbonaro, L.; Caffarata, C. Fluorescence of vegetable oils: Olive oils. J. Agric. Food Chem. 2005, 53, 759–766. [Google Scholar] [CrossRef]
- Gabriele, M.; Parri, E.; Felicioli, A.; Sagona, S.; Pozzo, L.; Biondi, C.; Domenici, V.; Pucci, L. Phytochemical composition and antioxidant activity of Tuscan bee pollen of different botanic origins. Ital. J. Food Sci. 2015, 27, 248–259. [Google Scholar]
- Gabriele, M.; Gerardi, C.; Lucejko, J.J.; Longo, V.; Pucci, L.; Domenici, V. Effects of low sulfur dioxide concentrations on bioactive compounds and antioxidant properties of Aglianico red wine. Food Chem. 2018, 245, 1105–1112. [Google Scholar] [CrossRef]
- Sergiel, I.; Pohl, P.; Biesaga, M.; Mironczyk, A. Suitability of three-dimensional synchronous fluorescence spectroscopy for fingerprint analysis of honey samples with reference to their phenolic profiles. Food Chem. 2014, 145, 319–326. [Google Scholar] [CrossRef] [PubMed]
- Karoui, R.; Dufour, E.; Bosset, J.-O.; De Baerdemaeker, J. The use of front face fluorescence spectroscopy to classify the botanical origin of honey samples produced in Switzerland. Food Chem. 2007, 101, 314–323. [Google Scholar] [CrossRef]
- Mehretie, S.; Al Riza, D.F.; Yoshito, S.; Kondo, N. Classification of raw Ethiopian honeys using front face fluorescence spectra with multivariate analysis. Food Control 2018, 84, 83–88. [Google Scholar] [CrossRef]
- Stanković, M.; Bartolić, D.; Šikoparija, B.; Spasojević, D.; Mutavdžić, D.; Natić, M.; Radotić, K. Variability estimation of the protein and phenol total content in honey using front-face fluorescence spectroscopy coupled with MCR-ALS analysis. J. App. Spectrosc. 2019, 86, 256–263. [Google Scholar] [CrossRef]
- Dramicanin, T.; Ackovic, L.L.; Zekovic, I.; Dramicanin, M.D. Detection of Adulterated Honey by Fluorescence Excitation-Emission Matrices. J. Spectrosc. 2018, 8395212. [Google Scholar] [CrossRef]
- Bong, J.; Loomes, K.M.; Schlothauer, R.C.; Stephens, J.M. Fluorescence markers in some New Zealand honeys. Food Chem. 2016, 192, 1006–1014. [Google Scholar] [CrossRef]
- Chen, Q.; Qi, S.; Li, H.; Han, X.; Ouyang, Q.; Zhao, J. Determination of rice syrup adulterant concentration in honey using three-dimensional fluorescence spectra and multivariate calibrations. Spectrosc. Acta Part A Mol. Biomol. Spectrosc. 2014, 131, 177–182. [Google Scholar] [CrossRef]
- Di Marco, G.; Manfredini, A.; Leonardi, D.; Canuti, L.; Impei, S.; Gismondi, T.; Canini, A. Geographical, botanical and chemical profile of monofloral Italian honeys as food quality guarantee and territory brand. Plant Biosyst. 2017, 151, 450–463. [Google Scholar] [CrossRef]
- Ballabio, D.; Robotti, E.; Grisoni, F.; Quasso, F.; Bobb, M.; Vercelli, S.; Gosetti, F.; Calabrese, G.; Sangiorgi, E.; Orlandi, M.; et al. Chemical profiling and multivariate data fusion methods for the identification of the botanical origin of honey. Food Chem. 2018, 266, 79–89. [Google Scholar] [CrossRef]
- Mannina, L.; Sobolev, A.P.; Anatoly, P.; Di Lorenzo, A.; Vista, S.; Tenore, G.C.; Daglia, M. Chemical Composition of Different Botanical Origin Honeys Produced by Sicilian Black Honeybees (Apis mellifera ssp sicula). J. Agric. Food Chem. 2015, 63, 5864–5874. [Google Scholar] [CrossRef]
- Scanu, R.; Spano, N.; Panzanelli, A.; Pilo, M.I.; Piu, P.C.; Sanna, G.; Tapparo, A. Direct chromatographic methods for the rapid determination of homogentisic acid in strawberry tree (Arbutus unedo L.) honey. J. Chrom. A 2005, 1090, 76–80. [Google Scholar] [CrossRef] [PubMed]
- Spettoli, P.; Bottacin, A.; Pescia, P.; Girolami, V. Physical-chemical characteristics of Tuscan honeys from Erica-Arborea. Ind. Aliment. 1982, 21, 617–620. [Google Scholar]
- Parri, E. Analisi di Component Minoritari in Mieli Uniflorali Toscani Mediante Tecniche Cromatografiche e Spettroscopiche. Master’s Thesis, University of Pisa, Pisa, Italy, 2014. [Google Scholar]
- Parri, E.; Lenzi, A.; Cifelli, M.; Restivo, A.; Degano, I.; Ribechini, E.; Zandomeneghi, M.; Domenici, V. Studio di mieli toscani monoflorali mediante tecniche chimiche cromatografiche e spettroscopiche. In Codice Armonico 2014 Quinto Congresso di Scienze Naturali Ambiente Toscano; Edizioni ETS: Pisa, Italy, 2014; pp. 159–169. ISBN 9788846738899. [Google Scholar]
- Zandomeneghi, M. Fluorescence of Cereal Flours. J. Agric. Food Chem. 1999, 47, 878–882. [Google Scholar] [CrossRef] [PubMed]
- Vo-Dinh, T. Synchronous luminescence spectroscopy. In Modern Fluorescence Spectroscopy; Wehry, E.L., Ed.; Plenum Press: New York, NY, USA; London, UK, 1981; pp. 169–191. [Google Scholar]
- Domenici, V.; Ancora, D.; Cifelli, M.; Serani, A.; Veracini, C.A.; Zandomeneghi, M. Extraction of Pigment Information from Near-UV Vis Absorption Spectra of Extra Virgin Olive Oils. J. Agric. Food Chem. 2014, 62, 9317–9325. [Google Scholar] [CrossRef]
- Dreuw, A.; Fleming, G.R.; Head-Gordon, M. Role of electron-transfer quenching of chlorophyll fluorescence by carotenoids in non-photochemical quenching of green plants. Biochem. Soc. Trans. 2005, 33, 858–862. [Google Scholar] [CrossRef] [PubMed]
- Krause, G.H.; Weis, E. Chlorophyll Fluorescence and Photosynthesis: The Basics. Annu. Rev. Plant Physiol. Plant Mol. Biol. 1991, 42, 313–349. [Google Scholar] [CrossRef]
- Jasicka-Misiak, I.; Gruyaert, S.; Poliwoda, A.; Kafarski, P. Chemical Profiling of Polyfloral Belgian Honey: Ellagic Acid and Pinocembrin as Antioxidants and Chemical Markers. J. Chem. 2017, 2017, 5393158. [Google Scholar] [CrossRef]
- Cheung, Y.; Meenu, M.; Yu, X.; Xu, B. Phenolic acids and flavonoids profiles of commercial honey from different floral sources and geographic sources. Int. J. Food Prop. 2019, 22, 290–308. [Google Scholar] [CrossRef]
- Leon-Ruiz, V.; Vera, S.; Gonzalez-Porto, A.V.; San Andres, M. Analysis of Water-Soluble Vitamins in Honey by Isocratic RP-HPLC. Food Anal. Meth. 2013, 6, 488–496. [Google Scholar] [CrossRef]
- Kivrak, S. Determination of B-group vitamins in Turkish honey using ultra-performance liquid chromatography with electrospray ionization coupled to tandem mass spectrometry. J. Liq. Chrom. Rel. Technol. 2016, 39, 847–851. [Google Scholar] [CrossRef]
© 2020 by the authors. Licensee MDPI, Basel, Switzerland. This article is an open access article distributed under the terms and conditions of the Creative Commons Attribution (CC BY) license (http://creativecommons.org/licenses/by/4.0/).

