Article

EEG-Based Emotion Recognition Using Logistic Regression with Gaussian Kernel and Laplacian Prior and Investigation of Critical Frequency Bands

1
School of Computer Science and Technology, Xidian University, Xi’an 710071, China
2
School of Electronic Engineering, Xidian University, Xi’an 710071, China
3
College Counselor Reach Perfection with Morality Studio of Shaanxi Province, Xi’an 710071, China
4
School of Computer Science and Engineering, Xi’an University of Technology, Xi’an 710048, China
5
Undergraduate School, Xidian University, Xi’an 710071, China
6
State Key Laboratory of Integrated Services Networks, Xi’an 710071, China
*
Author to whom correspondence should be addressed.
Appl. Sci. 2020, 10(5), 1619; https://doi.org/10.3390/app10051619
Submission received: 2 February 2020 / Revised: 21 February 2020 / Accepted: 25 February 2020 / Published: 29 February 2020
(This article belongs to the Special Issue Ubiquitous Technologies for Emotion Recognition)

Abstract

:
Emotion plays a nuclear part in human attention, decision-making, and communication. Electroencephalogram (EEG)-based emotion recognition has developed a lot due to the application of Brain-Computer Interface (BCI) and its effectiveness compared to body expressions and other physiological signals. Despite significant progress in affective computing, emotion recognition is still an unexplored problem. This paper introduced Logistic Regression (LR) with Gaussian kernel and Laplacian prior for EEG-based emotion recognition. The Gaussian kernel enhances the EEG data separability in the transformed space. The Laplacian prior promotes the sparsity of learned LR regressors to avoid over-specification. The LR regressors are optimized using the logistic regression via variable splitting and augmented Lagrangian (LORSAL) algorithm. For simplicity, the introduced method is noted as LORSAL. Experiments were conducted on the dataset for emotion analysis using EEG, physiological and video signals (DEAP). Various spectral features and features by combining electrodes (power spectral density (PSD), differential entropy (DE), differential asymmetry (DASM), rational asymmetry (RASM), and differential caudality (DCAU)) were extracted from different frequency bands (Delta, Theta, Alpha, Beta, Gamma, and Total) with EEG signals. The Naive Bayes (NB), support vector machine (SVM), linear LR with L1-regularization (LR_L1), linear LR with L2-regularization (LR_L2) were used for comparison in the binary emotion classification for valence and arousal. LORSAL obtained the best classification accuracies (77.17% and 77.03% for valence and arousal, respectively) on the DE features extracted from total frequency bands. This paper also investigates the critical frequency bands in emotion recognition. The experimental results showed the superiority of Gamma and Beta bands in classifying emotions. It was presented that DE was the most informative and DASM and DCAU had lower computational complexity with relatively ideal accuracies. An analysis of LORSAL and the recently deep learning (DL) methods is included in the discussion. Conclusions and future work are presented in the final section.

1. Introduction

Affective computing defined by Picard [1] is a multidisciplinary research field that relates to computer science, psychology, neuroscience, and cognitive science. Levenson [2] believed that during natural selection, emotions were preserved for the necessity of rapid response mechanisms when facing different environmental threats. Emotion plays a nuclear role in human behavior, such as perception, attention, decision-making, and communication [3]. Positive emotions contribute to healthy life and efficient work, while negative emotions may result in health problems [4].
Emotion recognition methods include two main categories, according to the methods humans communicate emotions, including body expressions, and physiological signals. Body expressions are physical manifestations and easy to be collected. Theorists argue that each emotion corresponds to its unique somatic response [1]. However, human physical manifestations are easily affected by the user’s cultural background and social environment [4]. The physiological signals [3,4] are internal signals, such as electroencephalogram (EEG), electrocardiogram (ECG), heart rate (HR), electromyogram (EMG), and galvanic skin response (GSR). According to Connon’s theory [5], the emotion changes are associated with quick responses in physiological signals coordinated by the autonomic nervous systems (ANS). This makes the physiological signals not easily controlled and overcome the shortcomings of body expressions [4]. Physiological signals have been widely applied in many studies for emotion recognition [3,4]. These physiological signals, including ECG and EMG, are still not a direct reaction to emotion changes. According to psychology and neurophysiology, emotion generation and activity have a close relationship with the activity of the cerebral cortex. Thus, EEG signals effectively reflect the brain electrical activity, and have been widely applied in many fields, including cognitive performance prediction [6], mental load analysis [7,8], mental fatigue assessment [9], recommendation system [10] and decoding visual stimuli [11,12].
Recently, the field of EEG-based emotion recognition has attracted a lot of interest, including Brain-Computer Interaction (BCI) systems, basic emotion theories, and machine learning algorithms [13,14]. In machine learning, the definition of the emotion model is necessary to describe the objective function of the algorithms. There are mainly two kinds of models [3], discrete emotion spaces and continuous emotion models. Among these models, the valence-arousal model by Russell [15] has been widely used in emotion recognition for its simplicity to establish assessment criteria. The progress of EEG-based emotion recognition also includes feature extraction, feature selection, dimension reduction, and classification algorithms [13,14]. After the pre-processing of original EEG signals, the current work is to extract and select informative features to enhance the discriminative signal characteristics. Traditionally, feature extraction and selection are based on neuroscience and cognition science [16]. For example, frontal asymmetry in Alpha band power for differentiating valence level has attracted lots of interest in neuroscience research [17]. Besides neuro-scientific assumptions, computation methods in machine learning are also applied for feature extraction and selection in EEG-based emotion recognition [16,18]. Several studies transformed the pre-processed EEG-signal into various analysis domains, including time, frequency, statistical, and spectral domains [19]. It should be noted that only one feature extraction method is not suitable for various applications and BCI systems [19]. Although the most informative EEG features for emotion classification are still being researched, the power features obtained from different bands are widely recognized as the most popular features. In these studies [20,21,22], power spectral density (PSD) from EEG signals worked well for identifying emotional states. However, feature extraction usually generates high-dimensional and abundant features. Feature selection and dimension reduction are necessary to avoid over-specification and to reduce computational burden [3]. Compared to filter and wrapper methods for feature selection, the dimension reduction methods, e.g., principal component analysis (PCA), and Fisher linear discriminant (FLD), are more efficient. For further information about feature selection and dimension reduction, we refer the reader to [23,24]. Many machine learning algorithms have been introduced as EEG-based emotion classifiers, such as support vector machine (SVM) [25,26], Naive Bayes (NB) [27], K-nearest neighbors (KNN), linear discriminant analysis (LDA), random forest (RF), and artificial neural networks (ANN). Among these methods, SVM based on spectral features, e.g., PSD, is the most widely applied approach. In [25], SVM was used to classify the joy, sadness, anger, and pleasure feelings based on the EEG signals from 12 symmetric electrodes pairs. SVM was used in [26] for emotion recognition with the accuracies 32% and 37% in valence and arousal dimensions, respectively. A Gaussian NB in [27] was used to classify low/high valence, and arousal emotion with precision of 57.6% and 62.0%, respectively.
Recently, deep learning (DL) methods have been introduced for EEG-based emotion classification [28,29]. The study [30,31] proposed deep belief network (DBN) to discriminate positive, neutral, and negative emotions. The experimental results show that DBN performs better than SVM and KNN. In [32], after an effective pre-processing method instead of traditional feature extraction methods, a hybrid neural network combining convolutional neural network (CNN) and recurrent neural network (RNN) is proposed to learn spatial-temporal representation from the pre-processed EEG recordings. The proposed pre-processing strategy improves the emotion recognition accuracies by about 33% and 30% for valence and arousal dimensions, respectively. In [33], a deep CNN (DCNN) model is introduced to learn discriminative representations from the combined features in the raw time domain, after normalization, and in the frequency domain. The obtained emotion classification accuracies are higher than the traditionally best bagging tree (BT) classifier. The study [34] proposed a hierarchical bidirectional gated recurrent unit (GRU) network with an attention mechanism. The proposed scheme learned more significant representation from EEG sequences and the accuracies obtained on cross-subject emotion classification task outperformed the long short time memory (LSTM) network by 4.2% and 4.6% in valence and arousal dimensions, respectively. Compared to traditional shallow methodologies, the DL models remove the signal pre-processing and feature extraction/selection progress, and are more suitable for affective representation [35,36]. However, the DL methods cannot reveal the relationship between emotional states and EEG signals for being like a black box [37]. Moreover, the training of DL networks is extremely computationally time-consuming, which limits their practical applications in real-time emotion recognition [3].
As aforementioned, the field of affective computing has developed a lot over the past several years, including the incorporation of DL methodologies. However, the modeling and recognition of emotional states is still an unexplored problem [13,14]. EEG-based emotion recognition is still faced with several challenges, including fuzzy boundaries between emotions.
Note that logistic regression (LR) [38] has been widely used as a statistical learning model in pattern recognition and machine learning, as well as in EEG signal processing. In [39], LR trained with EEG power spectral features was used for automatic epilepsy diagnosis. The work in [40] further used wavelet transform to extract effective representation from non-stationary EEG records and adopted LR as a classifier to identify epileptic and non-epileptic seizures. In [41], regularized linear LR was trained using the raw EEG signal without feature extraction to classify imaginary movements. In [42], LR with L2-penalization to avoid overfitting was trained using spectral power features from intracranial EEG (iEEG) signals for the analysis of the brain’s encoding states and memory performance. The study in [43] further incorporated t-distributed stochastic neighbor embedding (tSNE) for dimension reduction of iEEG signals, and the learned L2-regularized LR classier was used for predicting memory encoding success. Despite the above studies, the potential of the LR model for EEG-based emotion recognition is still not fully explored.
In this present study, we systematically introduced the logistic regression (LR) algorithm with Gaussian kernel and Laplacian prior [44,45,46] for EEG-based emotion recognition. Different from these LR classifiers, Gaussian radial basis function (RBF) kernel was used to enhance the data separability in the transformed space [46]. Moreover, Laplacian prior promoting the sparsity of logistic regressors was acted as L1-regularization [44]. This prior forces many components of logistic regressors to be zero. Thus, the learned logistic regressors with sparseness control the complexity of the LR classifier and consequently avoids over-specification in EEG-based emotion recognition. The logistic regression via variable splitting and augmented Lagrangian (LORSAL) algorithm [45] was introduced to optimize the logistic regressors for lower computational complexity. Thus, the introduced LR method is abbreviated as LORSAL. For overall evaluation of the LORSAL classifier, various power spectral features and features calculated by combinations of electrodes were used as input for the classifiers. The conventional NB, SVM, linear LR with L1-regularization (LR_L1), linear LR with L2-regularization (LR_L2) were used for comparison to evaluate the performance of the LORSAL classifier. This paper also presents an investigation of critical frequency bands [47,48] and an analysis of the effect of extracted features for EEG-based emotion classification.
The rest of this paper is organized as follows. Section 2 presents the materials and methods, including the dataset for emotion analysis using EEG, physiological and video signals (DEAP), various features extracted from the EEG signals, the introduced LR model with Gaussian kernel and Laplacian prior, and the LORSAL algorithm to learn LR regressors. The experimental results are shown in Section 3. The introduced method is evaluated in the task of subject-dependent emotion recognition in valence and arousal dimensions, and the compared methods include NB, SVM, LR_L1, and LR_L2. Section 4 gives the discussion and a further comparison of LORSAL and the DL methods. Related conclusion and future work are presented in Section 5.

2. Materials and Methods

2.1. DEAP Dataset and Pre-Processing

This study was performed on the dataset DEAP developed by researchers at Queen Mary University of London [27]. This dataset is publicly available (http://www.eecs.qmul.ac.uk/mmv/ datasets/deap/index.html) and consists of multimodal physiological signals for human emotion analysis. It contains, in total, 32 EEG-channel recordings and eight peripheral signals of 32 subjects (50 percent females, aged between 19 and 37). The carefully selected 40 1-min videos were used as emotion elicitation materials [27]. As shown in Figure 1, the 2D valence-arousal emotion model by Russell [15] was used to quantitatively describe emotional states. The first dimension, valence, ranges from unpleasant to pleasant, and the second dimension, arousal, changes from bored to excited. Therefore, the valence-arousal model can describe most variations in human emotion changes. The well-known self-assessment manikins (SAM) [49] (shown in Figure 2) were adopted for self-assessment along the valence and arousal dimensions, and the corresponding discrete rating values change from 1 to 9, which can be used as identification labels in emotion analysis tasks [27]. In this paper, the first 32-channel EEG records (marker in Figure 3) in the DEAP dataset preprocessed in MATLAB format were used. The EEG signals were preprocessed by down-sampling from 512 Hz to 128 Hz, and then band-pass filtering with 4–45 Hz.
In this work, two different binary classification problems were posed for subject-dependent emotion recognition: The discrimination of low/high valence (LV/HV), and low/high arousal (LA/HA). The subjects’ ratings (scaling from 1 to 9) by SAM in the experiments [27] were used as the ground truth and the threshold was selected as 5 to divide the rating values into two categories: LV/HV and LA/HA. The time duration of one trail for each subject in the preprocessed EEG sequences is 63 s, in which the first 3 s are baseline signals before watching video elicitations. The 3 s sequences were removed to obtain the stimulus-related dynamics. The remaining 60-s EEG signals (thus, 7680 readings in each EEG channel, in total) were segmented into sixty 1 s epochs. Thus, there were 40 * 60 EEG epochs, in total, for each participant. Each subject-dependent EEG data had a dimensionality of 128 (sampling points) * 32 (EEG channels) * 2400 (EEG epochs). Finally, we obtained the labeled EEG signals with the dimension of 2400 for each subject. In this paper, for each subject, 10% of labeled epochs were used to train the emotion classifier, and the remaining 90% for test. For example, the constructed EEG dataset for the first participant consisted of 960 LV and 1440 HV epochs. Then, 10% of samples were randomly selected from LV and HV samples, respectively, and 240 epochs were selected for training. Ten-fold cross-validation was used to evaluate the introduced LORSAL classifier, and the compared traditional methods.

2.2. Feature Extraction

In this study, various power spectral features in the frequency domain and features calculated by combinations of electrodes were extracted from the constructed EEG signals. The extraction of prominent statistical characteristics is important for emotion recognition. The physiological signals, e.g., EEG, are characterized with high complexity and non-stationarity, and power spectral density (PSD) [20,21,22] from different frequency bands is the most well-known applicable statistical feature in the task of emotion analysis. This benefits from the assumption that EEG signals are stationary for the duration of a trail [50]. Many studies in neuroscience and psychology [51] suggest that these five frequency bands are closely linked to psychological activities, including the emotion activity: Delta (1 Hz–3 Hz), Theta (4 Hz–7 Hz), Alpha (8 Hz–13 Hz), Beta (14 Hz–30 Hz), and Gamma (31–50 Hz). The fast Fourier transform (FFT) can be applied using discrete Fourier transform (DFT) [52], while the common alternatives are short-time Fourier transform (STFT) [53,54]. PSD features are extracted from the above five frequency bands using 256-point STFT and a sliding 0.5 s Hanning window with 0.25 s overlapping along 1 s epoch for each EEG channel.
Differential entropy (DE) [55,56] is a measurement of the complexity of a continuous random variable by extending the Shannon entropy concept [57]. These studies by Zheng et al. [47,48] and Duan et al. [56] introduced DE for emotion classification using EEG low/high-frequency patterns.
The original formula of DE is defined as
h ( X ) = X f ( x ) log ( f ( x ) ) d x ,
and DE when a random variable X obeys the Gaussian distribution N(μ, σ2) can be simply given as:
h ( X ) = + 1 2 π σ 2 exp ( x μ ) 2 2 σ 2 log 1 2 π σ 2 exp ( x μ ) 2 2 σ 2 d x = 1 2 log 2 π e σ 2 ,
where π and e are constants. According to [55], given a certain frequency band, DE equals to the logarithmic spectral energy for a fixed-length EEG recording. Thus, the DE features are calculated in the five frequency bands as for the PSD features.
In the literature [58,59], the asymmetric brain activity between the left and right hemispheres is of high relation with emotions. In the studies [47,48], the differential asymmetry (DASM) and rational asymmetry (RASM) features were defined as the differences and ratios of the DE features of hemisphere asymmetric electrodes. Here, 14 pairs of asymmetric electrodes are selected to calculate DASM and RASM: Fp1-Fp2, F7-F8, F3-F4, T7-T8, P7-P8, C3-C4, P3-P4, O1-O2, AF3-AF4, FC5-FC6, FC1-FC2, CP5-CP6, CP1-CP2, and PO3-PO4. The DASM and RASM features are given as
DASM = DE ( X l e f t ) DE ( X r i g h t ) ,
and
RASM = DE ( X l e f t ) / DE ( X r i g h t )
respectively. Due to the studies suggested in [58,59], the emotional states are closely linked to the spectral differences of brain activity between frontal and posterior brain regions. The definition of differential caudality (DCAU) features [47,48] was also adopted in this paper to characterize the spectral asymmetry in frontal-posterior direction. The DCAU features are given as the differences between 11 pairs of frontal-posterior electrodes: FC5-CP5, FC1-CP1, FC2-CP2, FC6-CP6, F7-P7, F3-P3, Fz-Pz, F4-P4, F8-P8, Fp1-O1, Fp2-O2. The formulation of DCAU is defined as
DCAU = DE ( X f r o n t a l ) DE ( X p o s t e r i o r ) .
The dimensions of the PSD, DE, DSAM, RASM, and DCAU features are 160 (32 channels * 5 bands), 160 (32 channels * 5 bands), 70 (14 pairs of electrodes * 5 bands), 70 (14 pairs of electrodes * 5 bands), 55 (11 pairs of electrodes * 5 bands), respectively. For simplicity, the above-extracted features were used directly and separately as input for the introduced and compared recognition methods.

2.3. Logistic Regression with Gaussian Kernel and Laplacian Prior

Logistic regression (LR) has been a common statistical learning model in pattern recognition and machine learning [38]. Strictly speaking, the applications of LR in EEG signal analysis is not new, as illustrated in the above introduction [39,40,41,42,43]. Despite this, the potential of the LR model for EEG-based emotion recognition has not been fully exploited. In this paper, we systematically introduced the logistic regression (LR) algorithm with Gaussian kernel and Laplacian prior [44,45,46] for emotion recognition with EEG signals.
The goal of a supervised learning algorithm is to train a classifier using training samples in order to recognize the label of an input feature vector from different classes. In EEG-based emotion recognition, the major task is to assign the input EEG signals to one of the given classes. Especially in this study, two binary classification problems were posed for subject-dependent emotion recognition: The classification of LV/HV emotions, and LA/HA emotions.
Using a multinomial LR (MLR) model [38,44], the probability that the input feature xi belongs to emotion class k is written as
p ( y i = k | x i , w ) = exp ( w ( k ) h ( x i ) ) k = 1 K exp ( w ( k ) h ( x i ) ) ,
where xi is the feature vector extracted from the original EEG sequences, and h(xi) indicates a vector of functions of the input feature vector xi, and w [ w ( 1 ) T , , w ( K ) T ] T is the logistic regressors. For binary classification tasks (K = 2), this is known as LR model, for K > 2, the usual designation is MLR [44]. Although emotion recognition in this paper is binary classification, the formula of MLR is presented here for completeness. On one hand, this does not affect the understanding of the model, on the other hand, this makes it easy to extend to the cases when handling multiple emotion classes.
Note that the function h(xi) can be linear or nonlinear. For the latter case, kernel functions can be selected to further enhance the separability of extracted features in the transformed space. In this study, the Gaussian kernel is utilized, given by
K ( x i , x j ) = exp ( x i x j / ( 2 ρ 2 ) ) ,
In this paper, the training of the LR classifier using labeled EEG epochs amounts to estimate the class densities and learn the logistic regressor w. Following the formulation of the sparse MLR (SMLR) algorithm in [44], the solution of w is given by the maximum a posteriori (MAP) estimate
w ^ = arg max w ( w ) + log p ( w ) ,
where ( w ) indicates the log-likelihood function given as following:
( w ) = log i = 1 L p ( y i | x i , w ) ,
where L denotes the number of training samples, and
p ( w ) exp ( λ w 1 ) ,
denotes the Laplacian prior, where w 1 indicates the L1 norm of w, and l is the regularization parameter. The Laplacian prior forces the sparsity on the logistic regressors w, and promote many components of w equal to zero [45,46]. The obtained sparse regressor reduces the complexity of the LR classifier and, therefore, avoids over-specification in EEG-based emotion classification.
The convex problem in Equation (8) is difficult to optimize for the nonquadratic property of the term ( w ) and the non-smoothness of the term logp(w). The studies in [44,60] decomposed the problem in Equation (8) into a sequence of quadratic problems using a majorization-minimization scheme [61]. The SMLR algorithm optimizes each quadratic problem with the complexity of O(((L + 1)K)3) [44]. The fast SMLR (FSMLR) [62] is more efficient by applying a block-based Gauss–Seidel iterative procedure to estimate w. Thus, the FSMLR algorithm is K2 faster than SMLR with the complexity of O((L + 1) 3K).
In this work, the logistic regression via variable splitting and augmented Lagrangian (LORSAL) [45] algorithm is introduced to solve the LR regressors in Equation (8). LORSAL has been proposed for hyperspectral image classification (HSI) in remote sensing community [45,46]. The complexity of LORSAL is O((L + 1) 2K) for each quadratic problem, compared to the O(((L + 1)K)3) and O((L + 1) 3K) complexities of the SMLR and FSMLR algorithms. Note that in this paper, we might use LORSAL directly to indicate the introduced LR with Gaussian kernel and Laplacian prior.

3. Experimental Results

In this work, we systematically investigated the classification performance of the introduced LORSAL method compared with four classifiers, Naive Bayes (NB) [27], support vector machine (SVM) [25,26], linear LR with L1-regularization (LR_L1), linear LR with L2-regularization (LR_L2) for the binary classification of the LV/HV and LA/HA emotional states. These features, including PSD, DE, DASM, RASM, and DCAU, were extracted from the EEG-signals and used directly as inputs for the classifier. The NB in MATLAB was employed as in [27]. The LIBLINEAR [63] software was adopted for the implementation of the LR_L1, and LR_L2 classifiers, respectively, with the default cost parameter. The LIBSVM [64] tool was utilized to implement the SVM classifier by using the linear kernel with default parameters. For simplicity, the parameters for Gaussian kernel and Laplacian prior in the LORSAL method were set as default in [46]. Such parameter settings may be not optimal for EEG-based emotion recognition, but present ideal classification performance in the experiments.

3.1. Overall Classification Accuracy

The mean accuracies and standard deviations obtained by different classifiers in valence dimension for different features extracted from five frequency bands (Delta, Theta, Alpha, Beta, and Gamma) and the total frequency bands are tabulated in Table 1. It should be noted that ‘Total’ in Table 1 denotes the features by concatenating all different features from all frequency bands. Given the same features extracted from the EEG signals, the accuracy metrics of the black bold font in Table 1 indicate the highest accuracies obtained by different classifiers for each frequency band, while the precision metrics with gray background denote the highest precisions obtained by compared methods for all kinds of frequency bands. The LORSAL methods obtained the highest accuracy of 77.17% for the DE feature from the total frequency bands among all the compared classifiers. Under the same case, the highest classification accuracy obtained by SVM is 69.55%, while the best accuracy by NB is 62.36% for the DASM feature from the total frequency bands.
The SVM classifier is the most widely applied approach based on spectral features, especially PSD. Table 1 shows that the performance of SVM is second only to LORSAL on all features extracted from total frequency bands, and the corresponding accuracies are 69.04%, 69.55%, 64.48%, 48.17%, and 63.48% for the PSD, DE, DASM, RASM, and DCAU features. In study [27], the NB classifier obtained an accuracy of 57.6% in the valence dimension. In this study, the mean precisions obtained by NB are approximately between 60% and 62% for the PSD, DE, DASM, and DCAU features from the total frequency bands.
However, the best accuracies obtained by LR_L1 and LR_L2 are approximately 46%, which is significantly lower than those obtained by NB, SVM, and LORSAL. Although the LR_L1 and LR_L2 adopted L1-regularization and L2-regularization during the optimization of LR regressors to avoid over-specification, the assumption of linear separability does not hold for the extracted features from EEG signals. The average precisions obtained by the LORSAL have significant improvement over these by LR_L1 after incorporating the Gaussian kernel. The Gaussian kernel can enhance the data separability in the transformed space and meanwhile, the Laplacian prior can promote sparsity on the learned LR regressor and avoid over-specification of the selected training EEG epochs.
For the classification task of LV/HV emotions, the LORSAL methods present the best classification accuracies, 77.17%, 71.63%, and 69.89% on the DE, DASM, and DCAU features from total frequency bands, which are higher than SVM by about 8%, 7%, and 6%. The SVM and NB classifiers perform best by accuracies 69.04% and 55.65% on the PSD and RASM features from ‘Total’ bands, respectively. As is shown in Table 2, the performance of the five classifiers on classifying LA/HA emotions is similar to the case of LV/HV classification. The introduced LORSAL method performed best on the DE, DASM, and DCAU features from ‘Total’ bands, and the corresponding accuracies outperformed these of SVM by about 7%, 9%, and 8%. In addition, the performance of LORSAL was obviously better than that of the compared LR_L1, and LR_L2 methods in the arousal dimension. The incorporated Gaussian kernel and Laplacian prior improved the distinguishing ability of LORSAL in emotion recognition task based on EEG signals.
For a more comprehensive comparison of the NB, SVM, and LORSAL approaches, Table 3 tabulated the average values and standard deviations of precision, recall, and F1, for the binary emotion classification problem of LV/HV and LA/HA, respectively, when different features were extracted from the total frequency bands. The introduced LORSAL method obtained the best precisions (77.17%/6.37% for LV/HV, and 77.03%/6.20% for LA/HA), the best recalls (76.79%/6.21% for LV/HV, and 76.15%/6.14% for LA/HA), and the best F1 values (76.90%/6.27% for LV/HV, and 76.47%/6.14% for LA/HA), for EEG-based emotion recognition. In summary, the above analysis suggests the application of LORSAL on the DE features extracted from ‘Total’ bands for EEG-based emotion recognition. For simplicity, we will focus on comparing the performance of LORSAL with NB and SVM in the following subsections.

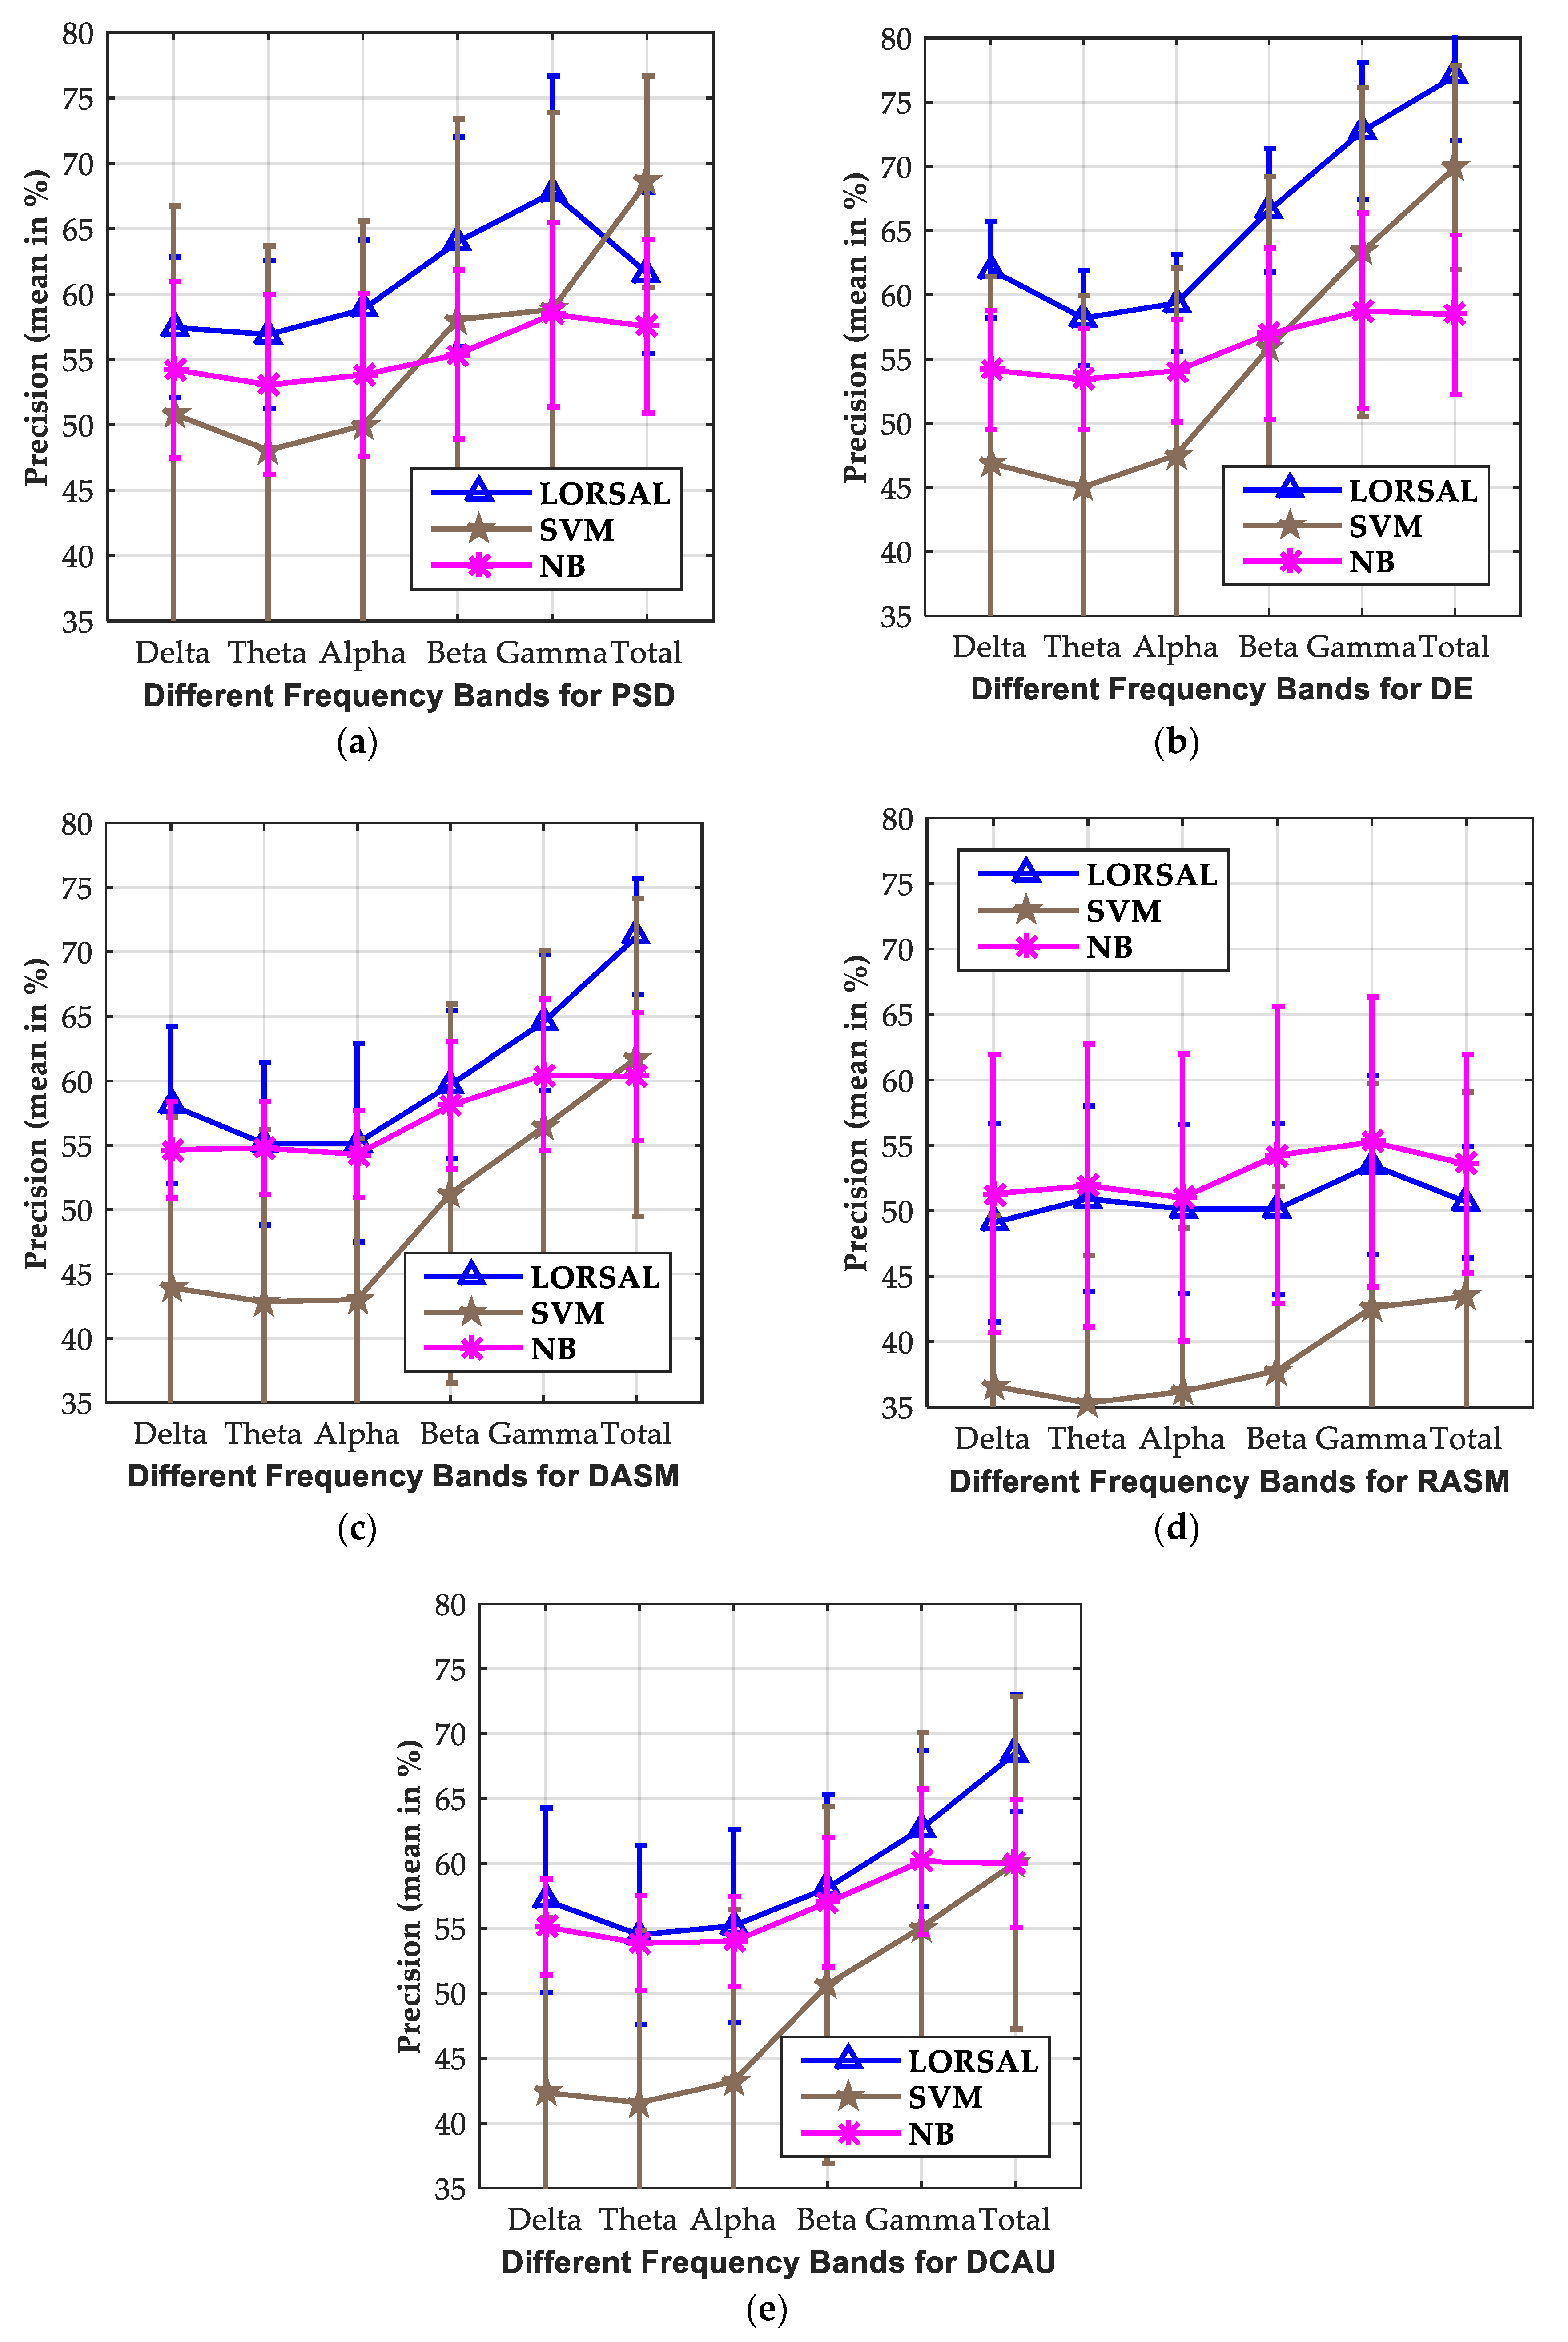
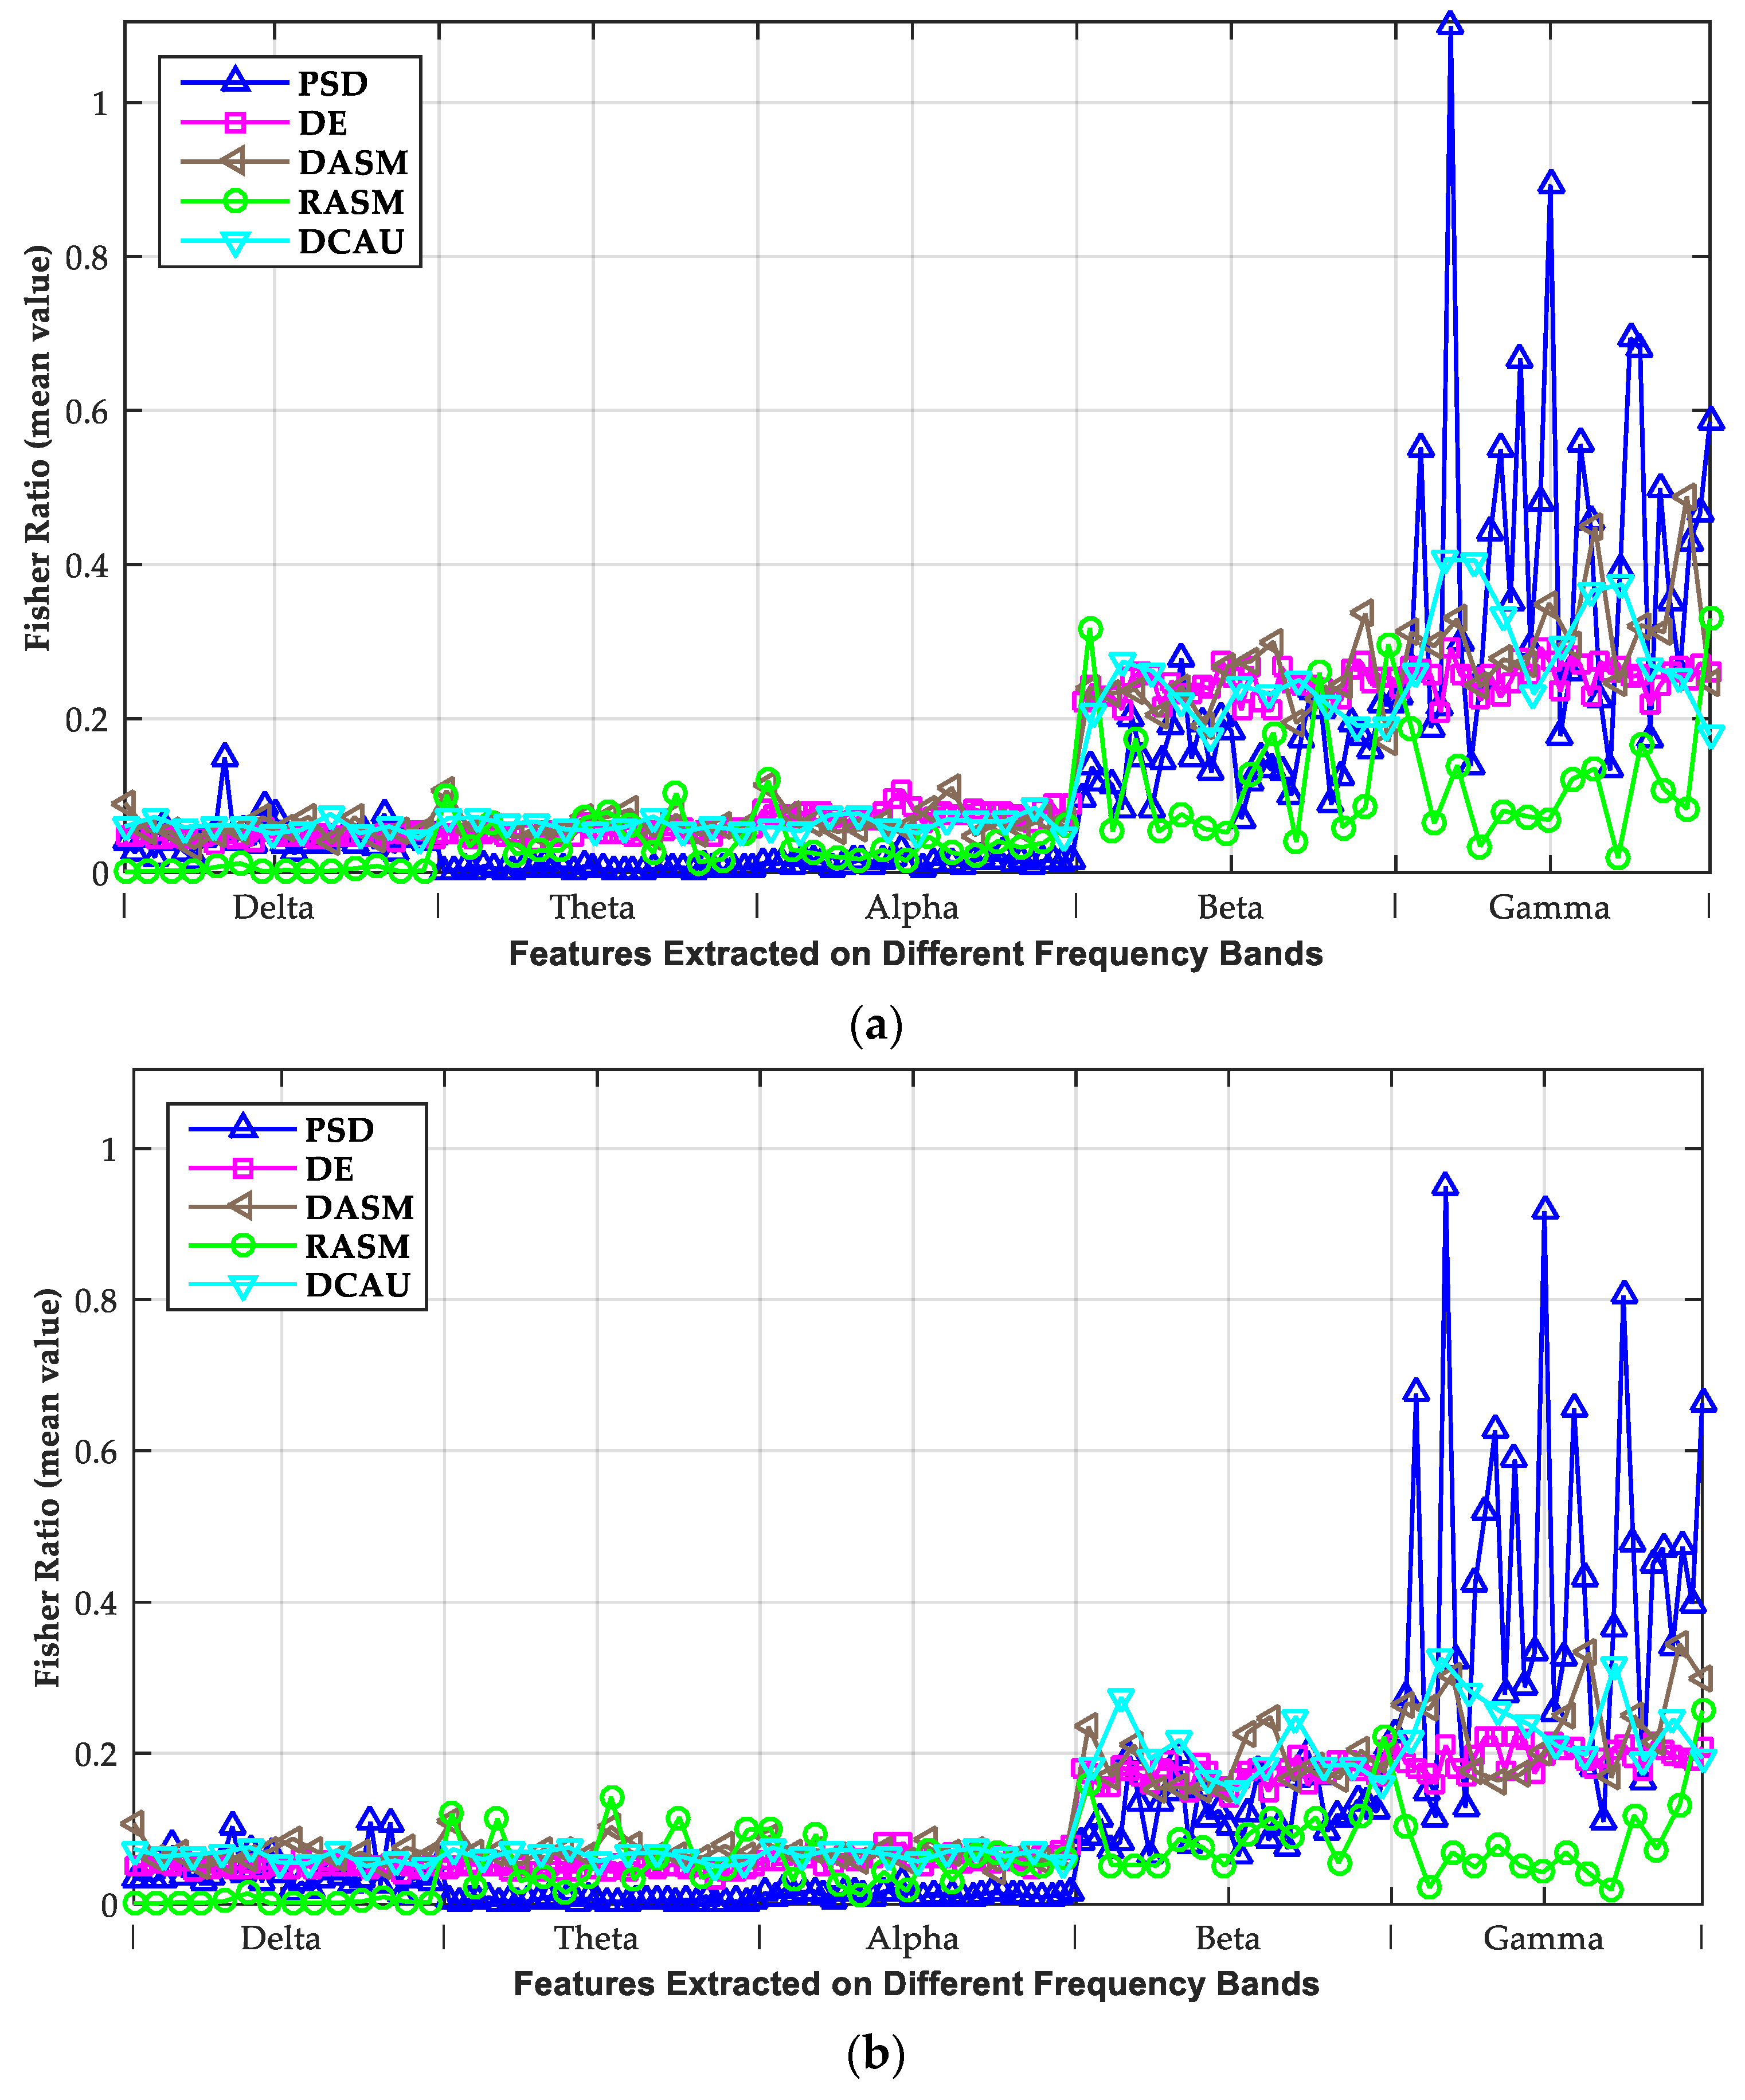
3.2. Investigation of Critical Frequency Bands

In this study, the informative features were extracted from different frequency bands (Delta, Theta, Alpha, Beta, Gamma, and Total) for EEG-based emotion recognition. Thus, we present an investigation of the critical frequency bands in EEG signals for emotion processing. Figure 4a–f and Figure 5a–f show the mean precisions obtained by LORSAL, SVM, and NB for the classification of LV/HV and LA/HA, respectively, when the frequency bands alternated among Delta, Theta, Alpha, Beta, Gamma, and Total. Gamma and Beta are more informative than other frequency bands (Delta, Theta, and Alpha). For example, among the first five frequency bands, the LOSAL obtained the highest accuracies of 72.93% and 67.06% on Gamma and Beta from the DE features in valence classification, the best accuracies of 72.73% and 66.57% on Gamma and Beta from the DE features in arousal recognition.
There is not always a causal relationship between features with high recognition accuracies and emotions. Koelstra et al. [27] presented an investigation about the causal relationship between the emotions and their EEG signals on the DEAP dataset. The average frequency power of trials was calculated over the bands Theta, Alpha, Beta, and Gamma (between 3 and 47 Hz). The Spearman correlated coefficients were tabulated [27] to present the statistical correlation of the power changes of EEG sequences and subject ratings. Similar research has been done by Zheng [47], we focused on analyzing the informative neural patterns associated with recognizing different emotions. Especially, the Fisher ratio was used to investigate the critical frequency bands for discriminating different emotions. The Fisher ratio has been used in pattern recognition for class separability measure and feature selection [65,66,67], as well as in emotion classification [3,4,13,14,27]. The higher values of the Fisher ratio mean more informative neural patterns and features related to emotion recognition. It is defined as the ratio of interclass difference to the intraclass spread
F n ( L , H ) = ( m L n m H n ) 2 σ L n 2 + σ H n 2 ,
where L and H mean two different emotion, e.g., LV/HV or LA/HA, and m L n , m H n , σ L n 2 , and σ H n 2 denote the mean and variance of the n-th dimension of the EEG feature belonging to emotions L and H, respectively. Thus, F n ( L , H ) indicates the class separability between emotions L and H for the n-th dimension of the extracted feature.
Given the extracted feature and the specific frequency bands, the mean Fisher ratio F ( L , H ) is calculated by averaging the values of F n ( L , H ) over all the EEG channels (e.g., PSD and DE) or combinations of electrodes (e.g., DASM, RASM, and DCAU)
F ( L , H ) = 1 N n = 1 N F n ( L , H ) ,
where N is the number of EEG channels or combinations of electrodes.
Figure 6 shows the Fisher ratio of the extracted PSD, DE, DASM, RASM, and DCAU feature along different frequency bands by averaging the values over all subjects in valence and arousal dimensions, respectively. In addition, Table 4 illustrates the Fisher ratio over different frequency bands by averaging the values over all features and subjects in valence and arousal dimensions, respectively. The Fisher ratio values shown in Table 4 are calculated by further averaging the values presented in Figure 6 over the five different frequency bands. The following subsection presents comprehensively an analysis including the EEG neural patterns associated with emotions in previous studies [27,47,48], the critical frequency bands and the informative features for emotion recognition. Specific frequency ranges are highly related to certain brain activities. There are neuroscience findings [68,69] revealing that the Alpha bands in EEG signals associate with attentional processing, while the Beta bands associate with emotional and cognitive progress. In the previous studies on the DEAP dataset by Koelstra et al. [27], they reported negative correlations in the Theta, Alpha, and Gamma bands for arousal, and strong correlations in all investigated frequency bands for valence. Similarly, Onton et al. [70] found a positive correlation of valence and the Beta and Gamma bands.
From Figure 6 and Table 4, we found that the Gamma and Beta bands obtained higher values of the Fisher ratio than the other frequency bands. This means that the features extracted over Gamma and Beta bands are more effective for discriminating different emotions, as is in accordance with the classification accuracies by the compared classifiers illustrated in Figure 5. Similarly, Li and Lu [71] showed that the EEG Gamma bands are appropriate for emotion recognition when images are used for emotion elicitation. The studies by [47] Zheng and Lu found specific neural patterns in high-frequency bands for distinguishing negative, neutral, and positive emotions. For negative and neutral emotions, the energy of Beta and Gamma frequency bands decreases, while positive emotions present higher energy of these two frequency bands. Their experimental results [47] on SJTU Emotion EEG Dataset (SEED) showed that the KNN, LR_L2, SVM, and DBN classifiers performed better on Gamma and Beta frequency bands than other bands for the PSD, DE, DASM, RASM, and DCAU features. This showed the informativeness of EEG Gamma and Beta bands for emotion recognition with film clips as stimuli in the SEED dataset. The emotion elicitation materials in the DEAP dataset are one-minute videos [27]. Our experimental results in DEAP and findings were in accordance with these previous studies [47,48]. Additionally, the total frequency bands concatenating all the original five frequency bands can further improve the emotion recognition performance, and the LORSAL obtained the highest mean accuracies in valence and arousal dimensions from the DE, DASM, and DCAU features, as is consistent with the results in studies [47,48].

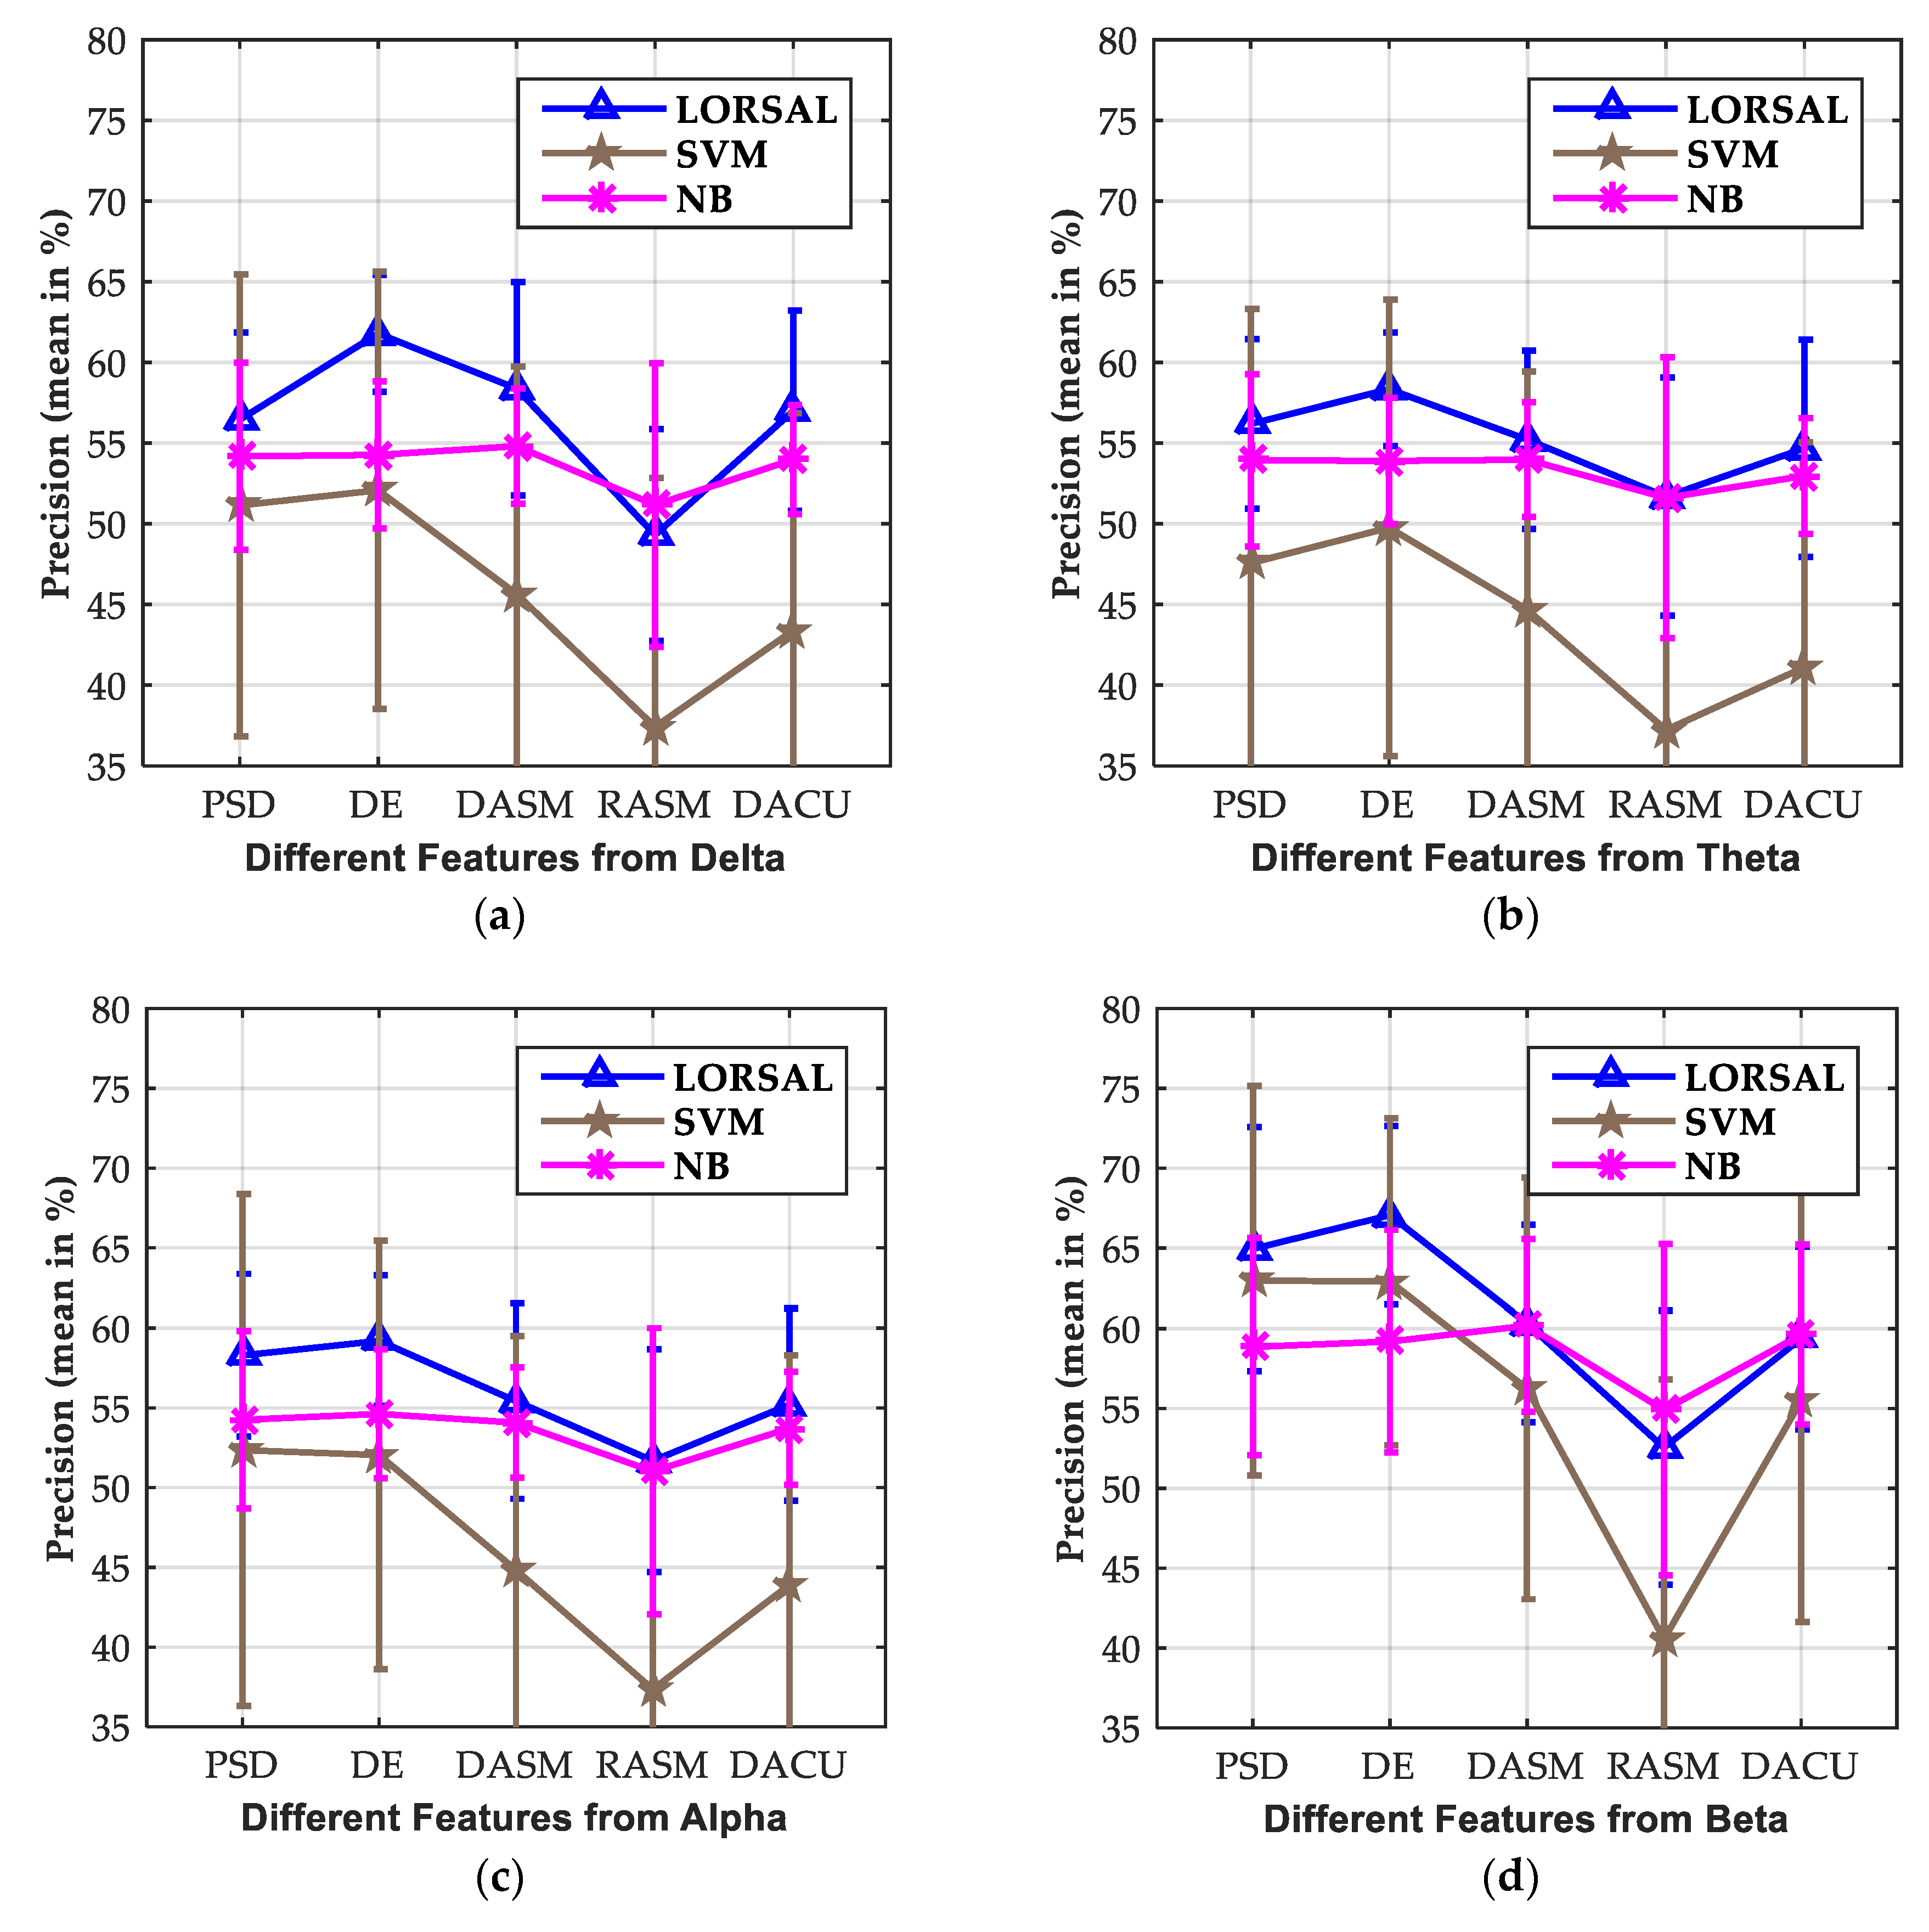
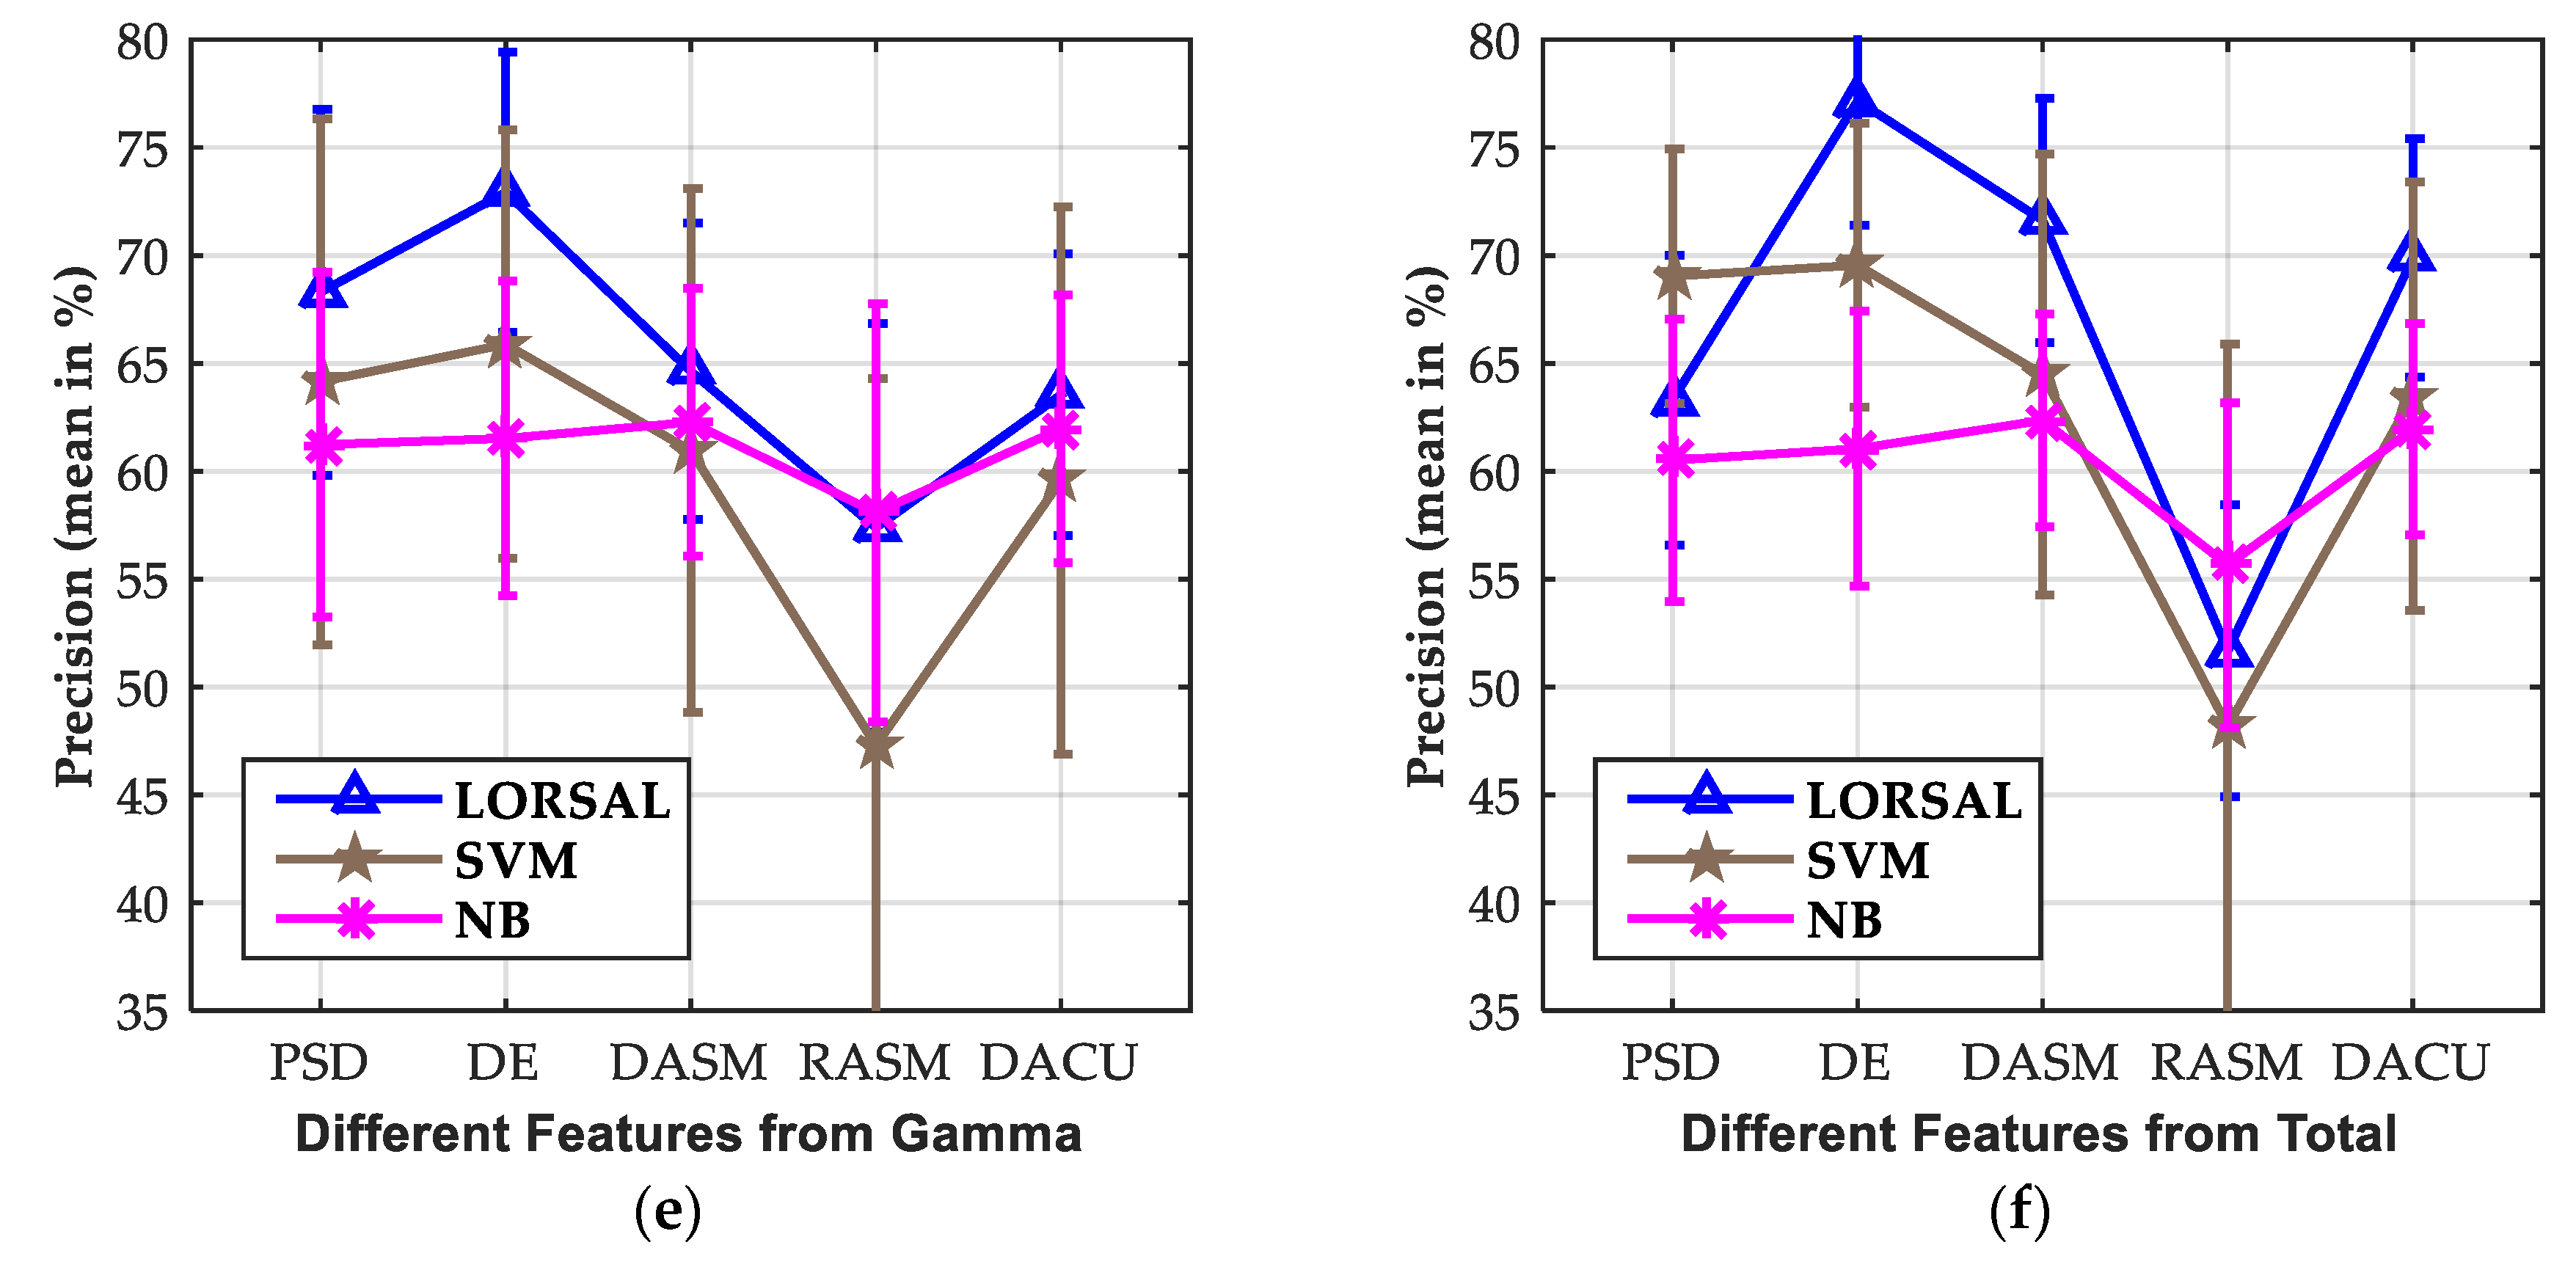
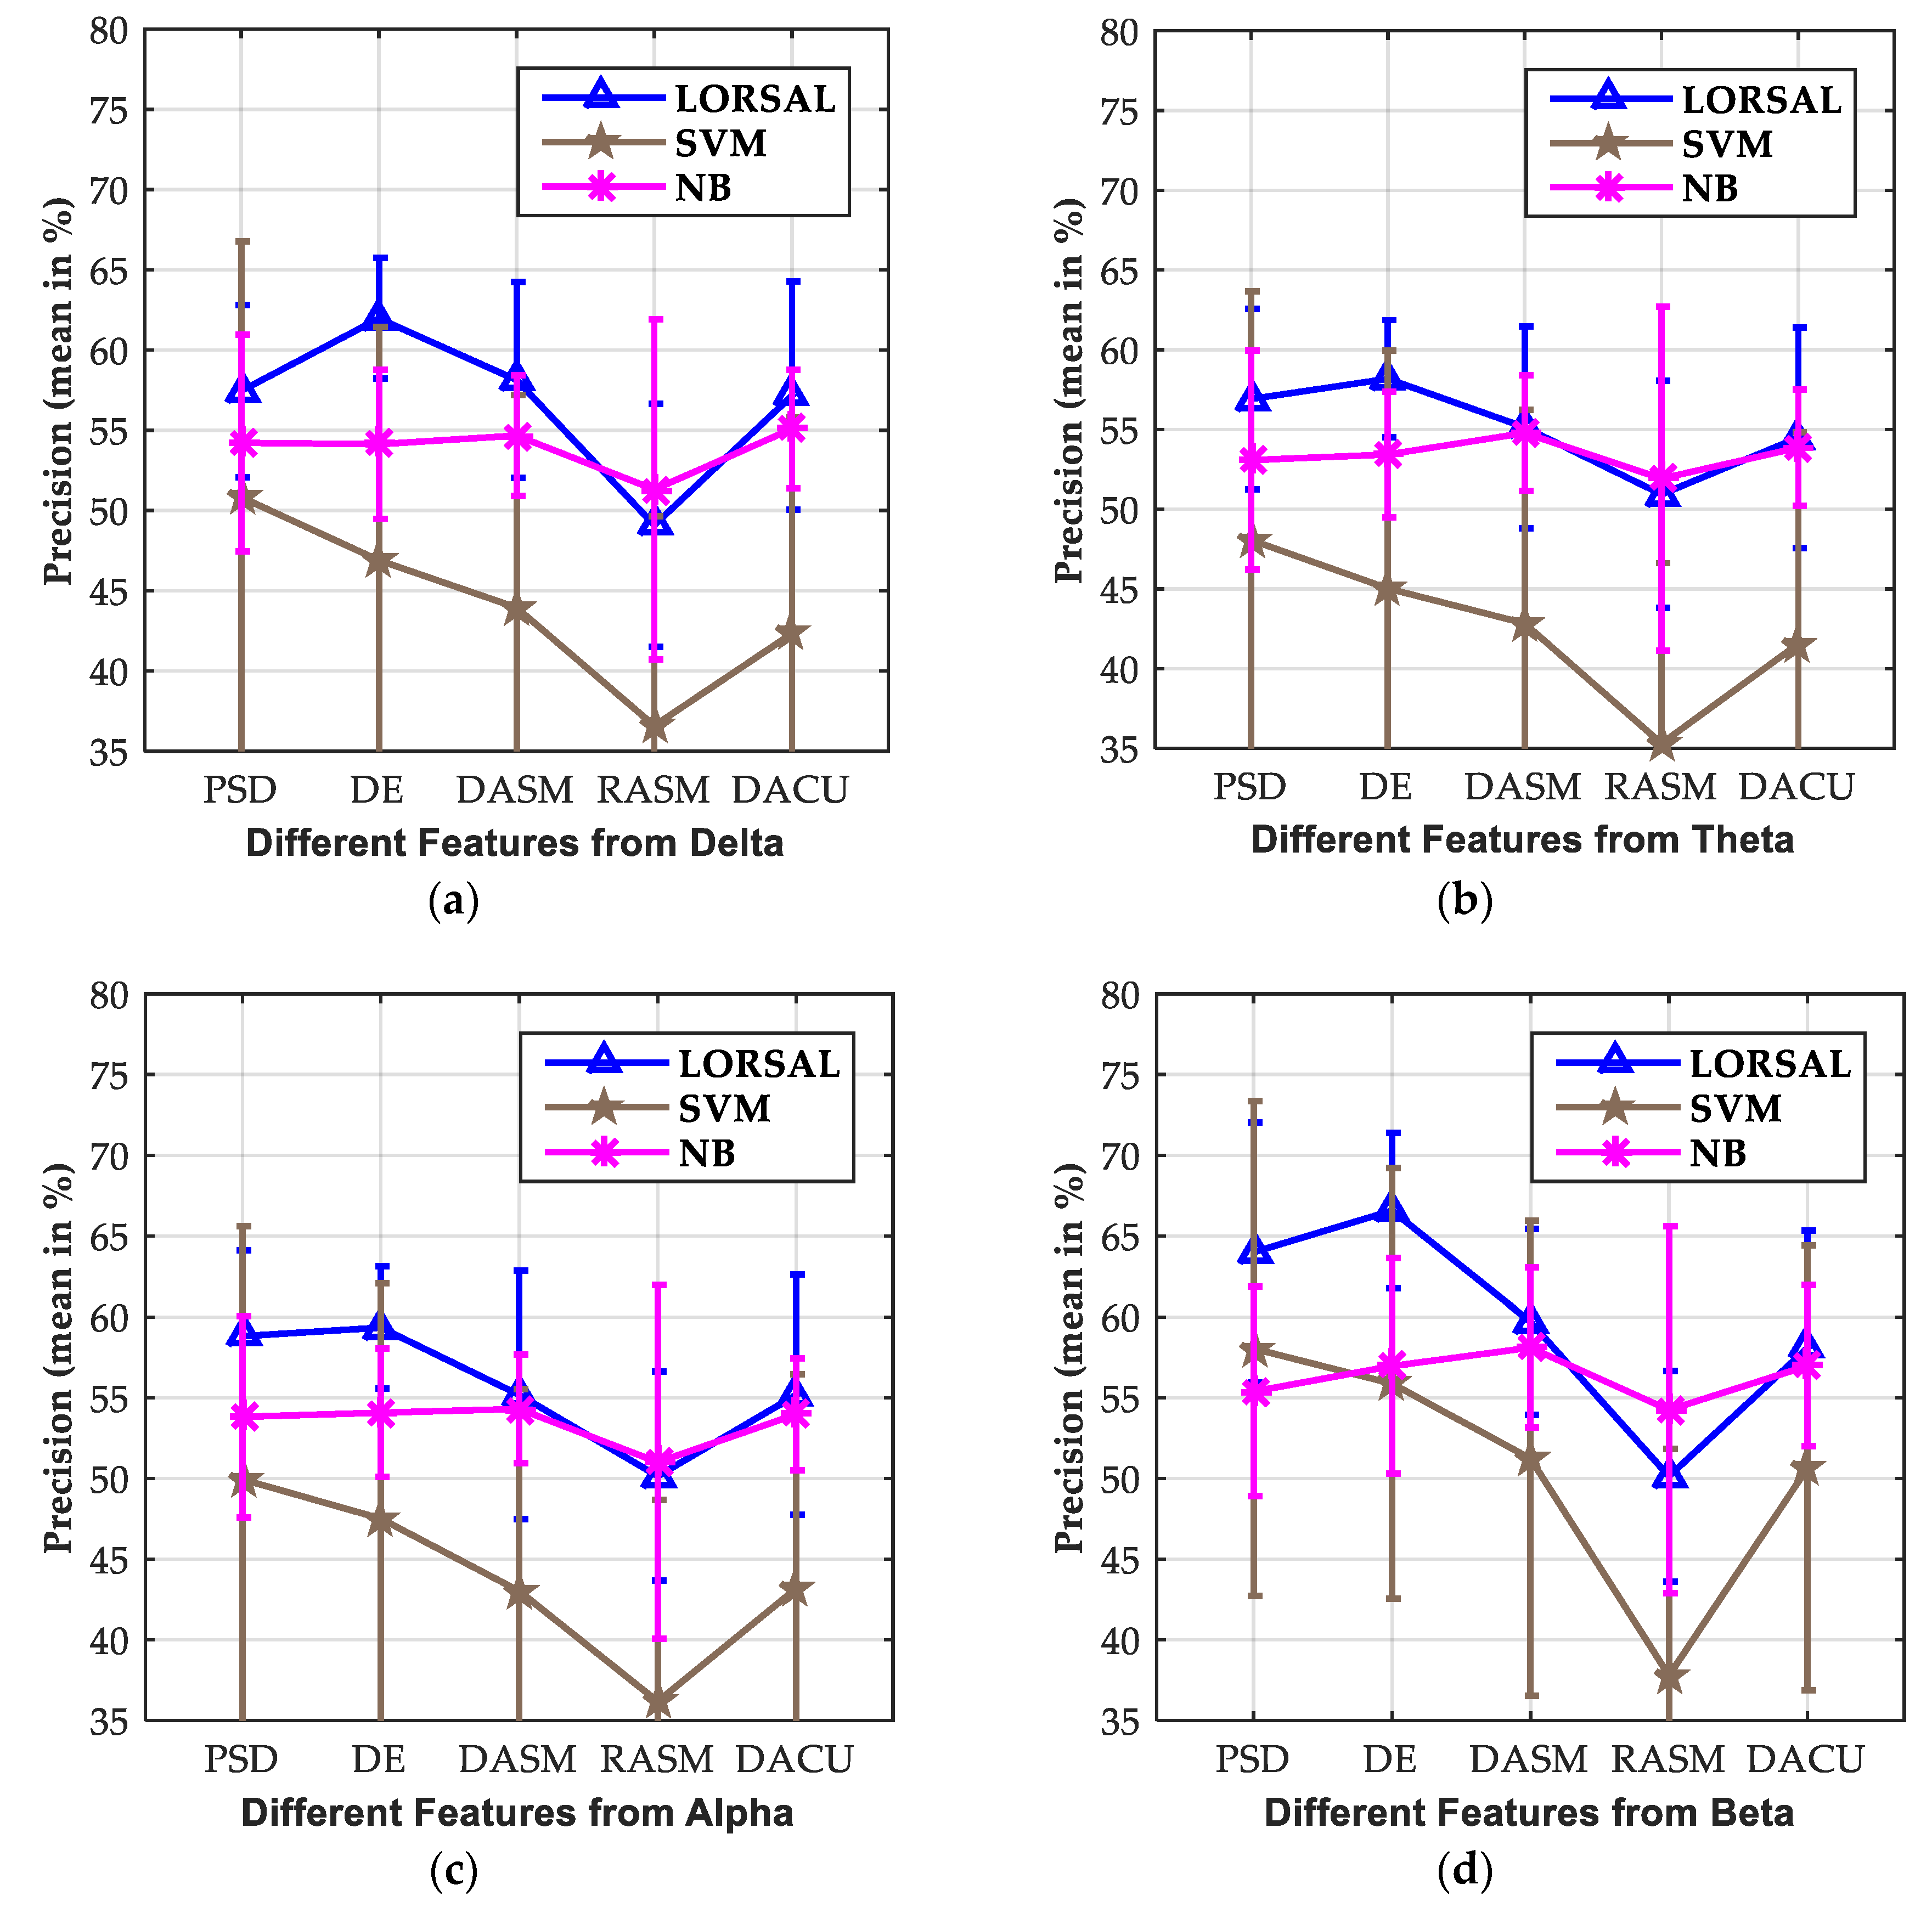
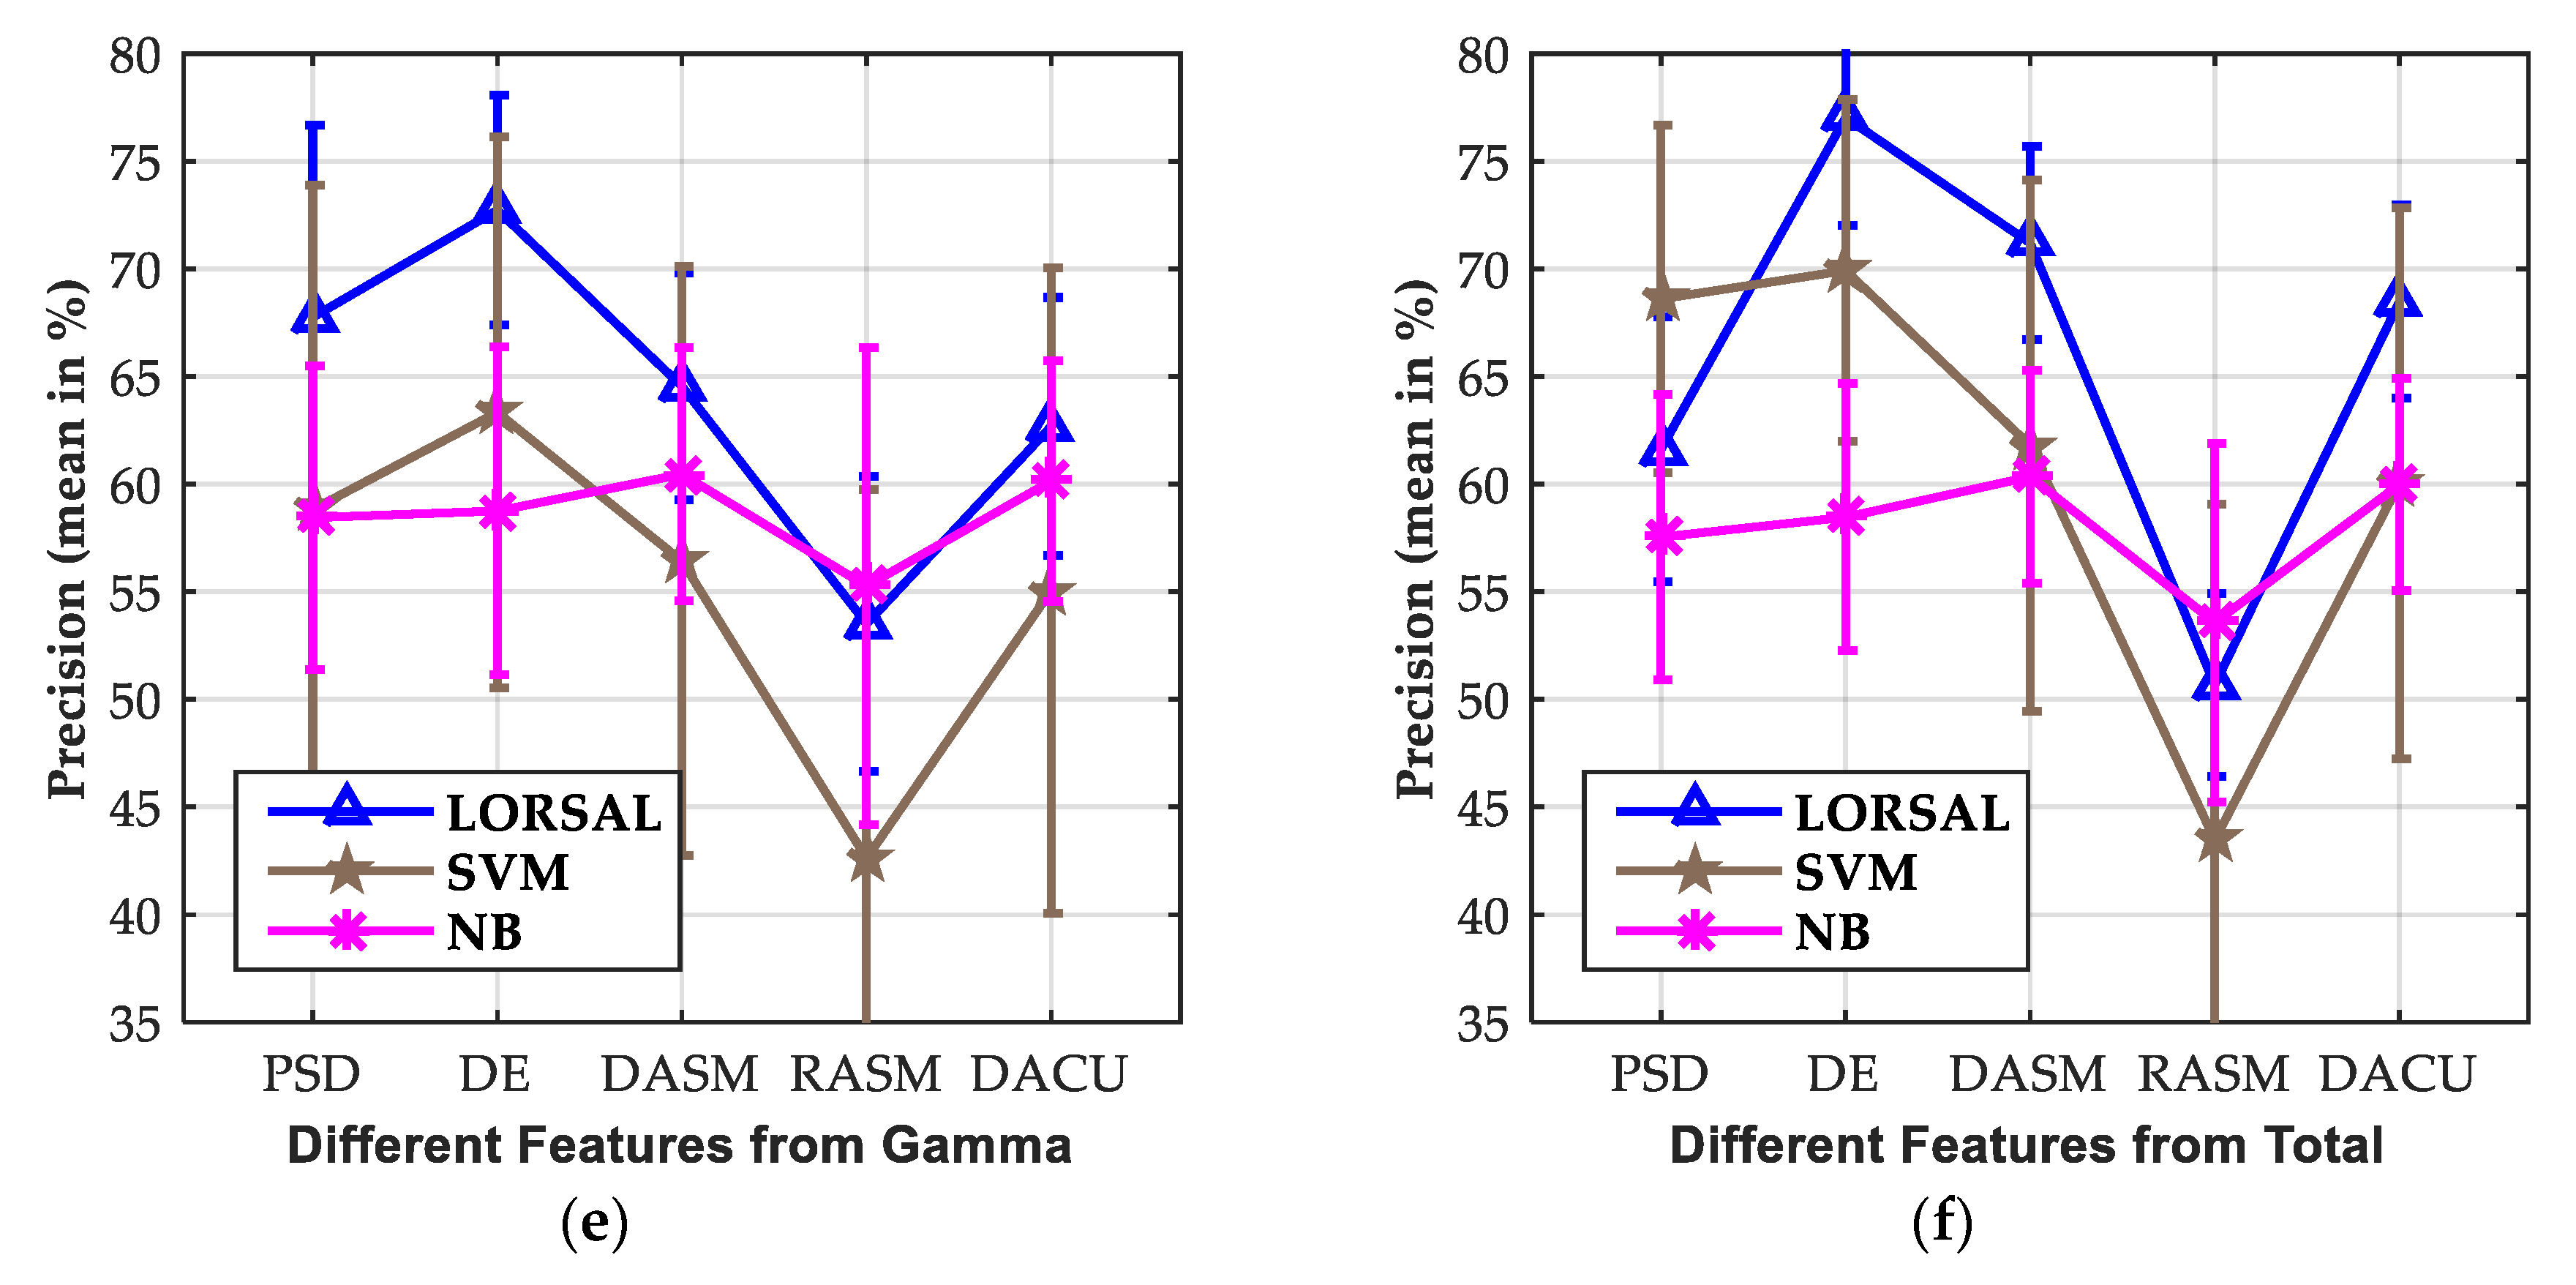
3.3. Effect of Extracted Features

This subsection presents an analysis of the effects of different features on the average accuracies for emotion recognition based on the EEG signal. When the extracted features alternate among PSD, DE, DASM, RASM, and DCAU, the mean precisions obtained by LORSAL, SVM, and NB for the classification of LV/HV and LA/HA are shown in Figure 7a–f and Figure 8a–f. All the LORSAL, SVM, and NB classifiers performed best for the DE features. Among all classifiers, LORSAL obtained the highest accuracies of 77.17% and 77.03% in valence and arousal dimensions, respectively, for the DE features extracted from total frequency bands. In addition, the highest precisions obtained by SVM are 69.55% and 69.92%, respectively, for DE from total frequency bands. The DE features denote the complexity of continuous random variables [55,56,57]. The EEG signals are characterized by higher low-frequency energy over high-frequency energy, and consequently, DE can distinguish EEG sequences according to low- and high-frequency energy. These results agree with the findings in [47,48], and further show the superiority of the DE features in EEG-based emotion classification.
Moreover, the DASM and DCAU features provide relatively ideal performance compared to the PSD and DE features. DASM and DCAU are asymmetric features and the former findings showed the effectiveness of asymmetrical brain activity along left-right and frontal-posterior directions in emotion analysis. It is noted that the dimensions of the DASM and DCAU features are 70 and 55, respectively, which are fewer than that of PSD and DE with 160-dimension features. This makes DASM and DCAU more competitive in computational complexity. The experimental results were also consistent with the findings by Zheng and Lu [47,48].

4. Discussion

Although the area of affective computing has developed a lot over the past years, the topic of EEG-based emotion recognition is still a challenging problem. This paper introduced LR with Gaussian kernel and Laplacian prior for EEG-based emotion recognition. The Gaussian kernel enhances the EEG data separability in the transformed space, and the Laplacian prior controls the complexity of the learned LR regressor in the training process. The LORSAL algorithm was introduced to optimize the LR with Gaussian kernel and Laplacian prior for its low computational complexity. Various spectral power features in the frequency domain and features by combining the asymmetrical electrodes, PSD, DE, DASM, RASM, and DCAU, were extracted for the Delta, Theta, Alpha, Beta, Gamma and Total frequency bands using 256-point STFT from the segmented 1 s EEG epochs.
The experiments were conducted on the publicly available DEAP dataset, and the performance of the introduced LORSAL methods was compared with the NB, SVM, LR_L1, and LR_L2 classifiers. The experimental results showed that LORSAL presented the best accuracies of 77.17% and 77.03% in valence and arousal dimensions, respectively, on the DE features from the total frequency bands, while the SVM classifiers obtained the second-highest accuracies of 69.55% and 69.92%. The other evaluation metrics obtained by LORSAL, SVM, and NB were also tabulated in the paper. The introduced LORSAL method also presented the best Recall (76.79% and 77.03% in valence and arousal, respectively) and F1 (76.90% and 76.47% in valence and arousal, respectively). The previous experimental results showed the superiority of the introduced LORSAL method for EEG-based emotion recognition compared to the NB, SVM, LR_L1, and LR_L2 approaches.
This paper also showed an investigation of the critical frequency bands for EEG-based emotion recognition. In this study, the informative features are captured from different frequency bands: Delta, Theta, Alpha, Beta, Gamma, and Total. The previous neuroscience studies showed that specific frequency band ranges are associated with specific brain activities. For example, the EEG Alpha frequency bands are related to attentional processing, whereas the Beta bands are a reflection of emotional and cognitive processing. The experimental results showed that the LORSAL, SVM, and NB classifiers performed better on the Gamma and Beta frequency bands than other bands for different features. The comparison of the Fisher ratio also showed the effectiveness of Gamma and Beta bands in emotion recognition. The findings in this study are in accordance with the previous work about critical bands investigation [47,48].
Additionally, the effects of different features, PSD, DE, DASM, RASM, and DCAU, on the emotion classification results were also analyzed in this paper. Experimental results show that the compared approaches, LORSAL, SVM, and NB obtained superior precision metrics on the DE features over other features. This shows the effectiveness of the DE features in distinguishing low- and high-frequency energy in EEG sequences. Meanwhile, the DASM and DCAU features presented relatively ideal classification accuracies compared to the PSD features. It is noted that DASM and DCAU have the advantages of less time consumption for their lower dimensionality than PSD and DE.
For a more comprehensive analysis, -Table 5 showed a comparison of the introduced LORSAL methods, the other shallow classifiers, and the deep learning approaches for EEG-based emotion recognition of LV/HV and LA/HA on DEAP dataset. In single-trial classification by Koelstra et al. [27], the NB after feature selection using Fisher’s linear discrimination, obtained the accuracies of 57.65% and 62.0% in valence and arousal dimensions. In [72], the Bayesian weighted-log-posterior function optimized with the perceptron convergence algorithm presented average precisions of 70.9% and 70.1% for valence and arousal. For within-subject emotion recognition of LV/HV and LA/HA, Atkinson et al. [73] presented the accuracies of 73.41% and 73.06% using minimum-Redundancy- Maximum-Relevance (mRMR) for feature selection. Rozgić et al. [74] performed classification using segment level decision fusion and presented precisions of 76.9% and 69.4% to discriminate LV/HV and LA/HA emotions. In the studies by Zheng et al. [48], the discriminative graph regularized extreme learning machine (GELM) with DE features achieved the highest average accuracies of 69.67% for 4-class classification in VA emotion space. The introduced LORSAL classifier presented ideal evaluation metrics for EEG emotion recognition, including the compared NB, SVM, LR_L1, and LR_L2 methods in the experiments.
Recently, deep learning (DL) methods have been used for EEG-based emotion classification [28,29]. In [75], a hybrid DL model combining CNN and RNN learned task-related features from grid-like EEG frames and achieved the accuracies of 72.06% and 74.12 for valence and arousal. The DNN and CNN models by Tripathi et al. [76] achieved the precisions of 75.78%, 73.12%, 81.41%, and 73.36% along valence and arousal dimensions, respectively. The classification accuracies for valence and arousal were over 85% using LSTM-RNN by Alhagry et al. [77], and over 87% using 3D-CNN by Salama et al. [78]. More recently, Chen et al. [33,34] have researched a lot on the combination of DL models and various features. As tabulated in Table 5, computer vision CNN (CVCNN), global spatial filter CNN (GSCNN), and global space local time filter (GSLTCNN) [33] presented obvious improvements with concatenating PSD, raw EEG features, and normalized EEG signals. In [34], the proposed hierarchical bidirectional gated recurrent unit (H-ATT-BGRU) network performed better on raw EEG signals than CNN and LSTM, and the obtained accuracies in valence and arousal dimensions were 67.9% and 66.5% for 2-class cross-subject emotion recognition. For more details about the DL architectures applied in the DEAP data, readers may refer to the literature [33,34,75,76,77,78]. Compared to traditional shallow methods, the DL schemes remove the signal pre-processing and feature extraction/selection progress, and are more suitable for affective representation [35,36]. However, the DL methods cannot reveal the relationship between emotional states and EEG signals for being like a black box [37].
However, more importantly, the training of DL networks is extremely time-consuming, which limits their practical applications in real-time emotion recognition [3]. Craik et al. [28] stated that from practical issues, the DL methods have problems of very long computation, and the vanishing/ exploding gradients, and their practical application need extra graphic processing unit (GPU). Roy et al. [29] pointed out that from a practical point-of-view, the hyperparameter search of a DL algorithm often takes up a lot of time for training. Additionally, Craik et al. [28] and Roy et al. [29] make comprehensive reviews on the recent DL schemes.
To illustrate the time efficiency, the average training time of the compared NB, SVM, MLR_L1, MLR_L2, and LORSAL methods are shown in Table 6. The average running time for STFT-based feature extraction is 68.15 s. In our experiment, all the programs are performed using on a computer with an Intel Core i5-4590 of 3.30 GHz and 8.00-GB RAM. LORSAL takes just no more than 4 s for training, and the computing time is in the same order as the compared traditional shallow methods. As mentioned earlier, the complexity of LORSAL is O((L + 1) 2K) for each quadratic problem, where L is the number of EEG epochs used for training and K is the number of emotion classes. As shown in Table 5, the time-consumptions of LORSAL on DE, PSD, DASM, RASM, and DCAU (with different dimensions 160, 160, 70, 70, and 55) are nearly the same. Given limited computational resources, or with portable devices, the introduced LORSAL algorithm has higher time efficiency than DL methods and can present better performance than the compared shallow methods.

5. Conclusions and Future Work

This paper systematically investigates the introduced LORSAL algorithm for the EEG-based emotion class. Additionally, the critical frequency bands, Delta, Theta, Alpha, Beta, Gamma, and the effectiveness of different features, PSD, DE, DASM, RASM, and DCAU, on emotion recognition are also analyzed. The LORSAL classifier performs better than the compared shallow methods and has the superiority of time efficiency compared to the recent DL approaches.
The performance and application of LORSAL-based emotion recognition should be further researched in future work. More informative and representative features can be used in LORSAL. As shown in Table 5, in the research by Chen et al. [33], SVM achieved higher values of AUC (Area Under ROC Curve), 0.9234 and 0.9426, for classifying LV/HV and LA/HA emotions by concatenating PSD and raw pre-processed EEG signals than with other features. We will try to integrate different features to train the LORSAL classifier. The future attempts include the application of LORSAL for 4-class emotion classification in VA space, as the studies in [48]. A further comparison of LORSAL and DL methods, and the combination of their advantages in feature extraction and avoiding overfitting will be investigated. Future work could also include applying LORSAL on multimodal information, e.g., fNIRS, and other physiological signals in brain activity analysis [79,80].

Author Contributions

Conceptualization, C.P. and C.S.; methodology, C.P. and C.S.; software, C.P. and C.S; validation, C.P.; formal analysis, C.P. and C.S; investigation, C.P.; writing—original draft preparation, C.P.; writing—review and editing, C.S.; supervision, H.M., J.L. and X.G.; funding acquisition, C.P., C.S., and H.M. All authors have read and agreed to the published version of the manuscript.

Funding

This research was supported by the National Natural Science Foundation of China under Grant 61902313, the Fundamental Research Funds for the Central Universities, Xidian University, No. RW190110, and the Construction Project Achievement of College Counselor Studio of Shaanxi Province: Reach Perfection with Morality Studio.

Acknowledgments

The authors would like to thank J. Li for providing the source codes of the LORSAL algorithm on the websites (http://www.lx.it.pt/~jun/).

Conflicts of Interest

The authors declare no conflict of interest.

References

  1. Picard, R.W. Affective Computing; MIT Press: Cambridge, MA, USA, 1997. [Google Scholar]
  2. Levenson, R.W. The autonomic nervous system and emotion. Emotion Rev. 2014, 6, 100–112. [Google Scholar] [CrossRef]
  3. Bota, P.J.; Wang, C.; Fred, A.L.; Da Silva, H.P. A review, current challenges, and future possibilities on emotion recognition using machine learning and physiological signals. IEEE Access 2019, 7, 140990–141020. [Google Scholar] [CrossRef]
  4. Shu, L.; Xie, J.; Yang, M.; Li, Z.; Li, Z.; Liao, D.; Xu, X.; Yang, X. A review of emotion recognition using physiological signals. Sensors 2018, 8, 2074. [Google Scholar] [CrossRef] [Green Version]
  5. Cannon, W.B. The James-Lange theory of emotions: A critical examination and an alternative theory. Am. J. Psychol. 1927, 39, 106–124. [Google Scholar] [CrossRef]
  6. Ayaz, H.; Curtin, A.; Mark, J.; Kraft, A.; Ziegler, M. Predicting Future Performance based on Current Brain Activity: An fNIRS and EEG Study. In Proceedings of the 2019 IEEE International Conference on Systems, Man and Cybernetics (SMC), Bari, Italy, 6–9 October 2019; pp. 3925–3930. [Google Scholar]
  7. Saadati, M.; Nelson, J.; Ayaz, H. Convolutional Neural Network for Hybrid fNIRS-EEG Mental Workload Classification. In Proceedings of the International Conference on Applied Human Factors and Ergonomics, Washington, DC, USA, 24–28 July 2019; pp. 221–232. [Google Scholar]
  8. Jiao, Z.; Gao, X.; Wang, Y.; Li, J.; Xu, H. Deep Convolutional Neural Networks for mental load classification based on EEG data. Pattern Recognit. 2018, 76, 582–595. [Google Scholar] [CrossRef]
  9. Sargent, A.; Heiman-Patterson, T.; Feldman, S.; Shewokis, P.A.; Ayaz, H. Mental Fatigue Assessment in Prolonged BCI Use Through EEG and fNIRS.-Neuroergonomics; Academic Press: Cambridge, MA, USA, 2018. [Google Scholar]
  10. Abdul, A.; Chen, J.; Liao, H.Y.; Chang, S.H. An emotion-aware personalized music recommendation system using a convolutional neural networks approach. Appl. Sci. 2018, 8, 1103. [Google Scholar] [CrossRef] [Green Version]
  11. Jiao, Z.; You, H.; Yang, F.; Li, X.; Zhang, H.; Shen, D. Decoding EEG by visual-guided deep neural networks. In Proceedings of the 28th International Joint Conference on Artificial Intelligence, Macao, China, 10–16 August 2019; pp. 1387–1393. [Google Scholar]
  12. Ren, Z.; Li, J.; Xue, X.; Li, X.; Yang, F.; Jiao, Z.; Gao, X. Reconstructing Perceived Images from Brain Activity by Visually-guided Cognitive Representation and Adversarial Learning. arXiv 2019, arXiv:1906.12181. [Google Scholar]
  13. Lotte, F.; Congedo, M.; Lécuyer, A.; Lamarche, F.; Arnaldi, B. A review of classification algorithms for EEG-based brain–computer interfaces. J. Neural Eng. 2007, 4, R1–R13. [Google Scholar] [CrossRef] [PubMed]
  14. Lotte, F.; Bougrain, L.; Cichocki, A.; Clerc, M.; Congedo, M.; Rakotomamonjy, A.; Yger, F. A review of classification algorithms for EEG-based brain–computer interfaces: A 10 year update. J. Neural Eng. 2018, 15, 031005. [Google Scholar] [CrossRef] [PubMed] [Green Version]
  15. Russell, J.A. A circumplex model of affect. J. Personal. Soc. Psychol. 1980, 39, 1161–1178. [Google Scholar] [CrossRef]
  16. Kim, M.-K.; Kim, M.; Oh, E.; Kim, S.-P. A review on the computational methods for emotional state estimation from the human EEG. Comput. Math. Methods Med. 2013, 2013, 1–13. [Google Scholar] [CrossRef] [PubMed] [Green Version]
  17. Cacioppo, J.T. Feelings and emotions: Roles for electrophysiological markers. Biol. Psychol. 2004, 67, 235–243. [Google Scholar] [CrossRef] [PubMed]
  18. Sanei, S.; Chambers, J. EEG Signal Processing; Wiley: New York, NY, USA, 2007. [Google Scholar]
  19. Al-Nafjan, A.; Hosny, M.; Al-Ohali, Y.; Al-Wabil, A. Review and classification of emotion recognition based on EEG brain-computer interface system research: A systematic review. Appl. Sci. 2017, 7, 1239. [Google Scholar] [CrossRef] [Green Version]
  20. Kroupi, E.; Vesin, J.M.; Ebrahimi, T. Subject-independent odor pleasantness classification using brain and peripheral signals. IEEE Trans. Affect. Comput. 2016, 7, 422–434. [Google Scholar] [CrossRef]
  21. Zhang, J.H.; Chen, M.; Zhao, S.K.; Hu, S.Q.; Shi, Z.G.; Cao, Y. Relieff-based EEG sensor selection methods for emotion recognition. Sensors 2016, 16, 1558. [Google Scholar] [CrossRef]
  22. Chew, L.H.; Teo, J.; Mountstephens, J. Aesthetic preference recognition of 3d shapes using EEG. Cogn. Neurodyn. 2016, 10, 165–173. [Google Scholar] [CrossRef] [Green Version]
  23. Tang, J.; Alelyani, S.; Liu, H. Feature Selection for Classification: A Review. In Data Classification: Algorithms and Applications; CRC Press: Boca Raton, FL, USA, 2014; pp. 37–64. [Google Scholar]
  24. Chao, G.; Luo, Y.; Ding, W. Recent advances in supervised dimension reduction: A Survey. Mach. Learn. Knowl. Extr. 2019, 1, 20. [Google Scholar] [CrossRef] [Green Version]
  25. Lin, Y.-P.; Wang, C.-H.; Wu, T.-L.; Jeng, S.-K.; Chen, J.-H. EEG-based emotion recognition in music listening: A comparison of schemes for multiclass support vector machine. In Proceedings of the IEEE International Conference on Acoustics, Speech and Signal Processing, Taipei, Taiwan, 19–24 April 2009; pp. 489–492. [Google Scholar]
  26. Horlings, R.; Datcu, D.; Rothkrantz, L.J.M. Emotion recognition using brain activity. In Proceedings of the 9th International Conference on Computer Systems and Technologies and Workshop for PhD students in Computing, Gabrovo, Bulgaria, 12–13 June 2008; ACM: New York, NY, USA, 2008. [Google Scholar]
  27. Koelstra, S.; Muhl, C.; Soleymani, M.; Lee, J.S.; Yazdani, A.; Ebrahimi, T.; Pun, T.; Nijholt, A.; Patras, I. DEAP: A database for emotion analysis; using physiological signals. IEEE Trans. Affect. Comput. 2012, 3, 18–31. [Google Scholar] [CrossRef] [Green Version]
  28. Craik, A.; He, Y.; Contreras-Vidal, J.L. Deep learning for electroencephalogram (EEG) classification tasks: A review. J. Neural Eng. 2019, 16, 031001. [Google Scholar] [CrossRef]
  29. Roy, Y.; Banville, H.; Albuquerque, I.; Gramfort, A.; Falk, T.H.; Faubert, J. Deep learning-based electroencephalography analysis: A systematic review. J. Neural Eng. 2019, 16, 051001. [Google Scholar] [CrossRef]
  30. Zheng, W.L.; Zhu, J.Y.; Peng, Y.; Lu, B.L. EEG-based emotion classification using deep belief networks. In Proceedings of the 2014 IEEE International Conference on Multimedia and Expo (ICME), Chengdu, China, 14–18 July 2014; pp. 1–6. [Google Scholar]
  31. Zheng, W.L.; Guo, H.T.; Lu, B.L. Revealing critical channels and frequency bands for emotion recognition from EEG with deep belief network. In Proceedings of the 2015 7th International IEEE/EMBS Conference on Neural Engineering (NER), Montpellier, France, 22–24 April 2015; pp. 154–157. [Google Scholar]
  32. Yang, Y.; Wu, Q.; Qiu, M.; Wang, Y.; Chen, X. Emotion recognition from multi-channel EEG through parallel convolutional recurrent neural network. In Proceedings of the International Joint Conference on Neural Networks, Rio, Brasil, 8–13 July 2018; pp. 1–7. [Google Scholar]
  33. Chen, J.X.; Zhang, P.W.; Mao, Z.J.; Huang, Y.F.; Jiang, D.M.; Zhang, Y.N. Accurate EEG-based emotion recognition on combined features using deep convolutional neural networks. IEEE Access 2019, 7, 44317–44328. [Google Scholar] [CrossRef]
  34. Chen, J.X.; Jiang, D.M.; Zhang, Y.N. A hierarchical bidirectional GRU model with attention for EEG-based emotion classification. IEEE Access 2019, 7, 118530–118540. [Google Scholar] [CrossRef]
  35. Martinez, H.P.; Bengio, Y.; Yannakakis, G.N. Learning deep physiological models of affect. IEEE Comput. Intell. Mag. 2013, 8, 20–33. [Google Scholar] [CrossRef] [Green Version]
  36. Chen, J.X.; Mao, Z.J.; Yao, W.X.; Huang, Y.F. EEG-based biometric identification with convolutional neural network. Multimed. Tools Appl. 2019, 1–21. [Google Scholar] [CrossRef]
  37. Lee, J.; Yoo, S.K. Design of user-customized negative emotion classifier based on feature selection using physiological signal sensors. Sensors 2018, 18, 4253. [Google Scholar] [CrossRef] [Green Version]
  38. Hosmer, D.W.; Lemeshow, S.; Sturdivant, R.X. Applied Logistic Regression; John Wiley & Sons: Hoboken, NJ, USA, 2013. [Google Scholar]
  39. Alkan, A.; Koklukaya, E.; Subasi, A. Automatic seizure detection in EEG using logistic regression and artificial neural network. J. Neurosci. Methods 2005, 148, 167–176. [Google Scholar] [CrossRef]
  40. Subasi, A.; Ercelebi, E. Classification of EEG signals using neural network and logistic regression. Comput. Methods Programs Biomed. 2005, 78, 87–99. [Google Scholar] [CrossRef]
  41. Tomioka, R.; Aihara, K.; Müller, K.R. Logistic regression for single trial EEG classification. In Advances in Neural Information Processing Systems 19, Proceedings of the Twentieth Annual Conference on Neural Information Processing Systems, Vancouver, BC, Canada, 4–7 December 2006; MIT Press: Cambridge, MA, USA, 2006. [Google Scholar]
  42. Ezzyat, Y.; Kragel, J.E.; Burke, J.F.; Levy, D.F.; Lyalenko, A.; Wanda, P.; O’Sullivan, L.; Hurley, K.B.; Busygin, S.; Pedisich, I.; et al. Direct brain stimulation modulates encoding states and memory performance in humans. Curr. Biol. 2017, 27, 1–8. [Google Scholar] [CrossRef]
  43. Arora, A.; Lin, J.J.; Gasperian, A.; Maldjian, J.; Stein, J.; Kahana, M.; Lega, B. Comparison of logistic regression, support vector machines, and deep learning classifiers for predicting memory encoding success using human intracranial EEG recordings. J. Neural Eng. 2018, 15, 066028. [Google Scholar] [CrossRef]
  44. Krishnapuram, B.; Carin, L.; Figueiredo, M.A.T.; Member, S. Sparse multinomial logistic regression: Fast algorithms and generalization bounds. IEEE Trans. Pat. Anal. Mach. Intell. 2005, 27, 957–968. [Google Scholar] [CrossRef] [Green Version]
  45. Bioucas-Dias, J.; Figueiredo, M. Logistic Regression via Variable Splitting and Augmented Lagrangian Tools; Instituto Superior Técnico: Lisboa, Portugal, 2009. [Google Scholar]
  46. Li, J.; Bioucas-Dias, J.M.; Plaza, A. Hyperspectral image segmentation using a new Bayesian approach with active learning. IEEE Trans. Geosci. Remote Sens. 2011, 49, 3947–3960. [Google Scholar] [CrossRef] [Green Version]
  47. Zheng, W.L.; Lu, B.L. Investigating critical frequency bands and channels for EEG-based emotion recognition with deep neural networks. IEEE Trans. Auton. Ment. Dev. 2015, 7, 162–175. [Google Scholar] [CrossRef]
  48. Zheng, W.L.; Zhu, J.Y.; Lu, B.L. Identifying stable patterns over time for emotion recognition from EEG. IEEE Trans. Affect. Comput. 2019, 10, 417–429. [Google Scholar] [CrossRef] [Green Version]
  49. Bradley, M.M.; Lang, P.J. Measuring emotion: The self-assessment manikin and the semantic differential. J. Behav. Ther. Exp. Psychiatry 1994, 25, 49–59. [Google Scholar] [CrossRef]
  50. Jenke, R.; Peer, A.; Buss, M. Feature extraction and selection for emotion recognition from EEG. IEEE Trans. Affect. Comput. 2014, 5, 327–339. [Google Scholar] [CrossRef]
  51. Balconi, M.; Mazza, G. Brain oscillations and BIS/BAS (behavioral inhibition/activation system) effects on processing masked emotional cues: ERS/ERD and coherence measures of alpha band. Int. J. psychophysiol. 2009, 74, 58–65. [Google Scholar] [CrossRef] [PubMed]
  52. Bos, D.O. EEG-based emotion recognition The Influence of Visual and Auditory Stimuli. Emotion 2006, 1359, 667–670. [Google Scholar]
  53. Chanel, G.; Karim, A.-A.; Thierry, P. Valence-arousal evaluation using physiological signals in an emotion recall paradigm. In Proceedings of the IEEE International Conference on Systems, Man and Cybernetics, Montreal, QC, Canada, 7–10 October 2007. [Google Scholar]
  54. Lin, Y.P.; Wang, C.H.; Jung, T.P.; Wu, T.L.; Jeng, S.K.; Duann, J.R.; Chen, J.H. EEG-based emotion recognition in music listening. IEEE Trans. Biomed. Eng. 2010, 57, 1798–1806. [Google Scholar]
  55. Shi, L.; Jiao, Y.; Lu, B. Differential entropy feature for EEG-based vigilance estimation. In Proceedings of the 35th Annual International Conference of the IEEE Engineering in Medicine and Biology Society (EMBC), Osaka, Japan, 3–7 July 2013; pp. 6627–6630. [Google Scholar]
  56. Duan, R.; Zhu, J.; Lu, B. Differential entropy feature for EEG-based emotion classification. In Proceedings of the 6th International IEEE/EMBS Conference on Neural Engineering (NER), San Diego, CA, USA, 6–8 November 2013; pp. 81–84. [Google Scholar]
  57. Gibbs, J.W. Elementary Principles in Statistical Mechanics—Developed with Especial Reference to the Rational Foundation of Thermodynamics; C. Scribner’s Sons: New York, NY, USA, 1902. [Google Scholar]
  58. Davidson, R.; Fox, N. Asymmetrical brain activity discriminates between positive and negative stimuli infants. Science 1982, 218, 1235–1237. [Google Scholar] [CrossRef]
  59. Lin, Y.P.; Yang, Y.H.; Jung, T.P. Fusion of electroencephalographic dynamics and musical contents for estimating emotional responses in music listening. Front. Neurosci. 2014, 8, 94. [Google Scholar] [CrossRef] [Green Version]
  60. Li, J.; Bioucas-Dias, J.M.; Plaza, A. Semi-supervised hyperspectral image segmentation using multinomial logistic regression with active learning. IEEE Trans. Geosci. Remote Sens. 2010, 48, 4085–4098. [Google Scholar]
  61. Hunter, D.R.; Lange, K. A tutorial on MM algorithms. Amer. Statistician 2004, 58, 30–37. [Google Scholar] [CrossRef]
  62. Borges, J.S.; Bioucas-Dias, J.M.; Marçal, A.R.S. Fast Sparse Multinomial Regression Applied to Hyperspectral Data. In Proceedings of the Third International Conference on Image Analysis and Recognition—Volume Part II, Póvoa de Varzim, Portugal, 18–20 September 2006; Springer: Berlin, Germany, 2006. [Google Scholar]
  63. Fan, R.E.; Chang, K.W.; Hsieh, C.J.; Wang, X.R.; Lin, C.J. LIBLINEAR: A library for large linear classification. J. Mach Learn. Res. 2008, 9, 1871–1874. [Google Scholar]
  64. Chang, C.-C.; Lin, C.-J. LIBSVM: A library for support vector machines. ACM Trans. Intell. Syst. Technol. 2011, 2, 27. [Google Scholar] [CrossRef]
  65. Mao, K.Z. RBF neural network center selection based on Fisher ratio class separability measure. IEEE Trans. Neural Netw. 2002, 13, 1211–1217. [Google Scholar] [CrossRef] [PubMed]
  66. Wang, L. Feature selection with kernel class separability. IEEE Trans. Pat. Anal. Mach. Intell. 2008, 30, 1534–1546. [Google Scholar] [CrossRef] [PubMed]
  67. Pan, C.; Gao, X.; Wang, Y.; Li, J. Markov random fields integrating adaptive interclass-pair penalty and spectral similarity for hyperspectral image classification. IEEE Trans. Geosci. Remote Sens. 2018, 57, 2520–2534. [Google Scholar] [CrossRef]
  68. Ray, W.J.; Cole, H.W. EEG alpha activity reflects attentional demands, and beta activity reflects emotional and cognitive processes. Science 1985, 228, 750–752. [Google Scholar] [CrossRef]
  69. Klimesch, W.; Doppelmayr, M.; Russegger, H.; Pachinger, T.; Schwaiger, J. Induced alpha band power changes in the human EEG and attention. Neurosci. Lett. 1998, 244, 73–76. [Google Scholar] [CrossRef]
  70. Onton, J.; Makeig, S. High-frequency broadband modulations of electroencephalographic spectra. Front. Neurosci. 2009, 3, 61. [Google Scholar] [CrossRef] [PubMed] [Green Version]
  71. Mu, L.; Lu, B.-L. Emotion classification based on gamma-band EEG. In Proceedings of the Annual International Conference of the IEEE, Minneapolis, MN, USA, 3–6 September 2009; pp. 1323–1326. [Google Scholar]
  72. Yoon, H.J.; Chung, S.Y. EEG-based emotion estimation using Bayesian weighted-log-posterior function and perceptron convergence algorithm. Comput. Biol. Med. 2013, 43, 2230–2237. [Google Scholar] [CrossRef] [PubMed]
  73. Atkinson, J.; Campos, D. Improving BCI-based emotion recognition by combining EEG feature selection and kernel classifiers. Expert Syst. Appl. 2016, 47, 35–41. [Google Scholar] [CrossRef]
  74. Rozgic, V.; Vitaladevuni, S.N.; Prasad, R. Robust the EEG emotion classification using segment level decision fusion. In Proceedings of the IEEE Conference of Acoustics, Speech, and Signal Processing (ICASSP), Vancouver, BC, Canada, 26–31 May 2013; pp. 1286–1290. [Google Scholar]
  75. Li, X.; Song, D.; Zhang, P.; Yu, G.; Hu, B. Emotion recognition from multi-channel the EEG data through convolutional recurrent neural network. In Proceedings of the IEEE International Conference on Bioinformatics and Biomedicine (BIBM), Shenzhen, China, 15–18 December 2016; pp. 352–359. [Google Scholar]
  76. Tripathi, S.; Acharya, S.; Sharma, R.D.; Mittal, S.; Bhattacharya, S. Using deep and convolutional neural networks for accurate emotion classification on DEAP dataset. In Proceedings of the Twenty-Ninth AAAI Conference on Innovative Applications (IAAI-17), Austin, TX, USA, 25–30 January 2015; pp. 4746–4752. [Google Scholar]
  77. Alhagry, S.; Fahmy, A.A.; El-Khoribi, R.A. Emotion recognition based on EEG using LSTM recurrent neural network. Emotion 2017, 8, 355–358. [Google Scholar] [CrossRef] [Green Version]
  78. Salama, E.S.; El-Khoribi, R.A.; Shoman, M.E.; Shalaby, M.A.W. EEG-based emotion recognition using 3D convolutional neural networks. Int. J. Adv. Comput. Sci. Appl. 2018, 9, 329–337. [Google Scholar] [CrossRef]
  79. Liu, Y.; Ayaz, H.; Shewokis, P.A. Multisubject “learning” for mental workload classification using concurrent EEG, fNIRS, and physiological measures. Front. Hum. Neurosci. 2017, 11, 389. [Google Scholar] [CrossRef] [PubMed] [Green Version]
  80. Saadati, M.; Nelson, J.; Ayaz, H. Multimodal fNIRS-EEG Classification Using Deep Learning Algorithms for Brain-Computer Interfaces Purposes. In Proceedings of the International Conference on Applied Human Factors and Ergonomics, Washington, DC, USA, 24–28 July 2019; pp. 209–220. [Google Scholar]
Figure 1. 2D valence-arousal emotion model by Russell.
Applsci 10 01619 g001
Figure 2. Images used for self-assessment manikins (SAM): (a) Valence SAM, (b) arousal SAM.
Applsci 10 01619 g002
Figure 3. International 10-20 system for 32 electrodes (marked with blue circles).
Applsci 10 01619 g003
Figure 4. Effects of the different frequency bands (Delta, Theta, Alpha, Beta, Gamma, and Total) on the classification precisions for LV/HV emotions obtained by the LORSAL, SVM, and NB classifiers for the five different features: (a) PSD, (b) DE, (c) DASM, (d) RASM, (e) DCAU.
Applsci 10 01619 g004
Figure 5. Effects of the different frequency bands (Delta, Theta, Alpha, Beta, Gamma, and Total) on the classification precisions for LA/HA emotions obtained by the LORSAL, SVM, and NB classifiers for the five different features: (a) PSD, (b) DE, (c) DASM, (d) RASM, (e) DCAU.
Applsci 10 01619 g005
Figure 6. Fisher ratio of features extracted on different frequency bands by averaging the values over all subjects in (a) valence and (b) arousal dimensions, respectively.
Applsci 10 01619 g006
Figure 7. Effects of the different features (PSD, DE, DASM, RASM, and DCAU) on the classification precisions for LV/HV emotions obtained by the LORSAL, SVM, and NB classifiers from the six different frequency bands: (a) Delta, (b) Theta, (c) Alpha, (d) Beta, (e) Gamma, (f) Total.
Applsci 10 01619 g007aApplsci 10 01619 g007b
Figure 8. Effects of the different features (PSD, DE, DASM, RASM, and DCAU) on the classification precisions for LA/HA emotions obtained by the LORSAL, SVM, and NB classifiers from the six different frequency bands: (a) Delta, (b) Theta, (c) Alpha, (d) Beta, (e) Gamma, (f) Total.
Applsci 10 01619 g008aApplsci 10 01619 g008b
Table 1. The mean precisions and standard deviations (%) of the classification of LV/HV emotions obtained by the compared classifiers for different features extracted from different frequency bands.
FeatureClassifierDeltaThetaAlphaBetaGammaTotal
PSDNB54.18/5.3953.94/5.2454.25/5.0858.85/7.6361.23/8.4860.51/6.71
SVM51.14/14.3147.57/15.7552.35/16.0462.97/12.1864.15/12.1969.04/5.91
LR_L144.80/4.6345.23/4.7244.00/5.5138.41/8.7536.18/9.6734.43/9.52
LR_L244.57/4.8845.11/4.9244.14/5.4938.47/8.6336.38/9.5834.38/9.57
LORSAL56.45/5.7956.19/5.3458.29/5.5664.95/6.7868.30/7.9863.29/6.54
DENB54.27/3.6253.90/3.5354.62/4.0759.19/5.5961.52/6.5161.04/5.76
SVM52.08/13.5449.76/14.1452.04/13.4162.91/10.2365.88/9.9369.55/6.58
LR_L144.04/4.8044.67/4.7343.16/5.3438.22/8.6736.08/9.5233.69/9.88
LR_L243.86/4.8844.44/4.6943.15/5.4138.15/8.6436.06/9.5233.81/9.59
LORSAL61.79/4.5558.34/3.9059.20/4.0467.06/6.9572.93/7.3077.17/6.37
DASMNB54.81/6.6153.97/5.5354.07/6.1260.18/6.1662.27/6.8862.36/5.66
SVM45.64/14.1144.66/14.7744.83/14.6656.24/13.1860.95/12.1464.48/10.21
LR_L145.32/4.1145.77/3.8945.41/4.8640.68/7.4538.83/8.7936.90/8.82
LR_L245.35/4.0446.03/3.9545.59/4.6640.77/7.5338.84/8.6837.11/8.80
LORSAL58.38/3.5855.21/3.5555.42/3.4660.31/5.3964.63/6.2271.63/4.94
RASMNB51.17/6.5551.61/7.3751.02/6.9854.90/8.5758.08/9.4755.65/6.77
SVM37.41/15.4537.23/14.3337.35/13.8740.56/16.2447.29/17.0248.17/17.72
LR_L149.39/6.0748.19/5.5548.17/6.2445.29/6.1142.39/7.4442.71/6.64
LR_L249.45/4.7547.92/4.3047.95/4.7345.44/5.8742.53/6.9742.69/6.37
LORSAL49.31/8.7951.68/8.7151.68/8.9852.55/10.3657.38/9.6951.67/7.53
DCAUNB53.98/6.2252.97/6.7353.72/6.0359.61/5.7061.97/6.5261.95/5.52
SVM43.40/13.4641.11/13.9343.91/14.3955.47/13.8359.57/12.6763.48/9.93
LR_L145.94/4.2446.26/4.1145.82/4.4141.38/7.3239.19/8.2937.41/8.21
LR_L246.03/4.2346.45/4.1145.74/4.3841.33/7.2439.21/8.3537.45/8.22
LORSAL57.01/3.3854.68/3.5955.20/3.5559.38/5.6163.54/6.2169.89/4.89
Table 2. The mean precisions and standard deviations (%) of the classification of LA/HA emotions obtained by the compared classifiers for different features extracted from different frequency bands.
FeatureClassifierDeltaThetaAlphaBetaGammaTotal
PSDNB54.22/5.3753.08/5.6653.82/5.3055.39/8.0358.44/8.9457.54/6.15
SVM50.83/15.9348.07/15.649.95/15.6558.05/15.3158.82/15.0868.60/8.07
LR_L147.74/6.0747.96/5.6647.46/6.4945.34/9.9744.11/11.6743.55/14.04
LR_L247.66/6.3147.94/5.7847.42/6.4145.47/9.9644.03/11.6443.58/14.23
LORSAL57.45/6.7556.91/6.8658.82/6.2363.99/6.4767.75/7.0561.62/6.64
DENB54.13/3.7653.43/3.6854.08/3.7656.97/4.8158.75/5.3358.46/5.00
SVM46.90/14.5345.03/14.9347.51/14.5755.88/13.3463.33/12.7969.92/7.94
LR_L147.29/6.5247.69/5.9346.96/6.8145.26/10.8844.16/12.9943.10/15.21
LR_L247.38/6.4047.81/5.8946.91/6.8845.29/11.0344.12/13.0343.25/15.00
LORSAL61.97/4.6458.18/3.9459.35/3.9766.57/6.6772.73/7.6277.03/6.20
DASMNB54.67/6.1054.78/6.3354.31/7.6858.11/5.7560.46/5.2860.34/4.50
SVM43.95/13.2442.84/13.3843.02/12.5351.24/14.6956.42/13.6861.79/12.34
LR_L148.07/5.7548.16/4.9847.91/5.3445.99/8.4145.45/10.6744.60/12.33
LR_L248.13/5.6448.05/5.1847.76/5.3845.93/8.4545.43/10.7244.78/12.22
LORSAL58.13/3.7555.14/3.6255.18/3.3759.70/4.9464.54/5.8771.20/4.96
RASMNB51.31/7.5751.92/7.1251.01/6.4754.25/6.5255.26/6.8453.57/4.25
SVM36.59/13.0435.31/11.3136.18/12.4937.79/14.0542.61/17.1243.46/15.61
LR_L149.45/6.0749.07/4.9750.18/4.3249.14/5.7547.83/7.3547.94/7.39
LR_L249.44/5.0849.16/4.4150.19/4.2249.05/5.7347.92/7.2148.10/7.31
LORSAL49.09/10.6050.93/10.7950.15/10.9550.14/11.3653.51/11.0750.67/8.33
DCAUNB55.09/7.1053.86/6.9153.98/7.4256.98/7.2360.14/5.9959.98/4.50
SVM42.34/13.4741.56/13.2643.19/13.2650.64/13.7655.06/14.9960.04/12.79
LR_L148.19/5.4248.36/4.9048.01/5.1846.34/8.2445.29/10.0544.47/11.45
LR_L248.21/5.3148.38/5.0447.86/5.1446.29/8.1345.33/9.9344.61/11.51
LORSAL57.16/3.6954.49/3.6555.18/3.4658.09/4.9962.68/5.6068.48/4.93
Table 3. The mean metrics and standard deviations (%) of precision, recall, and F1 for the binary classification of LV/HV and LA/HA emotions obtained by the compared classifiers for different features extracted the total frequency bands.
FeatureClassifierValenceArousal
PrecisionRecallF1PrecisionRecallF1
PSDNB60.51/6.7156.65/4.9948.84/9.5457.54/6.1554.95/4.2946.86/8.54
SVM69.04/5.9165.62/6.5565.24/7.3968.60/8.0761.09/6.1760.41/7.47
LORSAL63.29/6.5462.15/6.6561.84/7.2761.62/6.6459.02/5.5358.46/6.54
DENB61.04/5.7660.31/5.1958.83/5.4858.46/5.0058.96/5.0555.84/5.74
SVM69.55/6.5866.93/6.5066.89/7.1569.92/7.9463.50/6.5763.45/7.54
LORSAL77.17/6.3776.79/6.2176.90/6.2777.03/6.2076.15/6.1476.47/6.14
DASMNB62.36/5.6662.18/5.5461.73/5.5760.34/4.5060.79/4.9059.76/4.77
SVM64.48/10.2163.01/7.1562.01/9.1161.79/12.3459.06/6.3657.49/8.46
LORSAL71.63/4.9471.38/4.9271.43/4.9271.20/4.9670.68/5.0070.82/4.94
RASMNB55.65/6.7753.72/4.6446.01/7.9253.57/4.2552.38/2.9540.70/6.37
SVM48.17/17.7252.47/5.2443.24/9.5643.46/15.6150.25/0.9840.00/3.72
LORSAL51.67/7.5351.35/2.9846.69/5.4950.67/8.3350.60/2.1145.32/3.94
DCAUNB61.95/5.5261.65/5.4461.26/5.4859.98/4.5060.14/4.5059.36/4.37
SVM63.48/9.9362.09/6.5160.99/8.5960.04/12.7958.21/6.3256.12/8.76
LORSAL69.89/4.8969.68/4.7769.71/4.8168.48/4.9368.11/4.9068.19/4.88
Table 4. Fisher ratio of different frequency bands by averaging the values over all features and subjects in valence and arousal dimensions, respectively.
EmotionValenceArousal
Frequency BandsDeltaThetaAlphaBetaGammaDeltaThetaAlphaBetaGamma
PSD0.0460.0050.0140.1550.4140.0450.0050.0130.1240.418
DE0.0470.0520.0770.2420.2560.0510.0480.0620.1730.197
DASM0.0570.0630.0700.2400.3170.0680.0730.0670.1860.243
RASM0.0040.0500.0370.1310.1150.0040.0650.0520.0950.080
DCAU0.0590.0620.0640.2240.3070.0620.0640.0670.1950.244
Table 5. Comparison of the introduced LORSAL methods, the other shallow classifiers, and the deep learning approaches for EEG-based emotion recognition of LV/HV and LA/HA on DEAP dataset.
ClassifierValenceArousal Description
NBby Koelstra et al. [27]57.662.02-class classification for valence and arousal, and within-subject emotion recognition.
Bayesian weighted-log-posteriorby Yoon et al. [72]70.970.1
SVM+mRMRby Atkinson et al. [73]73.4173.06
Segment level decision fusionby Rozgić et al. [74]76.968.4
CNN+RNNby Li et al. [75]72.0674.12
DNNby Tripathi et al. [76]75.7873.12
CNN81.4173.36
LSTM-RNNby Alhagry et al. [77]85.6585.45
3D-CNNby Salama et al. [78]87.4488.49
GELMby Zheng et al. [48]69.74-class classification in VA space.
SVM+Rawby Chen et al. [33]0.55900.75252-class classification for valence and arousal, and within-subject emotion recognition, and AUC (Area Under ROC Curve) used for evaluation.
+Norm0.55910.5590
+PSD0.75960.5531
+PSD+Raw0.92340.9462
+PSD+Norm0.74600.7353
CVCNN+Raw0.62210.6012
+Norm0.65510.6176
+PSD0.93070.88.51
+PSD+Raw0.99330.9988
+PSD+Norm1.001.00
GSCNN+Raw0.62420.5902
+Norm0.63940.5987
+PSD0.88750.8802
+PSD+Raw0.99330.9930
+PSD+Norm1.001.00
GSLTCNN+Raw0.67170.6175
+Norm0.63500.5670
+PSD0.85230.8390
+PSD+Raw0.99460.9958
+PSD+Norm1.001.00
CNN+Rawby Chen et al. [34]57.256.32-class classification for valence and arousal, and cross-subject emotion recognition
LSTM63.761.9
H-ATT-BGRU67.966.5
NB+DEin our study61.0458.462-class classification for valence and arousal, and within-subject emotion recognition
SVM69.5569.92
MLR_L133.6943.10
MLR_L233.8143.25
LORSAL77.1777.03
Table 6. Running time of the compared NB, SVM, MLR_L1, MLR_L2, and LORSAL methods in terms of second and the average time-consumption of feature extraction is 68.15 s.
ClassifierValenceArousal
PSDDEDASMRASMDCAUPSDDEDASMRASMDCAU
NB4.374.361.911.921.514.424.411.931.933.44
SVM4.534.372.342.472.044.264.162.262.343.45
MLR_L10.140.130.040.040.030.170.150.040.040.08
MLR_L20.120.110.040.040.030.130.110.040.040.07
LORSAL3.753.893.873.693.853.743.863.863.693.87

