Article

Developing Hybrid Machine Learning Models for Estimating the Unconfined Compressive Strength of Jet Grouting Composite: A Comparative Study

1
Key Laboratory of Deep Coal Resource Mining, Ministry of Education of China; School of Mines; China University of Mining and Technology, Xuzhou 221116, China
2
Department of Civil, Environmental and Mining Engineering, the University of Western Australia, Perth 6009, Australia
*
Authors to whom correspondence should be addressed.
Appl. Sci. 2020, 10(5), 1612; https://doi.org/10.3390/app10051612
Submission received: 11 February 2020 / Revised: 20 February 2020 / Accepted: 23 February 2020 / Published: 28 February 2020
(This article belongs to the Special Issue Meta-heuristic Algorithms in Engineering)

Abstract

:
Coal-grout composites were fabricated in this study using the jet grouting (JG) technique to enhance coal mass in underground conditions. To evaluate the mechanical properties of the created coal-grout composite, its unconfined compressive strength (UCS) needed to be tested. A mathematical model is required to elucidate the unknown nonlinear relationship between the UCS and the influencing variables. In this study, six computational intelligence techniques using machine learning (ML) algorithms were used to develop the mathematical models, which includes back-propagation neural network (BPNN), random forest (RF), decision tree (DT), support vector machine (SVM), k-nearest neighbors (KNN), and logistic regression (LR). In addition, the hyper-parameters in these typical algorithms (e.g., the hidden layers in BPNN, the gamma in SVM, and the number of neighbor samples in KNN) were tuned by the recently developed beetle antennae search algorithm (BAS). To prepare the dataset for these ML models, three types of cementitious grout and three types of chemical grout were mixed with coal powders extracted from the Guobei coalmine, Anhui Province, China to create coal-grout composites. In total, 405 coal-grout specimens in total were extracted and tested. Several variables such as grout types, coal-grout ratio, and curing time were chosen as input parameters, while UCS was the output of these models. The results show that coal-chemical grout composites had higher strength in the short-term, while the coal-cementitious grout composites could achieve stable and high strength in the long term. BPNN, DT, and SVM outperform the others in terms of predicting the UCS of the coal-grout composites. The outstanding performance of the optimum ML algorithms for strength prediction facilitates JG parameter design in practice and could be the benchmark for the wider application of ML methods in JG engineering for coal improvement.

1. Introduction

Jet grouting (JG) has been a widely applied approach for the stabilization of loose materials such as soil, fragmented rock, coal, etc. [1]. Generally, a stabilizing fluid is injected into soft materials under high velocity and pressure [2]. The injecting equipment is composed of a JG string with a nozzle at the end, which can inject the fluid into the soft materials via a rotary motion as the string is raised and rotated slowly [3,4]. Usually, cementitious grout or chemical grout can be utilized as blinders to consolidate the loose materials in order to improve their mechanical properties, such as unconfined compressive strength (UCS).
In underground coal mines, the coal-grout composites created by the JG technique were used as a new support material. Due to its cutting and erosion effect, the mechanical properties of the raw coal were completely changed by the injected grout [5,6]. After the JG process, a rigid coal-grout pile surrounded by coal mass was formed with low deformability and high strength, which can provide a sufficient support for roadways in coal mines [7,8,9,10]. In practice, conducting UCS tests is an extensively used approach to assess the supporting ability of support materials [11,12,13]. However, UCS tests are time-consuming and costly since many influencing variables should be considered. To address this problem, an indirect method for evaluating the UCS of supporting materials is to establish empirical equations based on statistical regression [14,15]. Nevertheless, some empirical rules used for designing JG parameters are often conservative and have limited applicability [12]. In addition, the nonlinear relationship between the UCS and the multiple influencing variables is unknown, which makes it more difficult to develop empirical equations [16,17]. Therefore, to predict the UCS of coal-grout composites efficiently and accurately, some computational models are necessary.
In recent years, machine learning (ML) based models have been used extensively in rock materials [18,19], composite materials [5,20,21,22,23,24], and other areas [25,26,27]. Due to the high-efficiency performance for data processing, the outputs could be predicted accurately by using the inputs without knowing their relationship, which can reduce the need for time- and money-consuming experiments. However, to the author’s knowledge, no relevant studies on the strength prediction of jet grouted coal-grout composites using ML methods have been reported, since the coal-grout composite is a relatively new support material. In addition, compared with the one or two conventional ML methods used in the composites mentioned above, more advanced ML algorithms, such as decision tree (DT) and random forest (RF), should also be applied to study their feasibility in coal-grout composites.
In the current paper, six algorithms, such as DT, RF, the back-propagation neural network (BPNN), k-nearest neighbors (KNN), support vector machine (SVM), and logistic regression (LR), were used to evaluate the UCS of coal-grout composites combining influencing variables (i.e., coal-grout ratio, grout types, and curing time). Some experimental UCS values were used to construct a dataset to train and validate our proposed models. The performances of these algorithms were compared and discussed
The evaluation of coal-grout composite is of significance before JG application in the field. Therefore, to determine the composite accurately and rapidly, the ML methods were proposed and utilized. Considering several key influence variables and the UCS of coal grout composite, non-linear relations were established by intelligent models. This novel work provides some new and fast approaches to estimate coal-grout composite strength, which can promote the JG design and contribute to the artificial intelligence application.

2. Machine Learning Algorithms

2.1. Applied ML Algorithms

Six ML algorithms (i.e., BPNN, SVM, DT, RF, KNN, and LR) were applied to establish the relationship between the UCS of coal-grout composites and the input variables, i.e., grout types, coal-grout ratio, and curing time. The simple descriptions of these algorithms are summarized as follows:
BPNN is a type of artificial neural networks (ANN). The main advantage is that the weight by the error between the real values and calculated output can be adjusted and iterated using back propagation [28]. SVM uses the hyperplane to classify samples into various classes [29]. DT can partition the labeled dataset recursively into increasing small subdivisions according to a set stop criterion until a suitable breakdown level is reached [30]. RF uses an ensemble of classification trees to achieve classification and regression [31]. K-NN is a non-parametric and instance-based learning model for classification and regression [32]. LR is an extensively applied approach to classify dependent variables. LR aims to find the best hypothesis to establish the relationship between outcome and variables [33].

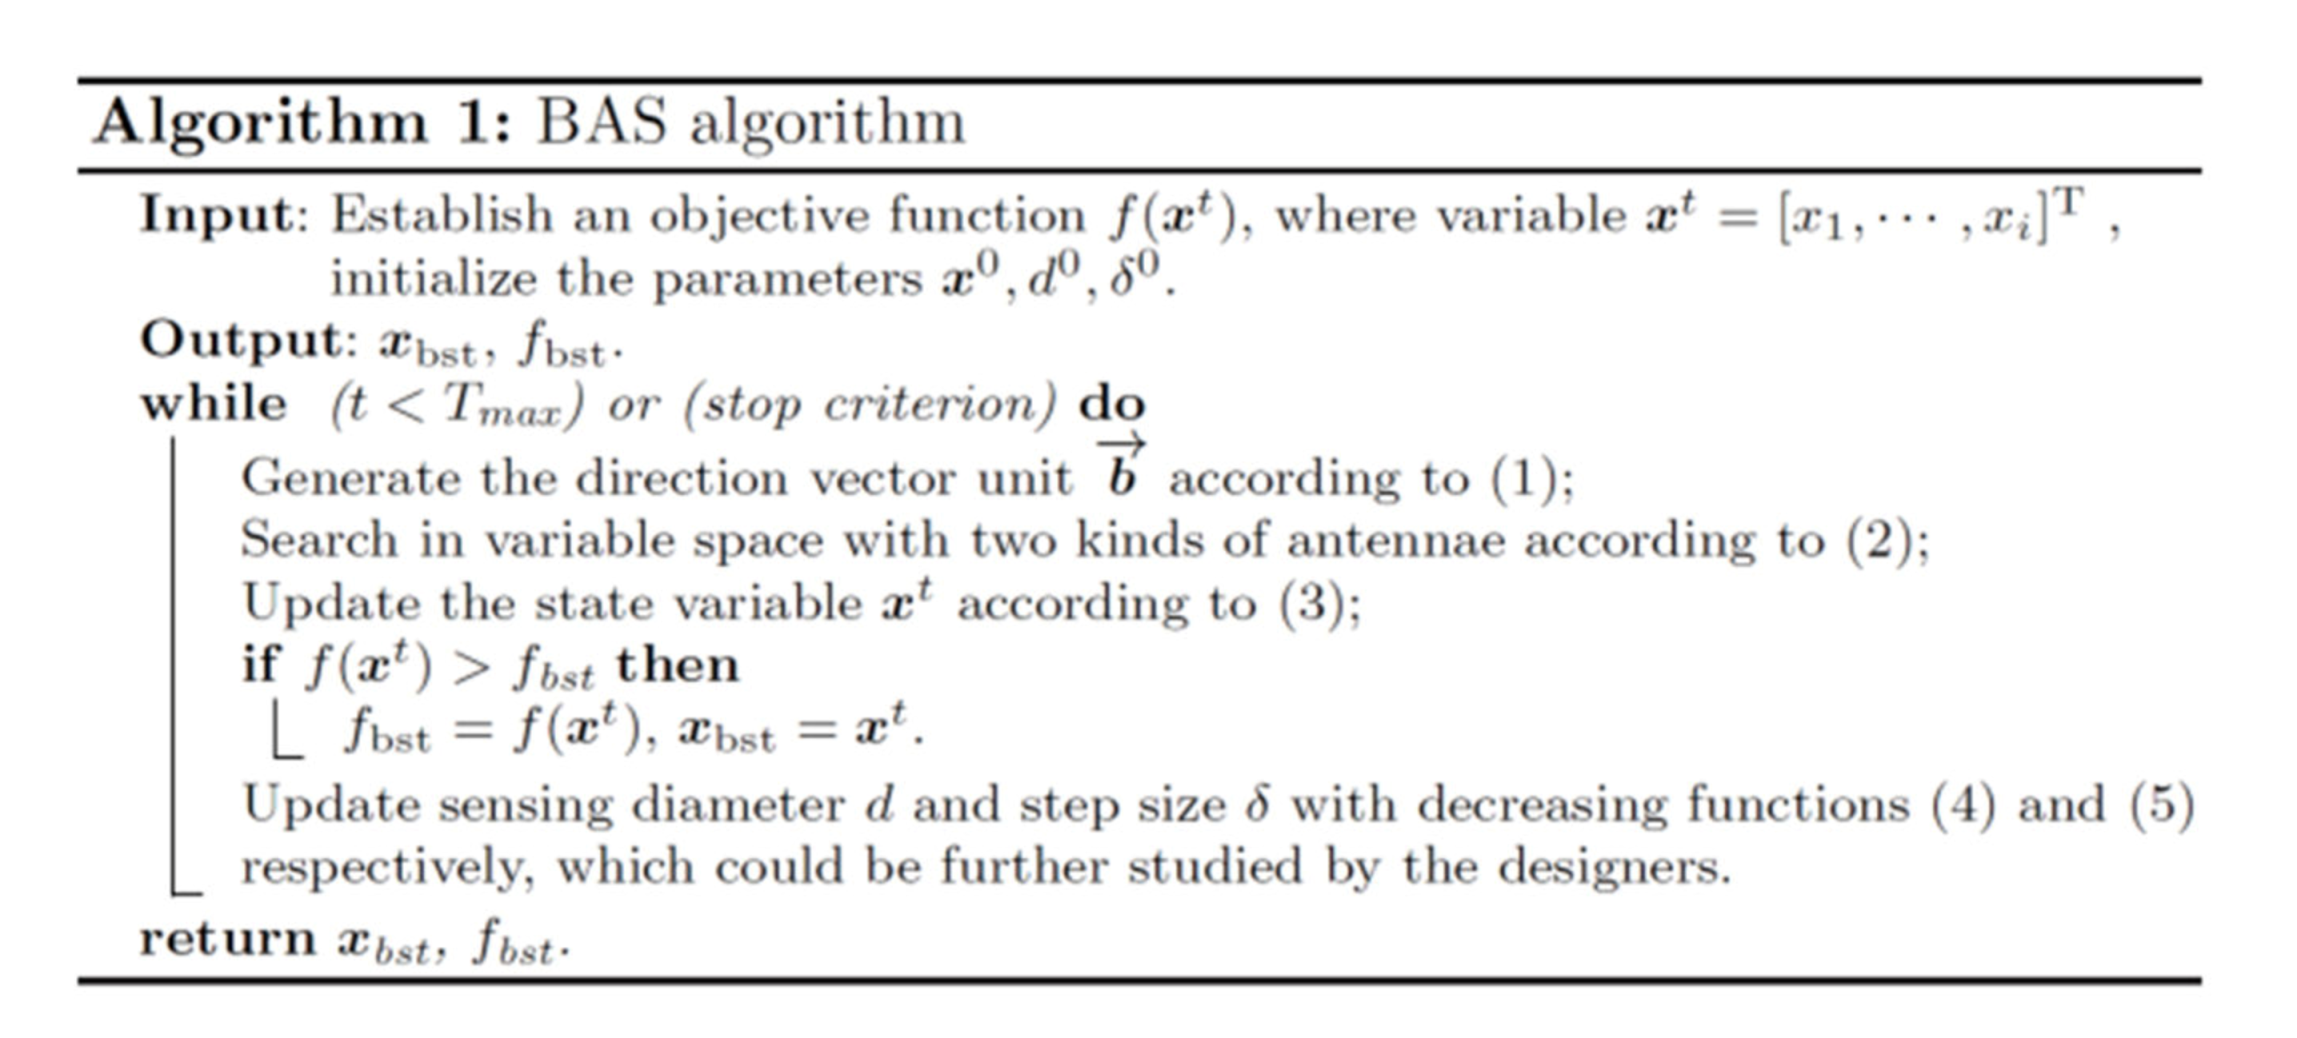
2.2. Beetle Antennae Search Algorithm (BAS)

The hyper-parameters of these six algorithms were tuned by BAS and the definitions of the hyper-parameters are summarized in Table 1. BAS can be used for global optimization questions [34]. It simulates the behavior of beetle. The pseudo code is shown in Figure 1.
The searching behavior is expressed as follows:
b = rnd ( k , 1 ) rnd ( k , 1 )
x r = x t + d t b x l = x t d t b
where b is a normalized random unit vector, rnd(.) means a random function, k is the dimensions of the position, and d is the sensing length of antennae; x r and x l represent the right and left searching area.
The detecting behavior is as follows:
x t = x t 1 + δ t b sign ( f ( x r ) f ( x l ) )
where δ is the step size of each iteration, and sign(.) means a sign function.
The antennae length d and step size δ are given as follows:
d t = 0.95 d t 1 + 0.01
δ t = 0.95 δ t 1 .

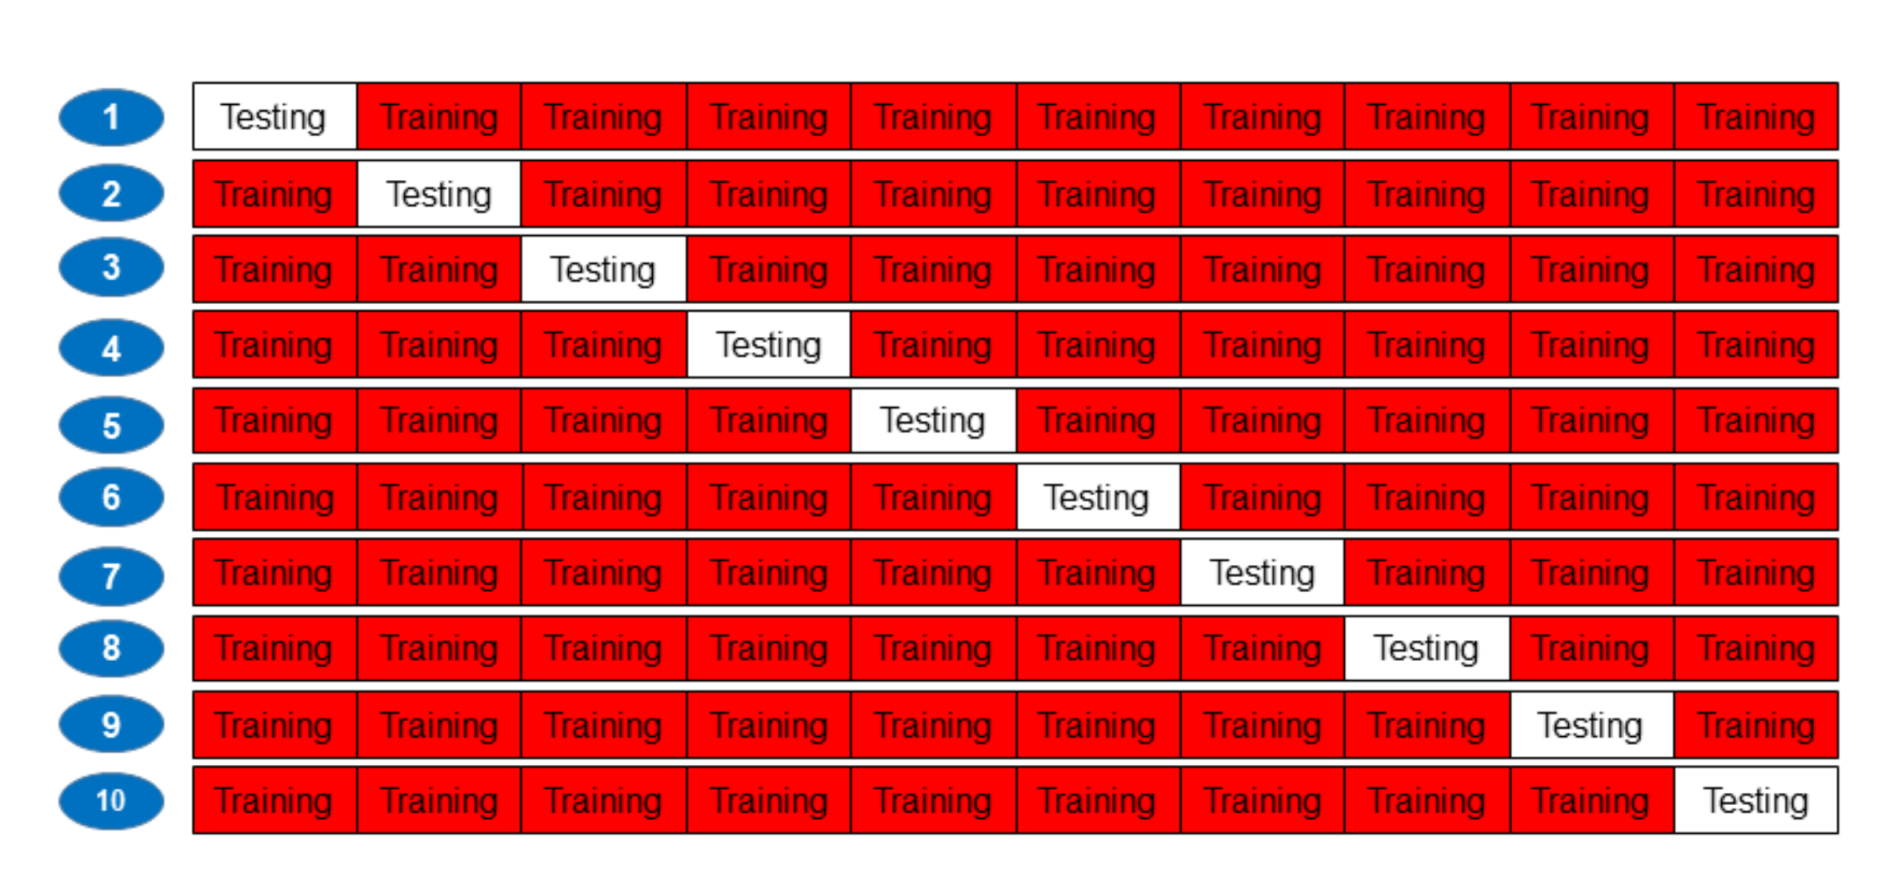
2.3. K-Fold Cross-Validation

To validate the regression model, some methods have been used, such as the simple substitution method [35], bootstrap method [36], holdout method [37], and bolstered method [38]. The k-fold cross-validation (CV) was employed for the training data in this paper [39], in which k was assigned to be 10 according to the recommendations and number of datasets. During hyper-parameter tuning, the training data were divided into 10 folds. Nine folds were used for training, while other one was used for validating (see Figure 2). The final result of a model was the average of the 10 results from the 10 rounds. By this method, the overfitting problem can be overcome.

2.4. Hyper-Parameter Tuning

As mentioned above, 10-fold CV and BAS were employed for tuning the hyper-parameters of the described ML algorithms. To validate the performance of hyper-parameter tuning and model, the mean squared error (MSE) and correlation coefficient (R) are applied for evaluation. MSE and R are defined as following [40]:
MSE = 1 N i = 1 N ( y i * y i ) 2
R = i = 1 N ( y i * y * ¯ ) ( y i y ¯ ) i = 1 N ( y i * y * ¯ ) 2 i = 1 N ( y i y ¯ ) 2
MAE = 1 N i = 1 N ( y i * y i )
MAPE = 1 N i = 1 N | y i * y i y i |
where N means the numbers of specimens; y* i and yi represent the predicted values and actual values, respectively; and y ¯ and y * ¯ are the mean predicted values and mean real values.
The hyper-parameters of the six proposed algorithms were first tuned by BAS, and then the trained regression models were compared. Specifically, according to the 10-folder CV approach, the 9 data sets for training were employed for searching the optimum hyper-parameters of the algorithms (e.g., the hidden layers in BPNN, the gamma in SVM, the number of samples at a leaf node in DT, the number of neighbor samples in KNN, etc.) by BAS several times. The smallest RMSE in the validation set could be selected after iterations. Consequently, the best ML models and their ideal hyper-parameters were selected after 10 folds.
The flowchart for applying the six proposed algorithms tuned by BAS is displayed in Figure 3. It should be pointed out that to overcome the local minima issue, a key modification to BAS was introduced (i.e., the Levy flight strategy for adjusting the step size of BAS) [41,42,43]. To enlarge the size step and avoid a lock optimum, the equation is triggered as follows:
δ ( i ) = α | L e v y | δ ( i 1 )
where α is a randomization parameter, α [ 0 ,   1 ] , is entrywise multiplications, and | L e v y | represents a Levy distribution:
L e v y ~ u = t λ , ( 1 < λ 3 ) .

3. Materials and Methods
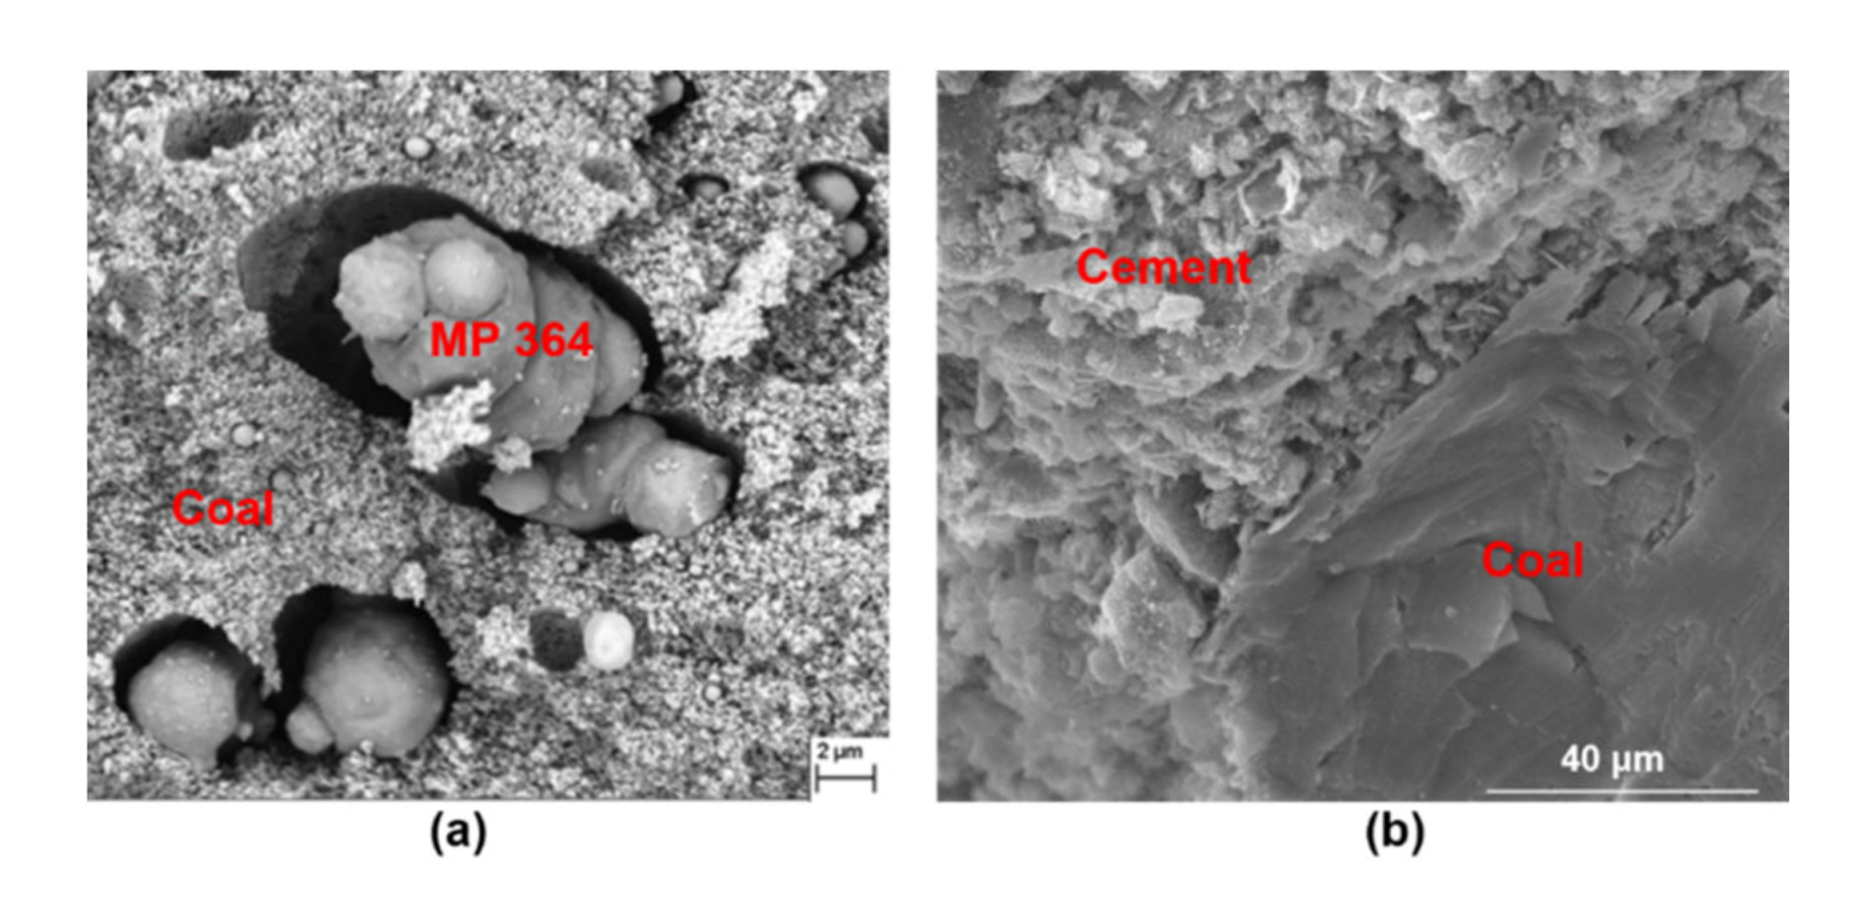
3.1. Materials

Field raw coal, as one of the component materials in coal-grout composites, was extracted from the Guobei coalmine. The coal mass was fragmentized due to its extremely low compressive strength (0.56 MPa) and previous complex tectonic movements. Hence, the JG technique was firstly used to enhance the coal mass for roadway support. According to the experiments and field trial, six types of frequently-used grouting materials (three types of cementitious grouts: P.O 32.5, P.O 42.5, and superfine cement (SF-C) as well as three types of chemical grouts: MP 364, MP 398, and MP 325) were used as binders in this study. For field application, the water-cement ratio was chosen to be 1:1. The chemical grouts consisted of component A and component B with the ratio between A and B being 1:1 according to the trial tests. A five-level coal-grout ratio (0.4:1, 0.6:1, 0.8:1, 1:1, and 1.2:1) was designed to evaluate its influence [44,45]. We tested the 1-, 7-, 14-, and 28-day UCS for all specimens, and we also tested the 4 h UCS only for coal-chemical grout composites due to their high rapid chemical reaction. The specific design of the experiment is given in Table 2. The statics of input and output are summarized in Table 3.

3.2. Specimen Preparation

In practice, to test the UCS of coal-grout composites after grouting, standard samples (normally, of 50 mm and 100 mm in diameter and height, respectively) were drilled from the jet grouted coal-grout piles. Hence, to simulate this procedure, the experimental steps were as follows:
(1)
Preparation of the grout. Cementitious or chemical binders were fully mixed with water and accelerator to achieve the designed cementitious grout or chemical grout.
(2)
Creation of coal-grout composite mixes. The raw coal was then mixed with the cementitious grout or chemical grout by a mixer (HJW-60) for about 5 min and 1 min, respectively.
(3)
Casting of coal-grout composites. The pre-produced coal-grout composite mixes were poured into a rectangular mold. After compaction, the model was placed in a curing chamber for 4 hours (coal-chemical grout only), and 1, 7, 14, and 28 days, respectively. The environment conditions were at approximately 20 °C and 90% humidity.
(4)
Sampling method for fabricating standard specimens. The core-drilling machine (HZ-20) was used to obtain the cylindrical specimens (of 50 mm and 100 mm in diameter and height, respectively) from the casted specimen. To ensure the flatness and parallelism, a grinding machine was utilized.

3.3. UCS Test

The compressive strength data collected from 405 coal-grout composite specimens with different influencing variables were used as the database for presented models. The UCS of specimens was performed as ASTM C39 (ASTM, 2001 [46]) by a testing machine (SANS, Shenzhen, China). The displacement rate of loading was set as 0.5 mm/min. The compressive strength of coal-grout composite was determined according to the maximum values. To improve the reliability of the tests, every test was duplicated three times. Then the average, UCS was regarded as the final strength of composite. Finally, the collected dataset was used for ML models.

3.4. Dataset Partition

For supervised regression problems, the algorithm should be trained and tested. Therefore, the training set and the test set was set based on the UCS dataset of the coal-grout composites. The former was used for training the algorithms and tuning the hyper-parameters. The latter was applied for testing the trained regression models. A smaller training dataset may cause under-fitting, while a larger one may result in over-fitting. Besides, a relatively large dataset is required to verify the generalization capability of the trained algorithms [47]. In this paper, as described above, the crucial influencing parameters, such as the types of grout, coal-grout ratio, and curing time, were regarded as inputs, while UCS was chosen as the output. The MATLAB was used for data processing. The whole database was split into training dataset (70%) and test dataset (30%) based on the study [48].

4. Results and Discussion

4.1. UCS Results of Coal-Grout Composites

Figure 4 shows the UCS results of coal-grout composites. It can be seen that the 7-day UCS of the coal-MP 364 composite is higher than other chemical grout composites with the same coal-grout ratio. As for the cementitious grout composites with the same coal-grout ratio and curing time, the UCS of SF-C composites was the highest followed by coal-P.O 42.5, while coal-P.O 32.5 had the lowest UCS. It can also be observed that the UCS of coal-grout composites decreased with an increasing coal-grout ratio. The possible reason for this is that the coal particles were bonded together by the grout; as the grout decreased, the bonding became weaker [49]. Furthermore, the curing time had different effects on cement-grout and chemical-grout composites. The UCS of coal-chemical grout composites increased and peaked on the seventh day, and then declined. This is due to the rapid chemical reaction of the chemical grout during the early days. However, an obvious shrinkage of the chemical grout was observed after the seventh day, especially in the MP 364 group (shown in Figure 5a). The porous structure affected the overall strength of the chemical grout composites. As for the coal-cement grout composites, the UCS increased with curing time, but the growth rate decreased, which agreed well with much of the literature [50,51,52]. In addition, its average early strength (1-day strength) was lower than the 4 h strength of coal-chemical grout composite. In terms of its microstructure, no clear shrinkage between coal and cement was observed, indicating that cementitious grout performs better than chemical grout (Figure 5b).

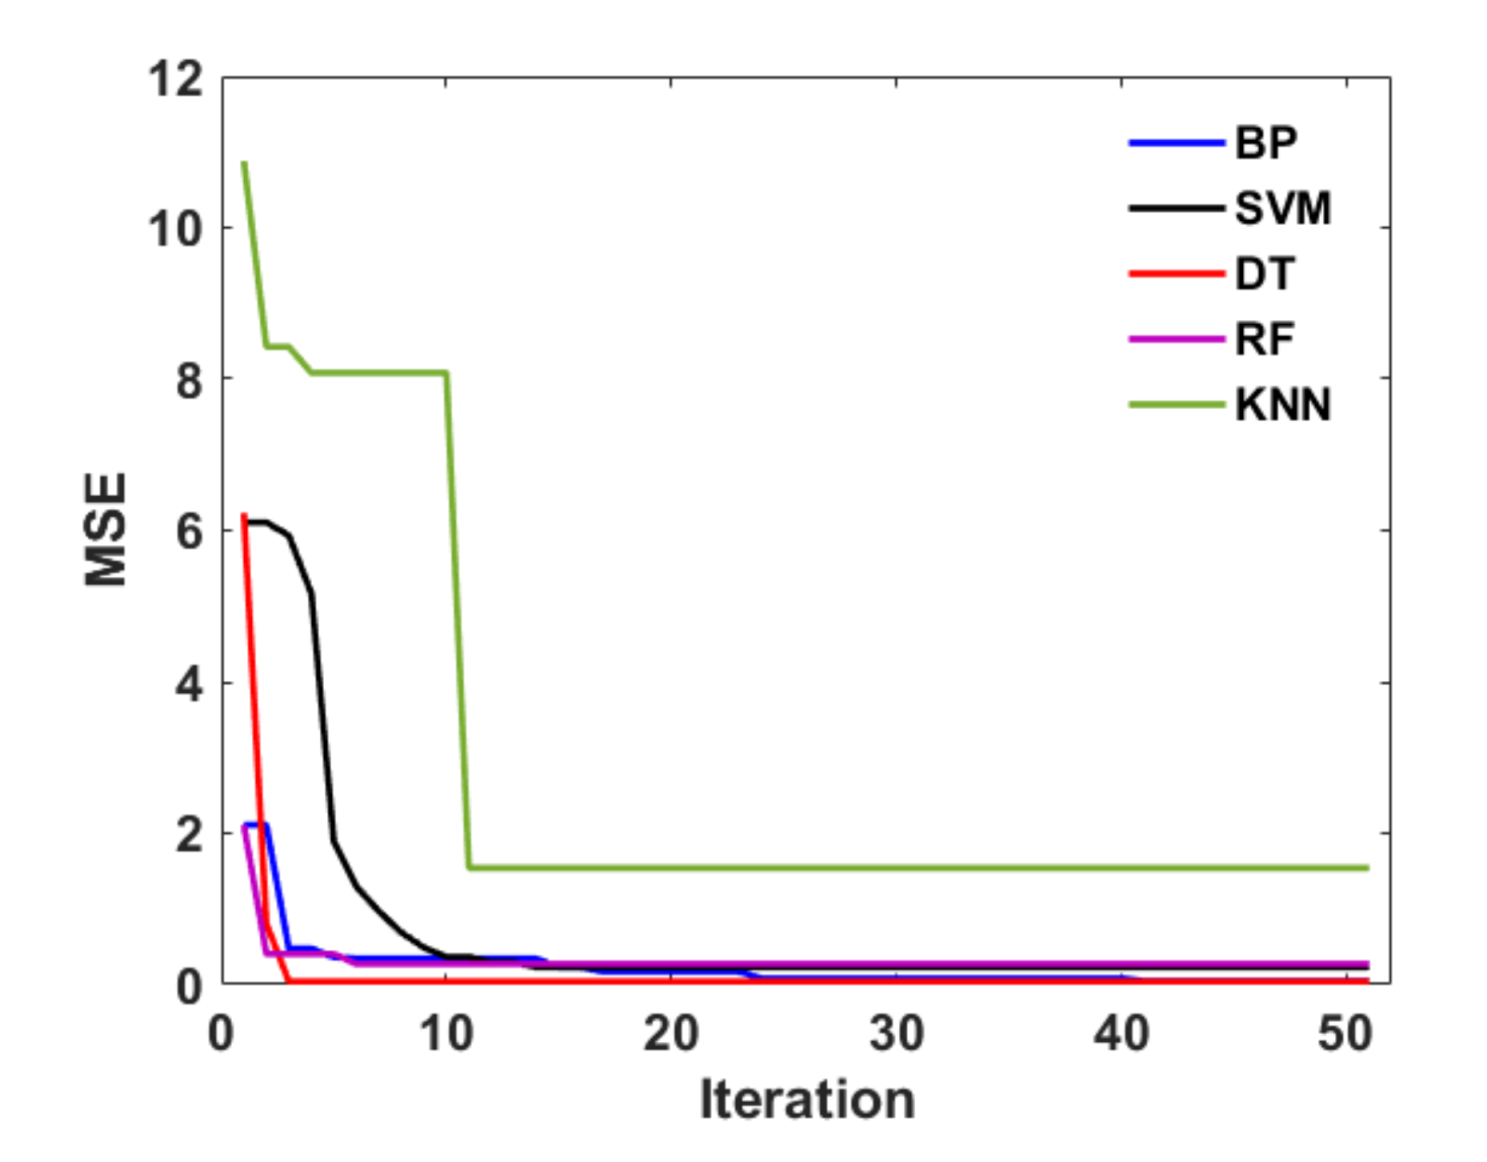
4.2. Results of Hyper-Parameters Tuning

The effectiveness of using BAS to tune hyper-parameters was analyzed by tracing the MSE values of each iteration. Figure 6 shows the average MSE curves versus iteration during the hyper-parameter tuning. Different evolution patterns can be seen for different ML algorithms in terms of the MSE values and convergent rates. It took more time for KNN and SVM to converge than the other three algorithms, and KNN behaved the worst with the largest MSE value after convergence. Also, the MSE of DT decreased sharply with each iteration during BAS tuning to the minimum value among these ML algorithms. This indicates that BAS tuned DT most efficiently. Overall, the ideal hyper parameters of these models could be found by BAS efficiently and reliably. These results of hyper-parameters are shown in Table 4.

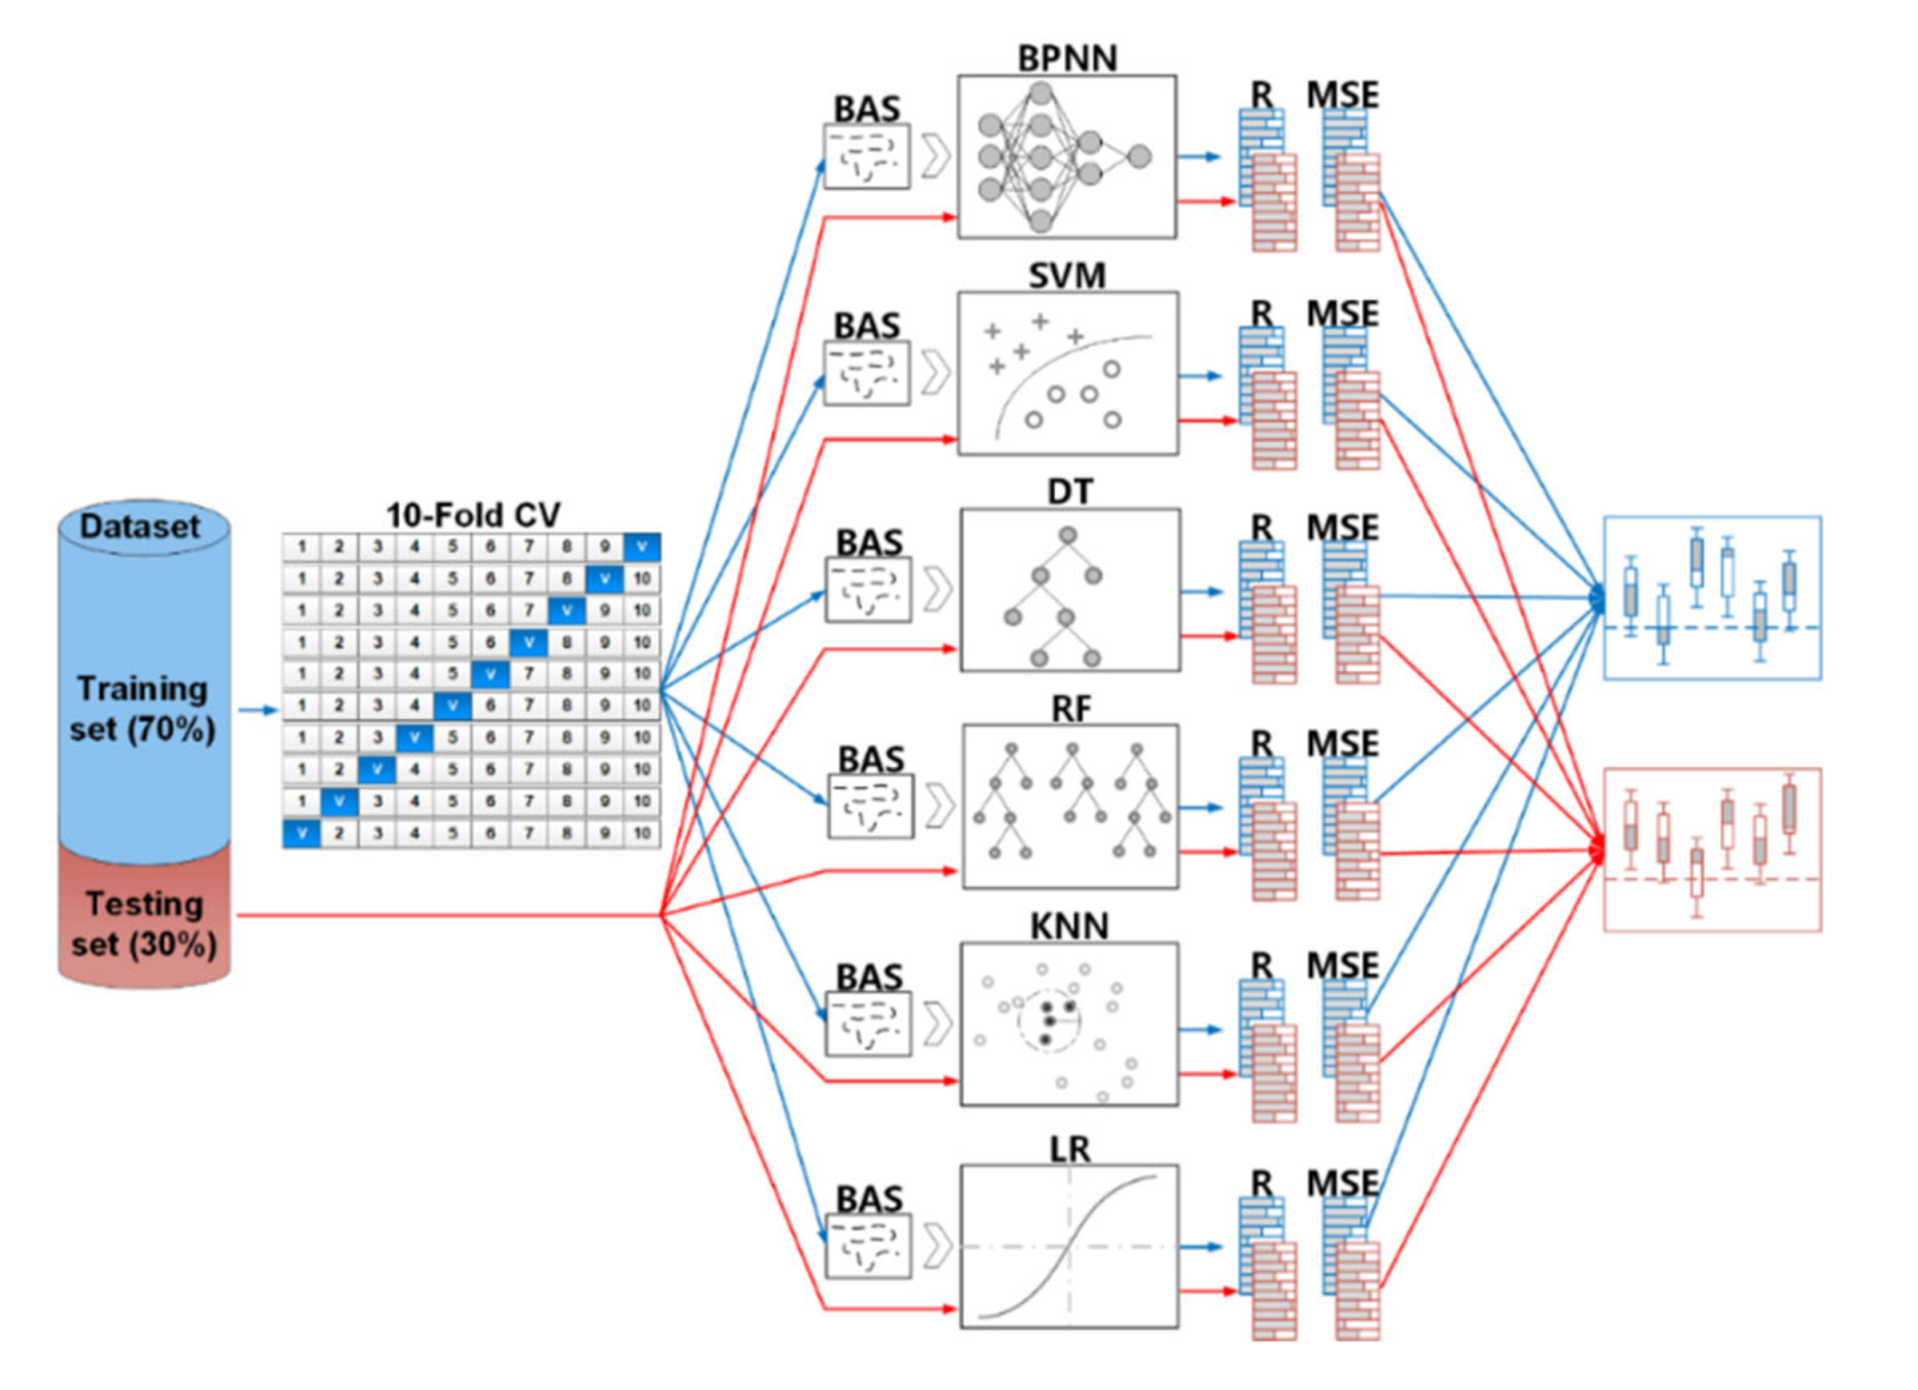
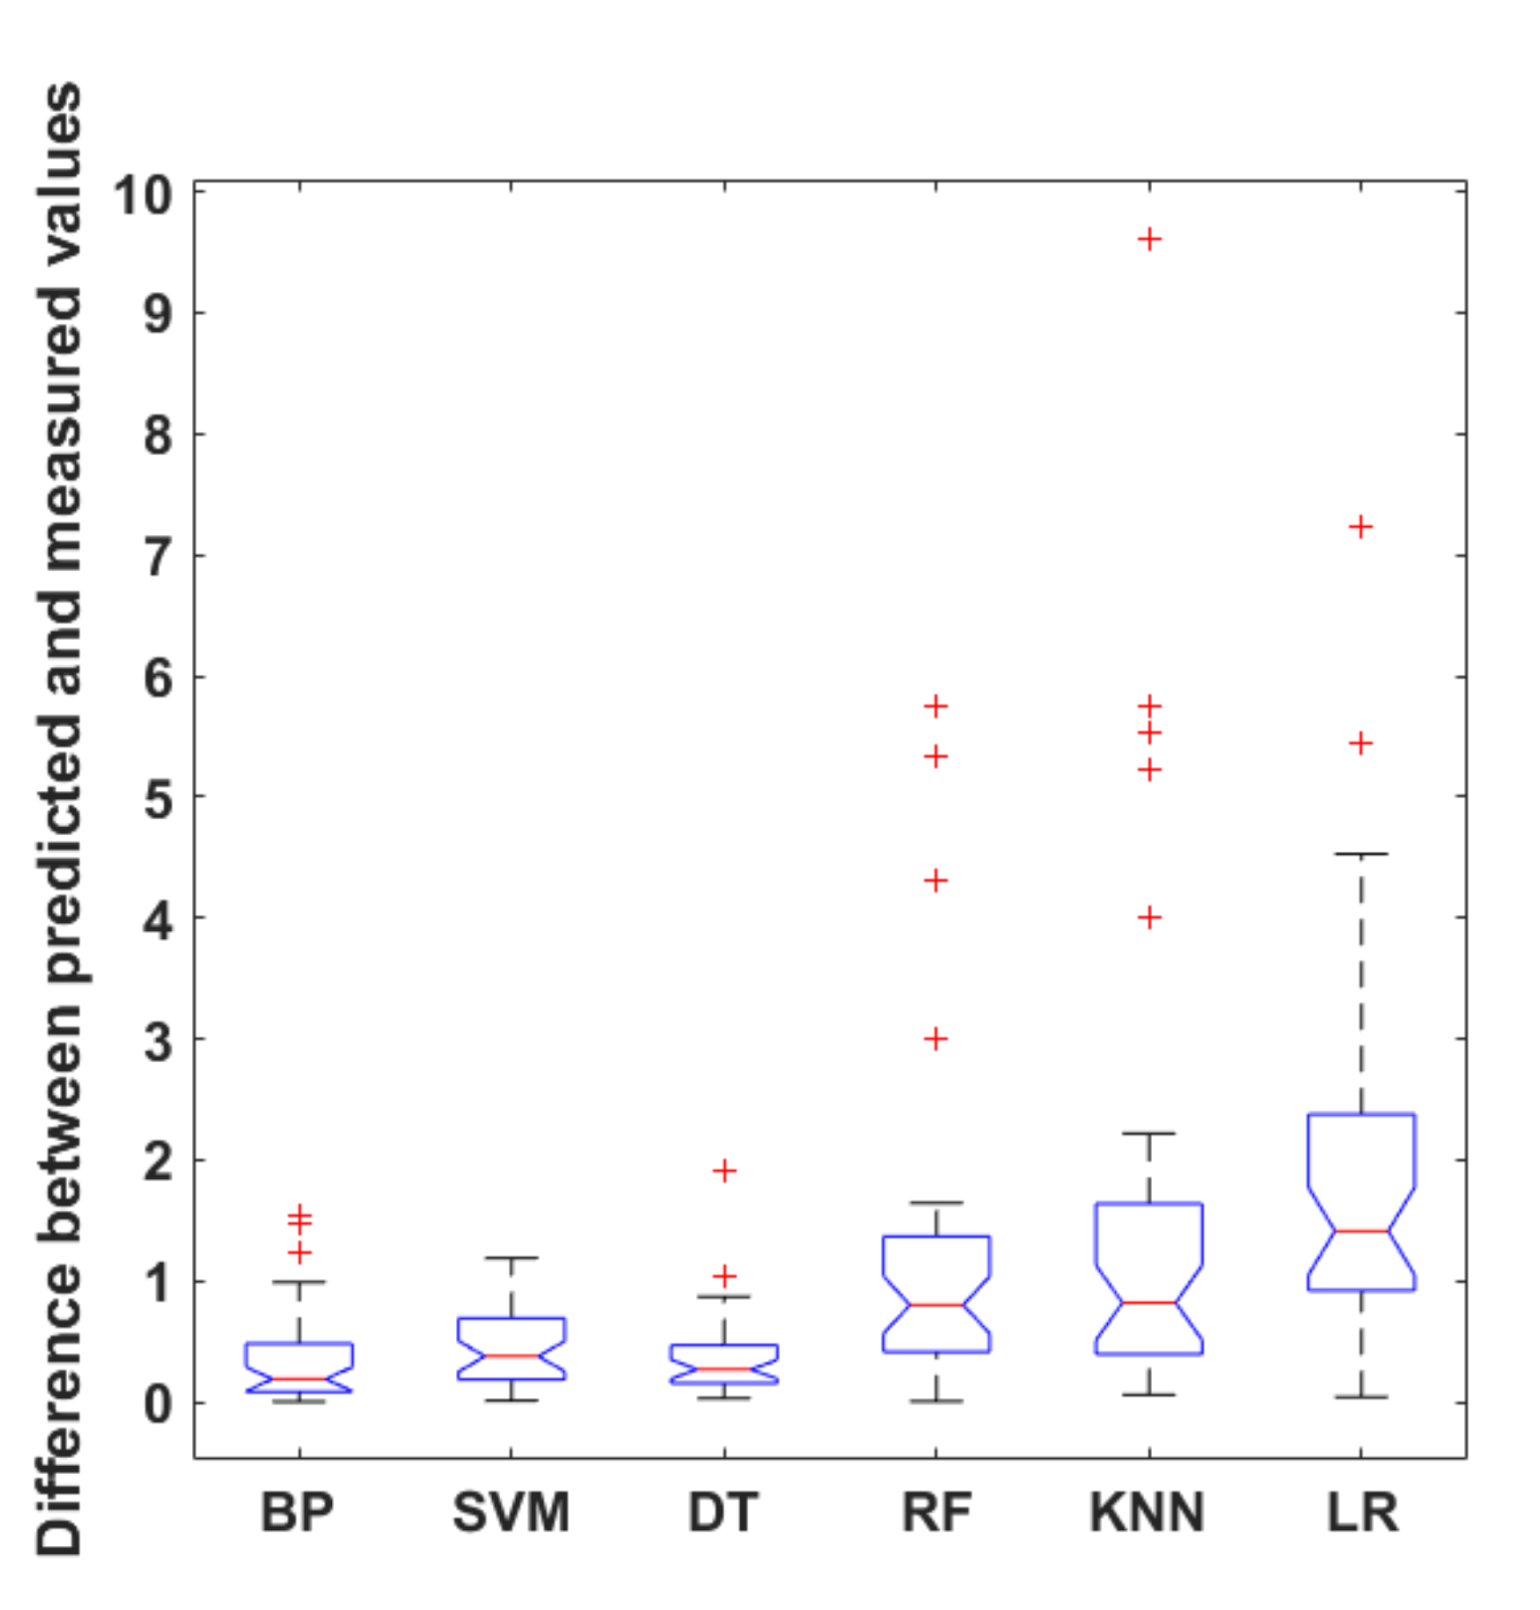
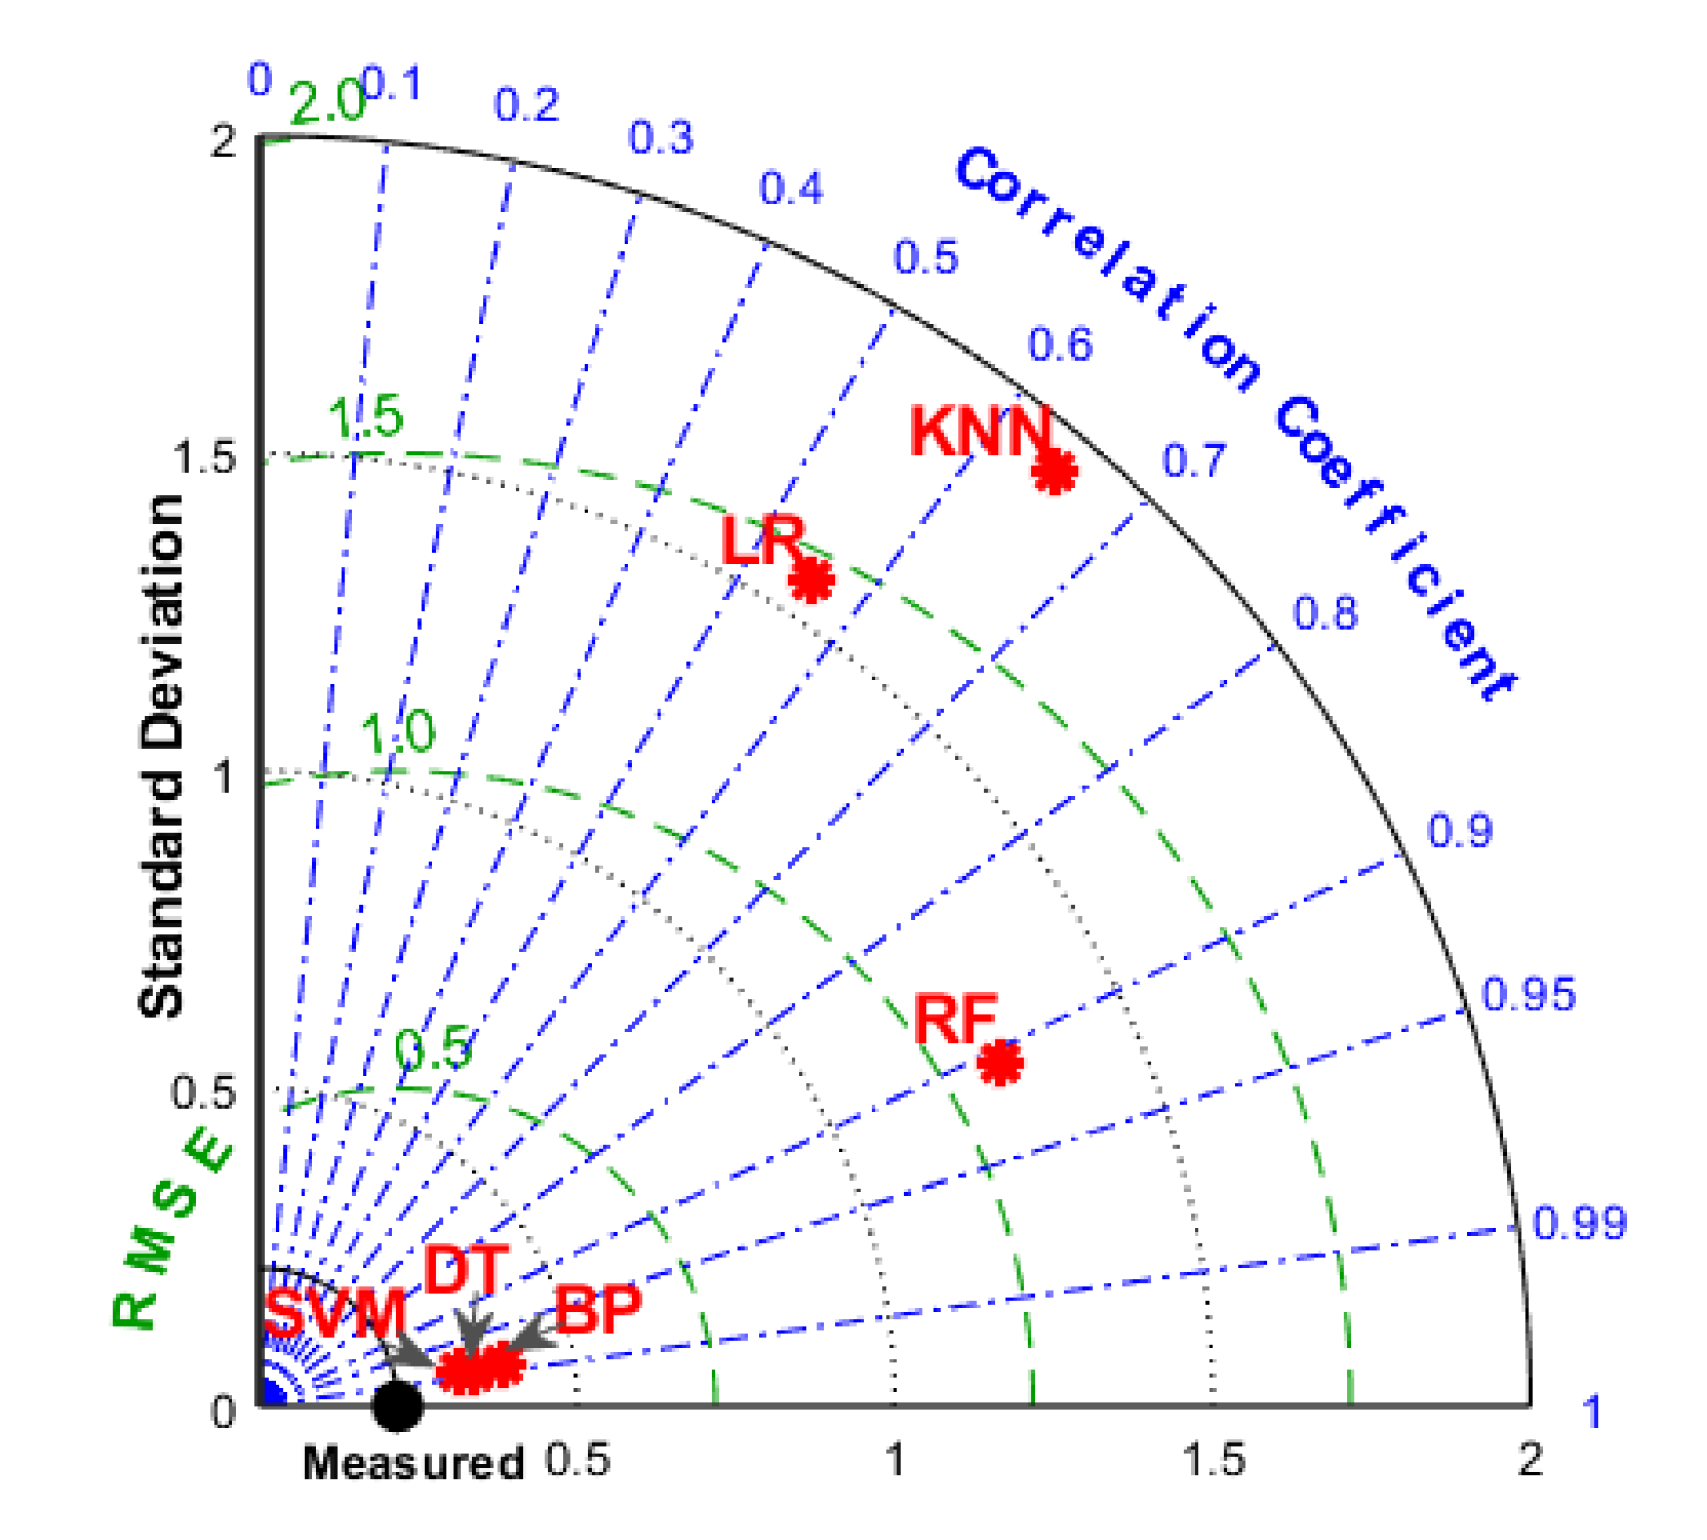
4.3. Comparison of Integrated ML Algorithms

As discussed above, six ML algorithms were employed to examine their predictive effects in the dataset. Figure 7 shows the predictive performance of the six ML algorithms in terms of the most commonly used statistical measures: MSE and R2. It can be observed that BPNN, DT, and SVM have better performance than other modules. Besides, DT outperformed BPNN and SVM with a marginally smaller MSE and slightly higher R2. The worst-performing algorithm was LR with the highest MSE of 6.1202 and the lowest R2 of 0.3089. This indicates that this baseline algorithm is not suitable for modeling the UCS data.
The differences between the predicted and actual values in the testing dataset can be compared using the boxplot (see Figure 8). A boxplot is convenient to visually display the distribution of the data through their quartiles [53]. It can be seen that DT was grouped the most tightly (with a comparatively short boxplot), and was slightly better than BPNN and SVM, although no outliers were observed in SVM. This indicates the overall UCS values of the composites were predicted accurately by these three algorithms. As for RF, KNN, and LR, these boxplots are comparatively tall with larger interquartile ranges and more outliers, indicating that the predicted UCS values were more scattered. LR was the worst-performing algorithm in terms of the highest median and largest interquartile range.
The realistic characteristics of these ML algorithms can be graphically indicated by a Taylor diagram [54]. The Taylor diagram shown in Figure 9 provides a summary of the skill with which the six ML algorithms simulate the relationship between the predicted and observed UCS. The distance between each ML algorithm and the point labeled “measured” is a measure of how realistically each algorithm reproduces the measured values. It is clear that DT, SVM, and BPNN lie nearest the point marked “measured” with comparatively higher R2 and lower RMSE, demonstrating that the three algorithms agree well with the actual values. LR has a low pattern correlation, while KNN has larger variations than the actual values. It should be noted that although RF has about the same correlation coefficient as SVM, DT and BP, the standard deviation of RF is much larger, resulting in a larger RMSE.
To compare these ML algorithms more comprehensively, some other statistics including mean absolute error (MAE), mean absolute percentage error (MAPE), minimum iteration, and time cost were also introduced in this study. To visualize data with so many variables, a radar chart is a good choice. The radar chart is composed of a series of equi-angular spokes arranged radially from the center, with each spoke standing for one statistical measure. The spoke length is proportional to the normalized magnitude of the measure between 0 (worst) to 1.0 (best) [55], and hence, a better model encloses a worse model. It is easily seen from Figure 10 that DT, SVM, and BPNN performed the best overall, and enclosed RF, KNN, and LR, although SVM performed slightly worse in terms of iteration times, indicating that SVM cost more time and effort during modeling. Among the models with poorer performance, LR was nearly enclosed by KNN due to lower scores for several variables including MSE, MAE, R, R2, and difference median. RF performed better in all the statistics except minimum integration, but many scores were not high enough to represent a good prediction model such as MSE, MAE, MAPE, and difference median.

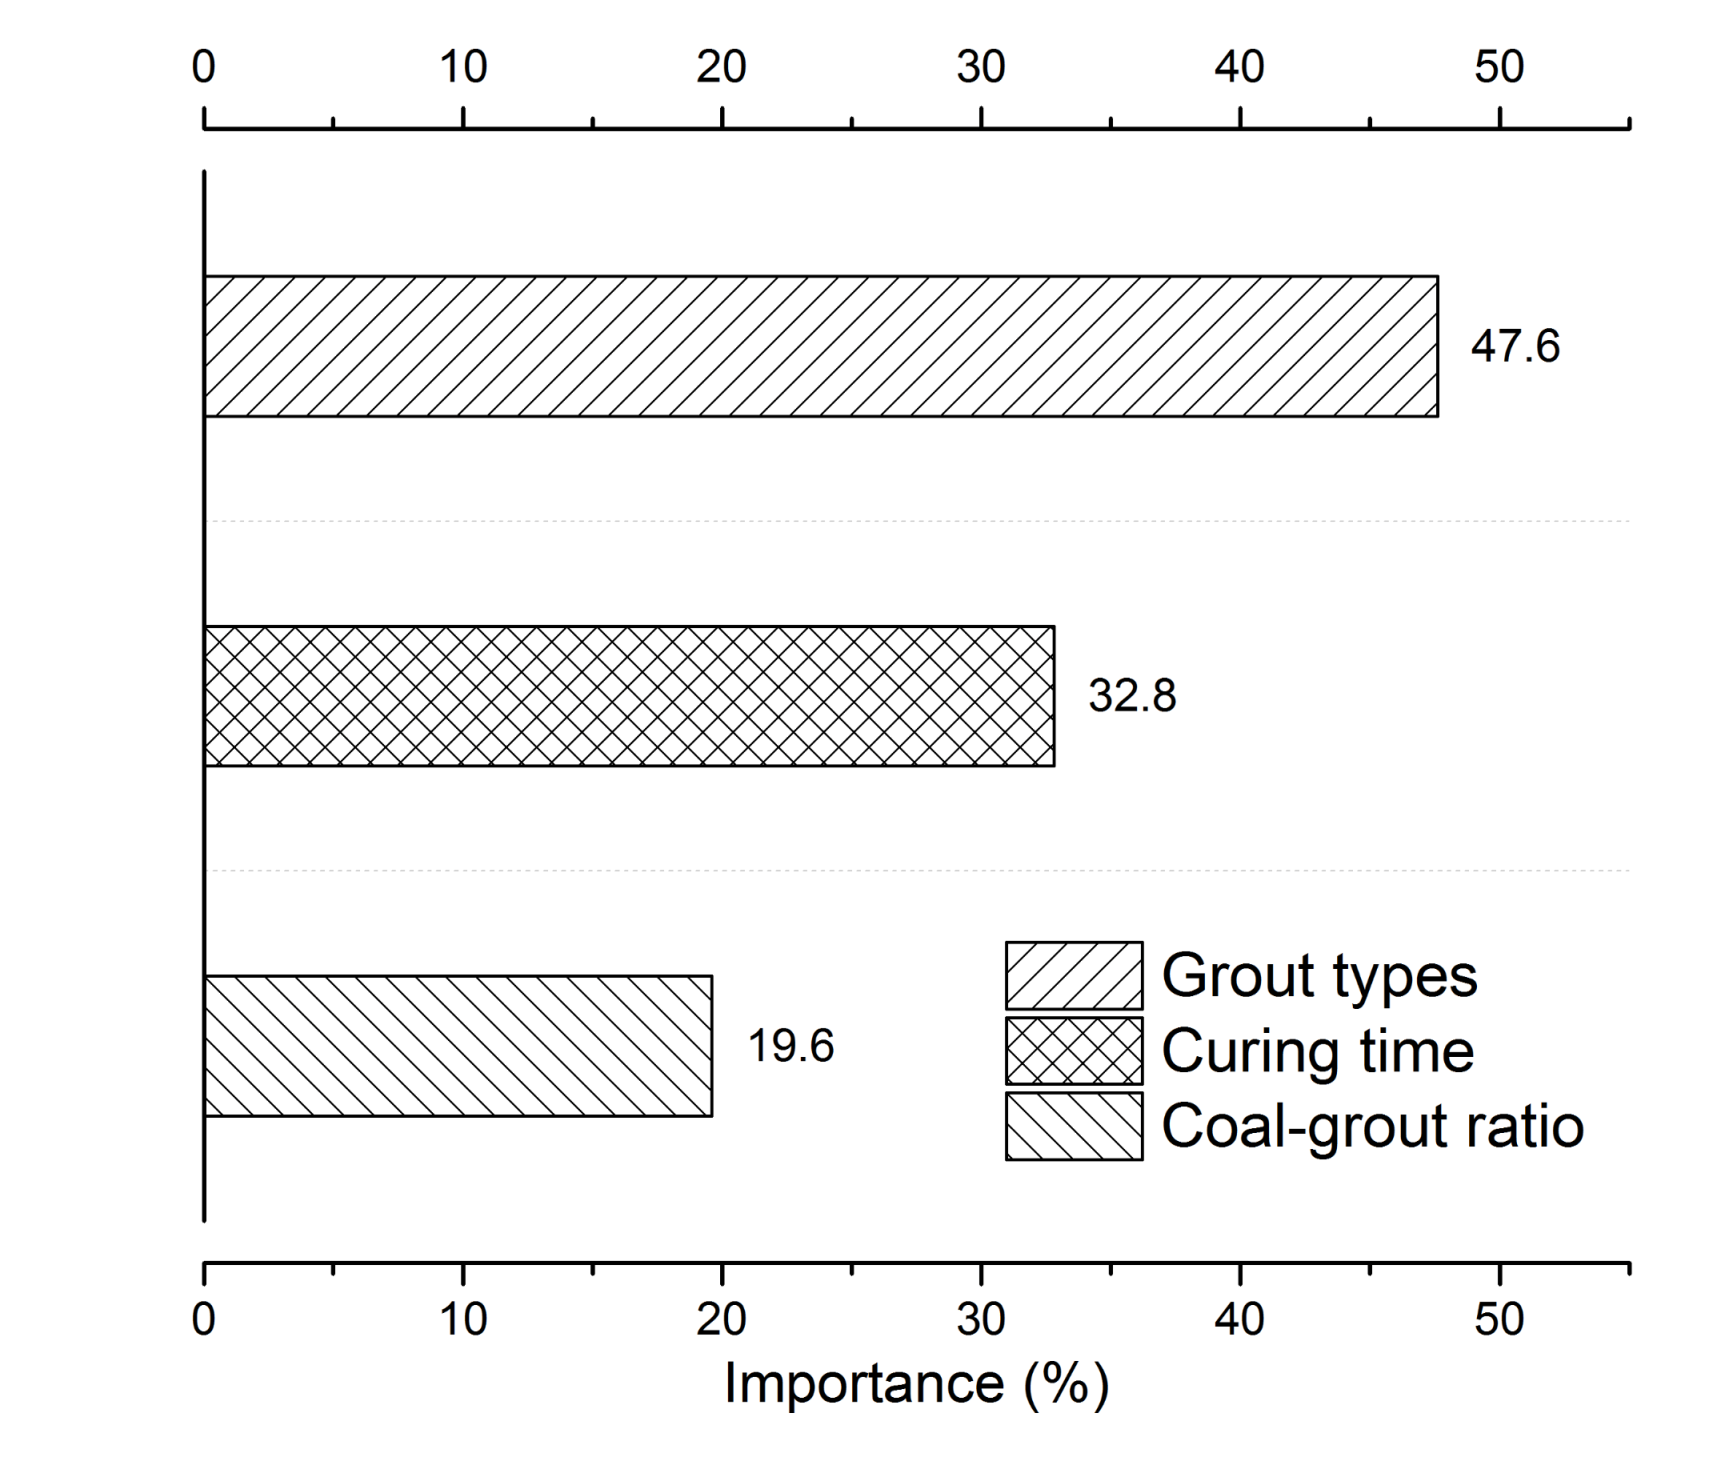
4.4. Analysis of the Variable Importance

Using global sensitivity study by the evolutionary SVM model, the variable importance is calculated, as shown in Figure 11. It can be observed that grout types have the most significant influence on the strength of coal-grout composite with an influencing percentage of 47.6%, followed by curing time (32.8%), while and coal-grout ratio is the least sensitive variable with an influence percentage of 19.6%. It should be noted that the importance score is obtained by the dataset used in this paper. More accurate results can be obtained if more data samples are included in the dataset in the future.

5. Conclusions

This study applied six integrated ML algorithms to predict the strength of coal-grout composites systematically. BAS was applied to tune hyper-parameters in these algorithms. A total of 405 specimens combined with variables (i.e., curing time, grout types, and the coal-grout ratio) were tested to construct the dataset to train and test the six models. The optimum algorithms were selected by assessing different statistical metrics. Some interesting conclusions were obtained. First, coal-chemical grout composites had higher strength in the short-term due to the rapid chemical reaction; however, the long-term strength decreased because chemical binders shank considerably. In comparison, the coal-cementitious grout composites could achieve stable and high strength in the long term. Secondly, BAS could find the optimum hyper-parameters of the algorithms effectively. Lastly, the optimum DT, BPNN, and SVM models achieved better predictive performance in the testing dataset.
In the future, a large dataset with multi-variables can be used to further improve the generalization of the presented model. In engineering projects, the strength of the real field coal-grout column could be predicted by these models, which will reduce costs and improve efficiency. This frontier work can boost the jet grouting formulation design for coal mass improvement in practical applications.

Author Contributions

Conceptualization by Y.S. and G.L.; writing—original draft preparation, Y.S.; writing—review and editing, G.L., J.Z.; supervision, G.L.; funding acquisition, G.L. All authors have read and agreed to the published version of the manuscript.

Funding

The study is supported by the program “the Fundamental Research Funds for the Central Universities (2020ZDPYZD02).”

Acknowledgments

Thanks for the reviewers’ comments and editor’s work. Special thanks to Zuqi Wang for her encouragement and help.

Conflicts of Interest

The authors declare no conflict of interests.

Abbreviations

JGJet grouting
UCSUnconfined compressive strength
MLMachine learning
BPNNBack-propagation neural network
SVMSupport vector machine
DTDecision tree
RFRandom forest
KNNK-nearest neighbors
LRLogistic regression
BASBeetle antennae search algorithm
CVCross-validation
MSEMean squared error
RCorrelation coefficient
P.O 32.5Portland cement P.O 32.5
P.O 42.5Portland cement P.O 42.5
SF-CSuperfine cement
RMSERoot-mean-square error
MAEMean absolute error
MAPEMean absolute percentage error

References

  1. Croce, P.; Flora, A.; Modoni, G. Jet Grouting: Technology, Design and Control; CRC Press: Boca Raton, FL, USA, 2014; ISBN 041552640X. [Google Scholar]
  2. Wu, K.; Shao, Z. Study on the effect of flexible layer on support structures of tunnel excavated in viscoelastic rocks. J. Eng. Mech. 2019, 145, 4019077. [Google Scholar] [CrossRef]
  3. Kutzner, C. Grouting of Rock and Soil; CRC Press: Boca Raton, FL, USA, 1996; ISBN 9054106344. [Google Scholar]
  4. Yahiro, T.; Yoshida, H. Induction grouting method utilizing high speed water jet. In Proceedings of the Eighth International Conference on Soil Mechanics and Foundation Engineering, Moscow, Russia, 6–11 August 1973; Volume 4, pp. 359–362. [Google Scholar]
  5. Sun, Y.; Li, G.; Zhang, J.; Qian, D. Prediction of the Strength of Rubberized Concrete by an Evolved Random Forest Model. Adv. Civ. Eng. 2019, 2019, 5198583. [Google Scholar] [CrossRef] [Green Version]
  6. Sun, Y.; Li, G.; Basarir, H.; Karrech, A.; Azadi, M.R. Laboratory evaluation of shear strength properties for cement-based grouted coal mass. Arab. J. Geosci. 2019, 12, 690. [Google Scholar] [CrossRef]
  7. Sun, Y.; Li, G.; Zhang, J.; Qian, D. Stability Control for the Rheological Roadway by a Novel High-Efficiency Jet Grouting Technique in Deep Underground Coal Mines. Sustainability 2019, 11, 6494. [Google Scholar] [CrossRef] [Green Version]
  8. Sun, Y.; Li, G.; Zhang, J. Investigation on jet grouting support strategy for controlling time-dependent deformation in the roadway. Energy Sci. Eng. 2020, 8, 1–8. [Google Scholar] [CrossRef] [Green Version]
  9. Sun, Y.; Li, G.; Zhang, J.; Qian, D. Experimental and numerical investigation on a novel support system for controlling roadway deformation in underground coal mines. Energy Sci. Eng. 2020, 8, 490–500. [Google Scholar] [CrossRef] [Green Version]
  10. Basarir, H.; Sun, Y.; Li, G. Gateway stability analysis by global-local modeling approach. Int. J. Rock Mech. Min. Sci. 2019, 113, 31–40. [Google Scholar] [CrossRef]
  11. Yoshitake, I.; Nakagawa, K.; Mitsui, T.; Yoshikawa, T.; Ikeda, A. An evaluation method of ground improvement by jet grouting. Tunn. Undergr. Sp. Technol. 2004, 19, 496–497. [Google Scholar]
  12. Nikbakhtan, B.; Ahangari, K. Field study of the influence of various jet grouting parameters on soilcrete unconfined compressive strength and its diameter. Int. J. Rock Mech. Min. Sci. 2010, 47, 685–689. [Google Scholar] [CrossRef]
  13. Tinoco, J.; Correia, A.G.; Cortez, P. A novel approach to predicting Young’s modulus of jet grouting laboratory formulations over time using data mining techniques. Eng. Geol. 2014, 169, 50–60. [Google Scholar] [CrossRef]
  14. Lee, F.H.; Lee, Y.; Chew, S.-H.; Yong, K.Y. Strength and modulus of marine clay-cement mixes. J. Geotech. Geoenvironmental Eng. 2005, 131, 178–186. [Google Scholar] [CrossRef]
  15. Fang, Y.S.; Liao, J.J.; Sze, S.C. An empirical strength criterion for jet grouted soilcrete. Eng. Geol. 1994, 37, 285–293. [Google Scholar] [CrossRef]
  16. Narendra, B.S.; Sivapullaiah, P.V.; Suresh, S.; Omkar, S.N. Prediction of unconfined compressive strength of soft grounds using computational intelligence techniques: A comparative study. Comput. Geotech. 2006, 33, 196–208. [Google Scholar] [CrossRef]
  17. Sebastiá, M.; Olmo, I.F.; Irabien, A. Neural network prediction of unconfined compressive strength of coal fly ash-cement mixtures. Cem. Concr. Res. 2003, 33, 1137–1146. [Google Scholar] [CrossRef]
  18. Asheghi, R.; Shahri, A.A.; Zak, M.K. Prediction of uniaxial compressive strength of different quarried rocks using metaheuristic algorithm. Arab. J. Sci. Eng. 2019, 44, 8645–8659. [Google Scholar] [CrossRef]
  19. Shahri, A.A.; Larsson, S.; Johansson, F. Updated relations for the uniaxial compressive strength of marlstones based on P-wave velocity and point load index test. Innov. Infrastruct. Solut. 2016, 1, 17. [Google Scholar] [CrossRef] [Green Version]
  20. Qi, C.; Fourie, A. Cemented paste backfill for mineral tailings management: Review and future perspectives. Miner. Eng. 2019, 144, 106025. [Google Scholar] [CrossRef]
  21. Sun, Y.; Zhang, J.; Li, G.; Ma, G.; Huang, Y.; Sun, J.; Wang, Y.; Nener, B. Determination of Young’s modulus of jet grouted coalcretes using an intelligent model. Eng. Geol. 2019, 252, 43–53. [Google Scholar] [CrossRef]
  22. Sun, Y.; Zhang, J.; Li, G.; Wang, Y.; Sun, J.; Jiang, C. Optimized neural network using beetle antennae search for predicting the unconfined compressive strength of jet grouting coalcretes. Int. J. Numer. Anal. Methods Geomech. 2019, 43, 801–813. [Google Scholar] [CrossRef]
  23. Zhang, J.; Ma, G.; Huang, Y.; Aslani, F.; Nener, B. Modelling uniaxial compressive strength of lightweight self-compacting concrete using random forest regression. Constr. Build. Mater. 2019, 210, 713–719. [Google Scholar] [CrossRef]
  24. Sun, J.; Zhang, J.; Gu, Y.; Huang, Y.; Sun, Y.; Ma, G. Prediction of permeability and unconfined compressive strength of pervious concrete using evolved support vector regression. Constr. Build. Mater. 2019, 207, 440–449. [Google Scholar] [CrossRef]
  25. Nguyen, P.T.; Tuyen, T.T.; Shirzadi, A.; Pham, B.T.; Shahabi, H.; Omidvar, E.; Amini, A.; Entezami, H.; Prakash, I.; Phong, T. Van Development of a novel hybrid intelligence approach for landslide spatial prediction. Appl. Sci. 2019, 9, 2824. [Google Scholar] [CrossRef] [Green Version]
  26. Kaloop, M.R.; Kumar, D.; Samui, P.; Gabr, A.R.; Hu, J.W.; Jin, X.; Roy, B. Particle Swarm Optimization Algorithm-Extreme Learning Machine (PSO-ELM) model for predicting resilient modulus of stabilized aggregate bases. Appl. Sci. 2019, 9, 3221. [Google Scholar] [CrossRef] [Green Version]
  27. Le, L.T.; Nguyen, H.; Dou, J.; Zhou, J. A comparative study of PSO-ANN, GA-ANN, ICA-ANN, and ABC-ANN in estimating the heating load of buildings’ energy efficiency for smart city planning. Appl. Sci. 2019, 9, 2630. [Google Scholar] [CrossRef] [Green Version]
  28. Heermann, P.D.; Khazenie, N. Classification of multispectral remote sensing data using a back-propagation neural network. IEEE Trans. Geosci. Remote Sens. 1992, 30, 81–88. [Google Scholar] [CrossRef]
  29. Hearst, M.A.; Dumais, S.T.; Osuna, E.; Platt, J.; Scholkopf, B. Support vector machines. IEEE Intell. Syst. Their Appl. 1998, 13, 18–28. [Google Scholar] [CrossRef] [Green Version]
  30. Freund, Y.; Mason, L. The alternating decision tree learning algorithm. In Proceedings of the ICML, Bled, Slovenia, 27–30 June 1999; Volume 99, pp. 124–133. [Google Scholar]
  31. Liaw, A.; Wiener, M. Classification and regression by randomForest. R News 2002, 2, 18–22. [Google Scholar]
  32. Ni, K.S.; Nguyen, T.Q. An adaptable k -nearest neighbors algorithm for MMSE image interpolation. IEEE Trans. Image Process. 2009, 18, 1976–1987. [Google Scholar] [CrossRef]
  33. Krishnapuram, B.; Carin, L.; Figueiredo, M.A.T.; Hartemink, A.J. Sparse multinomial logistic regression: Fast algorithms and generalization bounds. IEEE Trans. Pattern Anal. Mach. Intell. 2005, 27, 957–968. [Google Scholar] [CrossRef] [Green Version]
  34. Jiang, X.; Li, S. BAS: Beetle Antennae Search Algorithm for Optimization Problems. arXiv 2017, arXiv:1710.10724. [Google Scholar]
  35. Braga-Neto, U.; Hashimoto, R.; Dougherty, E.R.; Nguyen, D.V.; Carroll, R.J. Is cross-validation better than resubstitution for ranking genes? Bioinformatics 2004, 20, 253–258. [Google Scholar] [CrossRef] [PubMed]
  36. Efron, B.; Tibshirani, R.J. An Introduction to the Bootstrap; CRC press: Boca Raton, FL, USA, 1994; ISBN 0412042312. [Google Scholar]
  37. Pham, D.L. Fuzzy clustering with spatial constraints. In Proceedings of the 2002 IEEE International Conference on Image Processing, Rochester, NY, USA, 22–25 September 2002; Volume 2, p. II. [Google Scholar]
  38. Braga-Neto, U.; Dougherty, E. Bolstered error estimation. Pattern Recognit. 2004, 37, 1267–1281. [Google Scholar] [CrossRef]
  39. Stone, M. Cross-validatory choice and assessment of statistical predictions. J. R. Stat. Soc. Ser. B 1974, 111–147. [Google Scholar] [CrossRef]
  40. Montgomery, D.C.; Runger, G.C.; Hubele, N.F. Engineering Statistics; John Wiley & Sons: Hoboken, NJ, USA, 2009; ISBN 0470526947. [Google Scholar]
  41. Shlesinger, M.F. Search research. Nature 2006, 443, 281–282. [Google Scholar] [CrossRef]
  42. Pavlyukevich, I. Lévy flights, non-local search and simulated annealing. J. Comput. Phys. 2007, 226, 1830–1844. [Google Scholar] [CrossRef] [Green Version]
  43. Viswanathan, G.M.; Afanasyev, V.; Buldyrev, S.V.; Murphy, E.J.; Prince, P.A.; Stanley, H.E. Lévy flight search patterns of wandering albatrosses. Nature 1996, 381, 413–415. [Google Scholar] [CrossRef]
  44. Akın, M.; Akın, M.; Çiftçi, A.; Beril Bayram, B. The Effect of Jet-Grouting on the Cyclic Stress Ratio (Csr) for the Mitigation of Liquefaction. Available online: https://www.researchgate.net/profile/Mutluhan_Akin/publication/289534049_THE_EFFECT_OF_JET-GROUTING_ON_THE_CYCLIC_STRESS_RATIO_CSR_FOR_THE_MITIGATION_OF_LIQUEFACTION/links/568fa81408ae78cc05195e6a/THE-EFFECT-OF-JET-GROUTING-ON-THE-CYCLIC-STRESS-RATIO-CSR-FOR-THE-MITIGATION-OF-LIQUEFACTION.pdf (accessed on 11 February 2020).
  45. Mathey, M.; Merwe, J.N. van der development of coal-crete as a composite analogue material for coal in mechanical laboratory studies and for mine backfill purpose m. Mathey Van der Merwe 2015, 1, 1–13. [Google Scholar]
  46. AASTM C39. Standard Test Method for Compressive Strength of Cylindrical Concrete Specimens. ASTM Int. 2001. Available online: https://www.astm.org/Standards/C39 (accessed on 11 February 2020).
  47. Reeves, C.R. Training Set Selection in Neural Network Applications. In Proceedings of the Artificial Neural Nets and Genetic Algorithms; Springer: Berlin/Heidelberg, Germany, 1995; pp. 476–478. [Google Scholar]
  48. Nelson, M.M.; Illingworth, W.T. A Practical Guide to Neural Nets; Prentice Hall PTR: Upper Saddle River, NJ, USA, 1991. [Google Scholar]
  49. Tabor, D. Principles of adhesion—Bonding in cement and concrete. In Adhesion Problems in the Recycling of Concrete; Springer: Berlin/Heidelberg, Germany, 1981; pp. 63–87. [Google Scholar]
  50. Brooks, J.J.; Johari, M.A.M.; Mazloom, M. Effect of admixtures on the setting times of high-strength concrete. Cem. Concr. Compos. 2000, 22, 293–301. [Google Scholar] [CrossRef]
  51. Kaniraj, S.R.; Havanagi, V.G. Compressive strength of cement stabilized fly ash-soil mixtures. Cem. Concr. Res. 1999, 29, 673–677. [Google Scholar] [CrossRef]
  52. Neville, A.M.; Brooks, J.J. Concrete Technology; Longman Scientific & Technical: New York, UK, 1987; ISBN 0582988594. [Google Scholar]
  53. Frigge, M.; Hoaglin, D.C.; Iglewicz, B. Some implementations of the boxplot. Am. Stat. 1989, 43, 50–54. [Google Scholar]
  54. Taylor, K.E. Summarizing multiple aspects of model performance in a single diagram. J. Geophys. Res. Atmos. 2001, 106, 7183–7192. [Google Scholar] [CrossRef]
  55. Tague, N.R. The Quality Toolbox; ASQ Quality Press: Milwaukee, WI, USA, 2005; Volume 600. [Google Scholar]
Figure 1. The pseudo code of BAS.
Applsci 10 01612 g001
Figure 2. 10-fold cross-validation.
Applsci 10 01612 g002
Figure 3. Flowchart of the process of tuning Machine learning (ML) algorithms by BAS.
Applsci 10 01612 g003
Figure 4. Unconfined compressive strength (UCS) results of coal-grout composite specimens: (a) coal-chemical grout composite; (b) coal-cement grout composite.
Applsci 10 01612 g004
Figure 5. The microstructure of the coal-grout composite after the 28th day: (a) coal-chemical grout composite; (b) coal-cement grout composite.
Applsci 10 01612 g005
Figure 6. MSE versus iteration for five individual ML algorithms.
Applsci 10 01612 g006
Figure 7. Predicted and actual UCS in the test dataset: (a) BPNN, (b) SVM, (c) DT, (d) RF, (e) KNN, (f) LR.
Applsci 10 01612 g007
Figure 8. Box plot of the results comparison of proposed ML algorithms.
Applsci 10 01612 g008
Figure 9. Taylor diagram for presenting the predictive effect of six models.
Applsci 10 01612 g009
Figure 10. Radar plot of different ML algorithms to compare different statistical metrics.
Applsci 10 01612 g010
Figure 11. Variable importance of the coal-grout composite.
Applsci 10 01612 g011
Table 1. The hyper-parameters of algorithms and definitions.
AlgorithmsParameterDefinition
BPNNhidden_layer_numHidden layers numbers.
hidden_layer_sizeNeurons in hidden layers.
SVMCPenalty term coefficient.
gammaGamma in gaussian kernel.
DTmin_samples_splitMinimum sample numbers for an internal node.
min_samples_leafMinimum sample number for a leaf node.
RFtree_numThe number of trees.
min_samples_leafMinimum sample numbers for a leaf node.
KNNneighbors_numNeighbor sample numbers.
Table 2. Experimental design of coal-grout composites.
Grout TypesW-C/A:BCoal-Grout RatioCuring Time
Cementitious groutP.O 32.51:10.4:1, 0.6:1, 0.8:1, 1:1, 1.2:14 h 1,1 day, 7 days, 14 days, 28 days
P.O 42.5
SF-C
Chemical groutMP 364
MP 398
MP 325
1 The curing time was only measured for coal-chemical grout composites.
Table 3. Statistics of parameters.
VariableMinMaxMeanStandard Deviation
Coal-grout ratio0.41.20.80.28
Curing time (days)0.172810.0310.26
Grout types1.06.03.51.71
UCS (MPa)0.5114.084.792.77
Table 4. Optimum hyper-parameters in models.
AlgorithmsParameterRestrictionEmpirical ScopeInitial ValueResult
BPNNhidden_layer_num>0, integer[1,4]{1,2,3,4}1
hidden_layer_size>0, integer[1,20]30, (20,10), (20,10,10), (10,10,10,10)15
SVMCreal number[0.1,1000]16451
gammareal number[0.001,100]163.15
DTmin_samples_split>0, integer
>min_samples_
leaf*2
[1,10]251
min_samples_leaf>0, integer[2,10]502
RFtree_num>0, integer[1,10]407
min_samples_leaf>0, integer[1,10]401
KNNneighbors_num>0, integer[1,10]301

