Article

The Effect of Speed Humps on Instantaneous Traffic Emissions

by
Julio César Pérez-Sansalvador
1,2,*,
Noureddine Lakouari
1,2,
Jesus Garcia-Diaz
1,2 and
Saúl E. Pomares Hernández
1,3
1
Instituto Nacional de Astrofísica, Óptica y Electrónica, Santa María Tonantzintla, 72840 Puebla, Mexico
2
Consejo Nacional de Ciencia y Tecnología, 03940 CDMX, Mexico
3
CNRS, LAAS, 7 avenue du Colonel Roche, F-31400 Tolouse, France
*
Author to whom correspondence should be addressed.
Appl. Sci. 2020, 10(5), 1592; https://doi.org/10.3390/app10051592
Submission received: 23 January 2020 / Revised: 14 February 2020 / Accepted: 21 February 2020 / Published: 27 February 2020

Abstract

:
Bad air quality due to free pollutants such as particulate matter (PM), carbon dioxide (CO 2 ), nitrogen oxides (NO x ) and volatile organic components (VOC) increases the risk of long-term health diseases. The impact of traffic-calming measures on air quality has been studied using specialized equipment at control sites or mounted on cars to monitor pollutants levels. However, this approach suffers from a large number of variables on the experiments such as vehicles types, number of monitored vehicles, driver’s behavior, traffic density, time of the day, elapsed monitoring time, road conditions and weather. In this work, we use a cellular automata and an instantaneous traffic emissions model to capture the effect of speed humps on traffic flow and on the generation of CO 2 , NO x , VOC and PM pollutants. This approach allows us to study and characterize the effect of many speed humps on a single lane. We found that speed humps significantly promote the generation of pollutants when the number of vehicles on a lane is low. Our results may provide insight into urban planning strategies to reduce the generation of traffic emissions and lower the risk of long-term health diseases.

1. Introduction

Air quality has become a major topic due to the negative effects of free pollutants on human health. The repeated and chronic exposure to these pollutants may increase the risk of short- and long-term health diseases ranging from the irritation of eyes, headaches and the irritation of the respiratory system, to major health problems such as lung, cardiovascular and asthmatic diseases [1,2,3,4,5,6].
Traffic emissions are identified as one of the primary sources of air pollutants, those with major potential health impacts are carbon dioxide (CO 2 ), nitrogen oxides (NO x ), volatile organic compounds (VOC) and particulate matter (PM) [2,3,7,8]. Actually, traffic emissions account for up to 80% of the total PM emissions [8,9]. Additionally, the main sources of NO x in urban areas are traffic emissions, these NO x react with other chemicals to generate ozone (O 3 ), both detrimental to human health [2,10,11]. Recently, Astarita et al. [12] reported that the transportation sector is responsible for 25% of the total energy consumption in the EU, and Iodice and Senatore [13] identified the main sources of pollution in Campania, Italy. Their findings suggest that in order to limit the generation of pollutants we need to move to new technologies such as biofuel or electric vehicles [14,15,16].
The previously mentioned air pollutants, CO 2 , NO x ), VOC and PM are primarily generated by changing speed and due to the wear of tires by braking [8,9,17,18,19]. Changing the speed of a vehicle is a common action of every driver during a journey. Drivers accelerate and decelerate to avoid collisions with other vehicles and to stop at traffic lights, pedestrian crossings and traffic-calming measures.
Speed humps are an effective measure to regulate speed and improve pedestrian safety, they are easy to install and lower on cost when compared with speed cameras, traffic lights, roundabouts and chicanes [20]. They reduce the speed of vehicles by forcing the drivers to decelerate when encountering them, then once passing over them drivers may accelerate if there are no vehicles or obstacles ahead. Although their effect on traffic flow and pedestrian safety has been widely studied [21,22,23,24,25], there are few studies on their effect on air quality and pollutants generation. Some works monitor pollutants using specialized equipment mounted on cars or installed at control sites [1,2,9,18,19,20,23]. Some others recommend to increase the number of traffic-calming measures and reduce the distance between them to improve safety on pedestrians [22,25]. However, these recommendations may have negative side effects as we will show. In this work we investigate the impact of speed humps on traffic emissions, we present our findings on the effect of an increasing number of speed humps on traffic flow and its impact on pollutants generation, specifically, CO 2 , NO x , VOC and PM emissions.
The rest of the document is organized as follows: in Section 2 we present previous studies on traffic-calming measures and pollutants emissions, then in Section 3 the models for traffic flow and instantaneous traffic emission used in this work is introduced. In Section 4 we show the results of our simulations and discuss them. Finally, in Section 5 we present the main conclusions and future work.

2. Related Work

In this section, we present works studying the effect of traffic calming measures on pollutants emissions, these works use specialized monitoring equipment mounted on vehicles or installed at control sites. Additionally, we briefly introduce works based on cellular automata models for the study of the effect of speed humps on traffic flow. Finally, state-of-the-art models for traffic emissions are presented.

2.1. Traffic-Calming and Emissions

Generally, drivers accelerate after a change from red to green in a traffic light, after passing a bump or when there is free space ahead on the road. Conversely, drivers decelerate to avoid collisions with other vehicles, to stop at traffic lights, to reduce their speed at speed limit areas, and to negotiate speed bumps and pedestrian crossings. Unfortunately, these changes in speeds due to acceleration and deceleration, are the main sources of vehicles emissions [8,9,17,18,19,26]. Also, in congested traffic, higher emissions are produced at low speeds [1,2,27,28].
Many studies have investigated the generation of pollutants from traffic. Some of them monitor pollutants levels at different control sites on roads [9,18,19,29] and others use specialized equipment mounted on cars to collect information about the traffic flow or the pollutants levels [1,2,20,23]. The data collected from the monitoring of traffic flow, origin and destination of journeys, elapsed monitoring time, length of the roads, traffic composition and weather are feed into traffic simulators to generate acceleration profiles of vehicles that are used by emission estimation software to compute traffic emissions [30,31,32].
A similar approach is used to study the impact of traffic-calming strategies on traffic emissions. The monitoring equipment is mounted near the physical location of the speed humps, or the equipped vehicles follow trajectories where there is a speed hump. Daham et al. [20] monitored an increase of about 90% for CO 2 , 117% for CO, 195% for NO x , and 148% for Total HydroCarbon THC. They used an equipped vehicle on a driving cycle of 2.2 km with 14 speed cushions; each at about 140 m distance. Lee et al. [23] evaluated the effectiveness and emissions of traffic-calming measures in a residential area in Korea. The residential area and the journeys were simulated into PTV VISSIM [30] and the results were feed into The Motor Vehicle Emissions Simulator MOVES [31] to compute the emissions for CO 2 and PM. Only one and two speed humps were considered at the simulations.
Ghafghazi and Hatzopoulou [19] performed simulations of the impact of traffic-calming measurements in NO 2 and NO x emissions in an urban area in Montréal, Canada. The chosen road is about 500 m in length and 17 m in width, the simulation of vehicles journeys was performed with PTV VISSIM, the emission software MOVES, and the Danish Operational Street Pollution Model (OSPM) [33]. They found an increment from 5% to 160% for NO x emissions, and from 0.1% to 10% for NO 2 emissions when compared with a high traffic volume base case. Baltrėnas et al. [9] studied the effect of speed bumps on air pollution by PM, they used specialized equipment near the traffic-calming devices at ten residential sites in Lithuania, they found a large concentration of PM at speed bumps sites, significantly higher than limit values in ambient air. In the same work, the authors recommend avoiding the installation of speed bumps or raised pedestrian crossings near sensitive buildings such as schools due to the increased generation of PM.
Januševičius and Grubliauskas [18] studied the impact of speed bumps and humps on emissions of CO 2 and NO x . They measured emissions with mobile laboratory equipment at five locations with speed humps installed in pedestrian crossings to reduce vehicle’s speed. Speed humps with trapezoidal shape are frequently found at pedestrian crossings, meanwhile speed bumps have semi-circular shape and are more abrupt than speed humps [24,34]. Januševičius and Grubliauskas [18] found rising concentrations of CO 2 and NO x near the speed humps and bumps with increments from 1 to 8 times for NO x , and from 1 to 5 times for CO.
We observe that previous works agree on that traffic-calming measures increase the generation of free pollutants; however, their reported values disagree, this may come from the differences on road conditions, vehicles types, weather conditions, time of the day for collection of data and number of monitored vehicles.

2.2. Cellular Automata and Traffic Flow

Studies based on data collected from specific regions are limited to cases with large variations on vehicles types, driver behaviors, road conditions, vehicles sizes, time of the day, weather conditions and topography, just to mention a few. The use of simulators allows control of these variables and test their effect on specific configurations.
A major approach on the study of traffic flow is that based on cellular automata. These models are widely used due to its flexibility to incorporate new rules, high generalizations and rich phenomena capturing features [28,35,36,37,38,39]. The cellular automata introduced by Nagel and Schreckenberg in [40], also known as the NaSch model, has been widely used to study different mechanism in traffic flow [37,41,42,43,44,45,46].
Meng and Zhang [47] presented a modified version of the NaSch model to study the effect of speed humps on traffic flow, their findings show that a single speed hump has a negative effect on traffic flow. Li et al. [48] introduced different driver behaviors when encountering speed humps: aggressive drivers, which do not reduce their speed at the minimum to pass over the speed hump; and cautious drivers, which reduce their speed at its minimum to pass over the speed hump. They found that as the number of cautious drivers increases, the average speed decreases from 50 to 85% from the case with no speed humps on the road. Conversely, as the number of aggressive drivers increases, the impact of speed humps on traffic flow and average velocity decreases.

2.3. Emission Models

Popular software implementing emission models are MOVES [31] and CMEM (the Comprehensive Modal Emissions Model) [32], they require information such as car types, age, engine type, emissions rates, weather and driver behavior [49]. The MOBILE 6.2 emission model is widely used to estimate emissions; however, it is not able to capture individual driver behaviors and local conditions since their estimations are based on average speed [1]. Models based on instantaneous speed allow estimation of precise emission rates for different driver behaviors, congestion patterns and local conditions [1,50]. The emission model of Panis et al. [51] computes vehicles emissions from instant speed and acceleration of vehicles. The pollutants considered in their model are CO 2 , NO x , VOC and PM. Regarding PM emissions, the model of Panis only considers exhaust traffic related particles [52], those provided by the engine through the tailpipe [53].
The model of Panis allows one to estimate traffic emissions as part of the simulation process (online estimation of traffic emissions), it means that other effects (e.g., traffic lights, pedestrian crossings, etc.) that may modify the traffic flow during the simulation are immediately captured by the emission model. That is the case when installing speed humps on roads.
The model of Panis is actively used by the scientific community, recent studies include it as an online traffic emissions estimator [6,12,28,54,55]. Due to its simplicity, the model of Panis is easily integrated with traffic modeling approaches based on cellular automata, car-following or fluid dynamics to study the effects of a variety of situations on traffic emissions. In [54] Woodward et al. apply the Panis’ model to study the dispersion of pollutants on an intersection modeled as a fluid dynamics problem. Astarita et al. [12] applied Panis’ model and found that automatically generated car data used for managing traffic signals at intersections reduces traffic emissions and fuel consumption. Nyhan et al. [6] estimate traffic emissions from the analysis of a database with about 15,000 GPS tracked taxis journeys across the road network of Singapore; they compute spatial distribution diagrams of the pollutants considered in the model of Panis. Wang et al. [55] investigated the effect of mixed traffic (Passenger and Heavy-Duty cars) on the generation of pollutants using the model of Panis and a cellular automata approach based on the NaSch model. They found that traffic emissions increase as the number of Heavy-Duty and larger cars overpass the number of Passenger and shorter cars. Pan et al. [28] followed a cellular automata approach based on the NaSch model to estimate PM emissions from Heavy-Duty cars and fuel rate consumption. Based on the traffic emission model of Panis, they found three phases on PM generation as a function of vehicles density: a free-flow phase with the lower emissions, a first stage of congestion where the emissions reached their peak, and a jammed flow phase with a gradually decreasing generation of PM emissions.

3. Traffic Flow and Instantaneous Emission Models

We use the modified version of the NaSch model presented in [47] to study the effect of speed humps on instantaneous traffic emissions. To characterize this effect we neglect any other factors such as traffic lights, pedestrians crossings and intersections. The traffic flow model defines the rules that describe the dynamics of the system. At any single time, the state of the system can be represented by the occupancy of the lane and the current velocity of the vehicles. The vehicles move at discrete time steps following the rules of the cellular automata defined in Section 3.1. Each vehicle has a velocity and a position on the lane. The velocity is the number of cells that the vehicle can move forward per simulation step. In order to estimate the total pollutant emissions of the vehicles on the lane we feed the velocity and the acceleration of each vehicle into the instantaneous traffic emissions model [51].
In this study, we consider speed humps that span the width of the road and gradually raise the road surface up to a height range from 7 to 10 cm (about 3 to 4 inches) [23,24,47]. We only consider speed humps because they effectively reduce vehicles speed, conversely, speed bumps, composed of an abrupt raised area, are not recommended for use on public roads [18,25]. The length and height of the speed humps are depicted in Figure 1. In our cellular automata model each speed hump occupies one cell.

3.1. The Modified NaSch Model

We use the model presented in [47] that extends the NaSch model by modifying the second rule (deceleration) to capture the effect of speed humps on traffic flow. This model considers the distance to the front vehicle and the distance to the closest speed hump at front to compute the new velocity of each vehicle. Additionally, if the vehicle is currently passing over the speed hump then it reduces its velocity to its minimum or stops if there is a vehicle immediately at front.
The rules of the modified NaSch model used in this study are as follow:
  • Acceleration If v t < V max then increase the speed of the vehicle
    v t + 1 min ( v t + 1 , V max )
  • Deceleration If the speed hump is close enough then reduce the speed; if the vehicle is on the speed hump then reduce its velocity to its minimum. Otherwise the new velocity is given by the original deceleration rule of the NaSch model. For all cases also consider the distance to the front vehicle.
    v t + 1 = min ( D d , d n ) if D d < v t + 1 min ( 1 , d n ) if D d = 0 min ( v t + 1 , d n ) otherwise
  • Randomization Decrease the velocity of the vehicle with brake probability P
    v t + 1 max ( v t + 1 1 , 0 )
  • Vehicle movement Update the position of the vehicle
    x t + 1 x t + v t + 1
where v t represents the velocity of the current vehicle at time t; V max is the maximum allowed velocity on the lane (the maximum number of cells that a vehicle can move forward per simulation step); D d represents the number of empty cells between the current vehicle and the closest speed hump ahead, d n is the spatial-headway, the number of empty spaces between the front vehicle and the current one [56]; and x t is the position on the lane of the current vehicle at time t.

3.2. Instantaneous Traffic Emission Model

We use the model of Panis et al. [51] which describes instantaneous traffic emission as a function of pollutants type and vehicle properties such as type, velocity and acceleration. Panis obtained their model by applying multiple nonlinear regression on a large data set of multiple measurements generated by 25 instrumented vehicles in real urban traffic conditions complying with the EURO-1, EURO-2 and EURO-3 emissions standards. The vehicles types included 17 cars, six buses and two trucks. From the 17 cars, 12 are Petrol and five are Diesel.
Even though most of the vehicles in Europe countries are currently required to comply with the EURO-6 standards, the emission model help us to identify the worst case scenarios or maximum expected emissions due to the presence of speed humps on the roads. It is important to note that in non-Europe countries such as in the United States, the average lifetime for cars is about 15 years [57,58], not to mention that in developing countries the lifetime for cars overpasses the 15 years.
The emission model is as follows:
E n = max ( E 0 , f 1 + f 2 v n + f 3 v n 2 + f 4 a n + f 5 a n 2 + f 6 v n a n )
where v n and a n represent the velocity and the acceleration of the n-th vehicle at current time. In this model, both velocity and acceleration are required in meters per second. The constant E 0 is a lower limit emission value for each vehicle and pollutant type. The functions f i are associated with the properties of the vehicle and pollutant type. Please note that for a vehicle with zero velocity and zero acceleration the value for E n is given by the maximum between E 0 and f 1 . As long as the vehicle has a non-zero velocity the contributions of f 2 , f 3 and f 6 are considered for the computation of E n , when the vehicle presents changes in its velocity then the contributions of f 4 , f 5 and f 6 are also considered for the computation of E n .

4. Results and Discussion

We consider a single lane with about 11.25 km, this lane is represented as an array with L = 1500 equally sized cells; each cell representing 7.5 m, the typical cell size used by the NaSch model [40]. This value discretization includes the size of the vehicle plus any additional gap to the rear and to the front car. An instance of this lane with random positioned speed humps and vehicles is depicted in Figure 2.
We use periodic boundary conditions such that the number of vehicles does not changes over time. We performed 50 independent runs with 20,000 iterations each, the transient period was set to 15,000 iterations thus only the last 5000 iterations were used to compute the average values presented in this section. Each iteration represents a unit time of a second, thus the simulation results correspond to about 1.3 h of real time. For all our simulations the number of vehicles N = ρ L , where ρ [ 0 , 1 ] is the density. The initial velocity of each vehicle is set to zero and its initial position is set randomly. Due to the discrete nature of the cellular automata, each vehicle has an integer value to represent its velocity and position on the lane. For all our simulations we considered a maximum velocity V max = 4 ; we chose this value to study fluctuations on velocity due to deceleration as a result of the presence of speed humps. The braking probability P = 0.1 captures delays on acceleration, overreaction on deceleration and different driver’s behavior.
For all simulations we considered equidistant speed humps. Each vehicle passing over a speed hump decelerates to a minimum velocity of one as indicated by the rules of the modified NaSch model in Section 3.1. After passing the speed hump the vehicle may increase its velocity but considering the maximum velocity, the distance to the closest speed hump at front and the distance to the vehicle ahead.

4.1. The Impact of Speed Humps on Average Velocity and Traffic Flow

In this section, we present results of the effect of speed humps on average velocity and traffic flow. In Figure 3 we show the average velocity as a function of density for different number of speed humps, notice that all the curves follow the same trend. For low densities 0 ρ 0.12 , observe that the average velocity is just below V max = 4 for all the cases but remains almost constant, this is due to the effect of the braking probability P = 0.1 which reduces the average velocity. Then for ρ 0.12 the average velocity decreases rapidly and the curves overlap as density increase, this suggests that for high densities of vehicles the number of speed humps has no significant impact on velocity. This effect is due to the large number of interactions between vehicles, they need to decelerate to avoid collisions and accelerate as soon as there is space to move forward. The average velocity goes to zero due to a rising number of local congestions as we increase the number of vehicles on the lane.
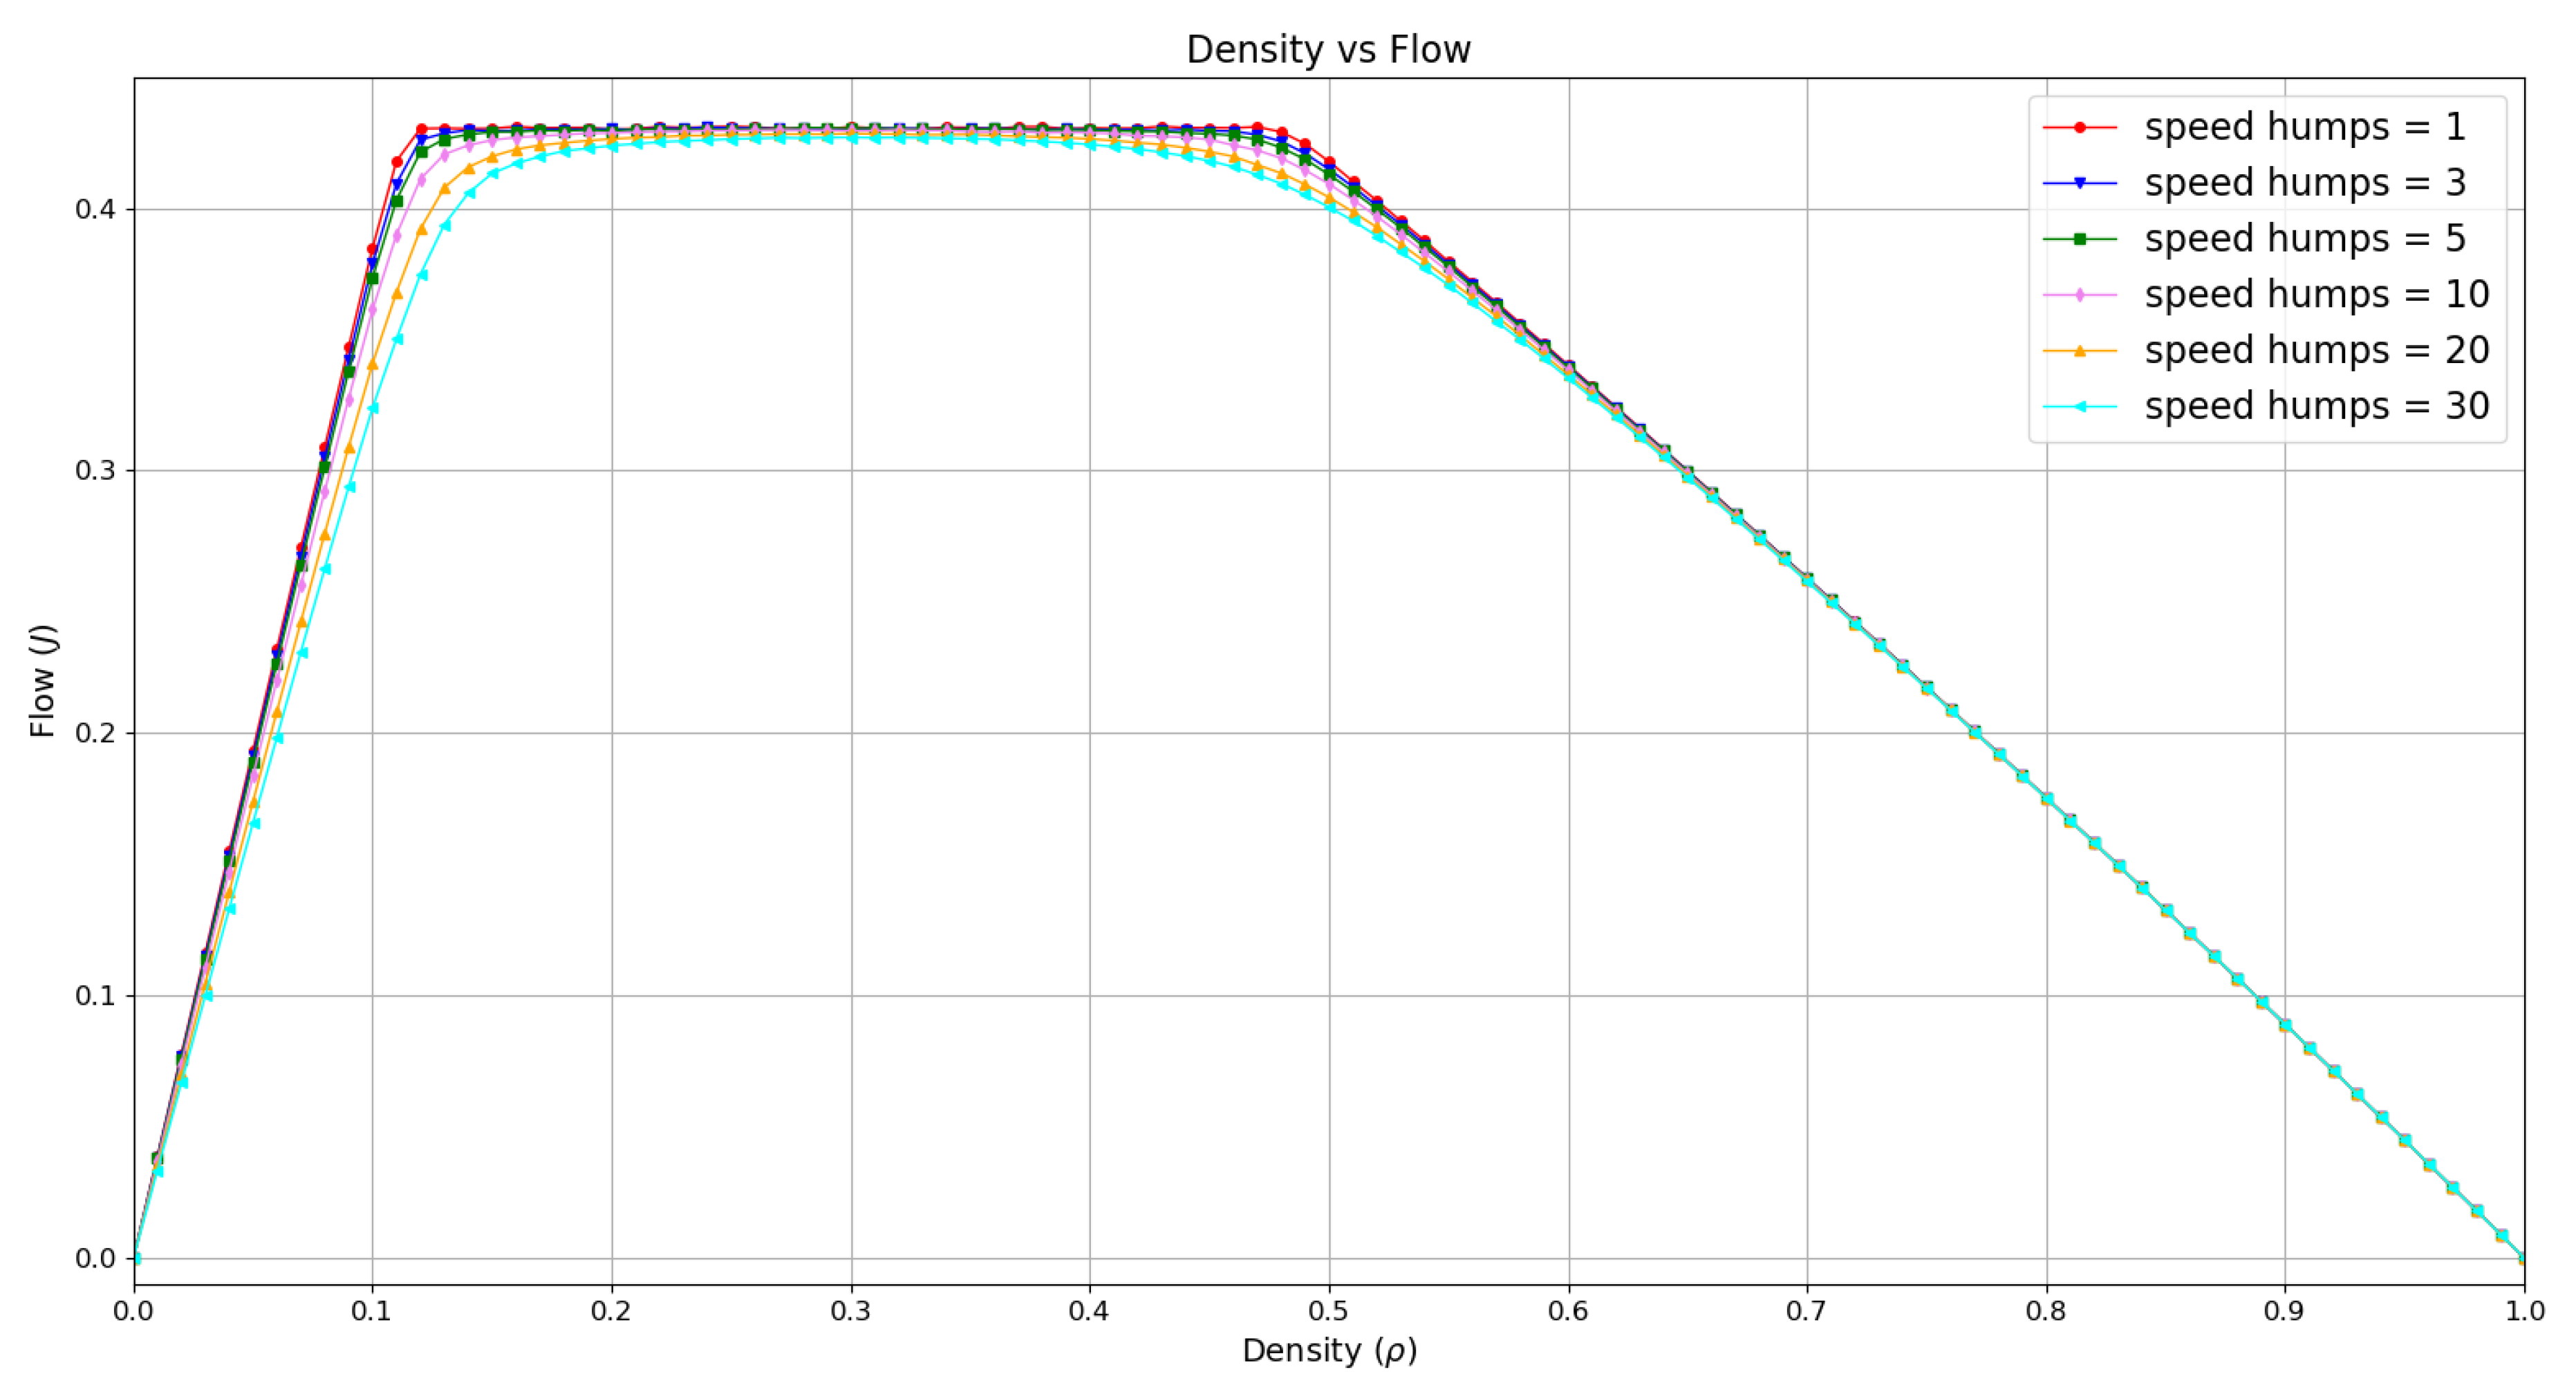
In Figure 4 we present the fundamental diagram for different number of speed humps. We observe that all the studied cases follow the same trend with three observable phases. The free-flow phase for 0 ρ 0.12 where we observe an increase on flow for all the cases. Please note that the cases with more speed humps have a lower slope that those with low number of speed humps. Note the slight difference of the curves with larger number of speed humps from the one with only one speed hump, this suggests a low influence of speed humps on the flow in this phase. The second phase for 0.12 < ρ 0.48 shows a steady phase with no significant variations on the flow for the simulated cases. The third phase for 0.48 < ρ 1 shows a gradual decrease on the flow for all the studied cases. Observe the difference of the curves from 0.48 to 0.7 due to the influence of speed humps, the curves are smoother for the cases with larger number of speed humps. However, for ρ 0.7 the curves overlap, this suggests that the influence of speed humps on flow has vanished, therefore, the decrease on flow results from local congestions due to the number of vehicles on the lane.
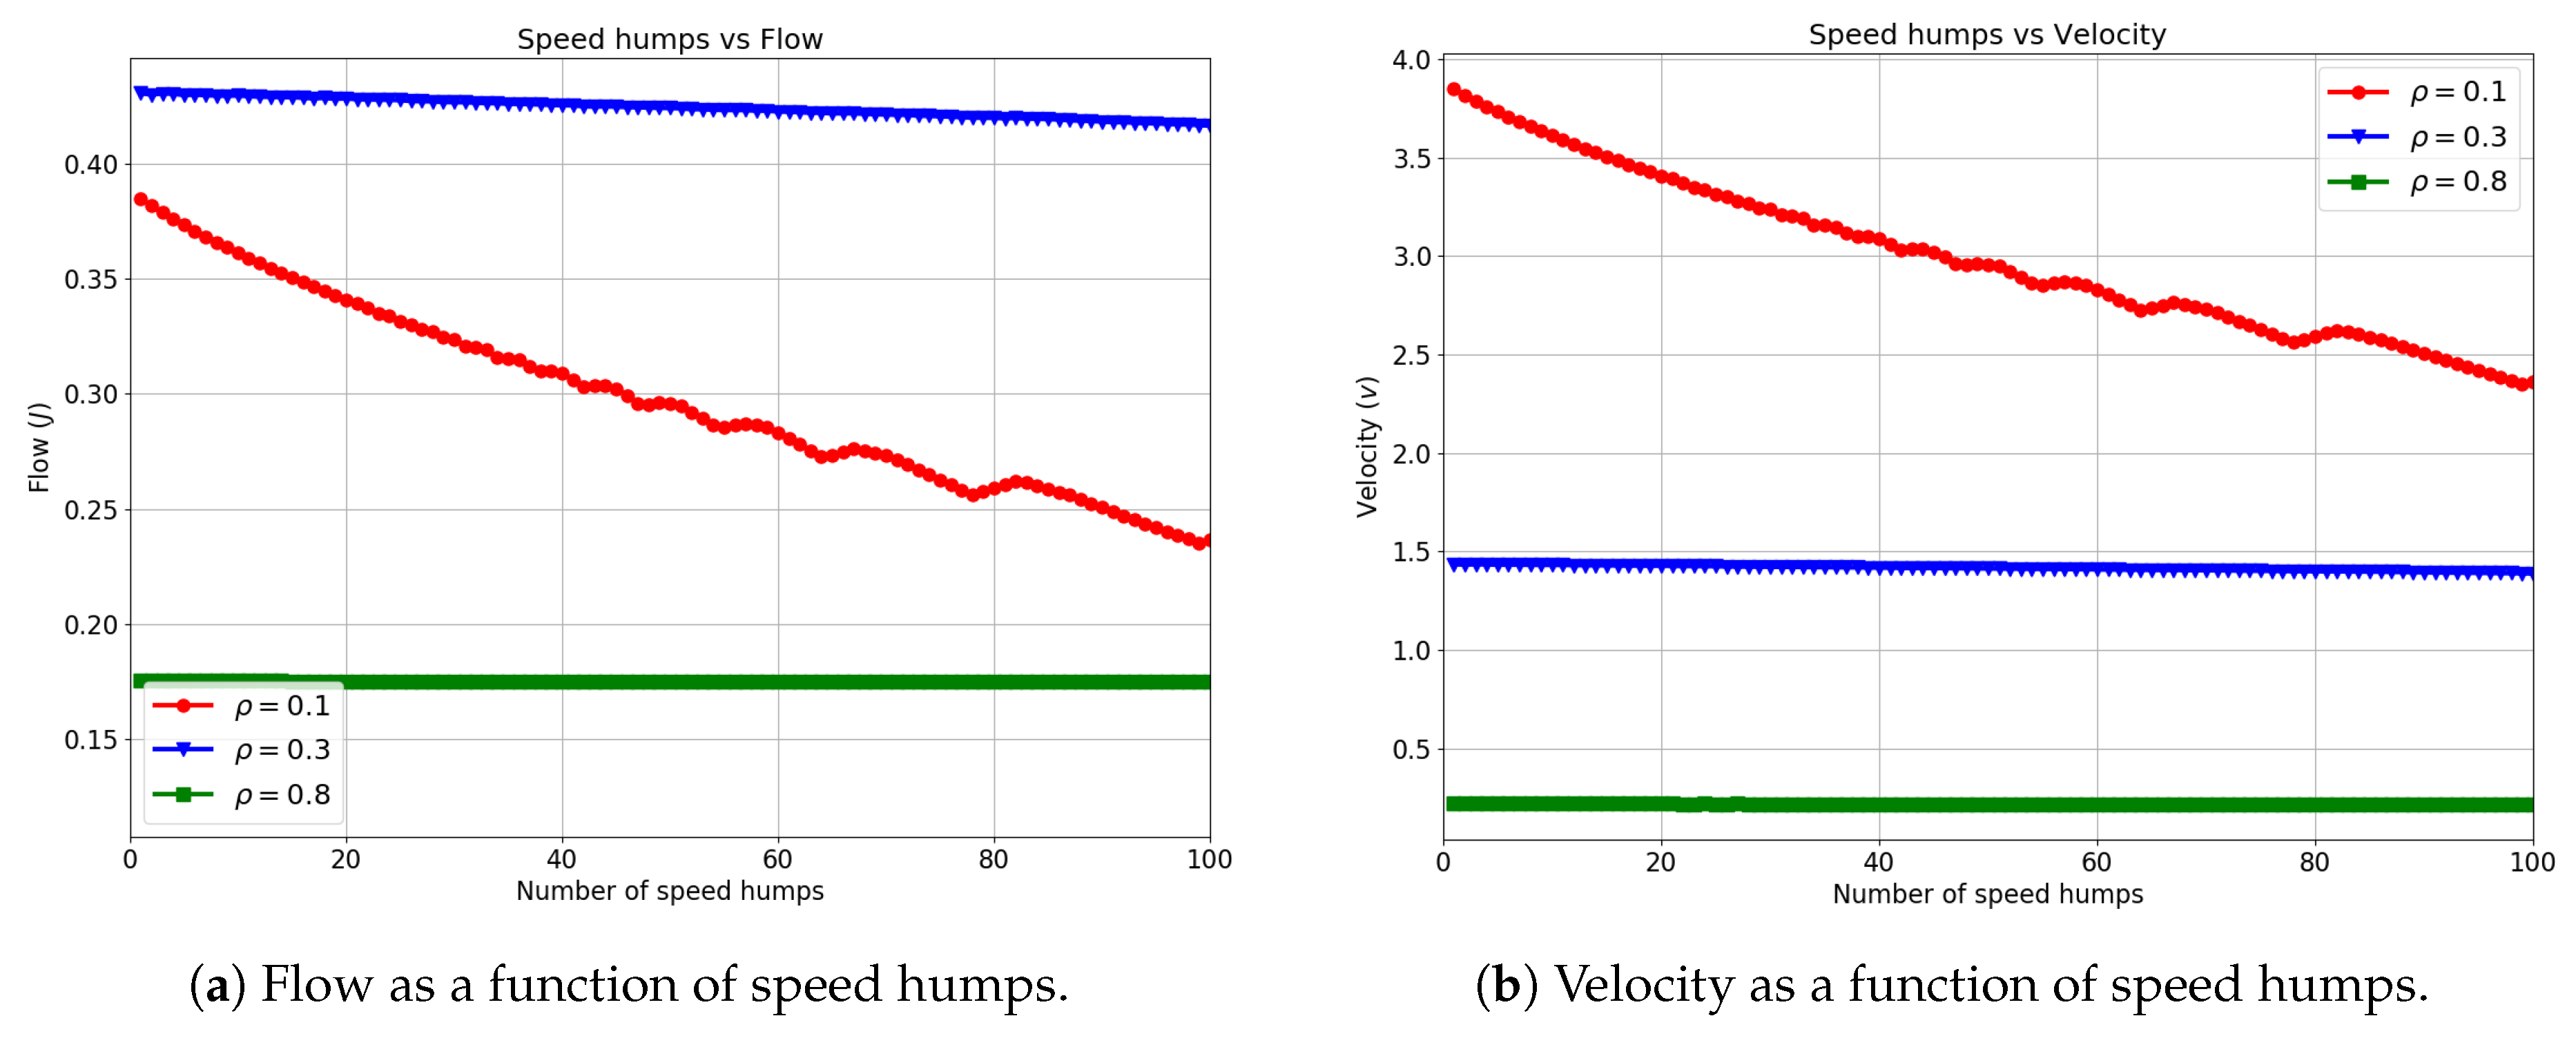
To study the effect of a large number of speed humps on flow and velocity we performed simulations with more than 30 speed humps. In Figure 5 we present the flow and velocity as a function of the number of speed humps. We took three density values to represent each phase: ρ = 0.1 for the first phase, ρ = 0.3 for the second phase, and ρ = 0.8 for the third phase. We tested with up to 100 equidistant speed humps. Observe that for ρ = 0.1 there is a downward trend for flow and velocity, both presenting fluctuations as the number of speed humps increases. For the case ρ = 0.3 the flow presents a very low decrease with the rise on the number of speed humps, the velocity shows a constant value with the increase on the number of speed humps. Finally, for ρ = 0.8 we observe a steady behavior; no changes for the flow nor the velocity.
We use Equation (6) to compute the standard deviation of velocity, where v i is the velocity of the i-th vehicle on the lane, v ¯ is the average velocity and N is the number of vehicles on the lane.
σ = 1 N i = 1 N ( v i v ¯ ) 2
In Table 1 we present the results for ρ = 0.1 for a selected number of speed humps. Please note that for a low number of speed humps the standard deviation is low therefore no fluctuations are observed on velocity, see Figure 5. However, for the selected number of speed humps, the standard deviations are larger than one, this generates the fluctuations observed in Figure 5. These deviations on velocities will impact on the computation of traffic emissions because of the quadratic term in Equation (5) of the instantaneous traffic emission model.
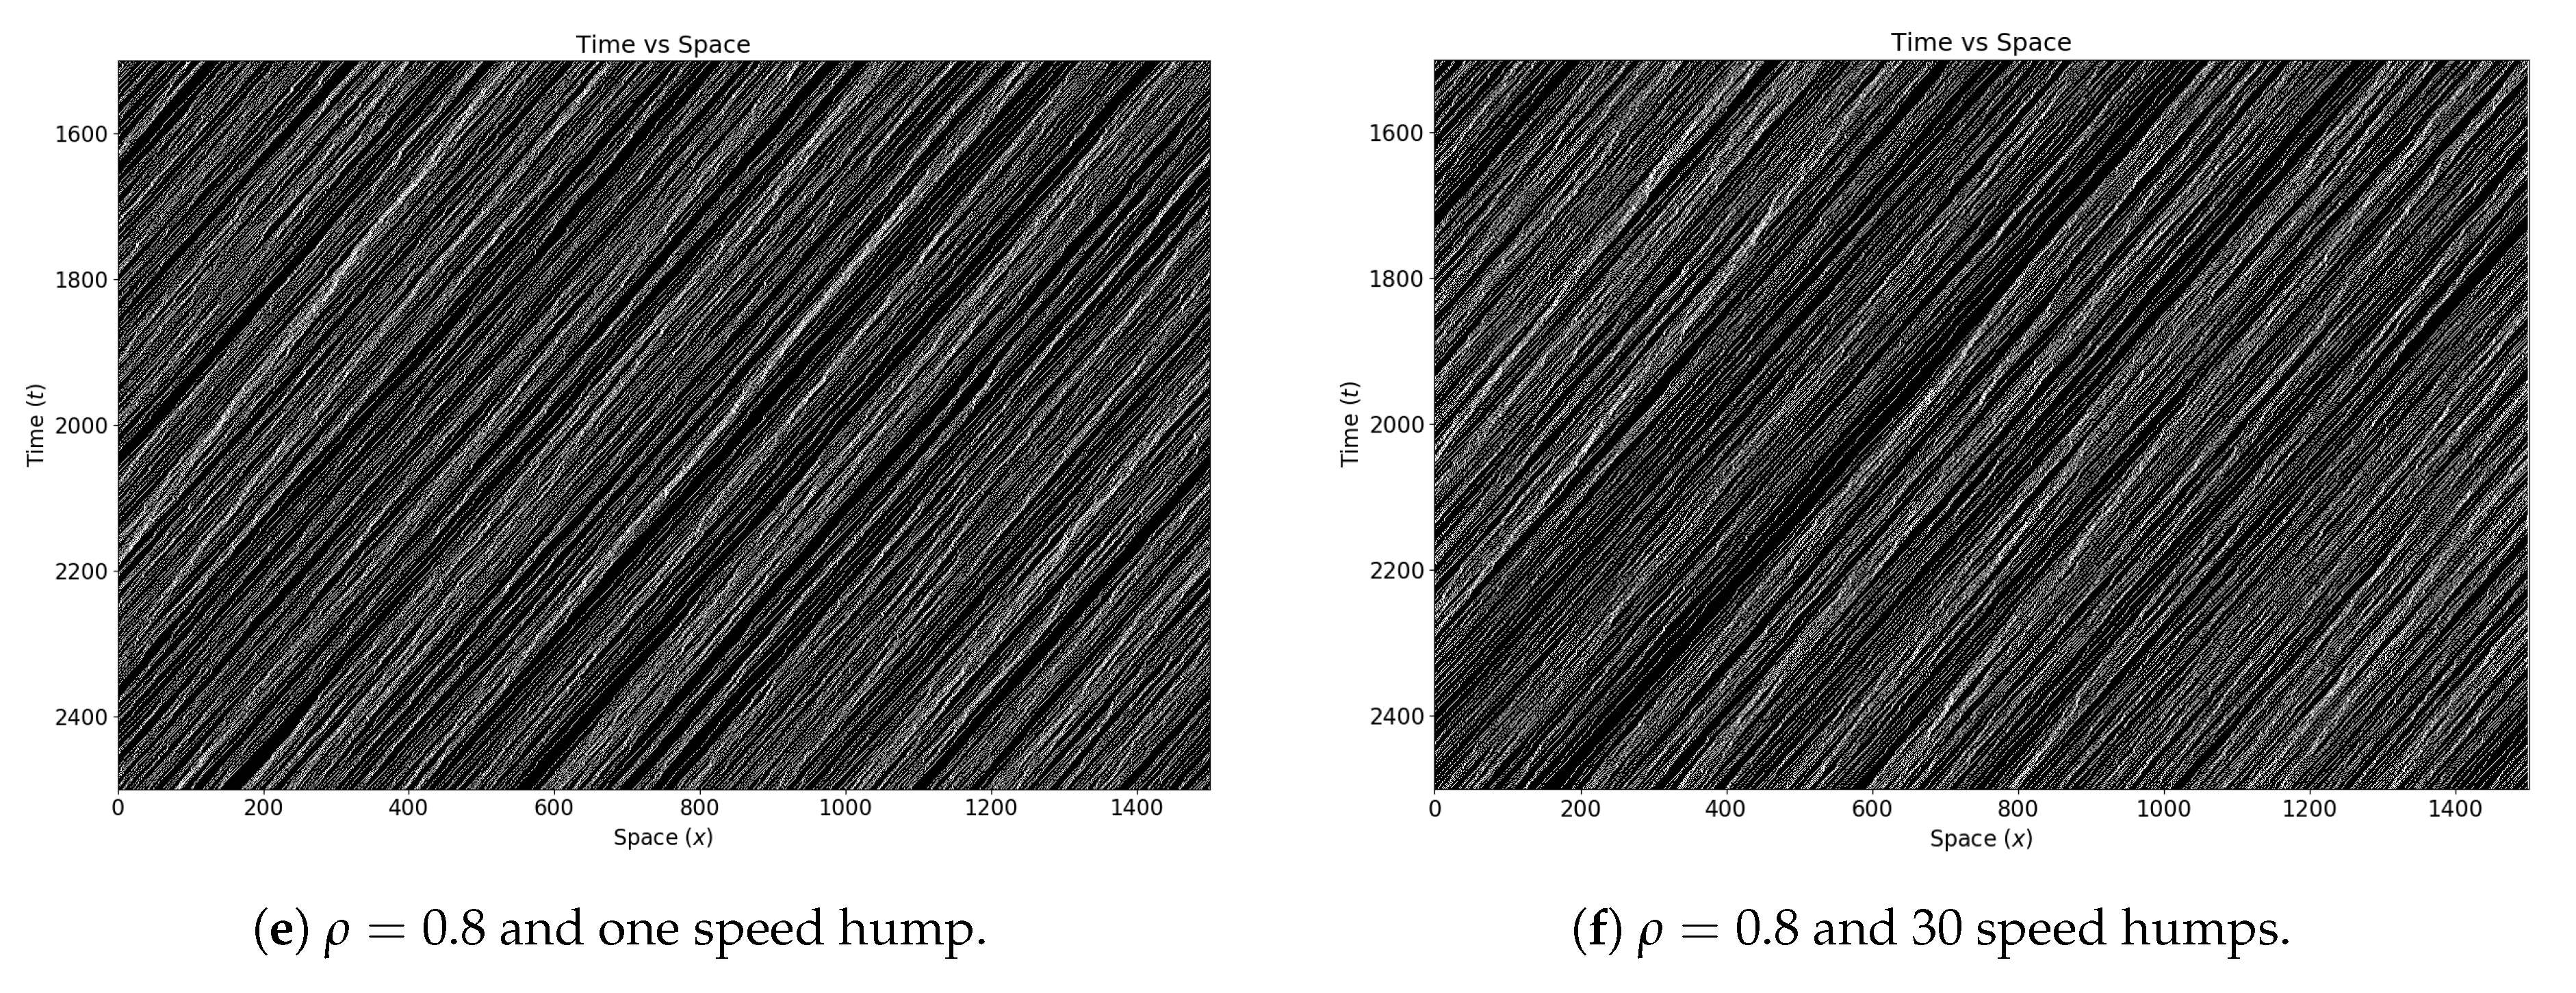
To show the occupancy of the lane and the congestion generated by speed humps we present in Figure 6 time–space diagrams for ρ = [ 0.1 , 0.3 , 0.8 ] , for one and 30 speed humps. Each selected ρ value is within one of the three phases previously described and observed in Figure 4. These diagrams mimic an aerial view of the evolution of the position of vehicles over time. The y-axis represents time and increases downwards, the x-axis represents space and indicates the position of the vehicles on the lane. The vehicles move from left to right in x. The time–space diagrams shown are for t [ 1500 , 2500 ] (after the transient period) and x [ 0 , 1500 ] . To read these diagrams consider that each black point represents a vehicle and white an empty space on the lane. For a given period of time one can observe the vehicles trajectories and their evolution over time; the movement of vehicles from left to right along the lane, the stop-and-go wave, and the formation of congestions due to speed humps and the increase of density. For low densities, it is expected to find vertical patterns that represent local congestions at the position of the speed humps. In fact, we observe the generation of traffic jams at the locations of the speed humps for ρ = 0.1 and ρ = 0.3 , see Figure 6. The variation in the number of vehicles enqueued at the speed bumps results from the random initial positions of the vehicles. These queues of vehicles are generated because every vehicle must decelerate to its minimum velocity to pass over the speed hump; as indicated by the second rule of the modified NaSch model from Section 3.1. Additionally, notice that for the case ρ = 0.3 , spontaneous congestions only appear at the position of the speed hump. Finally, for the case ρ = 0.8 with one and 30 speed humps there is no observable influence of speed humps on the flow of vehicles as indicated by the fundamental diagram in Figure 4. The diagonal patterns result from the stop-and-go wave generated by the third rule of the model from Section 3.1 and the braking probability P = 0.1 .

4.2. The Impact of Speed Humps on Instant Emissions

In this section, we present the results on the impact of speed humps on instantaneous traffic emissions, specifically CO 2 , NO x , VOC and PM. For simplicity we only considered Petrol type vehicles; this reduces variations that may be introduced due to different type of vehicles and help us to focus on the effect of speed humps on the generation of pollutants from traffic flow. Nonetheless, Petrol type vehicles account for most vehicles on traffic according to statistics [13,59,60,61,62,63]. For details on the number Petrol type vehicles used on the design of the model of Panis refer to Section 3.2.
The values for the f i from Equation (5) are listed in Table 2. For each pollutant, we use the f i values on its corresponding row. For the case of NO x and VOC, we need to check whether the acceleration is larger or equal than 0.5 m/s 2 to choose the corresponding f i values.

4.2.1. The Impact of Speed Humps on CO 2 Emissions

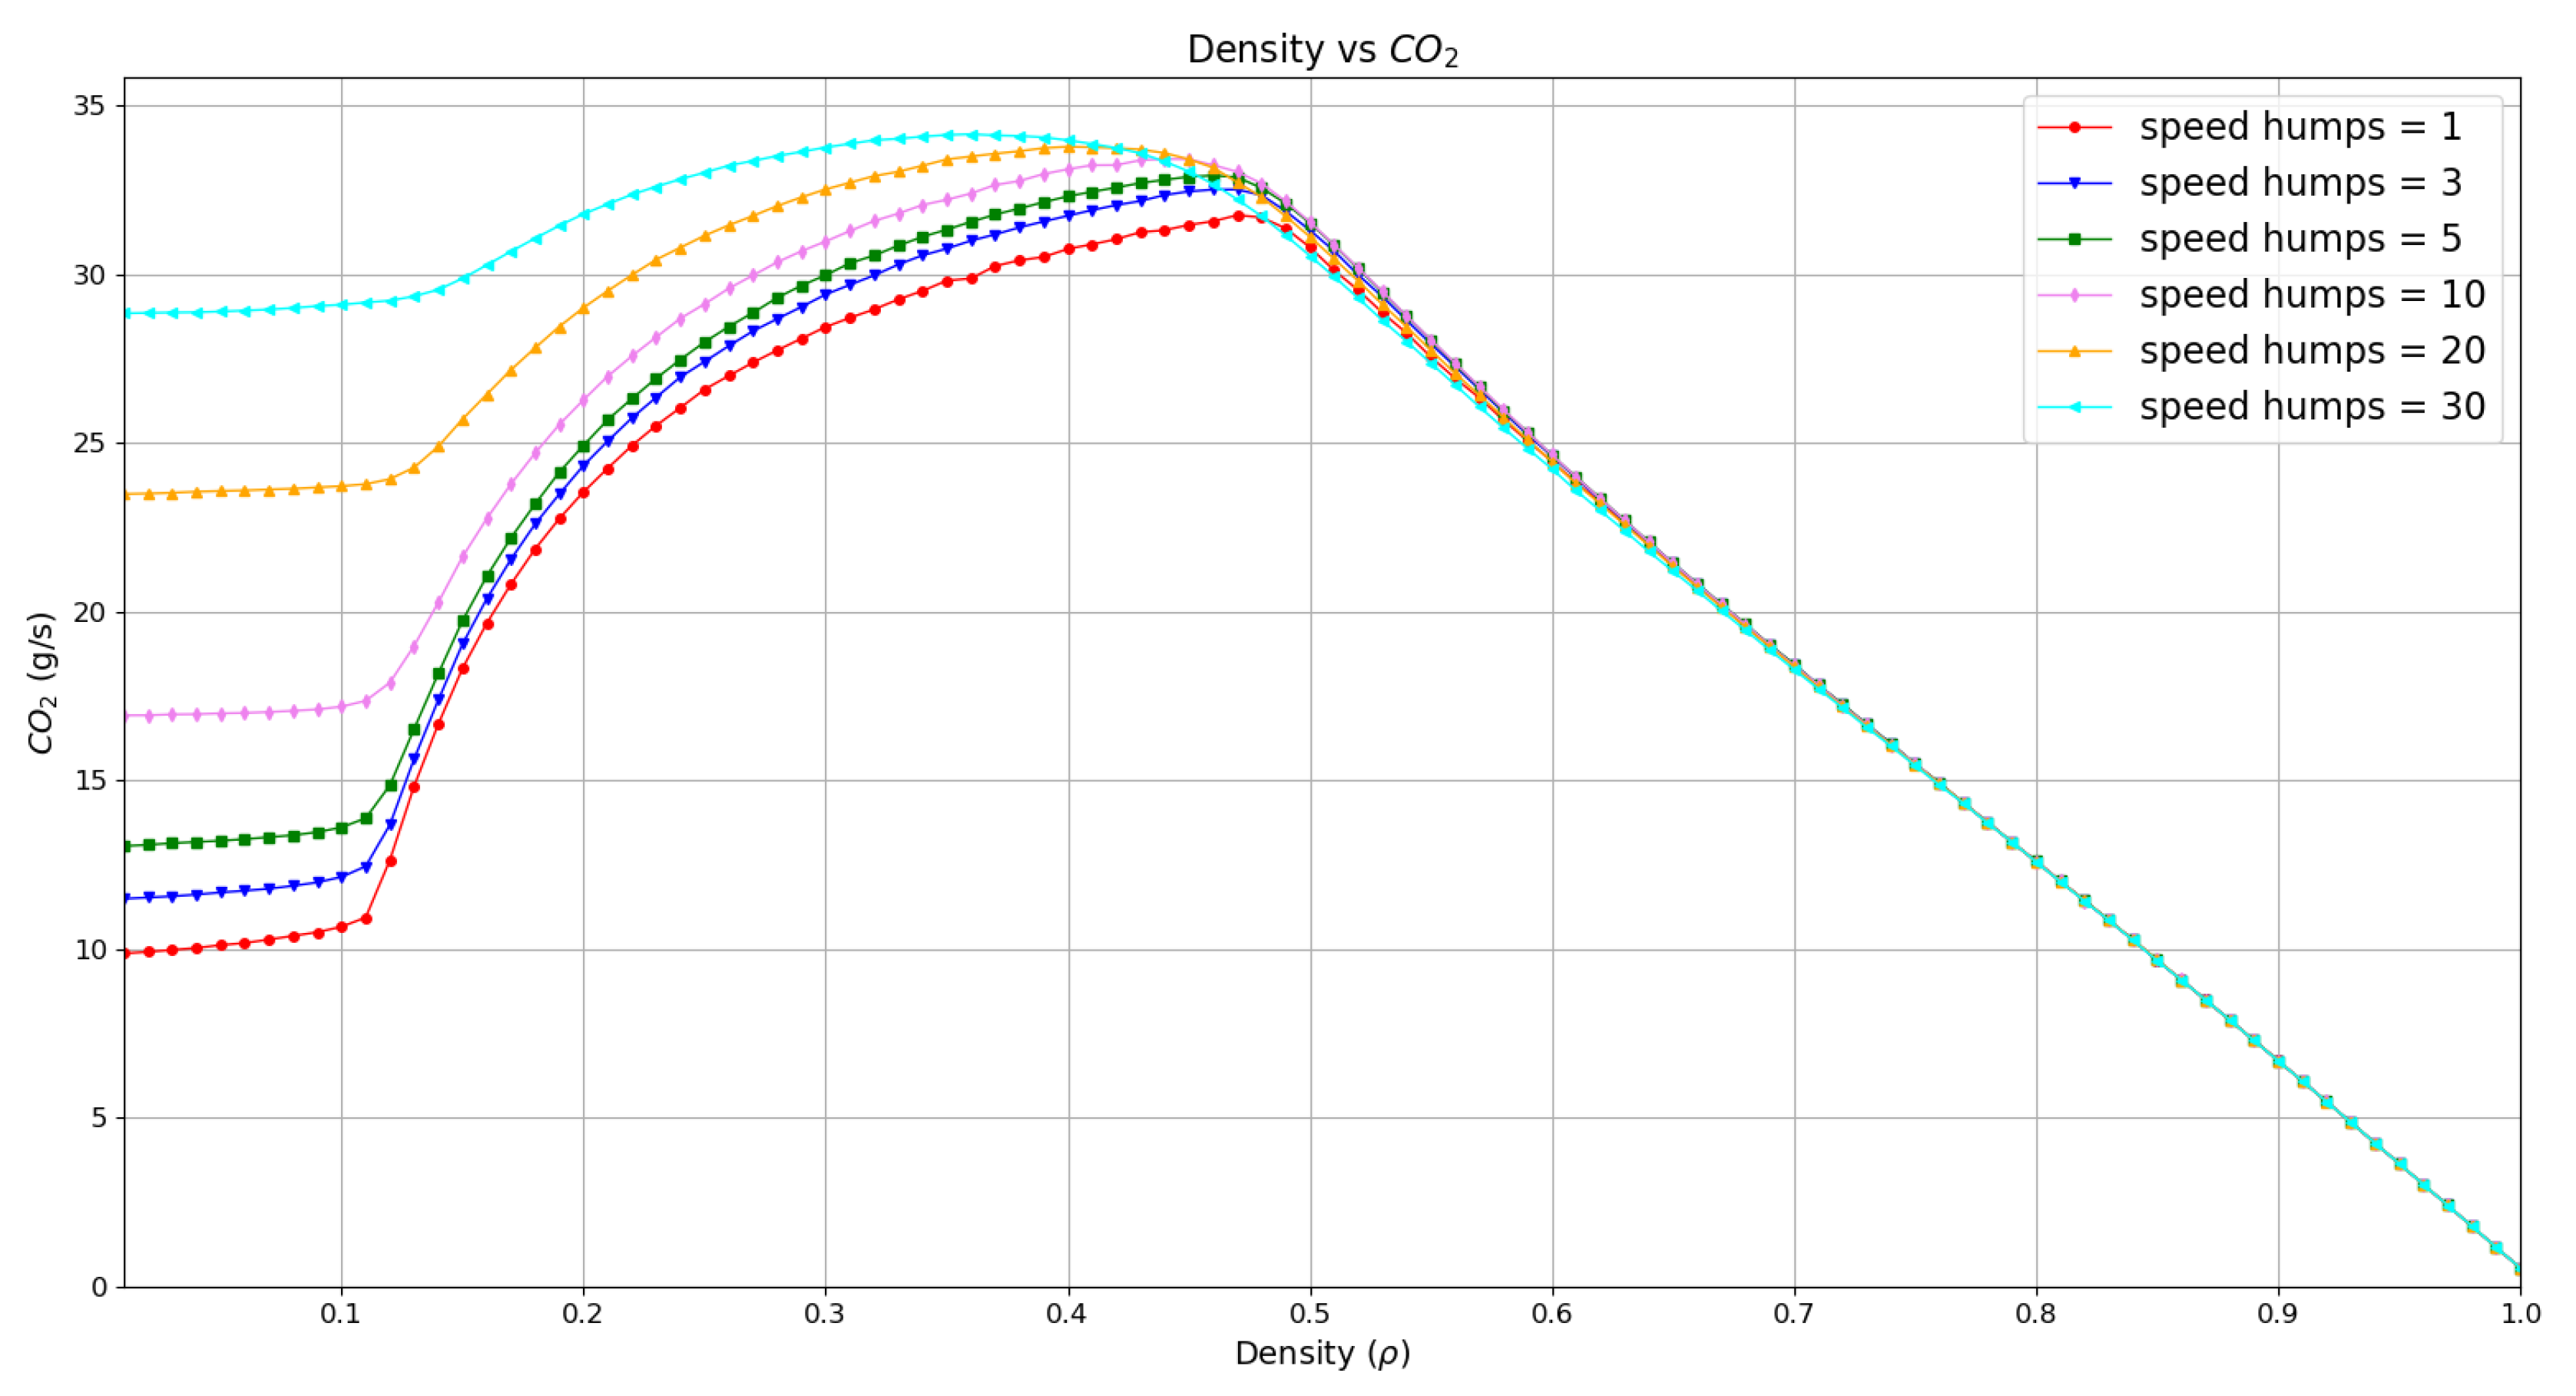
In Figure 7 and Figure 8 we present the results of the computations on instant emissions of CO 2 . The Figure 7 shows the CO 2 emissions as a function of density for different number of speed humps. The reported ranges go from 0.01 to 1.0 for ρ , and from 0 g/s to 35 g/s for CO 2 . We observe that the maximum emission values are in the range from 30 g/s to 35 g/s for the studied cases, we also noticed three different phases. The first phase for 0 < ρ 0.12 corresponds to the free-flow phase, as observed in Figure 4. In this phase, each test case shows a very low increase on CO 2 emissions. However, when comparing the initial CO 2 emission values of each studied case we found a significant difference, this comes from an increase in the stop-and-go effect due to the rise on the number of speed humps. After the first phase there is a very rapid increase on CO 2 emissions for the cases with 1, 3, 5 and 10 speed humps, and only a smooth increase for the cases with higher number of speed humps. This shows a high influence of speed humps on CO 2 emissions for the interval 0.12 < ρ 0.48 . Please note that all the test cases reached a peak on CO 2 emissions in this phase. The third phase for 0.48 < ρ 1 shows a steady fall on CO 2 emissions for all cases because of zero velocities due to traffic congestions. Observe that at this phase the curves of the CO 2 emission overlap, this suggest that speed humps have no significant effect on CO 2 emissions for ρ > 0.48 . Observe that for all the cases, the CO 2 emission converge to the f 1 value from Table 2 as we increase the density, thus vehicles have zero velocity.
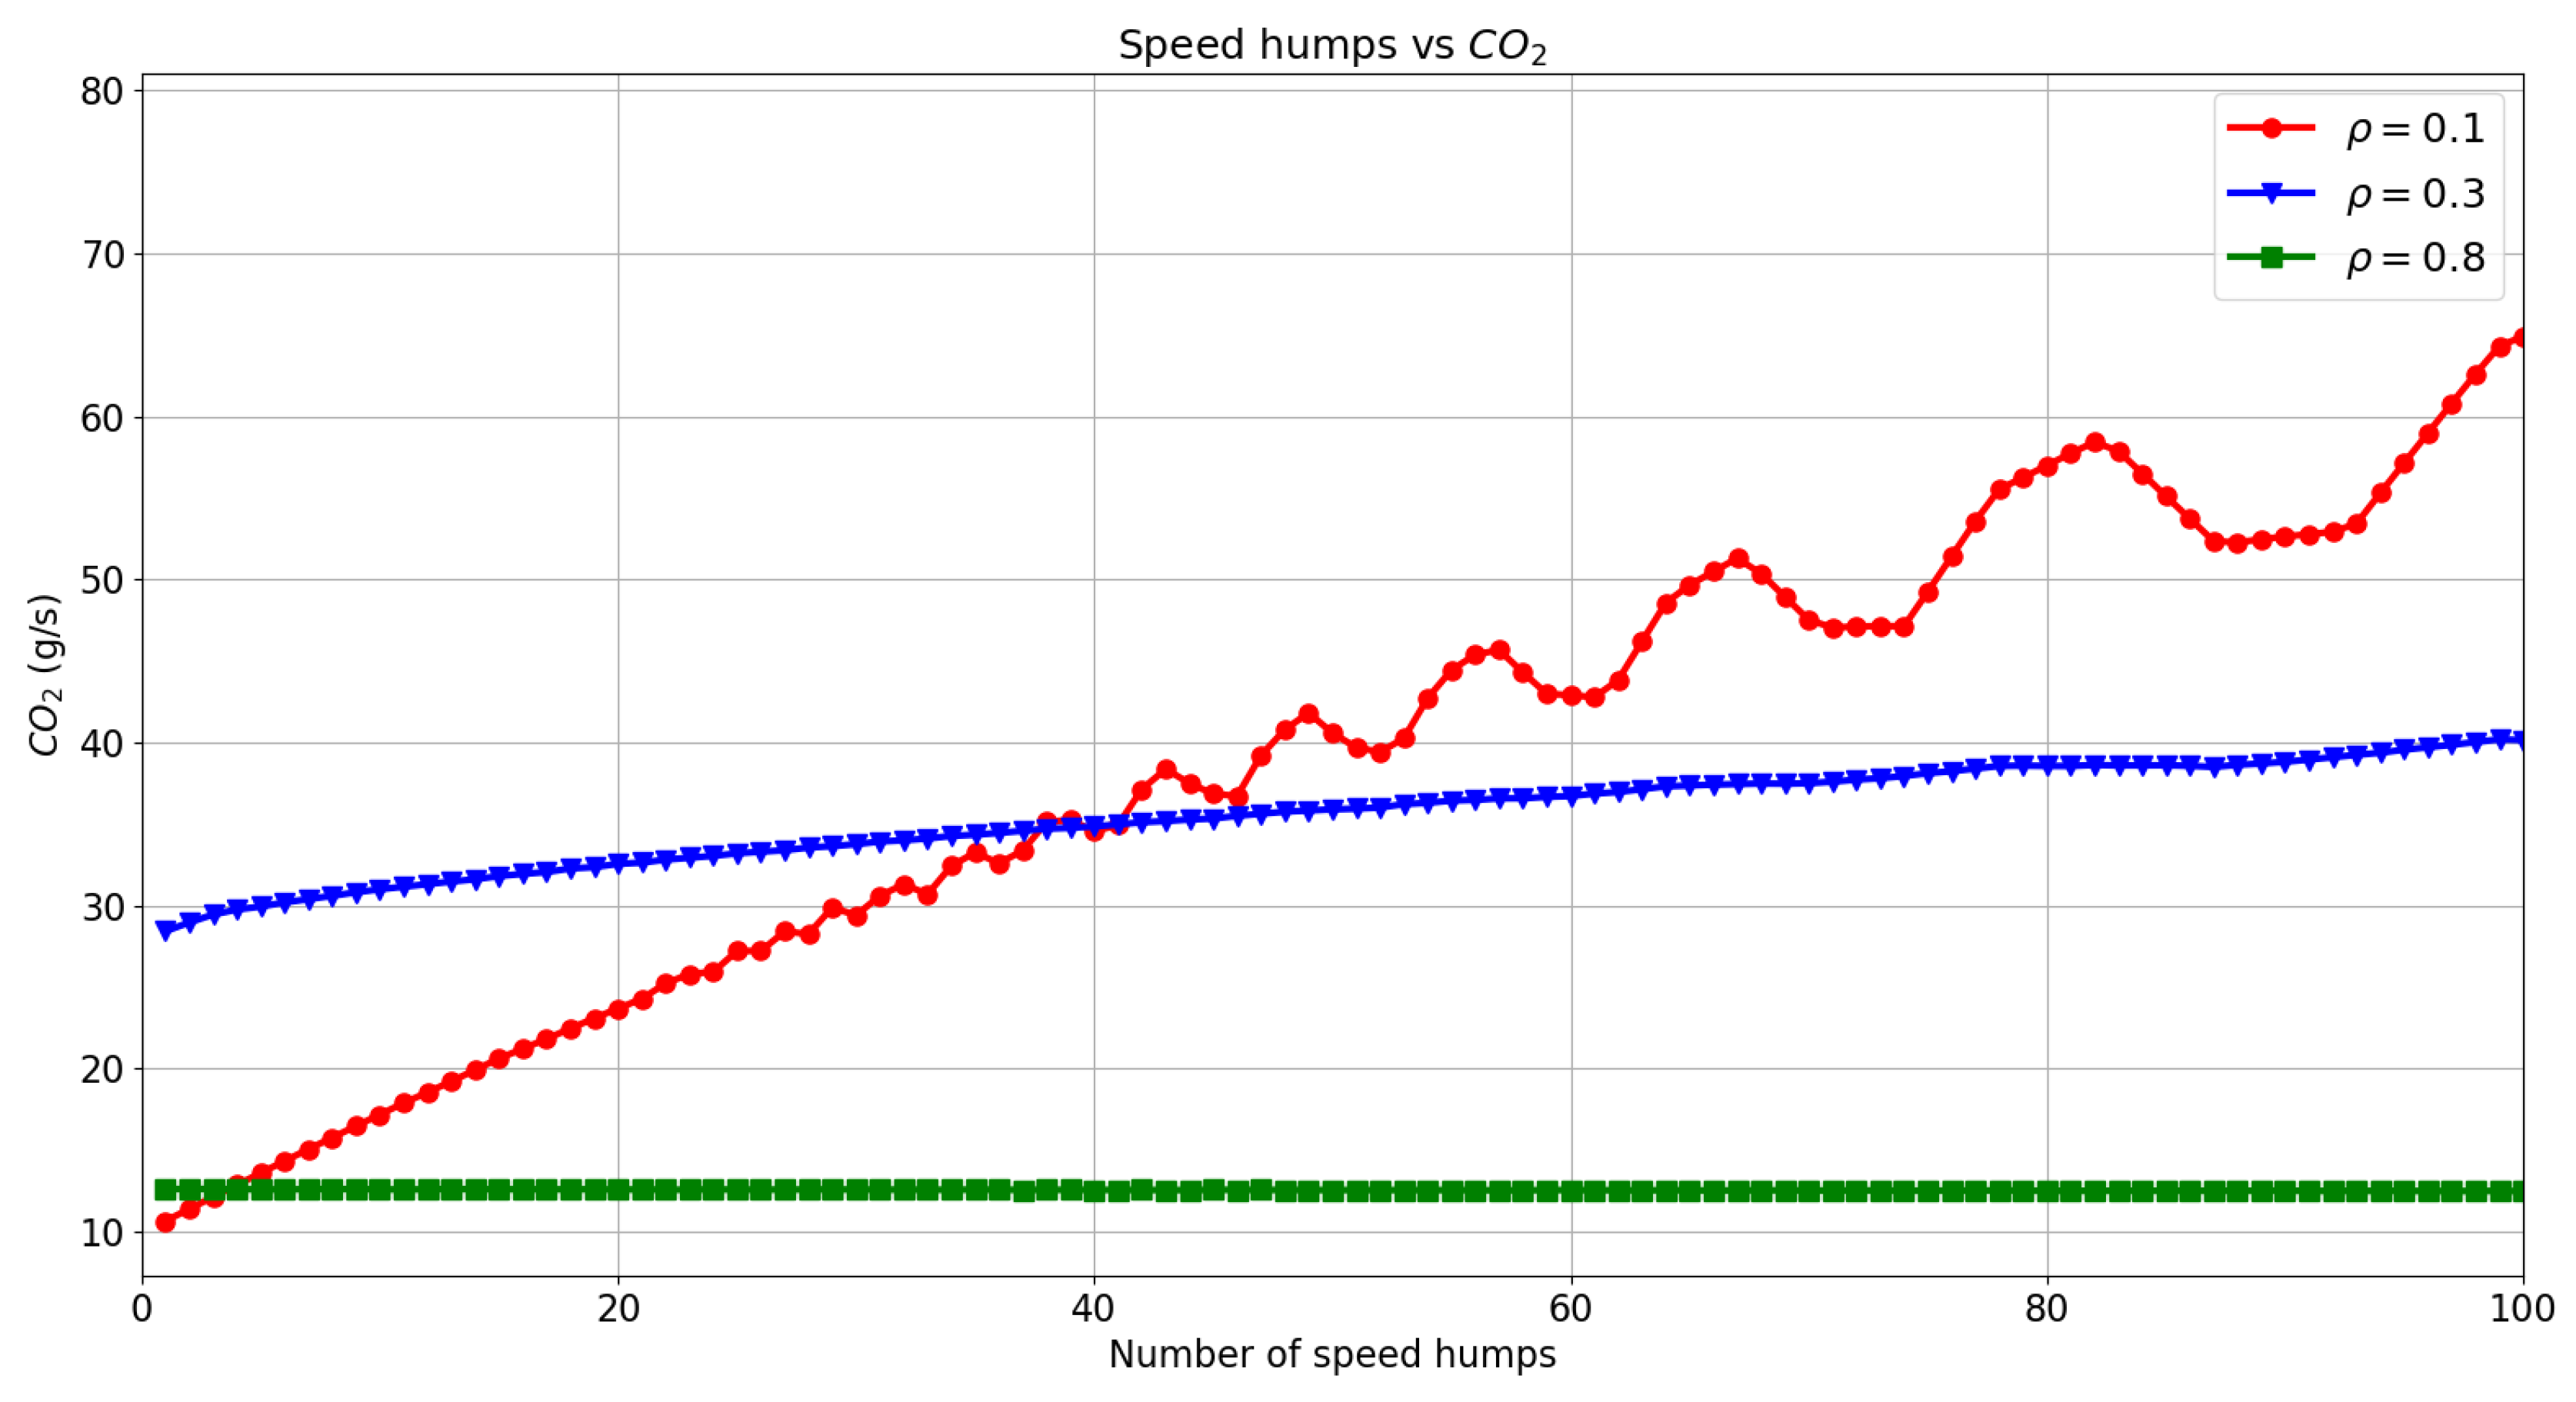
To study the effect of many speed humps we performed simulations with more than 30 speed humps, in Figure 8 we show CO 2 emissions as a function of speed humps for different densities. We increased the number of speed humps from 0 to 100 with equidistant distribution. We took a density value in the range of the previously identified phases. For the first phase we took ρ = 0.1 where we observe a rising trend on CO 2 emissions as we add more speed humps to the lane. Note the presence of fluctuations on CO 2 as the number of speed humps increases, this is similar to the behavior presented by the velocity in Figure 5 due to the standard deviations reported in Table 1. For the second phase we took ρ = 0.3 which shows a slight grow on CO 2 emissions as we increase the number of speed humps, the maximum CO 2 emission value is obtained for 100 speed humps, with about 40 g/s of CO 2 . This indicates that for ρ = 0.3 the interaction with other vehicles are the main reason to decelerate thus reducing the generation of CO 2 . For the third phase we took ρ = 0.8 , observe that CO 2 emissions remain the same for all the tested numbers of speed humps.
Please note that the curve ρ = 0.1 cross the other two curves in Figure 8, this suggest that:
  • a few speed humps at roads with low density of vehicles generate more CO 2 than roads with high densities ( ρ = 0.8 ),
  • a large number of speed humps at roads with low densities generates more CO 2 than roads with low to middle densities ( ρ = 0.3 ).
Based on Figure 7 and Figure 8 we found that the number of speed humps highly influence the generation of CO 2 emissions for low densities. Conversely, speed humps have no major influence on CO 2 emissions for high densities. Additionally, a road with low density of vehicles and a moderate number of speed humps generates more CO 2 emissions than roads with middle to high densities with a moderate number of speed humps.

4.2.2. The Impact of Speed Humps on NO x Emissions

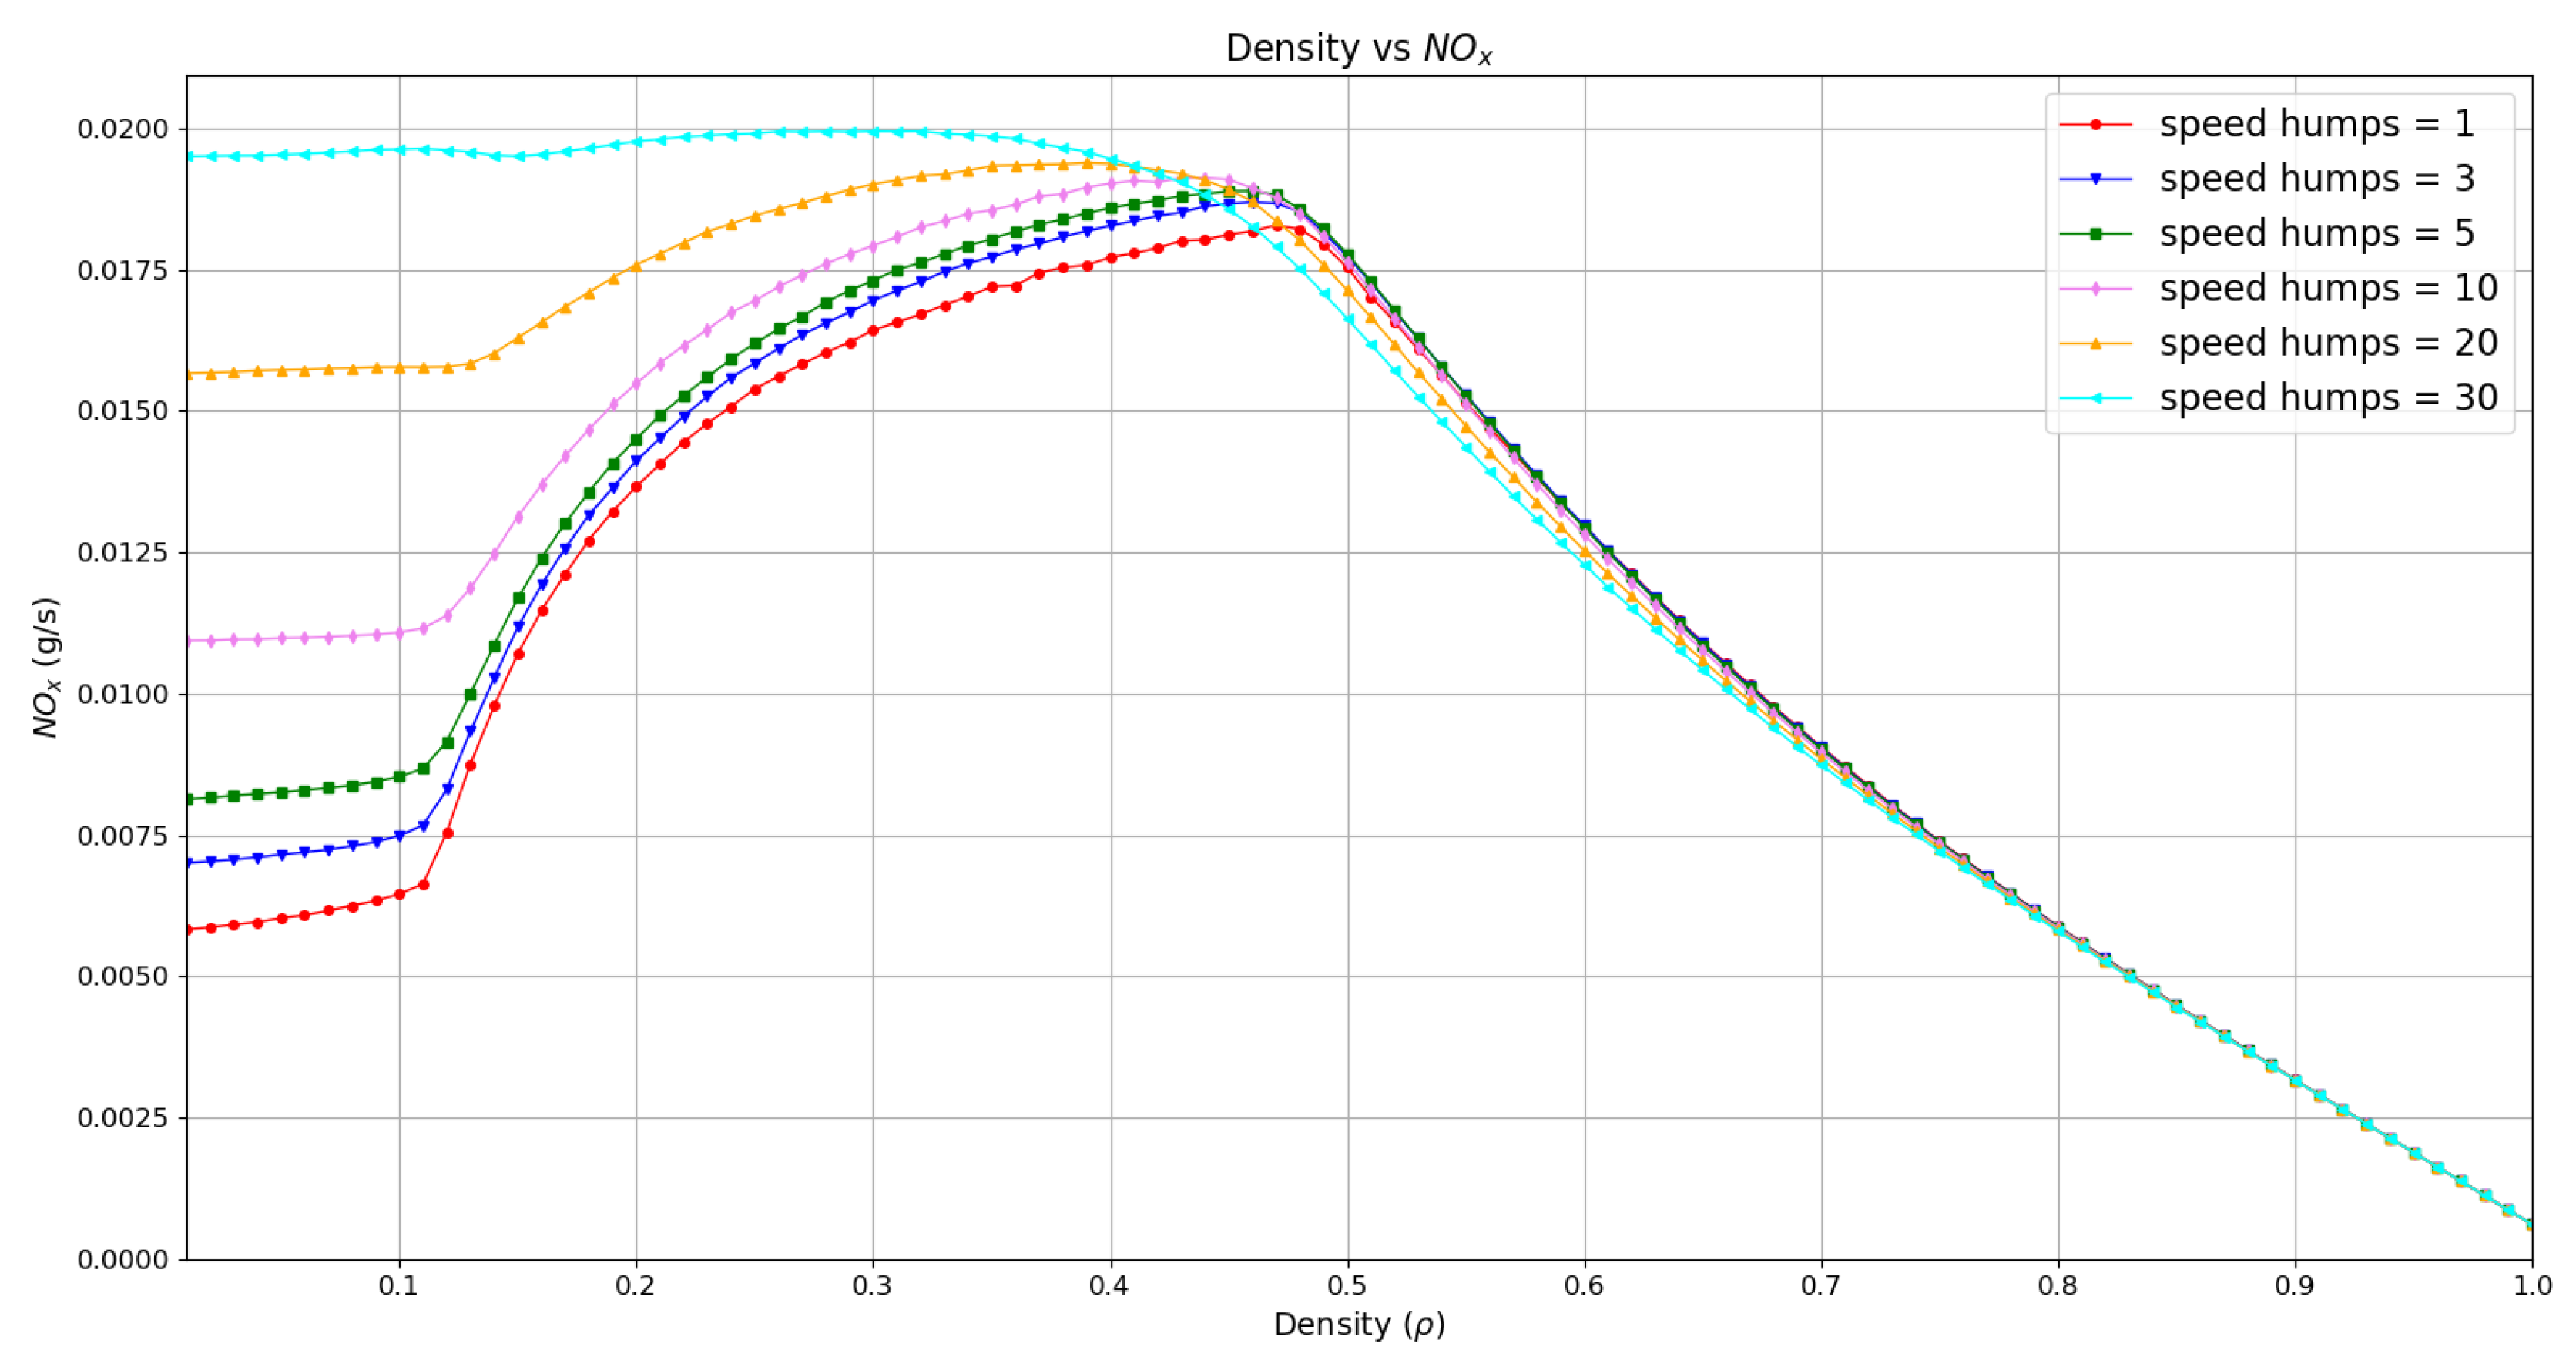
In Figure 9 and Figure 10 we present the results on NO x emissions, in Figure 9 we observe the emissions of NO x as a function of density for different number of speed humps. The ranges go from 0.01 to 1.0 for ρ , and from 0 to 0.02 g/s for NO x . The maximum values reached for this pollutant are in the range from 0.0175 g/s to 0.02 g/s for the studied cases. There are three phases, the first one for 0 < ρ 0.12 shows a large difference on the initial NO x emission values for each test case, this suggests that speed humps have an effect on the generation of NO x emissions due to the deceleration and acceleration of vehicles to pass over speed humps. The second phase for 0.12 < ρ 0.48 shows a rapid increase on NO x for the cases with 1, 3, 5 and 10 speed humps, a moderate increase for the 20 speed humps case, and no significant variations on NO x emissions for the 30 speed humps case. Please note that all the studied cases reached a peak on NO x emissions in this phase. The previous suggest that speed humps promote NO x emissions for ρ 0.48 . The third phase for 0.48 < ρ 1 shows a sudden decrease on NO x emissions for all test cases due to low speed of vehicles. There is also an overlap for the curves representing the emissions which indicates that speed humps have no major influence on NO x emissions for large densities. Please note that all cases converge to the f 1 value from Table 2 as we increase the density.
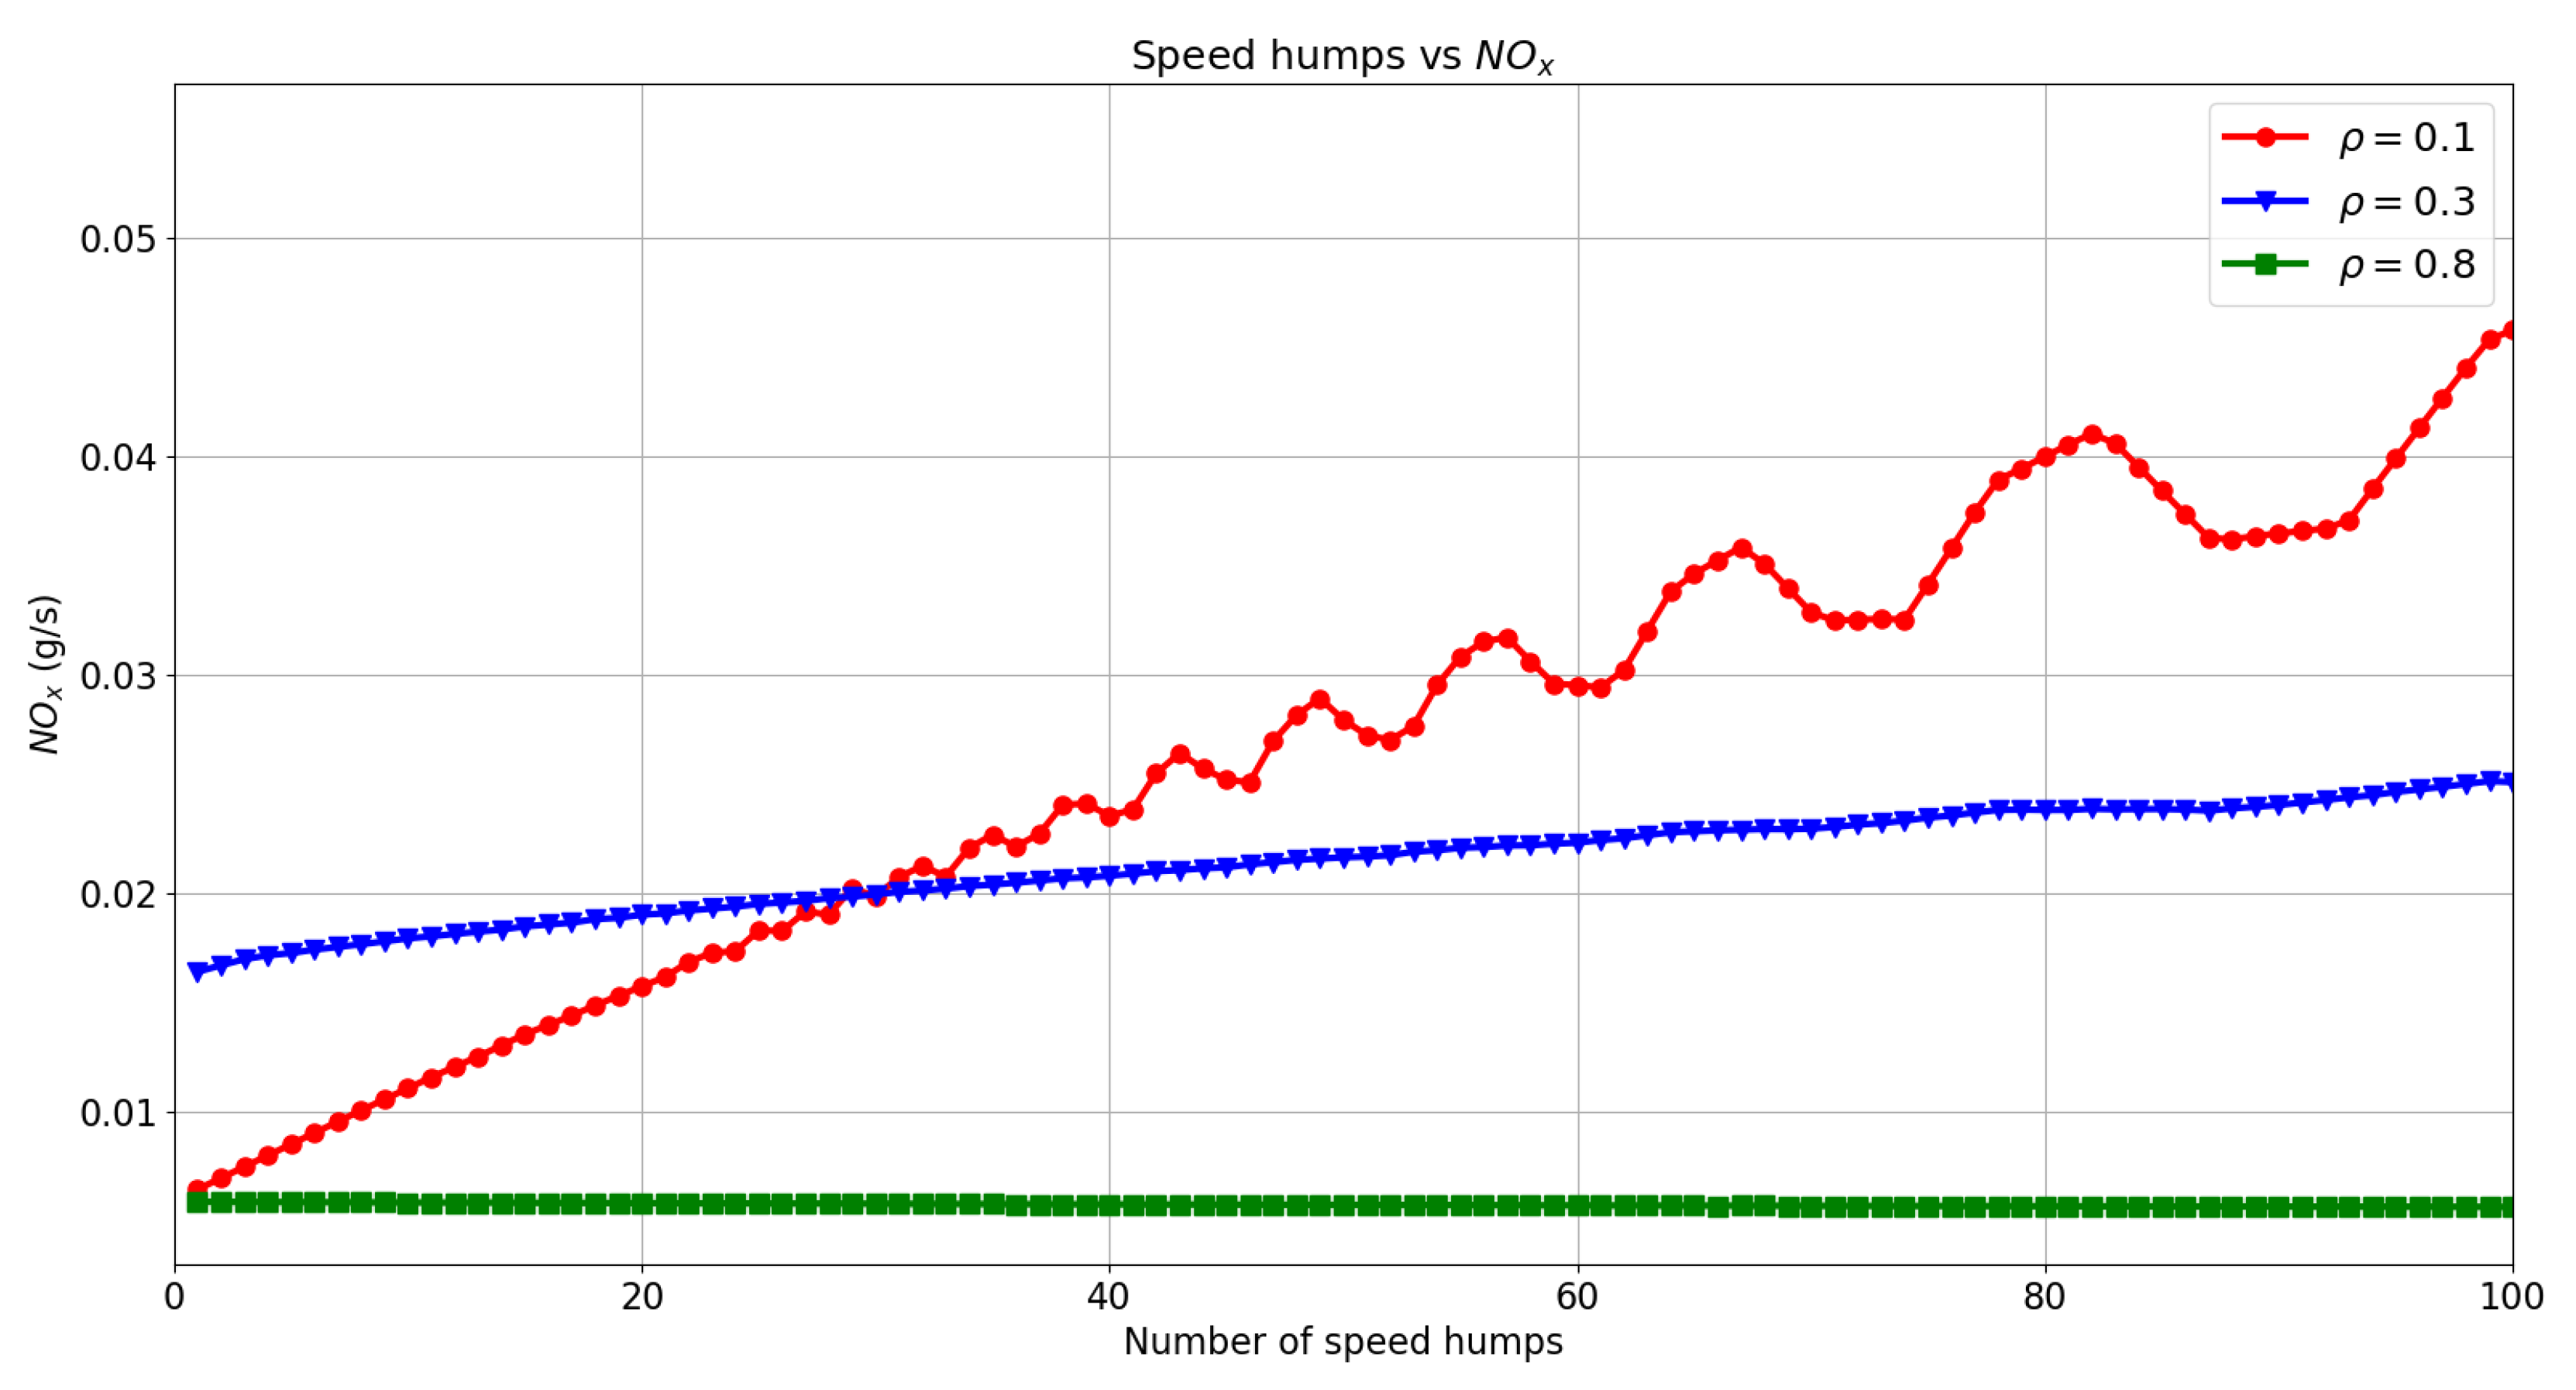
We performed additional simulation with larger number of speed humps to study their effect on NO x emissions, in Figure 10 we show NO x emissions as a function of the number of speed humps for different densities. We have ρ = 0.1 representing the first phase, we observe a rising trend on NO x as we increase the number of speed humps on the lane. The maximum observed value is reported at 100 speed humps with around 0.045 g/s of NO x . This shows that speed humps influence the generation of NO x emissions for low densities. As the CO 2 case, the behavior of the curve is influenced by the standard deviations of the velocity reported in Table 1. For ρ = 0.3 , most of the acceleration and deceleration of vehicles results from the interactions between vehicles and not from the interaction with speed humps. In this case we note a slight rise of NO x emissions as the number of speed humps increases, this suggests a low influence of speed humps on the generation of NO x . Finally, we have ρ = 0.8 from the third phase which shows no variations as we add more speed humps to the lane.
We also observe that the curve ρ = 0.1 cross the curve ρ = 0.3 between 28 and 30 speed humps in Figure 10. This suggests that for more than 30 speed humps, a road with low density of vehicles produces more NO x than a road with a moderate number of vehicles ( ρ = 0.3 ). Additionally, a low-density road with at least one speed hump generates more NO x than a highly occupied road ( ρ = 0.8 ).
The previous analysis allows us to indicate that speed humps highly influence the generation of NO x emissions for low densities. Conversely, there is no major effect of speed humps on NO x emissions for higher densities. Moreover, a road with a low number of vehicles and with just a few speed humps produces more NO x than highly occupied road.

4.2.3. The Impact of Speed Humps on VOC Emissions

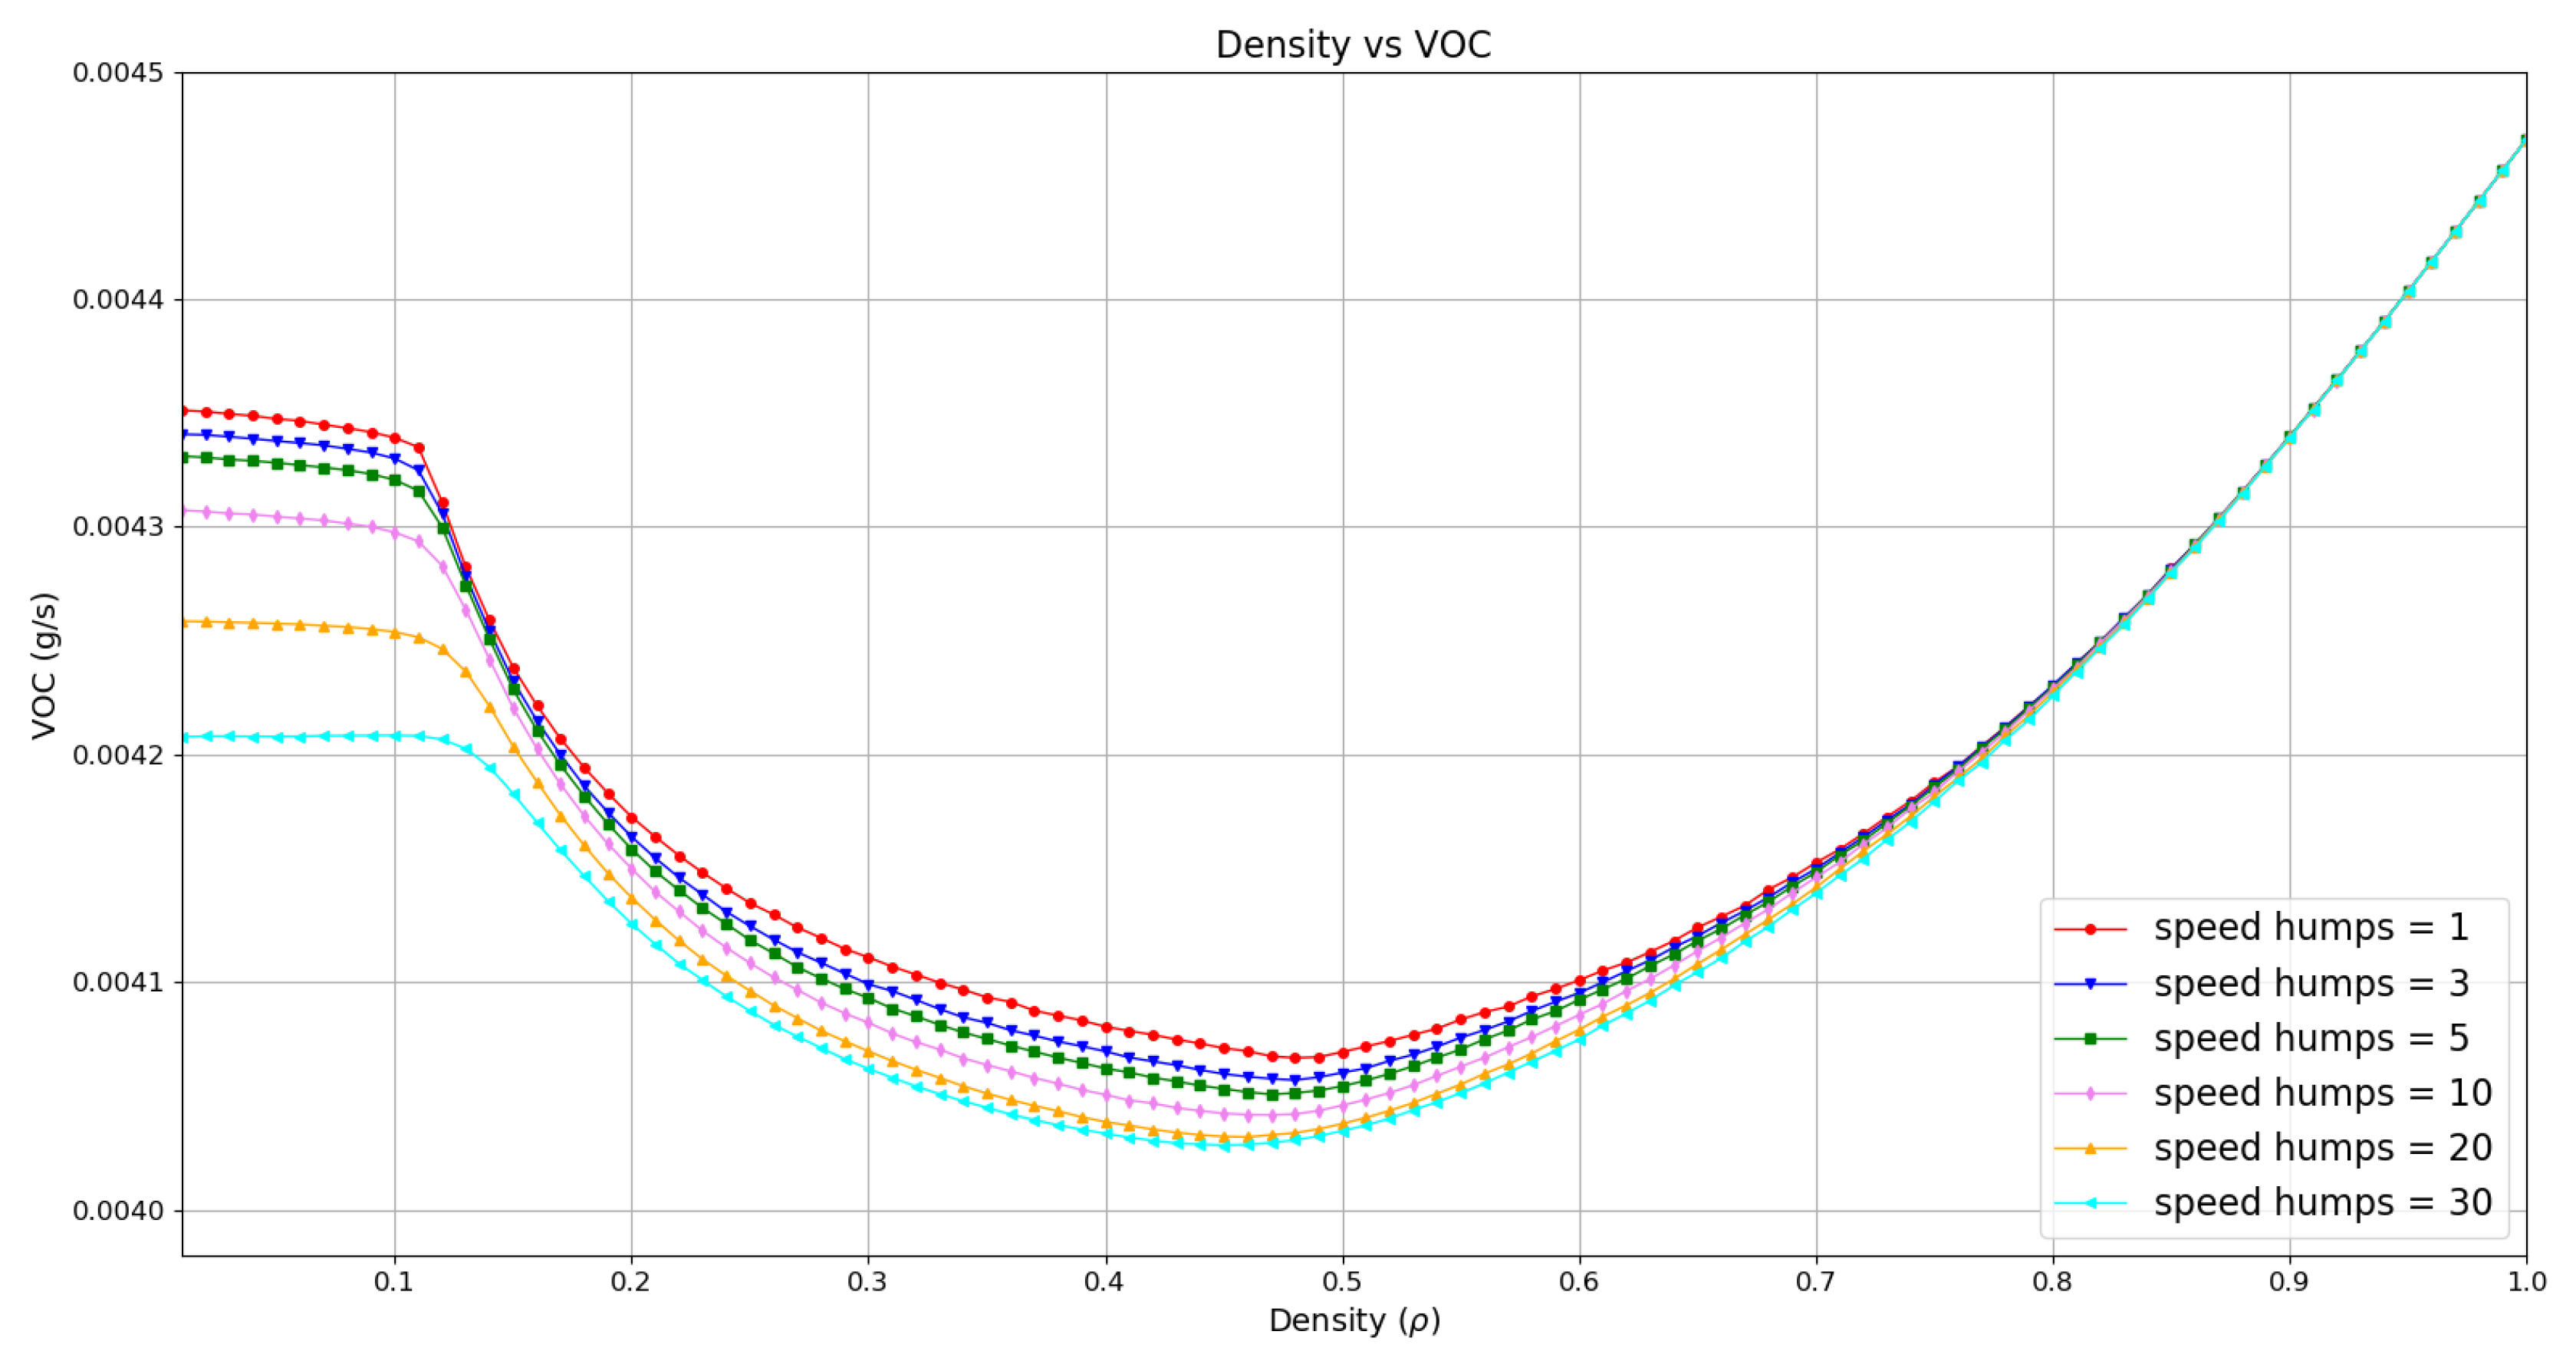
In Figure 11 and Figure 12 we show the results on the impact of speed humps on VOC emissions. Figure 11 shows VOC emissions as a function of density for different number of speed humps. We observe three phases as in the previous cases. Note that the ranges go from 0.01 to 1.0 for ρ , and from 0.0040 g/s to 0.0045 g/s for VOC. The maximum values are reported at the maximum density value; ρ = 1 . In the first phase with 0 < ρ 0.12 there is a clear but very low difference in the initial VOC values for all the test cases. The difference is in the order of 1.5e-4 which indicates a very low effect of speed humps on VOC emissions in this phase. The second phase with 0.12 < ρ 0.48 shows a downward trend on VOC emissions as we increase the number of speed humps. All the test cases show a rapid fall on VOC emissions; reaching its minimum in the interval 0.0040 g/s and 0.0041 g/s. The third phase for 0.48 < ρ 1 shows a sudden rise and an overlap for the curves representing the VOC emission for ρ > 0.8 , this suggests that the rise on VOC emissions is due to the increase on density and not from the increase on the number of speed humps. Observe again the convergence to the f 1 value from Table 2 for all the cases.
To study the effect of a large number of speed humps on VOC emissions we performed simulations with up to 100 speed humps installed on a lane. In Figure 12 we show VOC emissions as a function of the number of speed humps on a lane for different densities. Consider the case ρ = 0.1 representing the first phase, observe the decrease on VOC emissions as the number of speed humps on the lane grows. The difference between the initial and the final values suggest a low influence of speed humps on VOC emissions. Representing the second phase we have ρ = 0.3 with a very low decrease on VOC emissions as we rise the number of speed humps. Finally, the case ρ = 0.8 , representing the third phase shows no difference from the initial to the final VOC emission values as the number of speed humps increases.
From Figure 12 observe that the curve ρ = 0.1 cross the other two curves, therefore:
  • for a moderate number of speed humps, a road with a low number of vehicles generates more VOC emissions than a highly occupied road ( ρ = 0.8 ),
  • for a larger number of speed humps, a road with a high number of vehicles generates more VOC emissions than a low to middle density roads ( ρ = [ 0.1 , 0.3 ] ),
  • for a large number of speed humps, a road with a low number of vehicles ( ρ = 0.1 ) produces a similar quantity of VOC emissions than a road with a moderate number of vehicles ( ρ = 0.3 ).
The previous analysis suggests that in general, speed humps have very low effect on VOC emissions since the variations are in the order of 0.0005 g/s. However, when looking for the configurations with lower VOC emissions we found that a high number of speed humps minimally reduces VOC emissions for roads with very low density.

4.2.4. The Impact of Speed Humps on PM Emissions

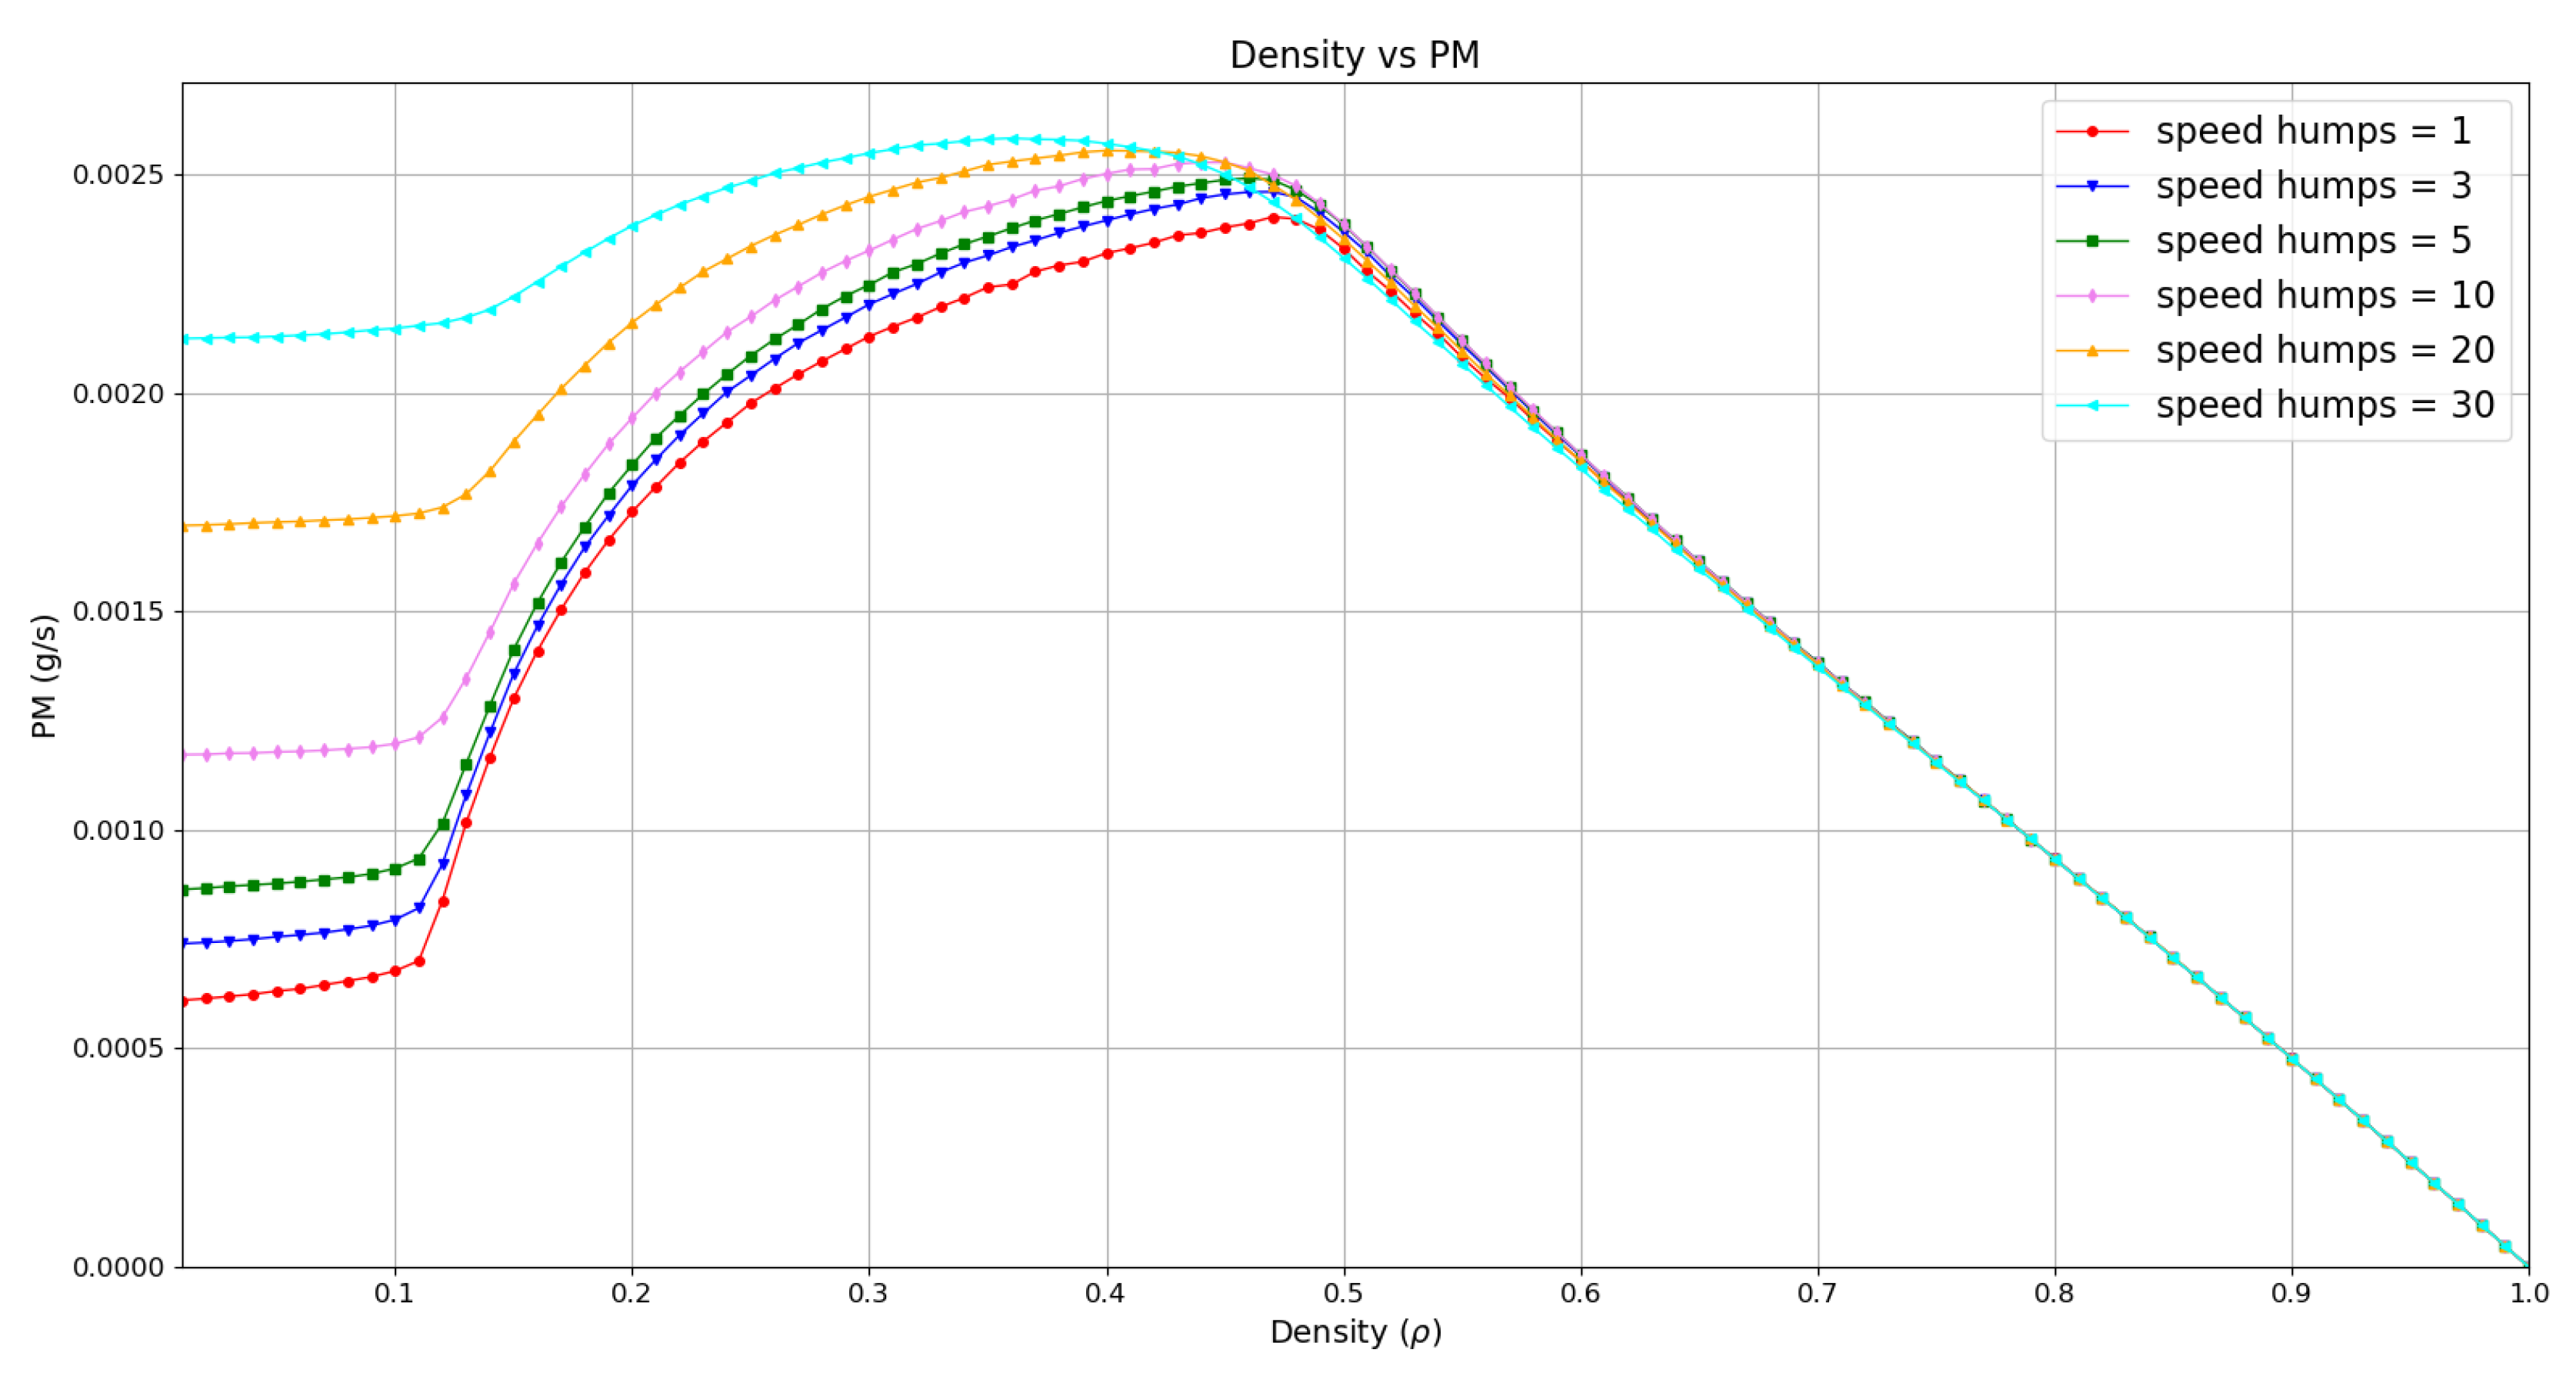
Finally, in Figure 13 and Figure 14 we present the results for PM emissions. Figure 13 shows PM emissions as a function of density for different number of speed humps. The reported ranges go from 0.01 to 1.0 for ρ , and from 0 g/s to 0.0027 g/s for PM emissions. The maximum emission values are in the range from 0.0024 g/s to 0.0026 g/s. We observe three phases, the first one for 0 < ρ 0.12 which shows large differences on the initial PM emission values for each of the test cases. This suggest that at this phase speed humps highly influence the generation of PM emissions due to deceleration and acceleration of vehicles when encountering them. The second phase 0.12 < ρ 0.48 shows an increase on PM emissions for all the cases, for the cases with 1, 3, 5 and 10 speed humps the increment on PM emissions is very rapid while for the cases with 20 and 30 speed humps the increment is moderate. These variations result from the changes on velocities of vehicles due to speed humps and the interaction with other vehicles. Notice that all the studied cases reach their highest PM emissions in this phase. The third phase for 0.48 < ρ 1 shows a sudden fall and an overlap of the curves representing PM emissions, this overlap is mostly due to local congestions. For large densities speed humps have no major effect on the generation of PM emissions. Observe that all cases converge to the f 1 value from Table 2 as we increase the density.
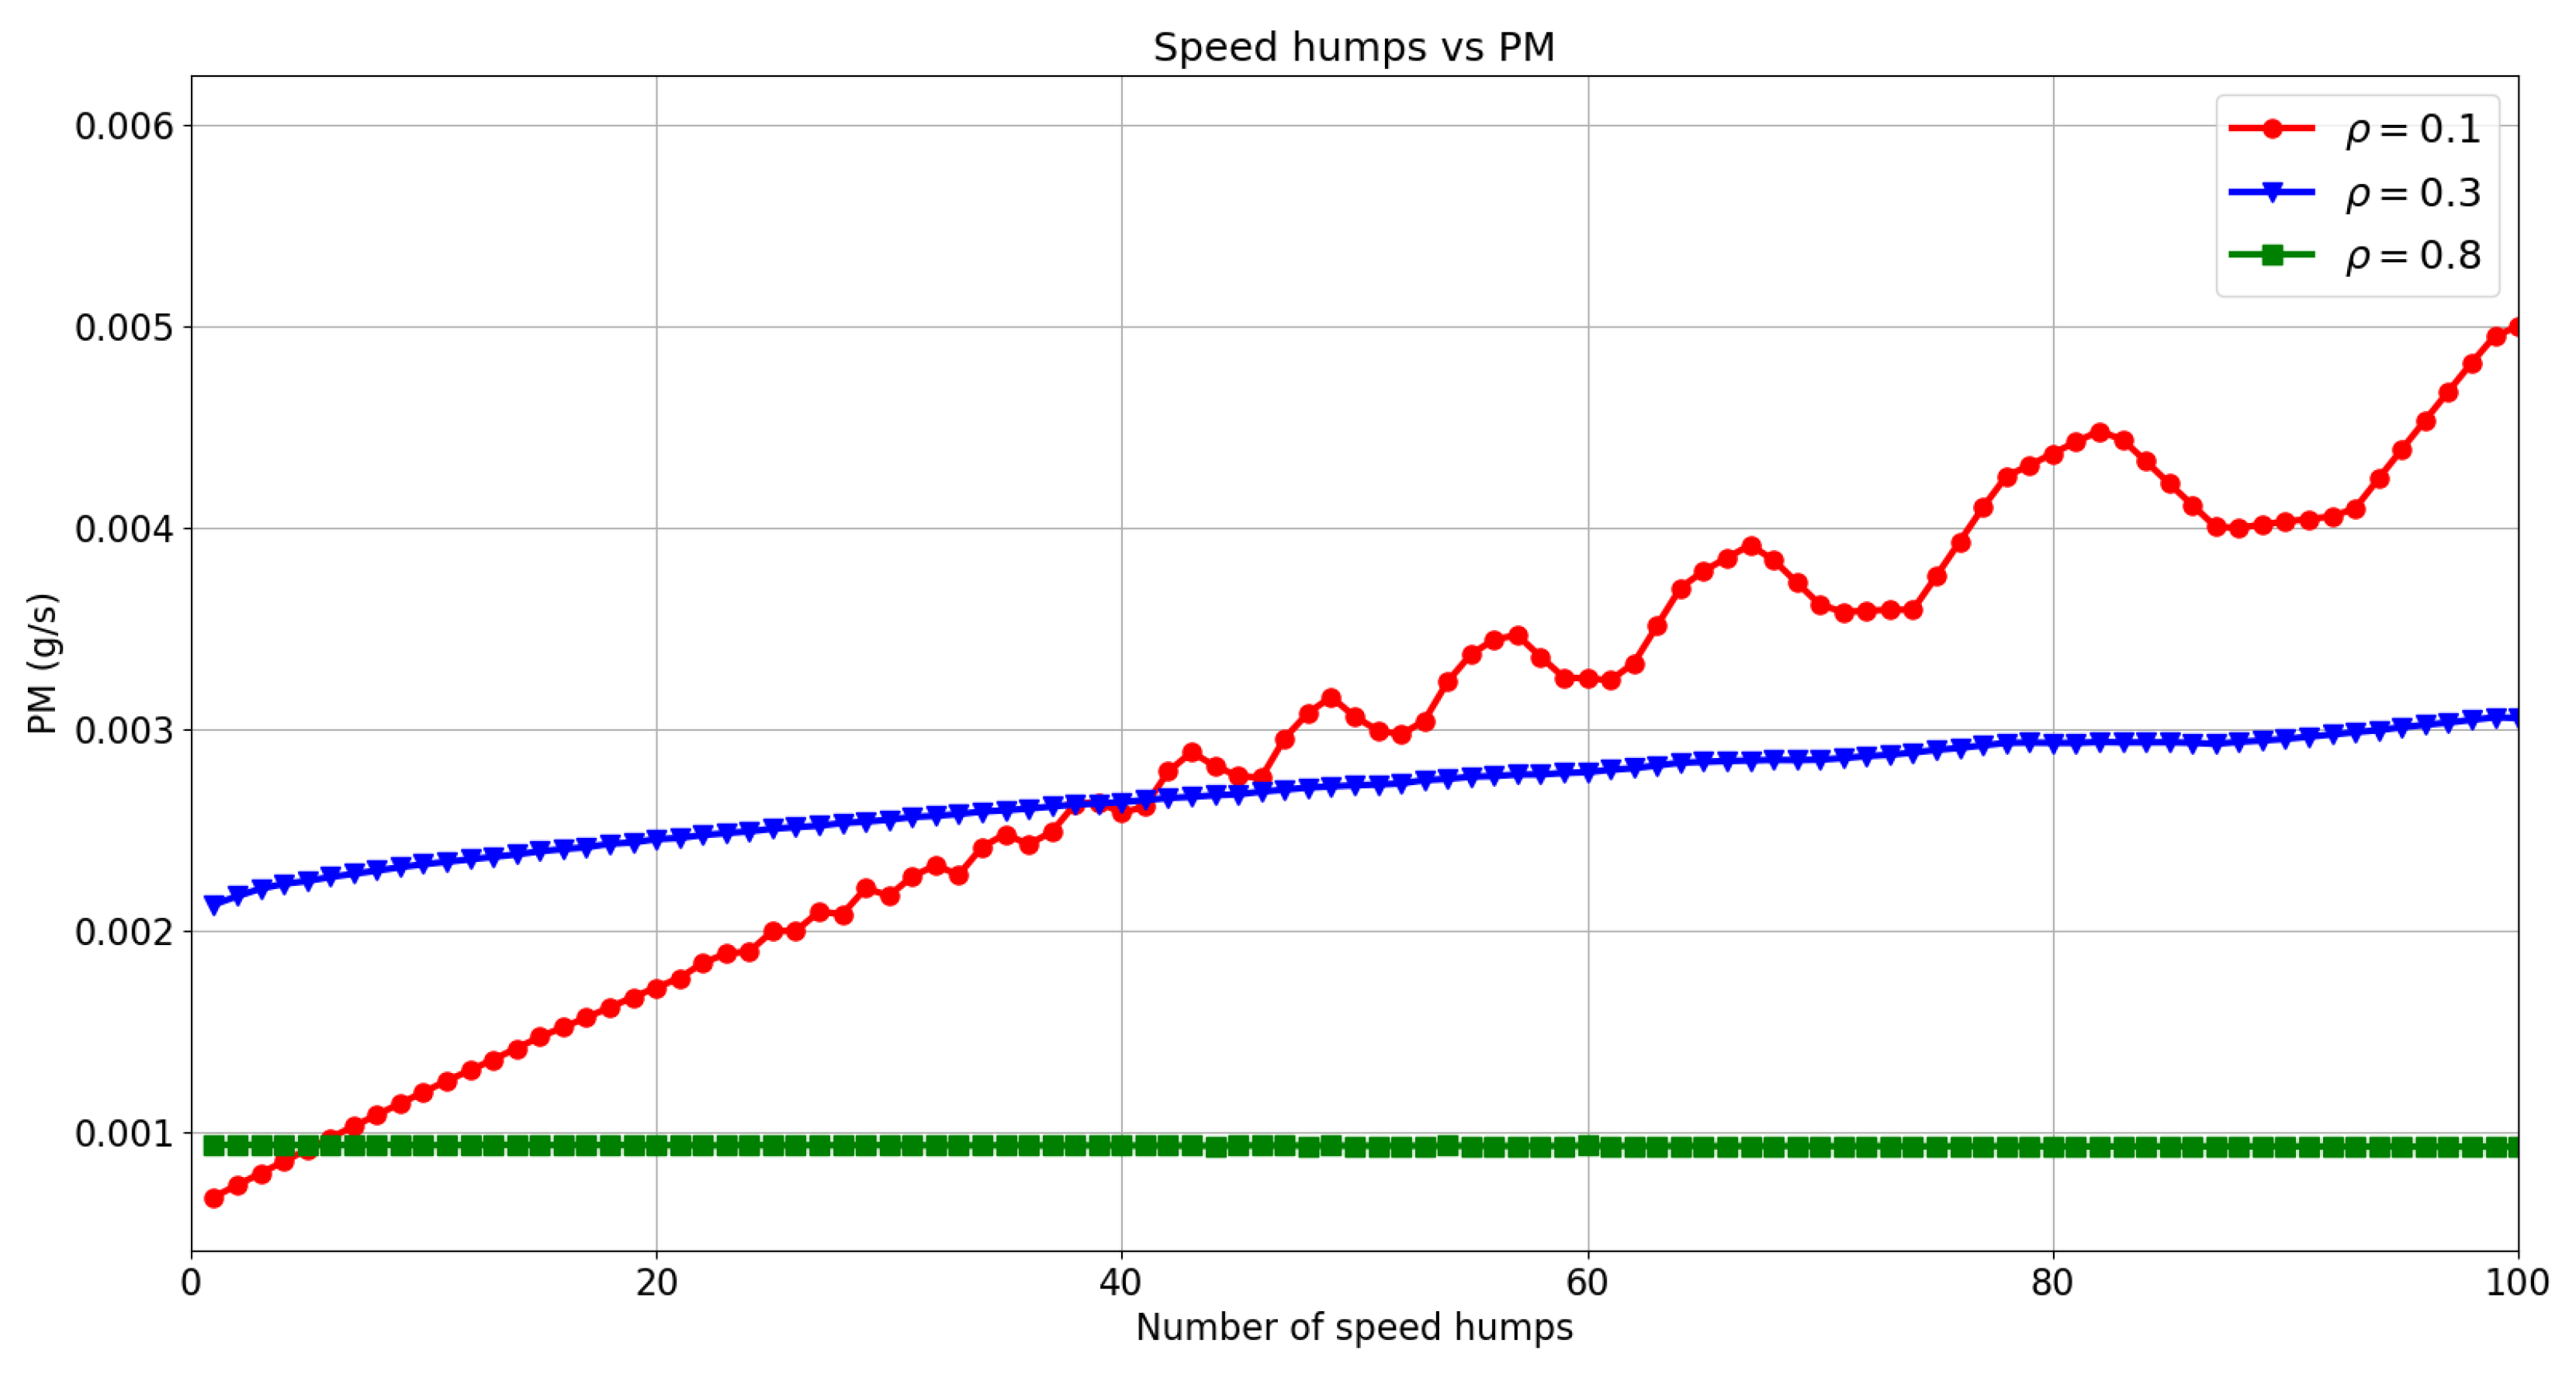
We also performed simulations with more than 30 speed humps to study the effect of a large number of speed humps on PM emissions. In Figure 14 we show PM emissions as a function of the number of speed humps for different density values. For ρ = 0.1 we have an upward trend on PM emissions as we increase the number of speed humps on the lane. As in the previous cases, the behavior of the curve is due to the standard deviations observed for velocity, see Table 1. The case with ρ = 0.3 presents a slight increase on PM emissions for a larger number of speed humps, ρ = 0.3 represents the transition phase where the emissions depend on the acceleration and deceleration of vehicles from the interaction with speed humps and with other vehicles on the lane. The case with ρ = 0.8 shows no variations on PM emission values as the number of speed humps grows.
In Figure 14, note that the curve with ρ = 0.1 cross the other curves at a low and a moderate number of speed humps. This suggests that roads with low density of vehicles and a reduced number of speed humps produces the lowest PM emissions. Conversely, as we increase the number of speed humps, a road with low number of vehicles generates more PM emissions than a highly occupied road ( ρ = 0.8 ). Additionally, with more than 40 speed humps, the road with low density of vehicles generates more PM emissions than a road with medium density ( ρ = 0.3 ).
The previous results suggest that speed humps influence the generation of PM emissions for low density of vehicles but have no considerable impact for large densities. Moreover, a road with very low density but with a large number of speed humps produces more PM emissions than roads with higher densities.

5. Conclusions

We presented results on the negative effect of speed humps on instantaneous traffic emissions on a single lane. We used a modified version of the NaSch model and an instantaneous traffic emissions model to study the effect of speed humps on traffic emissions. The microscopic approach followed in our study allow us to characterize the effect of a large number of speed humps on roads, and neglect external effects (traffic lights, pedestrian crossings and intersections). Our results take into account decelerations of vehicles due to the presence of speed humps. This would be extremely difficult to perform on real traffic scenarios. On the one hand due to the large number of external factors that may introduce variations on measurements such as driver’s behavior, number of monitored vehicles, large variability on vehicles types, weather conditions and road conditions. On the other hand, the limitations on the specialized measurement equipment would introduce constraints on the distance between speed humps, type and number of monitored vehicles.
Besides, the reported absolute emission values should be considered to be peak values since the models used in our study do not consider weather effects such as wind that may reduce the concentration of pollutants at a given area.
The main findings of this work are that for P = 0.1 and density of vehicles in the range 0 < ρ 0.48 there is a strong to middle influence of speed humps on the generation of CO 2 , NO x and PM emissions. The peak on emissions for CO 2 , NO x and PM is reached at the transition phase ( 0.12 < ρ 0.48 , between free flow and the congestion phase), where the average speed of vehicles is about 20 km/h. Additionally, we found that a road with a low density of vehicles and just a few speed humps may generate more pollutants than a highly occupied road. Regarding VOC emissions, the experiments shown very low influence of speed humps either for low or high densities.
Other findings are summarized as follows:
  • There are at least three phases for traffic flow and pollutants emissions as a function of density, these phases are in the range: 0 < ρ 0.12 for the first phase, 0.12 < ρ 0.48 for the second phase, and 0.48 < ρ 1 for the third phase.
  • For low density of vehicles, the rise on CO 2 , NO x and PM emissions as we increase the number of speed humps on a lane provides evidence of the influence of speed humps on traffic emissions. We also found that slight variations on the position and distance between speed humps influence the generation of pollutants at low densities.
  • For high density of vehicles, the impact of speed humps on average velocity and traffic flow may be ignored because most of the vehicles are not moving due to traffic jams.
Our findings reveal that for roads with a low number of vehicles, speed humps highly increase CO 2 , NO x and PM emissions. Moreover, their overuse has a dramatic impact on the generation of those pollutants. Urban planners and traffic managers can use our results to evaluate the feasibility of speed humps deployment (quantity) since the determined pollution effect has considered both velocity bounds and fluctuations, involved in acceleration and deceleration dynamics.
Ongoing research is focused on the effect of multiple vehicles types on instantaneous traffic emissions. Further studies will consider the generation of pollutants as a function of the position and distance between speed humps. We will also consider the effect of driver’s behavior and different speed regulation strategies such as traffic lights, pedestrian crossings and speed limit areas on the generation of free pollutants.

Author Contributions

Conceptualization, J.C.P.-S., N.L., J.G.-D. and S.E.P.H.; Investigation, J.C.P.-S., N.L., J.G.-D. and S.E.P.H.; Methodology, J.C.P.-S. and N.L.; Software, J.C.P.-S. and N.L.; Validation, J.C.P.-S. and N.L.; Writing—original draft, J.C.P.-S., N.L., J.G.-D. and S.E.P.H.; Writing—review & editing, J.C.P.-S., N.L., J.G.-D. and S.E.P.H. All authors have read and agree to the published version of the manuscript.

Funding

This research received no external funding.

Acknowledgments

The authors thankfully acknowledge computer resources, technical advice and support provided by Laboratorio Nacional de Supercómputo del Sureste de México (LNS), a member of the CONACYT network of national laboratories. The authors also thankfully acknowledge to the anonymous reviewers whose comments have helped us to enhance our work.

Conflicts of Interest

The authors declare no conflict of interest.

References

  1. Zhang, K.; Batterman, S.; Dion, F. Vehicle emissions in congestion: Comparison of work zone, rush hour and free-flow conditions. Atmos. Environ. 2011, 45, 1929–1939. [Google Scholar] [CrossRef]
  2. Zhang, K.; Batterman, S. Air pollution and health risks due to vehicle traffic. Sci. Total Environ. 2013, 450–451, 307–316. [Google Scholar] [CrossRef] [PubMed] [Green Version]
  3. Novi, C.D. The indirect effect of fine particulate matter on health through individuals’ life-style. J. Socio-Econ. 2013, 44, 27–36. [Google Scholar] [CrossRef] [Green Version]
  4. Deng, C.; Jin, Y.; Zhang, M.H.; Liu, X.; Yu, Z. Emission Characteristics of VOCs from On-Road Vehicles in an Urban Tunnel in Eastern China and Predictions for 2017–2026. Aerosol Air Qual. Res. 2018, 18, 3025–3034. [Google Scholar] [CrossRef]
  5. O’Driscoll, R.; ApSimon, H.M.; Oxley, T.; Molden, N.; Stettler, M.E.; Thiyagarajah, A. A Portable Emissions Measurement System (PEMS) study of NOx and primary NO2 emissions from Euro 6 diesel passenger cars and comparison with COPERT emission factors. Atmos. Environ. 2016, 145, 81–91. [Google Scholar] [CrossRef]
  6. Nyhan, M.; Sobolevsky, S.; Kang, C.; Robinson, P.; Corti, A.; Szell, M.; Streets, D.; Lu, Z.; Britter, R.; Barrett, S.R.; et al. Predicting vehicular emissions in high spatial resolution using pervasively measured transportation data and microscopic emissions model. Atmos. Environ. 2016, 140, 352–363. [Google Scholar] [CrossRef]
  7. Harrison, R.M.; Yin, J. Particulate matter in the atmosphere: Which particle properties are important for its effects on health? Sci. Total Environ. 2000, 249, 85–101. [Google Scholar] [CrossRef]
  8. Srimuruganandam, B.; Nagendra, S.M.S. Analysis and interpretation of particulate matter – PM10, PM2.5 and PM1 emissions from the heterogeneous traffic near an urban roadway. Atmos. Pollut. Res. 2010, 1, 184–194. [Google Scholar] [CrossRef] [Green Version]
  9. Baltrėnas, H.P.; Januševičius, T.; Chlebnikovas, A. Research into the impact of speed bumps on particulate matter air pollution. Measurement 2017, 100, 62–67. [Google Scholar] [CrossRef]
  10. Hagenbjörk, A.; Malmqvist, E.; Mattisson, K.; Sommar, N.J.; Modig, L. The spatial variation of O3, NO, NO2 and NOx and the relation between them in two Swedish cities. Environ. Monit. Assess. 2017, 189, 161. [Google Scholar] [CrossRef] [Green Version]
  11. Han, S.; Bian, H.; Feng, Y.; Liu, A.; Li, X.; Zeng, F.; Zhang, X. Analysis of the Relationship between O3, NO and NO2 in Tianjin, China. Aerosol Air Qual. Res. 2011, 11, 128–139. [Google Scholar] [CrossRef] [Green Version]
  12. Astarita, V.; Giofrè, V.P.; Guido, G.; Vitale, A. A Single Intersection Cooperative-Competitive Paradigm in Real Time Traffic Signal Settings Based on Floating Car Data. Energies 2019, 12, 409. [Google Scholar] [CrossRef] [Green Version]
  13. Iodice, P.; Senatore, A. Industrial and Urban Sources in Campania, Italy: The Air Pollution Emission Inventory. Energy Environ. 2015, 26, 1305–1317. [Google Scholar] [CrossRef]
  14. Taghizadeh-Alisaraei, A.; Abbaszadeh-Mayvan, A.; Hosseini, S.H. Bio-ethanol production from a mixture of rice hull and orange peel wastes. Biofuels 2019, 1–5. [Google Scholar] [CrossRef]
  15. de Morais, A.M.; de Morais Hanriot, S.; de Oliveira, A.; Justino, M.A.M.; Valente, O.S.; Sodré, J.R. An assessment of fuel consumption and emissions from a diesel power generator converted to operate with ethanol. Sustain. Energy Technol. Assess. 2019, 35, 291–297. [Google Scholar] [CrossRef]
  16. Park, E.; Lim, J.; Cho, Y. Understanding the Emergence and Social Acceptance of Electric Vehicles as Next-Generation Models for the Automobile Industry. Sustainability 2018, 10, 662. [Google Scholar] [CrossRef] [Green Version]
  17. Baltrėnas, P.; Vaitiekūnas, P.; Mincevič, I. Investigation on the impact of transport exhaust emissions on the air. J. Environ. Eng. Landsc. Manag. 2004, 12, 3–11. [Google Scholar] [CrossRef]
  18. Januševičius, T.; Grubliauskas, R. The effect of speed bumps and humps on the concentrations of CO, NO and NO2 in ambient air. Air Qual. Atmos. Health 2019, 12, 635–642. [Google Scholar] [CrossRef]
  19. Ghafghazi, G.; Hatzopoulou, M. Simulating the air quality impacts of traffic calming schemes in a dense urban neighborhood. Transp. Res. Part D Transp. Environ. 2015, 35, 11–22. [Google Scholar] [CrossRef]
  20. Daham, B.; Andrews, G.E.; Li, H.; Partridge, M.; Bell, M.C.; Tate, J. Quantifying the Effects of Traffic Calming on Emissions Using On-road Measurements. In Proceedings of the SAE 2005 World Congress & Exhibition. SAE International, Detroit, MI, USA, 11–14 April 2005. [Google Scholar] [CrossRef]
  21. Jateikienė, L.; Andriejauskas, T.; Lingytė, I.; Jasiūnienė, V. Impact Assessment of Speed Calming Measures on Road Safety. Transp. Res. Procedia 2016, 14, 4228–4236. [Google Scholar] [CrossRef] [Green Version]
  22. Gonzalo-Orden, H.; Rojo, M.; Pérez-Acebo, H.; Linares, A. Traffic Calming Measures and their Effect on the Variation of Speed. Transp. Res. Procedia 2016, 18, 349–356. [Google Scholar] [CrossRef]
  23. Lee, G.; Joo, S.; Oh, C.; Choi, K. An evaluation framework for traffic calming measures in residential areas. Transp. Res. Part D Transp. Environ. 2013, 25, 68–76. [Google Scholar] [CrossRef]
  24. Salau, T.A.O.; Adeyefa, A.O.; Oke, S.A. Vehicle speed control using road bumps. Transport 2004, 19, 130–136. [Google Scholar] [CrossRef] [Green Version]
  25. Rothman, L.; Macpherson, A.K.; Buliung, R.N.; Macarthur, C.W.P.; To, T.; Larsen, K.G.; Howard, A.W. Installation of Speed Humps and Pedestrian-Motor Vehicle Collisions in Toronto, Canada: A Quasi-Experimental Study; BMC Public Health: London, UK, 2015. [Google Scholar]
  26. Owen, B. Air quality impacts of speed-restriction zones for road traffic. Sci. Total Environ. 2005, 340, 13–22. [Google Scholar] [CrossRef]
  27. Sjödin, Å.; Persson, K.; Andréasson, K.; Arlander, B.; Galle, B.G. On-road emission factors derived from measurements in a traffic tunnel. Int. J. Veh. Des. 1998, 20, 147–158. [Google Scholar] [CrossRef]
  28. Pan, W.; Xue, Y.; He, H.D.; Lu, W.Z. Impacts of traffic congestion on fuel rate, dissipation and particle emission in a single lane based on Nasch Model. Physica A 2018, 503, 154–162. [Google Scholar] [CrossRef]
  29. Iodice, P.; Senatore, A. Evaluation of Dispersion Models for Predicting Carbon Monoxide Concentrations from Motor Vehicles in a Metropolitan Area. Int. Rev. Model. Simul. 2013, 6, 1928–1932. [Google Scholar]
  30. Fellendorf, M.; Vortisch, P. Integrated Modeling of Transport Demand, Route Choice, Traffic Flow and Traffic Emissions. In Proceedings of the Conference: 79th Annual Meeting of the Transportation Research Board, Washington, DC, USA, 9–13 January 2000. [Google Scholar]
  31. United States Environmental Protection. MOVES2014a User Guide; United States Environmental Protection: Washington, DC, USA, 2015.
  32. Barth, M.; Malcolm, C.; Younglove, T.; Hill, N. Recent Validation Efforts for a Comprehensive Modal Emissions Model. Transp. Res. Record 2001, 1750, 13–23. [Google Scholar] [CrossRef] [Green Version]
  33. Berkowicz, R. OSPM—A Parameterised Street Pollution Model. Environ. Monit. Assess. 2000, 65, 323–331. [Google Scholar] [CrossRef]
  34. AASHTO; Transportation Officials. Highway Safety Manual; AASHTO: Washington, DC, USA, 2010; Volume 1. [Google Scholar]
  35. Han, Y.S.; Ko, S.K. Analysis of a cellular automaton model for car traffic with a junction. Theor. Comput. Sci. 2012, 450, 54–67. [Google Scholar] [CrossRef] [Green Version]
  36. Rajeswaran, S.; Rajasekaran, S. Analysis of Single-Lane and Two-Lane Traffic Models by Using Cellular Automata. IJECCE 2012, 4, 1459–1464. [Google Scholar]
  37. Cui, N.; Chen, B.; Zhang, K.; Zhang, Y.; Liu, X.; Zhou, J. Effects of route guidance strategies on traffic emissions in intelligent transportation systems. Physica A 2019, 513, 32–44. [Google Scholar] [CrossRef]
  38. Ma, K.; Wang, H. Influence of Exclusive Lanes for Connected and Autonomous Vehicles on Freeway Traffic Flow. IEEE Access 2019, 7, 50168–50178. [Google Scholar] [CrossRef]
  39. Kerner, B.S. Three-phase traffic theory and highway capacity. Physica A 2004, 333, 379–440. [Google Scholar] [CrossRef] [Green Version]
  40. Nagel, K.; Schreckenberg, M. A cellular automaton model for freeway traffic. J. Phys. I France 1992, 2, 2221–2229. [Google Scholar] [CrossRef]
  41. Arai, K.; Sentinuwo, S.R. Spontaneous-braking and lane-changing effect on traffic congestion using cellular automata model applied to the two-lane traffic. Int. J. Adv. Comput. Sci. Appl. 2012, 3. [Google Scholar] [CrossRef] [Green Version]
  42. Zeng, J.; Yu, S.; Qian, Y.; Feng, X. Expressway traffic flow model study based on different traffic rules. IEEE/CAA J. Autom. Sin. 2018, 5, 1099–1103. [Google Scholar] [CrossRef]
  43. Li, Q.L.; Wong, S.; Min, J.; Tian, S.; Wang, B.H. A cellular automata traffic flow model considering the heterogeneity of acceleration and delay probability. Physica A 2016, 456, 128–134. [Google Scholar] [CrossRef] [Green Version]
  44. Echab, H.; Lakouari, N.; Ez-Zahraouy, H.; Benyoussef, A. Phase diagram of a single lane roundabout. Phys. Lett. A 2016, 380, 992–997. [Google Scholar] [CrossRef]
  45. Lakouari, N.; Ez-Zahraouy, H.; Benyoussef, A. Traffic flow behavior at a single lane roundabout as compared to traffic circle. Phys. Lett. A 2014, 378, 3169–3176. [Google Scholar] [CrossRef]
  46. Lakouari, N.; Oubram, O.; Bassam, A.; Pomares Hernandez, S.E.; Marzoug, R.; Ez-Zahraouy, H. Modeling and simulation of CO2 emissions in roundabout intersection. J. Comput. Sci. 2020, 40. [Google Scholar] [CrossRef]
  47. Meng, J.; Zhang, J.F. The effect of deceleration strips upon traffic flow. Mod. Phys. Lett. B 2006, 20, 835–841. [Google Scholar] [CrossRef]
  48. Li, C.; Guo, H.; Zhang, Y.; Wang, W.; Jiang, X. Simulation for the Impacts of Speed Bumps on Traffic Flow Considering Driving Behaviors’ Diversity. In Proceedings of the CICTP 2016, Shangai, China, 6–9 July 2016. [Google Scholar] [CrossRef]
  49. Zhou, X.; Tanvir, S.; Lei, H.; Taylor, J.; Liu, B.; Rouphail, N.M.; Frey, H.C. Integrating a simplified emission estimation model and mesoscopic dynamic traffic simulator to efficiently evaluate emission impacts of traffic management strategies. Transp. Res. Part D Transp. Environ. 2015, 37, 123–136. [Google Scholar] [CrossRef]
  50. Joumard, R.; Jost, P.; Hickman, J.; Hassel, D. Hot passenger car emissions modelling as a function of instantaneous speed and acceleration. Sci. Total Environ. 1995, 169, 167–174. [Google Scholar] [CrossRef]
  51. Panis, L.I.; Broekx, S.; Liu, R. Modelling instantaneous traffic emission and the influence of traffic speed limits. Sci. Total Environ. 2006, 371, 270–285. [Google Scholar] [CrossRef] [PubMed]
  52. Lenaers, G. Dynamic On-Board Particulate Matter Mass Emissions Measurements. In Transports et pollution de l’air: 9e colloque; Joumard, R., Ed.; INRETS: Arcueli, France, 2000; Volume 2. [Google Scholar]
  53. Grigoratos, T.; Giorgio, M. Non-Exhaust Traffic Related Emissions. Brake and Tyre Wear PM; Publications Office of the European Union: Brussels, Belgium, 2014; pp. 1–53. [CrossRef]
  54. Woodward, H.; Stettler, M.; Pavlidis, D.; Aristodemou, E.; ApSimon, H.; Pain, C. A large eddy simulation of the dispersion of traffic emissions by moving vehicles at an intersection. Atmos. Environ. 2019, 215. [Google Scholar] [CrossRef]
  55. Wang, X.; Xue, Y.; Cen, B.L.; Zhang, P.; di He, H. Study on pollutant emissions of mixed traffic flow in cellular automaton. Physica A 2020, 537, 122686. [Google Scholar] [CrossRef]
  56. Schadschneider, A.; Chowdhury, D.; Nishinari, K. Chapter Seven–Vehicular Traffic II: The Nagel-Schreckenberg Model. In Stochastic Transport in Complex Systems; Schadschneider, A., Chowdhury, D., Nishinari, K., Eds.; Elsevier: Amsterdam, The Netherlands, 2011; pp. 243–279. [Google Scholar]
  57. Bento, A.; Roth, K.; Zou, Y. Vehicle Lifetime Trends and Scrappage Behavior in the U.S. Used Car Market; Technical report; Sol Price School of Public Policy and Department of Economics: Los Angeles, CA, USA, 2016. [Google Scholar]
  58. Timothy Beirnes, J. Analysis of Fleet Replacement Lifecycle; Technical report; South Florida Water Management District: West Palm Beach, FL, USA, 2012.
  59. Berkowicz, R.; Winther, M.; Ketzel, M. Traffic pollution modelling and emission data. Environ. Model. Softw. 2006, 21, 454–460. [Google Scholar] [CrossRef]
  60. Parry, T. Vehicle Licensing Statistics: Annual 2017 Revised; Technical report; Department for Transport: London, UK, 2018.
  61. Parry, T. Vehicle Licensing Statistics: Annual 2018; Technical report; Department for Transport: London, UK, 2019.
  62. Parry, T. Vehicle Licensing Statistics: 2019 Quarter 3 (Jul–Sep); Technical report; Department for Transport: London, UK, 2019.
  63. Parry, T. Vehicle Licensing Statistics: 2019 Quarter 1 (Jan–Mar); Technical report; Department for Transport: London, UK, 2019.
Figure 1. Speed humps length and height with trapezoidal shape.
Applsci 10 01592 g001
Figure 2. A sketch of the model, where the road is represented by an array of L = 1500 equivalent to a lane of 11.25 km. Here, d n is the spatial-headway and D d is the number of empty cells between a vehicle and the closest speed hump ahead.
Applsci 10 01592 g002
Figure 3. Average velocity as a function of density. The velocity indicates the average number of cells to move forward per simulation step, and the density ρ = N / L .
Applsci 10 01592 g003
Figure 4. Flow J as a function of density. The flow is given as the average number of vehicles passing through a cell per simulation step, and the density ρ = N / L .
Applsci 10 01592 g004
Figure 5. Flow and velocity as a function of speed humps. The flow is given as the average number of vehicles passing through a cell per simulation step, and the velocity indicates the average number of cells to move forward per simulation step.
Applsci 10 01592 g005
Figure 6. Time–space diagrams and different densities of vehicles.
Applsci 10 01592 g006aApplsci 10 01592 g006b
Figure 7. CO 2 instant emissions as a function of density.
Applsci 10 01592 g007
Figure 8. CO 2 instant emissions as a function of the number of speed humps.
Applsci 10 01592 g008
Figure 9. NO x instant emissions as a function of density.
Applsci 10 01592 g009
Figure 10. NO x instant emissions as a function of the number of speed humps.
Applsci 10 01592 g010
Figure 11. VOC instant emissions as a function of density.
Applsci 10 01592 g011
Figure 12. VOC instant emissions as a function of the number of speed humps.
Applsci 10 01592 g012
Figure 13. PM instant emissions as a function of density.
Applsci 10 01592 g013
Figure 14. PM instant emissions as a function of the number of speed humps.
Applsci 10 01592 g014
Table 1. Standard deviation for velocity and a selected number of speed humps (sh).
Density ρ 3 sh61 sh66 sh71 sh
0.10.5901.2271.2611.216
Table 2. Emission functions values; a is the acceleration of a vehicle; selected and reproduced from [51].
PollutantVehicle Type E 0 f 1 f 2 f 3 f 4 f 5 f 6
CO 2 Petrol car05.53 × 10 1 1.61 × 10 1 −2.89 × 10 3 2.66 × 10 1 5.11 × 10 1 1.83 × 10 1
NO x Petrol car ( a 0.5 m/s 2 )06.19 × 10 4 8.00 × 10 5 −4.03 × 10 6 −4.13 × 10 4 3.80 × 10 4 1.77 × 10 4
NO x Petrol car ( a < 0.5 m/s 2 )02.17 × 10 4 00000
VOCPetrol car ( a 0.5 m/s 2 )04.47 × 10 3 7.32 × 10 7 −2.87 × 10 8 −3.41 × 10 6 4.94 × 10 6 1.66 × 10 6
VOCPetrol car ( a < 0.5 m/s 2 )02.63 × 10 3 00000
PMPetrol car001.57 × 10 5 −9.21 × 10 7 03.75 × 10 5 1.89 × 10 5