Article

Permeability Evaluation of Clay-quartz Mixtures Based on Low-Field NMR and Fractal Analysis

Key Laboratory for Special Area Highway Engineering of Ministry of Education, Chang’an University, Xi’an 710064, China
*
Author to whom correspondence should be addressed.
Appl. Sci. 2020, 10(5), 1585; https://doi.org/10.3390/app10051585
Submission received: 18 January 2020 / Revised: 16 February 2020 / Accepted: 24 February 2020 / Published: 27 February 2020
(This article belongs to the Special Issue Applications of Low Field Magnetic Resonance)

Abstract

:
Nuclear magnetic resonance (NMR) technology has been widely used for predicting permeability coefficients of porous medium, such as shales, sandstones, and coals. However, there have been limited studies on the prediction model of clay-quartz mixtures based on NMR technology. In this study, evaporation tests at 40 °C and NMR tests were simultaneously performed on eight clay-quartz mixtures with different mineral compositions. The results show that during the evaporation process, the decay rate of T2 total signal amplitudes was constant at first, and then decreased to 0 after a period of time. Based on the decay rate, the evaporation process was divided into two stages: the constant rate stage and the falling rate stage. Based on the two stages, the T2 cut-offs of eight mixtures were determined. The water in the mixture was divided into two parts by the T2 cut-off: the free water and the bound water. The prediction model of permeability coefficients of clay-quartz mixtures was established based on the Timur-Coates model. In order to simplify the process of predicting the permeability coefficient, fractal analysis was used to develop the relationship between the T2 cut-off and fractal dimension of the T2 spectrum of saturated mixture. A simplified method for predicting permeability coefficients of clay-quartz mixtures based on NMR technology without centrifugal and evaporation experiments was also proposed.

1. Introduction

To protect the environment surrounding waste landfill sites, especially nuclear waste landfill sites, the landfill site needs to be isolated from its surroundings by a barrier made of low-permeability materials [1]. Expansive clays such as montmorillonite and kaolinite are materials commonly used to make barriers because of their low permeability coefficient [2,3,4]. The permeability coefficients of montmorillonite and kaolinite are in the range of 10−11 to 10−12 m/s [5]. Nevertheless, there is one unavoidable shortcoming in using these two materials. Both montmorillonite and kaolinite are sensitive to water, especially montmorillonite. When the moisture content of clay changes, the strength and volume of clay also change sharply. In particular, the dehydration of clay always causes shrinkage cracks, which could damage the integrity of the barrier [6,7,8]. Many studies have shown that adding quartz to clay can solve this problem. The addition of quartz can reduce the water sensitivity and enhance the strength of clay while maintaining a low permeability coefficient [9,10,11]. Clay-quartz mixtures are suitable materials for building barriers of waste landfill sites.
The traditional method used to determine permeability coefficients of clay-quartz mixtures is the variable head permeability test. Because of the low permeability coefficients of clay-quartz mixtures, the variable head permeability test is effort- and time-consuming. Many scholars use consolidation test data to calculate the permeability coefficients of mixtures based on Terzaghi’s one-dimensional consolidation theory [9,12]. This method is also time-consuming and there is a considerable gap between the measured and predicted permeability coefficients. It is therefore necessary to establish a simple, nondestructive, and accurate method for determining the permeability coefficients of clay-quartz mixtures.
As a fast, convenient, and nondestructive tool, nuclear magnetic resonance (NMR) technology has been widely used in petroleum engineering, coal engineering, and geological engineering [13]. The transverse relaxation time (T2) distribution can reflect the pore characteristics of porous media [14,15,16]. Previous studies have proposed prediction models of permeability coefficients for sandstones, coals, and shales based on NMR technology [17,18,19,20]. These models were proposed based on the Schlumberger Doll Research model (SDR model) and Timur-Coates model (TC model) [21,22,23]. Almost no studies have been performed to confirm the applicability of these two models in predicting the permeability coefficients of clay-quartz mixtures with different mineral compositions.
In the TC model, which is also called the free fluid model, the volumes of free water and bound water in porous media are used to predict the permeability coefficient. In the T2 spectrum, the T2 cut-off is used to discriminate between the free water and the bound water. The traditional method for determining T2 cut-offs of sandstones, coals, and shales is the centrifugal method [24,25,26]. It has been verified by experiments that there are two problems in applying this method to clay-quartz mixtures: (1) Compared with sandstones, coals, and shales, clay-quartz mixtures have a lower strength, so they might be damaged during centrifugation, and (2) the pore size of the mixture is very small, so little water can be removed by centrifuging at the maximum centrifugal velocity. Some scholars have calculated T2 cut-offs of shales based on the evaporation tests at increasing temperatures [27,28,29]. According to Tang, most water in clayey soil evaporates, even at room temperature [30,31]. It is unreasonable to determine the T2 cut-off directly by an evaporation test at increasing temperatures. An improved method based on evaporation tests to determine T2 cut-offs of clay-quartz mixtures needs to be proposed.
To simplify the determination process of the T2 cut-off, previous studies have proposed several models to predict the T2 cut-offs of sandstones, shales, and coals. In these methods, fractal analysis was verified to be a useful tool for predicting the T2 cut-offs of sandstones, shales, and coals [25,32,33,34,35,36,37]. Fractal analysis has also become a commonly used method for evaluating the particle and pore distribution characteristics of soil [38,39,40,41]. Nevertheless, almost no studies have established the relationship between the fractal dimension and T2 cut-off because of the complex structure and pore characteristics of clay-quartz mixtures.
In this study, evaporation tests at 40 °C and NMR tests were performed on eight clay-quartz mixtures with different mineral compositions. The water in the mixtures was divided into two parts, according to the different decay rates of the T2 total signal amplitude during evaporation. A prediction model for the permeability coefficients of clay-quartz mixtures was proposed based on the TC model. We also established a method for determining the T2 cut-offs of mixtures by combining the NMR tests and fractal analysis. Based on the prediction model and novel method for determination of the T2 cut-off, a simplified method for determining the permeability coefficients of clay-quartz mixtures without centrifugal and evaporation tests was established.

2. Materials and Methods

2.1. Theoretical Basis
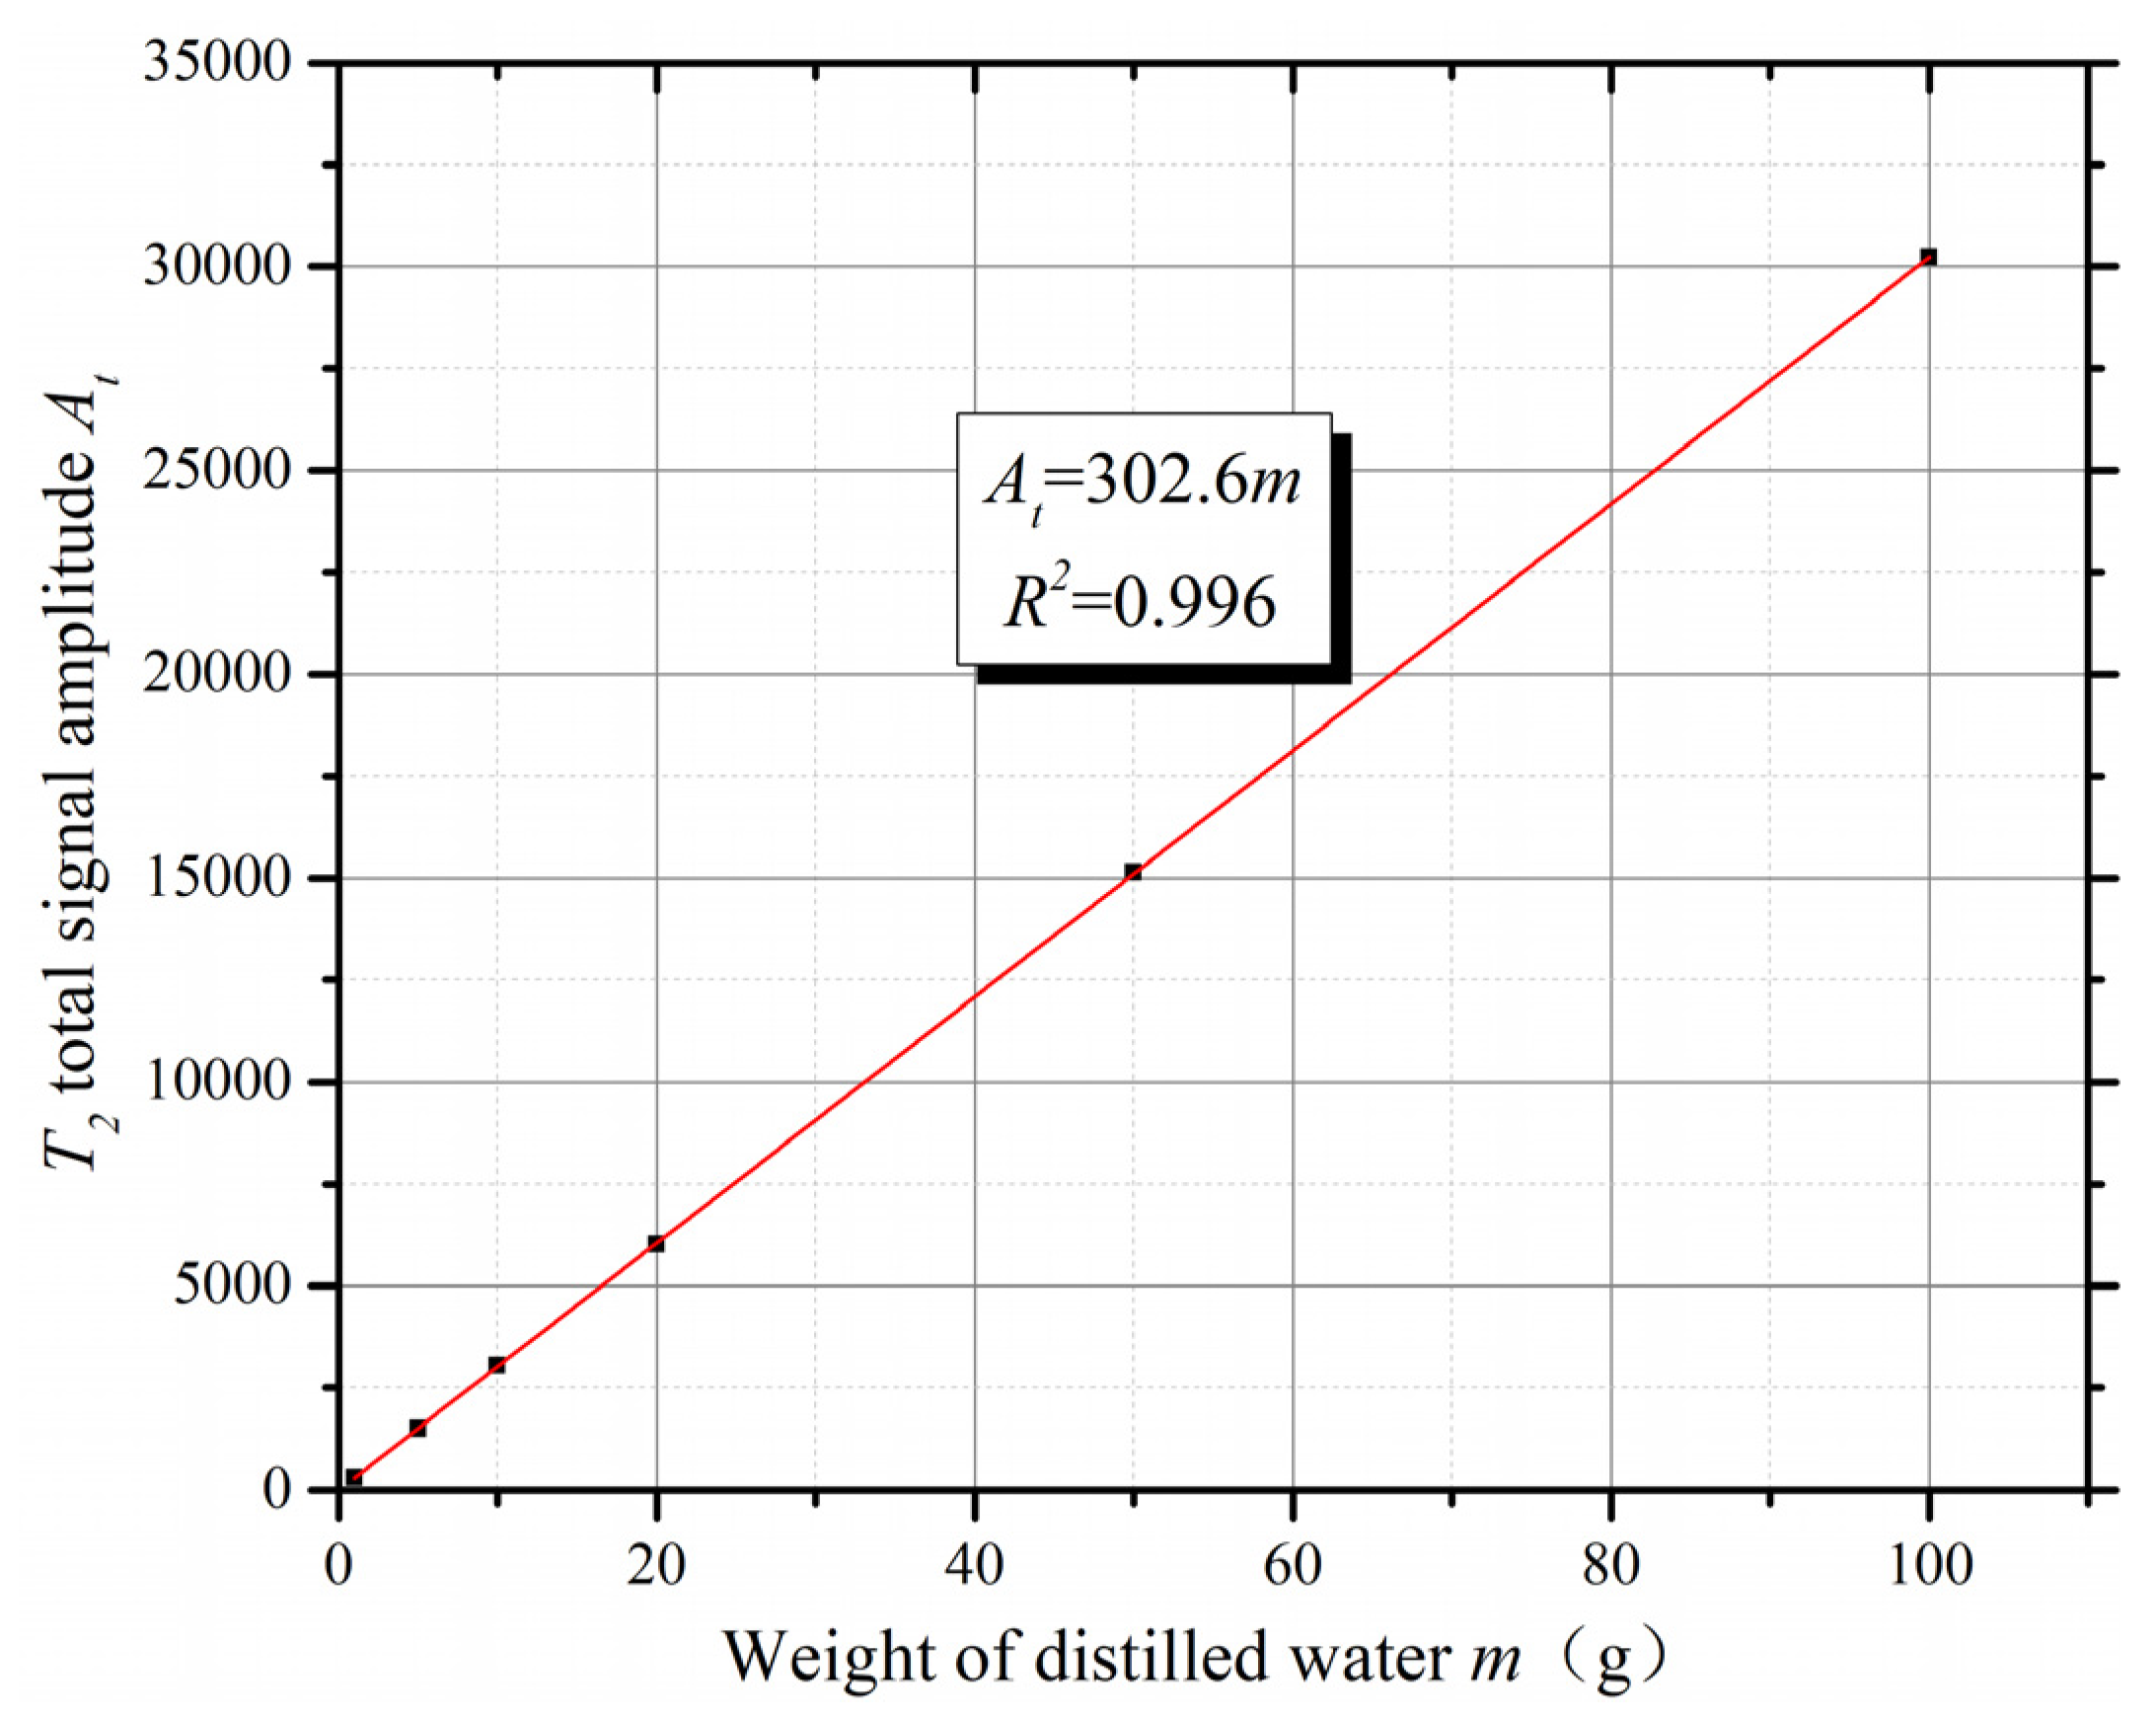
2.1.1. NMR Theory

According to the NMR relaxation mechanism, transverse relaxation consists of three parts: bulk relaxation, surface relaxation, and diffusion relaxation [21]:
1 T 2 = 1 T 2 B + 1 T 2 S + 1 T 2 D
T 2 D = C m d ( γ G T E ) 12
where T2 is the transverse relaxation time, T2B is the transverse bulk relaxation time, T2S is the transverse surface relaxation time, T2D is the transverse diffusion relaxation time, Cmd is the molecular diffusion coefficient, G is the gyromagnetic ratio of a proton, and TE is the inter-echo spacing. When the magnetic field is uniform (G is very small) and TE is short enough, the T2D can be ignored. For porous media saturated with distilled water, the T2B is much bigger than T2S, and the 1/T2B is also usually negligible. Equation (1) can be simplified as follows [13,42,43]:
1 T 2 = 1 T 2 S C r ( S V ) = F s C r r c
where Cr is the relaxation coefficient which is mainly affected by the mineral composition and surface properties of clay mineral, S is the surface area of pores, V is the volume of pores, rc is the diameter of pores, and Fs is the geometric shape factor (3 for spherical pores and 2 for columnar pores) [44].

2.1.2. Fractal Theory
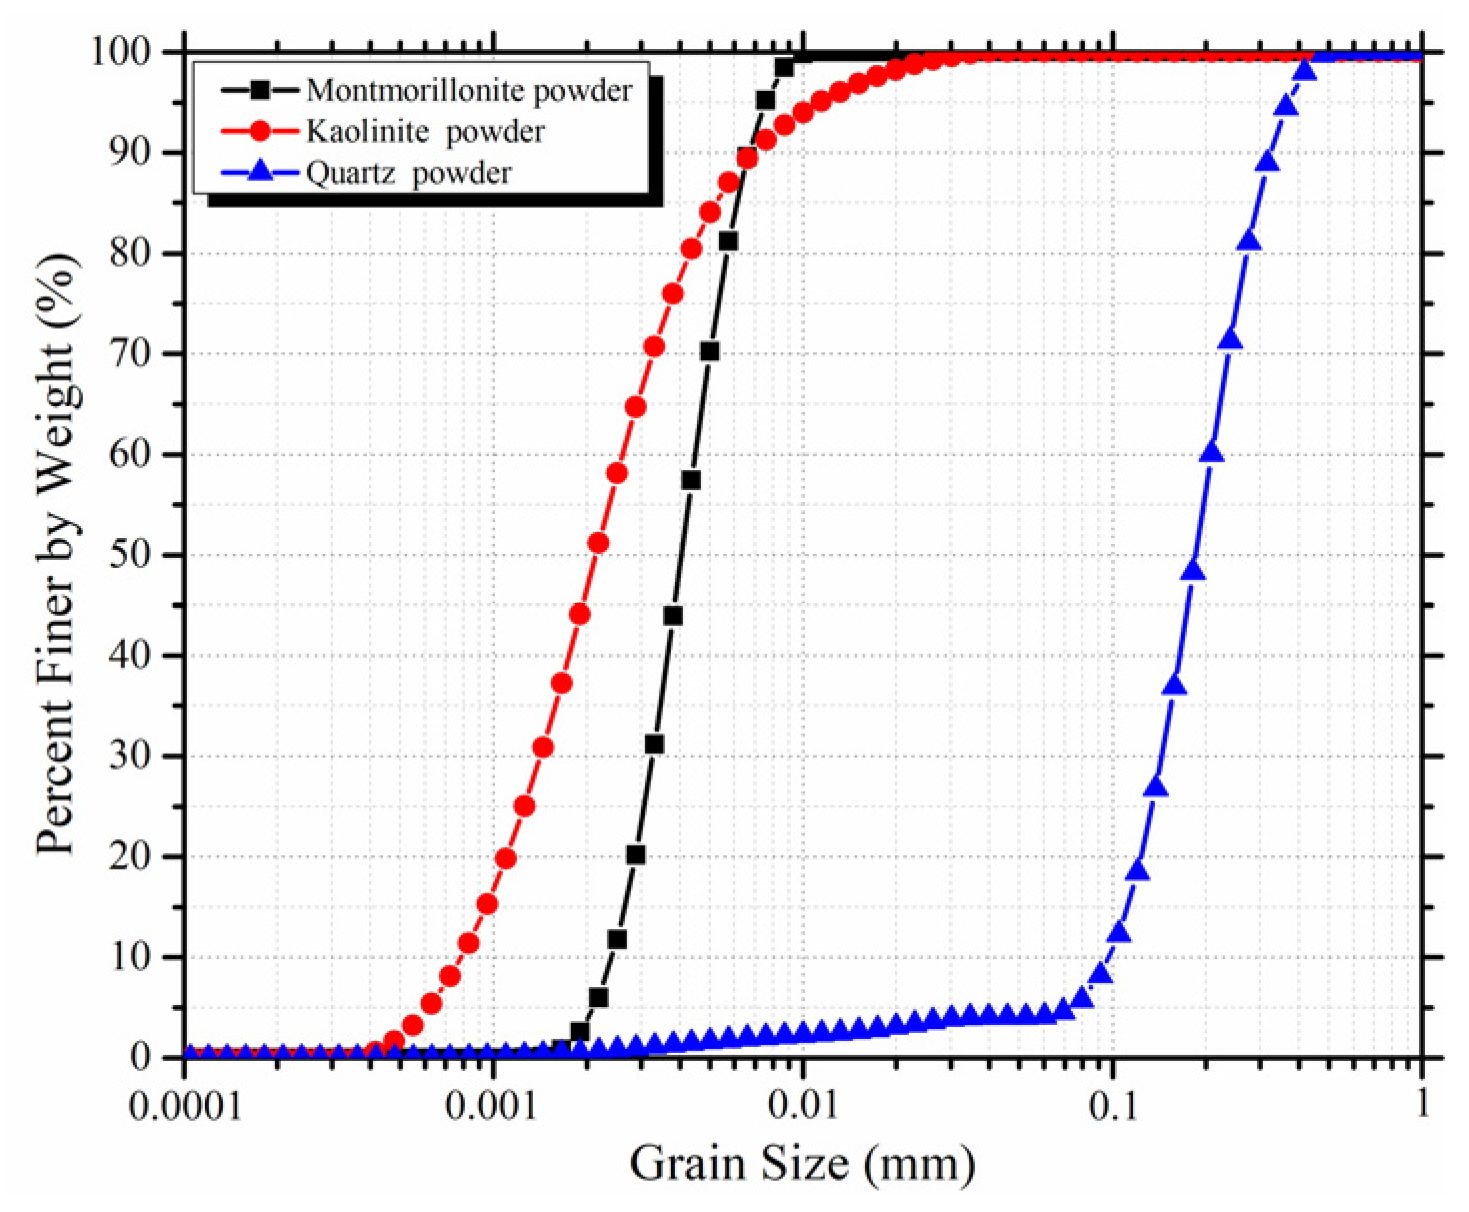
According to previous studies, the fractal dimension can be calculated by Equation (4) [45,46,47,48]. The present fractal dimension can be applied to evaluate the pore characteristics of geomaterials such as rock and soil. According to [45,46,47,48], it was testified that the fractal behavior of a pore-size distribution of clayey soil suits the fractal model. All of the eight clay-quartz mixtures in this study can be classified as clayey soil:
V ( > r ) = V a [ 1 ( r L ) 3 D ]
where V(>r) is the cumulative volume of pores with a size bigger than r, Va is the total volume of the mixture, and L is the range of the pore size distribution. L can be expressed by Equation (5):
L = r max r min
where rmax is the maximum pore size and rmin is the minimum pore size. Based on Equation (3), Equations (4) and (5) can be converted into one Equation, as follows:
V a V ( > r ) = V a ( T 2 max T 2 min ) 3 D ( T 2 ) 3 D
where T2max is the maximum transverse relaxation time and T2min is the minimum transverse relaxation time. The porosity of the mixture was defined as
φ = V v V a
where Vv is the cumulative volume of pores. Va is assumed to be 1, and the cumulative volume of pores with a size smaller than r and equal to r can be expressed by
V ( r ) = φ V ( > r )
Based on Equation (8), Equation (6) can be revised as
1 φ + V ( r ) = 1 ( T 2 max T 2 min ) 3 D ( T 2 ) 3 D
When logarithms are used in Equation (9), Equation (9) is converted into Equation (10):
lg [ 1 φ + V ( r ) ] = ( 3 D ) lg T 2 + ( D 3 ) lg ( T 2 max T 2 min )
The value of D can be determined from the curve of [1 − φ + V(≤r)] versus T2 in the double logarithmic plot. The relationship between D and the slope of this curve can be expressed as follows:
D = 3 H
where H is the slope of the curve of lg[1 − φ + V(≤r)] versus lg(T2).
It is noteworthy that the present fractal dimension is treated for space. This fractal model was established based on the pore size distribution of the soil. According to Equation (3), the transverse relaxation time (T2) is proportional to the pore size (rc). Therefore, the fractal dimension can be determined by the T2 spectrum from the result of the NMR test.

2.2. Materials

The mineral powders used in this study were montmorillonite, kaolinite, and quartz. These three kinds of mineral powders were bought from Guangzhou Jialiang Mineral Products Co., Ltd. (Guangzhou, China); Guangzhou Yifeng Chemical Technology Co., Ltd. (Guangzhou, China); and Inner Mongolia Ningcheng Tianyu Chemical Co., Ltd. (Chifeng, China), respectively. The grain size distributions of these three kinds of mineral powders were measured by the Mastersizer 2000 laser particle analyzer. The grain size distributions of the three mineral powders are shown in Figure 1. The maximum particle sizes of the montmorillonite, kaolinite, and quartz were 0.01, 0.04, and 0.55 mm, respectively. The clay (<0.005 mm), silt (0.005–0.075 mm), and sand (>0.075 mm) contents of the three kinds of mineral powders are shown in Table 1. Particles finer than 0.005 mm in montmorillonite, kaolinite, and quartz represented 70.23%, 84.10%, and 1.63% of the samples, respectively. Additionally, 15.9%, 29.77%, and 4.15% of the particles in the montmorillonite, kaolinite, and quartz were between 0.005 and 0.0075 mm. Only the quartz had particles bigger than 0.075 mm; 94.22% of the particles in the quartz were bigger than 0.075 mm.
Table 1 presents the basic properties of the quartz, kaolinite, and montmorillonite used in this study. The Atterberg limits were measured by the method presented in ASTM D4318. The plastic limit, liquid limit, and plasticity index of the kaolinite were 32.00%, 68.99%, and 36.99%, respectively. The plastic limit, liquid limit, and plasticity index of the montmorillonite were 61.34%, 178.65%, and 117.31%, respectively. According to ASTM D2487, the kaolinite and montmorillonite used in this study can be classified as high plastic clay (CH). The chemical compositions of minerals were determined by the X-ray fluorescence method. The main chemical composition of quartz used in this study was SiO2, and its proportion was 98.85%. The montmorillonite used in this study was mainly composed of SiO2, Al2O3, Fe2O3, CaO, and MgO. The proportions of these chemical compositions were 62.76%, 17.13%, 8.46%, 5.80%, and 4.49%, respectively. The main chemical compositions of kaolinite were SiO2, Al2O3, K2O, and Fe2O3, and the proportions of these chemical compositions were 57.82%, 35.24%, 3.89%, and 1.86%, respectively. According to ASTM D7263, the specific gravity values of quartz, kaolinite, and montmorillonite were determined to be 2.68, 2.76, and 2.61, respectively.
The distilled water used in this study had a pH of 6.7 and the electrical conductivity of the distilled water was below 1 ms/m.

2.3. Sample Preparation

All the mineral powders were dried in an oven at 250 °C to constant weight for 24 h. In this procedure, almost all of the water was removed. Then, the mineral powders were mixed at the fixed proportions based on the dry weight. Eight clay-quartz mixtures were prepared in the laboratory. All the mixtures consisted of montmorillonite and quartz or kaolinite and quartz. The clay mineral (montmorillonite or kaolinite) contents in the mixtures increased from 40% to 100% with the increment of 20%. The mixtures were named after the kind of clay mineral and clay mineral content. As an example, K60 consisted of kaolinite and quartz and the kaolinite fraction was 60%. Next, distilled water was added to the mixtures until the moisture content reached the plastic limit. Afterward, all the eight mixtures were put into plastic sealing bags for two days to reach a full hydration state. Following the hydration period, the mixtures were put into the hollow cylinder with the inner diameter and height of 31.9 mm and 80 mm respectively, and a jack was used to shape the mixtures under static pressure. All the formed mixtures had reached the maximum dry density at the plastic limit. Finally, all the mixtures were saturated with distilled water by the vacuum method. The mixtures were taken out from distilled water once the weight has reached maximum limit. NMR and evaporation tests were carried out on the eight mixtures after surface water was erased.

2.4. Methods

The NMR instrument used in this study was the MesoMR12-150H-I NMR analyzer produced by NIUMAG Co., Ltd., Suzhou, China. The magnetic induction, resonant frequency, diameter of coil, and magnetic field temperature were 0.55T, 12 MHZ, 60 mm, and 30 °C, respectively. According to a review [13], the free induction decay (FID) could not be used to determined the value of T2 because of the effect of magnetic field inhomogeneities on NMR signal. The value of T2 measured by FID was less than the actual value. To minimize the effect of magnetic field inhomogeneities on NMR signal, the Carr-Purcell-Meiboom-Gill (CPMG) pulse sequence was used in NMR tests [49,50]. According to literatures [51,52], refocusing flip angle had great influence on the value of T2. When the refocusing angle was π (180°), the T2 estimated from the echo trains was accurate because no longitudinal magnetization was introduced in the transverse plane. So the refocusing angle of CMPG pulse sequence in this study was 180°. The CPMG pulse began with the application of a 90° pulse and followed by a series of 180° pulses. The time interval between application of two 180° pulses were 2τ and the first 180° pulse were applied at a time τ after the 90° pulse. The time τ was equal to half of echo time. The CPMG pulse sequence used in this study was same as that in previously studies [43,53,54,55]. It was testified the CPMG pulse sequence could be used to determine the value of T2 of soil samples. The 90° pulse width, 180° pulse width, and sampling points were set as 20 μs, 30.48 μs, and 208,018, respectively. The sampling frequency ratio, frequency delay, analog gain, and digital gain were set as 200 kHz, 8 μs, 20, and 3, respectively. The repeated sampling waiting time, accumulated sampling times, echo time, and echo number were set as 8000 ms, 4260 μs, and 4000, respectively. The NMR tests were performed on the saturated mixtures. Then, the mixtures were put into an oven at 40 °C to simulate the highest temperature under natural conditions. In the evaporation procedure, the NMR tests were carried out on mixtures per hour. In order to be consistent with the temperature of the magnetic field, mixtures needed to be cooled to 30 °C before each NMR test. After NMR tests, the T2 spectra were obtained automatically by the software provided by NIUMAG Co., Ltd. (Suzhou, China) The inversion software was developed based on inverse Laplace transform [56] and the simultaneous iterative reconstruction technique (SIRT) [57].

3. Results

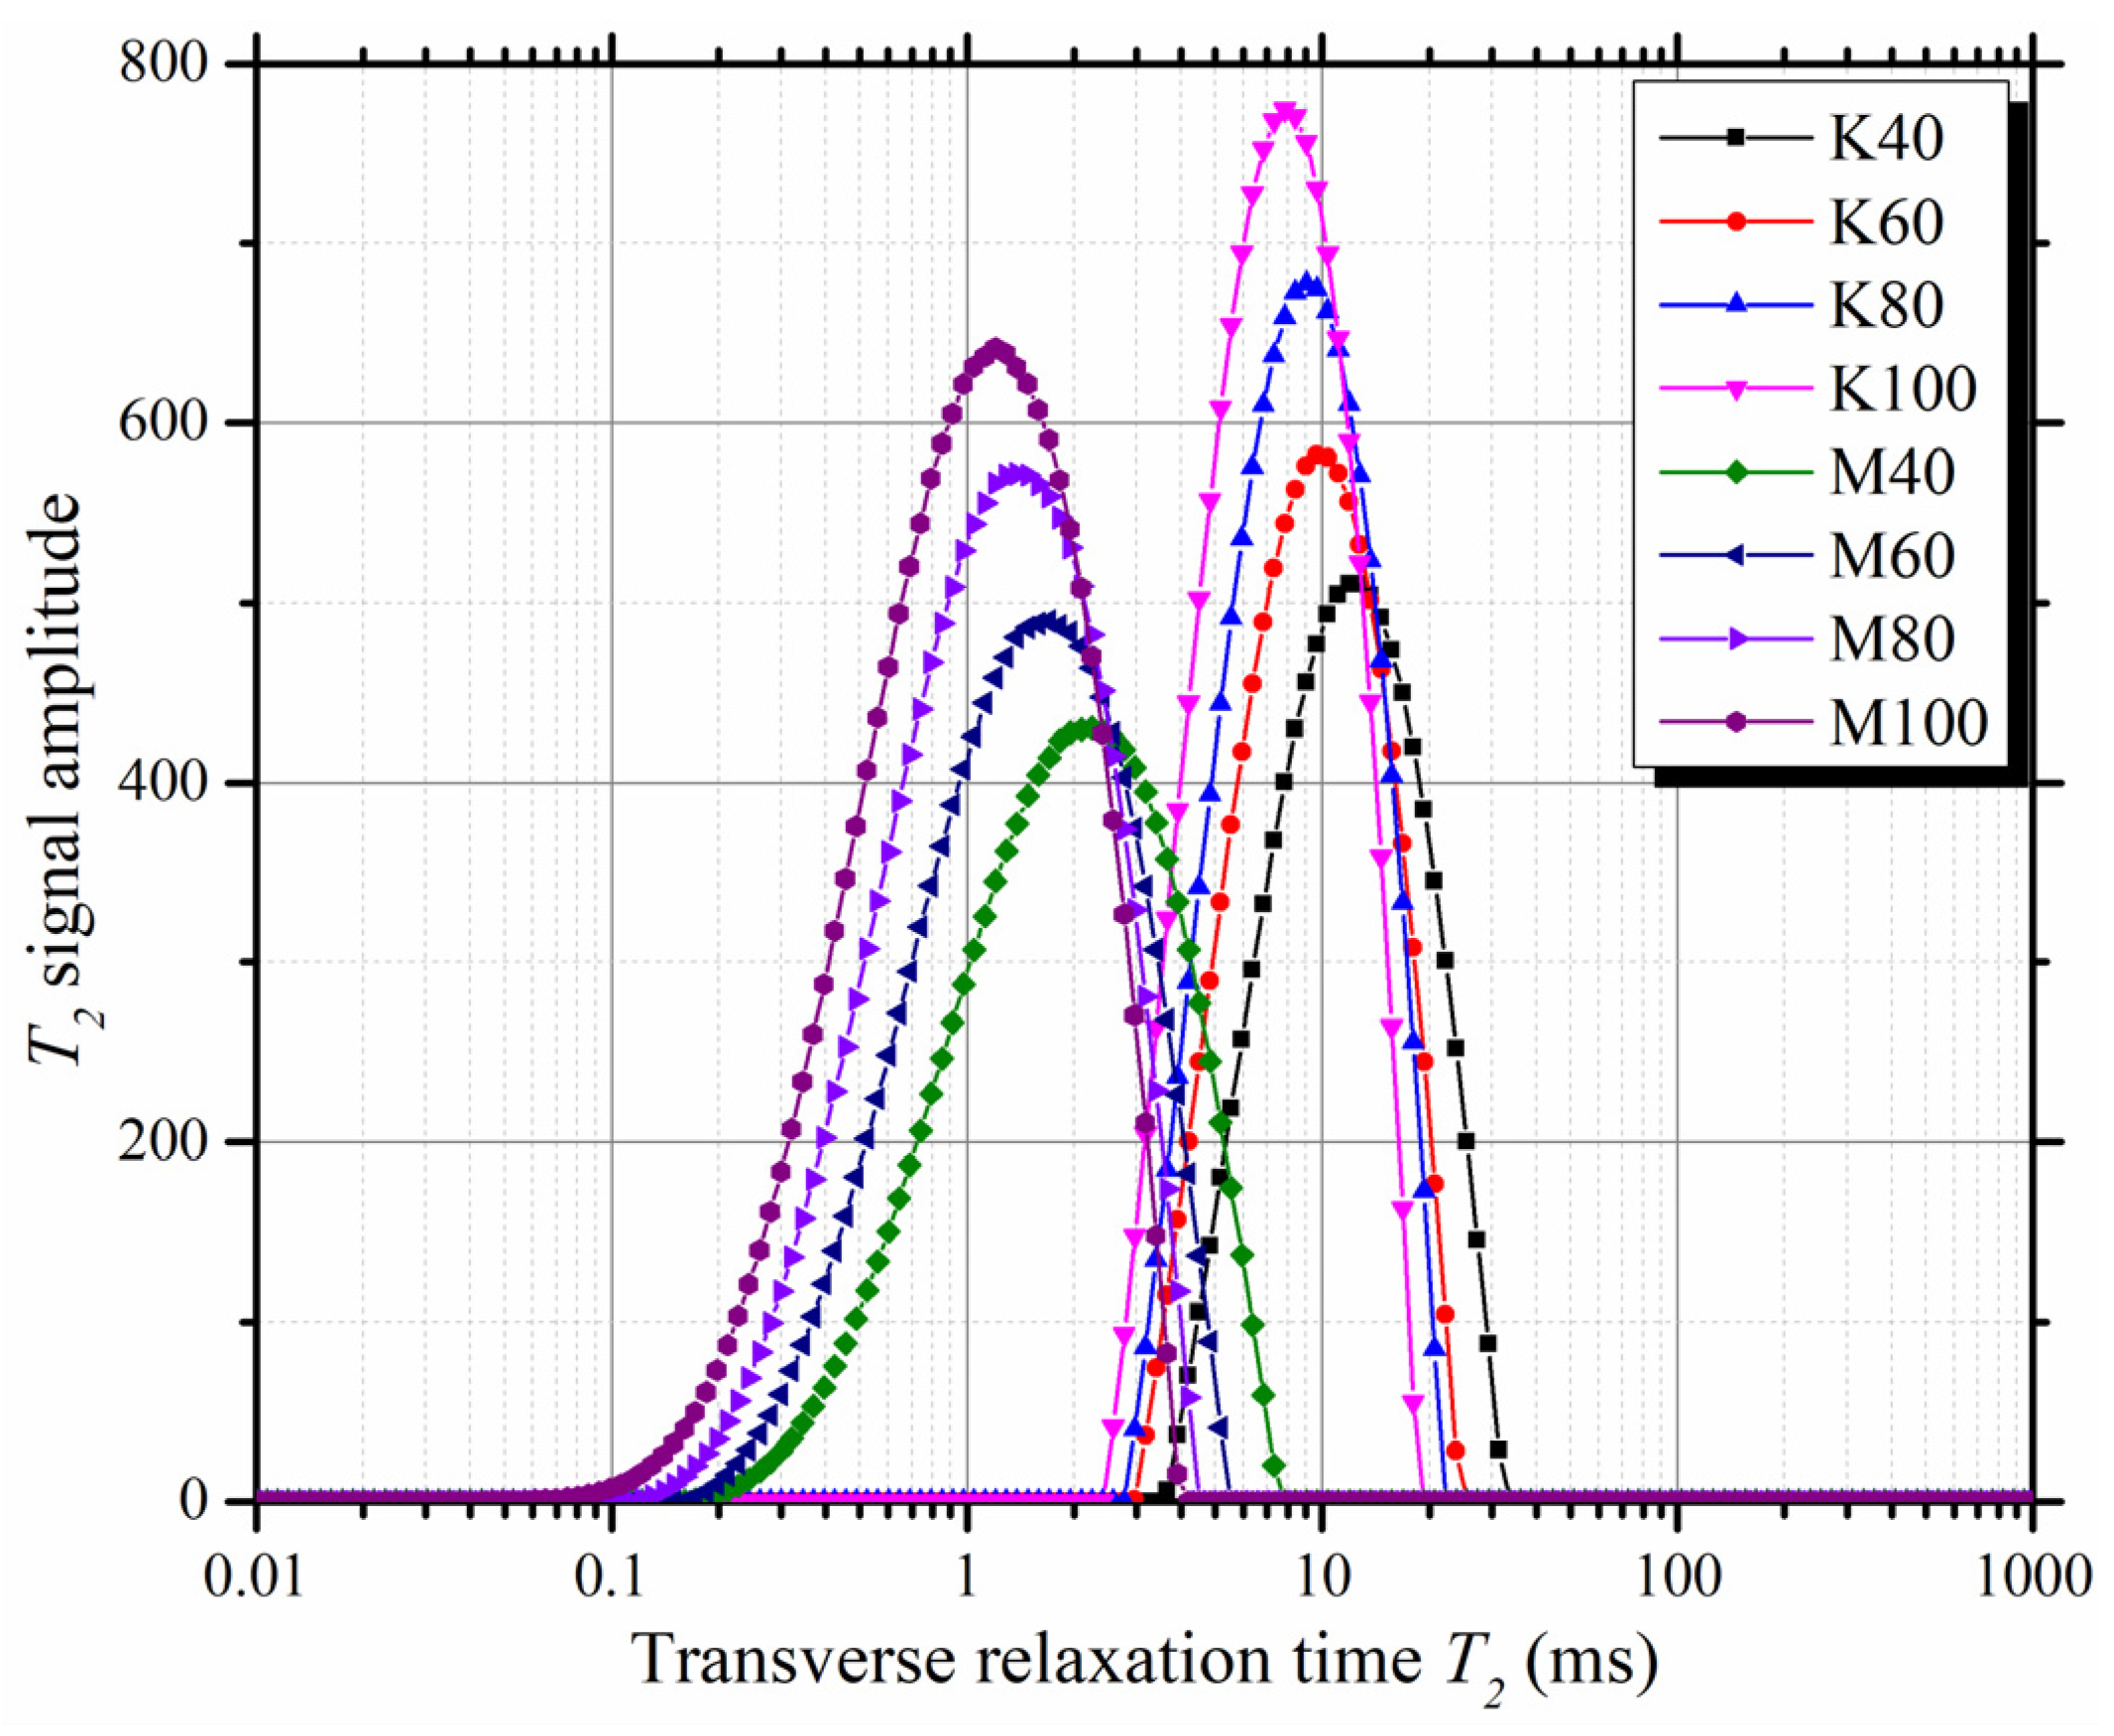
3.1. T2 Spectra of Saturated Mixtures

The T2 spectra of kaolinite-quartz and montmorillonite-quartz saturated mixtures are shown in Figure 2. The T2 values corresponding to the peak signal amplitude (T2P) of kaolinite-quartz and montmorillonite-quartz saturated mixtures were different. The T2P of kaolinite-quartz mixtures and montmorillonite-quartz mixtures ranged from 7.84 to 11.89 ms and 1.20 to 2.25 ms, respectively. Based on this, the dominant clay mineral could be roughly inferred from the T2 spectrum of saturated mixtures. Besides T2P, the whole T2 spectrum, including the maximum and minimum T2, shifted to the left as the clay content increased. According to Equation (3), the reason why T2 shifted to the left may have been due to the increases in the relaxation coefficient or decreases in the pore diameter of mixtures with increased clay contents. The peak signal amplitude increased as the clay contents increased in mixtures.
According to NMR theory, the total area of the T2 spectrum, which is equal to the T2 total signal amplitude (At), is proportional to the weight of distilled water in mixtures. The distilled water was used to verify and determine this relationship. The relationship between At and the weight of distilled water is shown in Figure 3. The relationship between At and the weight of distilled water can be expressed by Equation (12).
A t = 302.6 m
Here, m is the weight of distilled water and the correlation coefficient R2 of Equation (12) was 0.996. This indicated that the water content of mixture can be expressed by the T2 total signal amplitude of the T2 spectrum.
The relationship between the T2 signal amplitude per unit weight of dry soil particles (Auw) and clay content is shown in Figure 4. The T2 signal amplitude per unit weight of dry soil particles can represent the water content of per unit weight of dry soil (muw). The muw increased with an increase in clay content. The muw of montmorillonite-quartz was much bigger than in kaolinite-quartz mixtures. This is mainly because the double-layer structure of montmorillonite can hold more water. The relationships between Auw and clay contents of kaolinite-quartz mixtures and montmorillonite-quartz mixtures can be expressed by Equations (13) and (14), and the R2 values of Equations (13) and (14) were 0.997 and 0.982.
A u m = 0.606 C C + 35.22
A u m = 1.581 C C + 25.98
The geometric mean of T2 (T2gm) was defined by Equation (15):
T 2 g m = exp ( T 2 s T 2 e A i A t ln ( T 2 i ) )
where T2s and T2e were the start and ending points of T2 spectra, respectively, which were T2s = 0.01 ms and T2e = 10,000 ms in this study; T2i represents the individual values of T2; Ai is the cumulative signal amplitude at T2i; and At is the total signal amplitude of the T2 spectrum. The T2gm values of mixtures in the initial saturated state are shown in Figure 5. The T2gm decreased as the clay content increased. For mixtures with the same clay content, the T2gm of montmorillonite-quartz mixtures was much smaller than kaolinite-quartz mixtures. The T2gm of montmorillonite-quartz mixtures and kaolinite-quartz mixtures ranged from 0.978 to 1.797 ms and 7.139 to 11.60 ms, respectively.
What is worth noting here is that the T2gm cannot be used to compare the diameters of pores of mixtures directly. According to Equation (3), the mean value of pore size (rm) is proportional to T2gm, so the relationship between rm and T2gm can be expressed by
1 T 2 g m = F s ρ r m
According to previous studies, the relaxation coefficients of soil with different mineral compositions vary greatly [58,59].

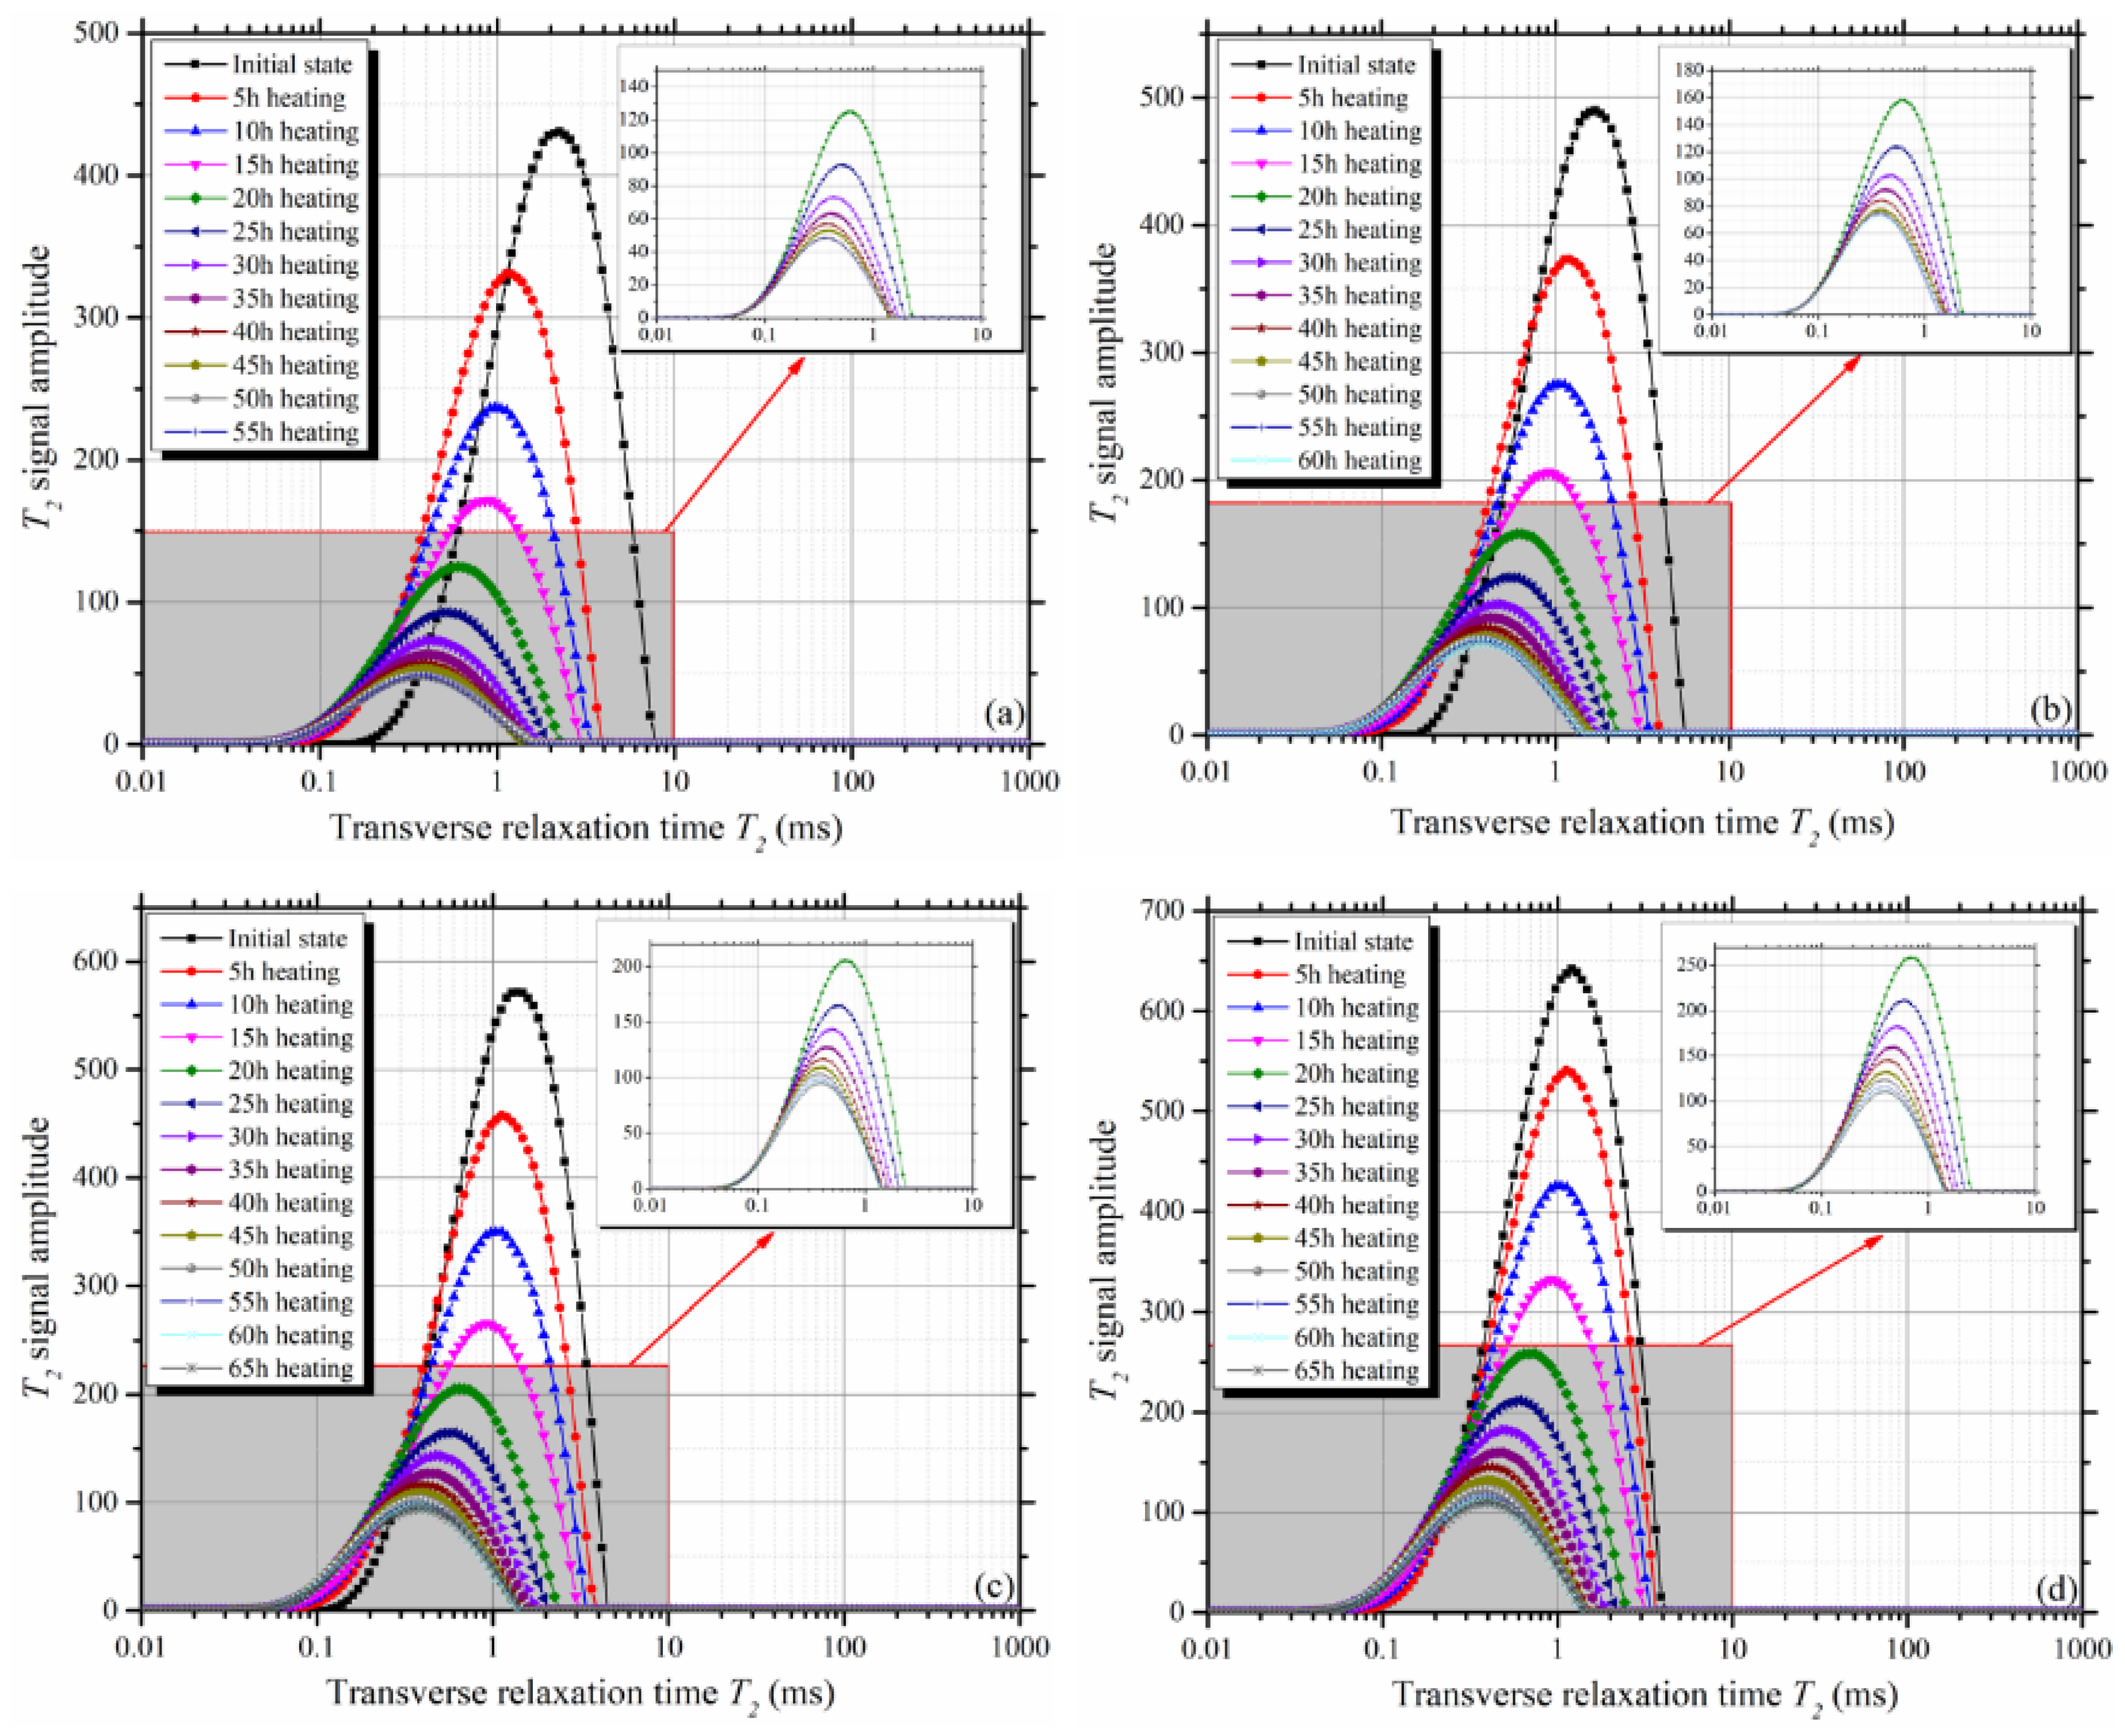
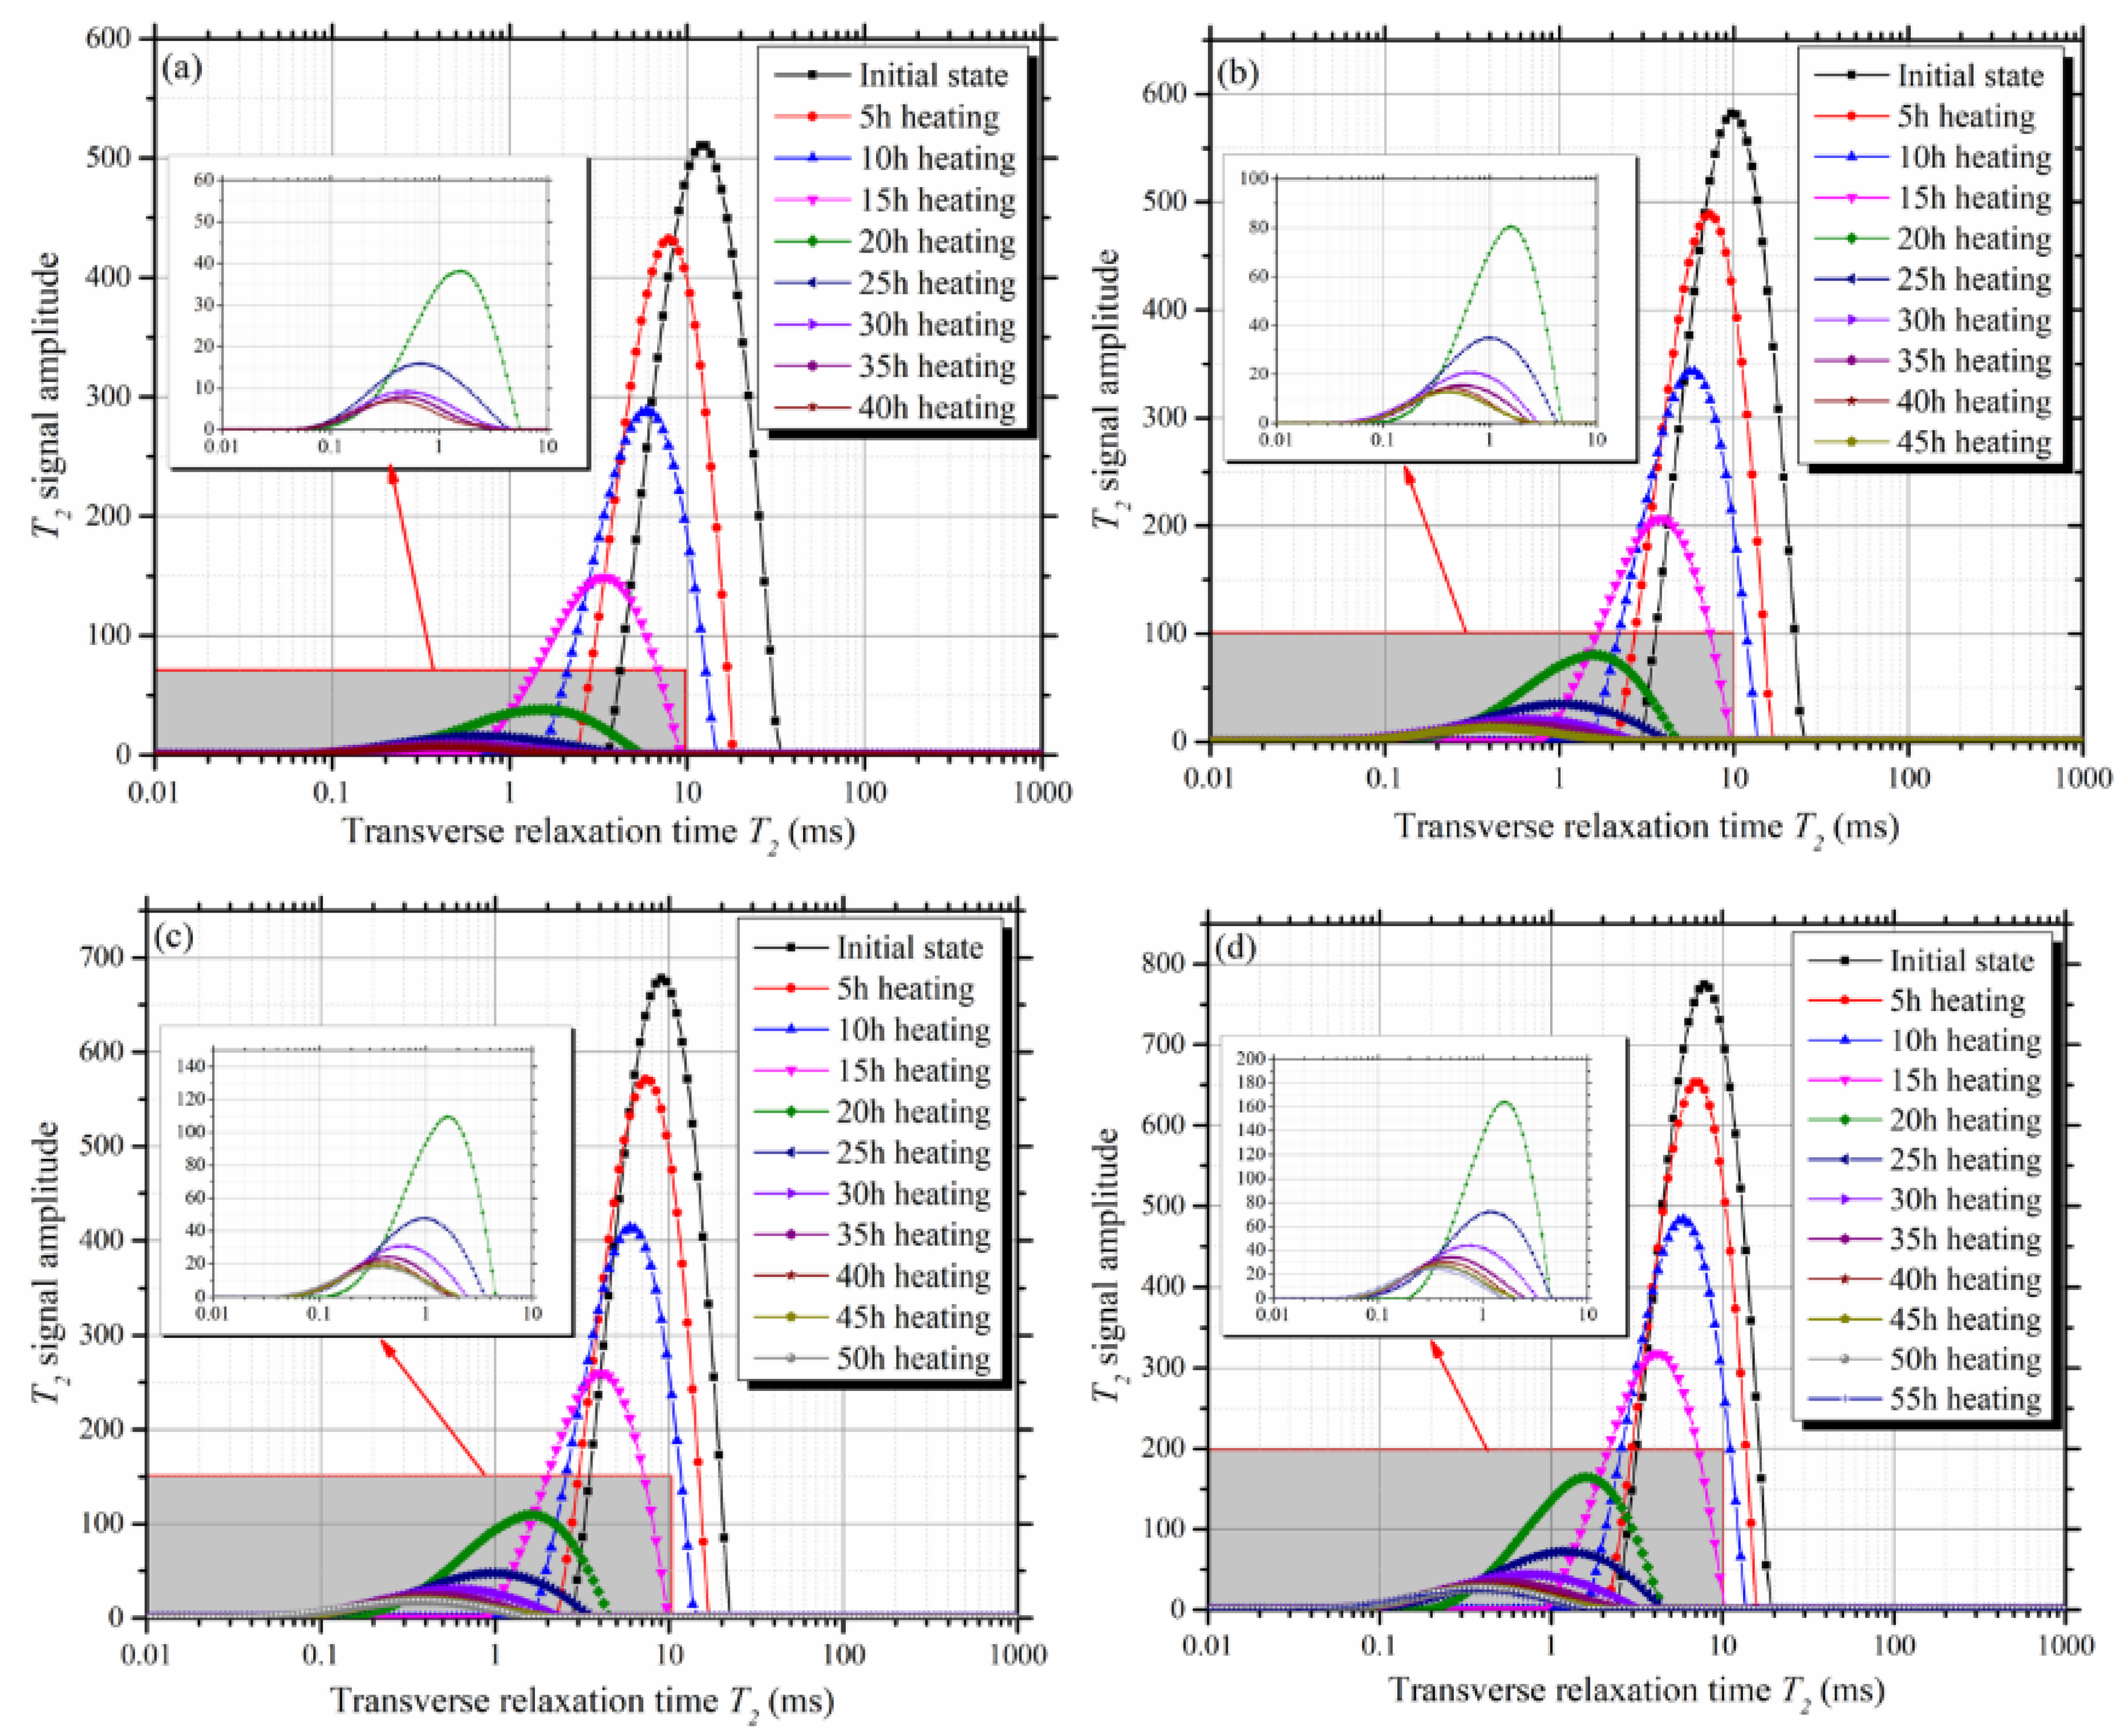
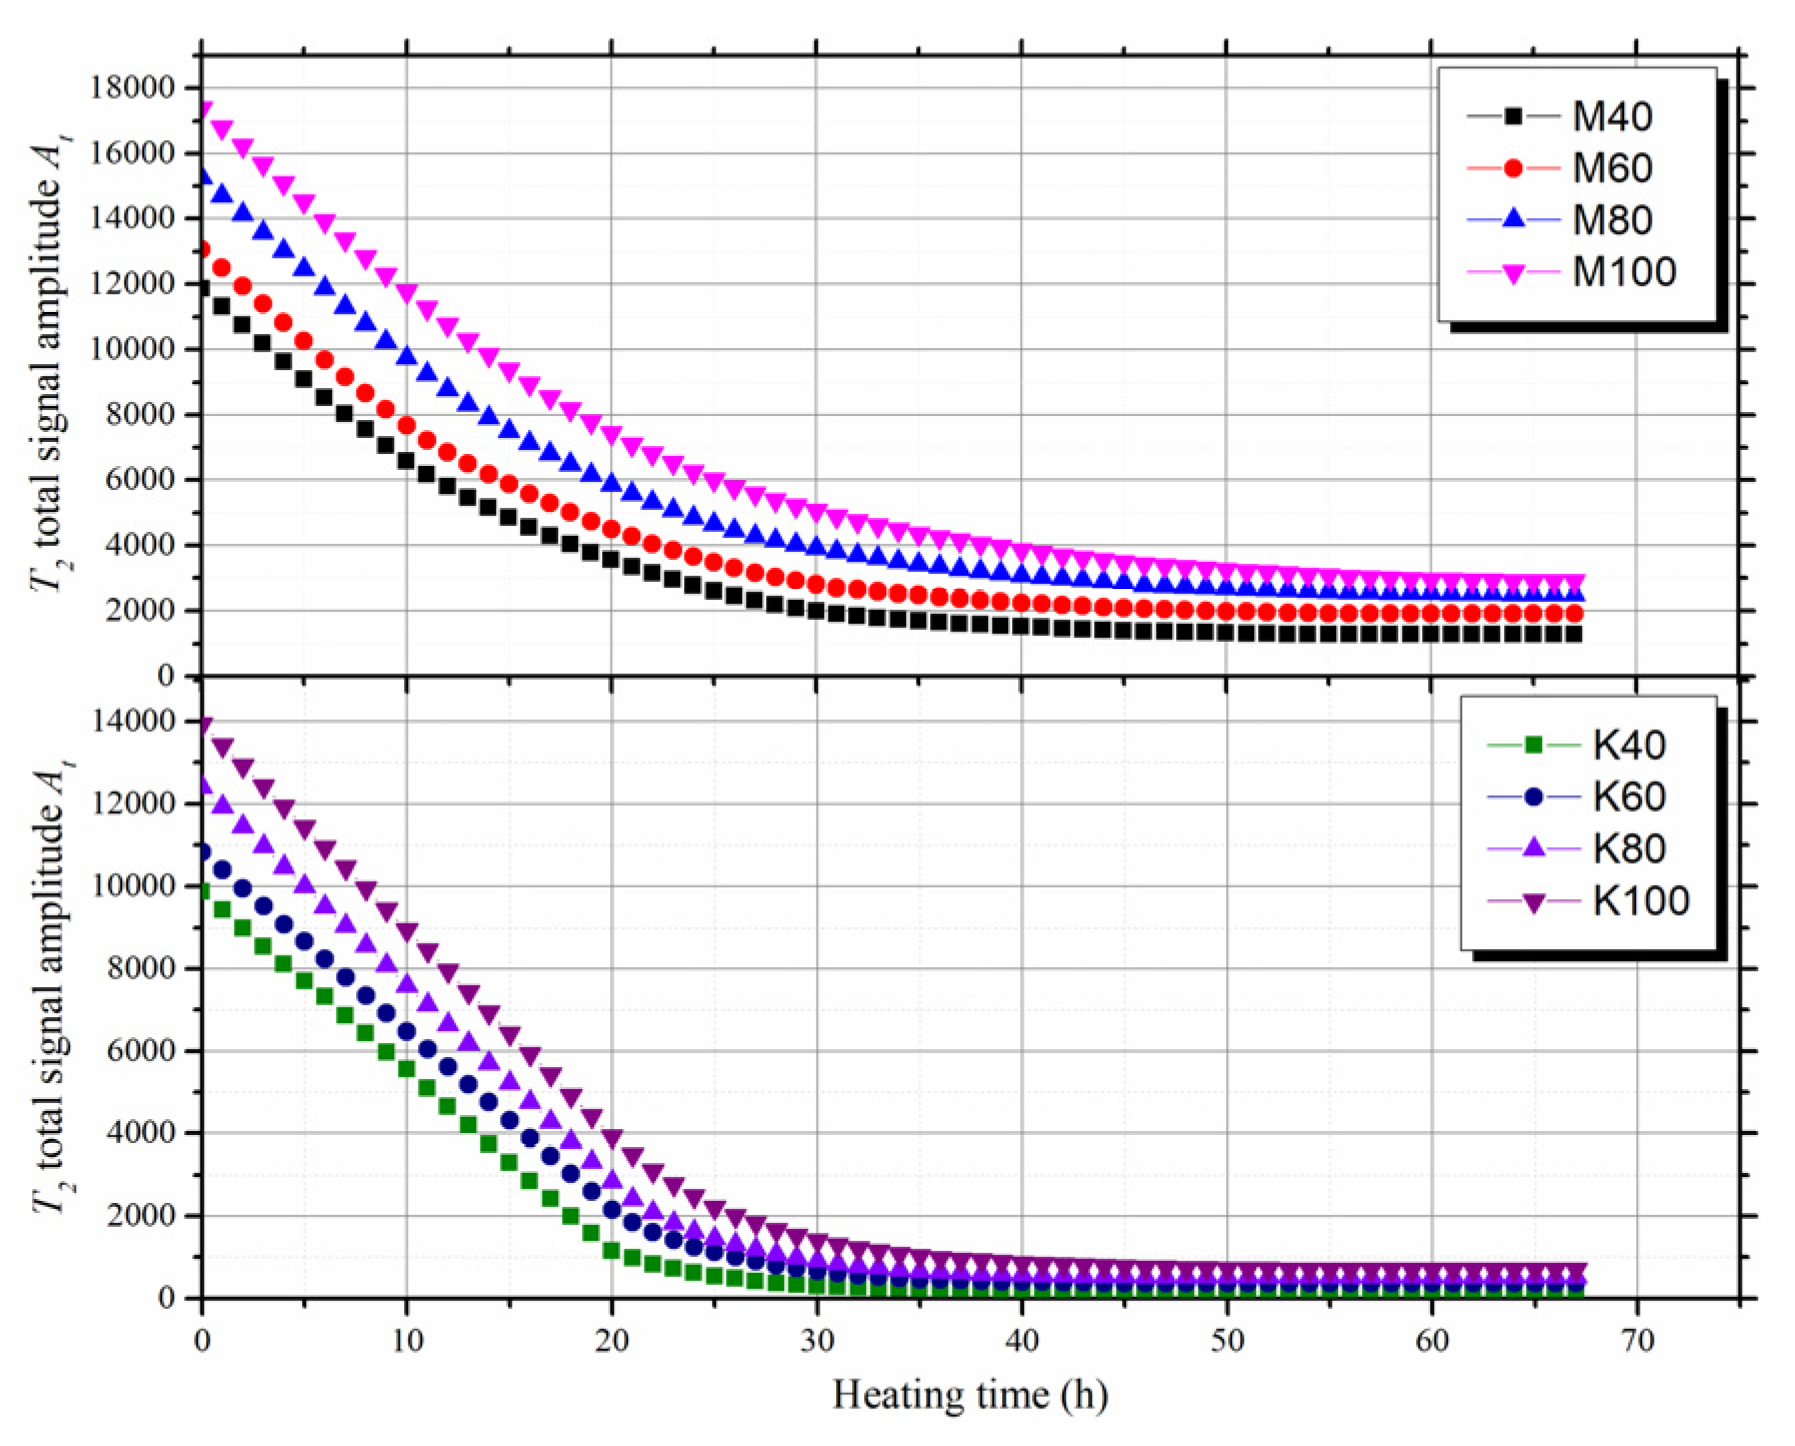
3.2. Variation of T2 Spectra During Evaporation

The variations of T2 spectra of montmorillonite-quartz and kaolinite-quartz mixtures during the evaporation process are shown in Figure 6 and Figure 7, respectively. All the T2 spectra were single peaks, which meant that the pores in mixtures were distributed continuously. The peak signal amplitude kept decreasing during evaporation. The decay rate of the peak signal amplitude reduced gradually. All the T2 spectra of mixtures shifted to the left during the evaporation process. This meant that the pore sizes of the mixture decreased due to volume shrinkage during evaporation.
The variations of the T2 total signal amplitude with respect to the heating time are shown in Figure 8. For the same heating time, the mixtures with a higher clay content had a bigger T2 total signal amplitude. With the same clay content, the T2 total signal amplitude of montmorillonite-quartz mixtures was bigger than that of kaolinite-quartz mixtures. The At kept decreasing during evaporation and the decay rate reduced gradually, until it reached 0.
Figure 9 shows the variations of the decay rate with respect to the heating time. According to the decay rate, the evaporation process could be divided into two stages: the constant rate stage and the falling rate stage. The time when the decay rate started to fall was defined as the falling rate critical time (Tf). The Tf values of the montmorillonite-quartz mixtures and kaolinite-quartz mixtures were 6 and 20 h, respectively.

4. Discussion

4.1. Novel Method for Determining the T2 Cut-Off

In previous studies, the T2c values were determined from the T2 spectra of saturated and centrifugal samples. This method assumed that centrifugation could remove all free water in samples. There are two problems when this method is used to measure the T2c of clay-quartz mixtures: (1) The strength of the clay-quartz mixtures is much lower than that of coal, sandstone, and shale, so the centrifugal force may damage the samples, and (2) because of the complexity of the structure, the water in mixtures is hardly removed by the centrifugal method. Even at the maximum rotational speeds, little water is extracted from samples by centrifuging. Therefore, a new method needs to be proposed for determining the T2c of clay-quartz mixtures.
According to the results of NMR and evaporation tests, the evaporation process can be divided into two stages. The water that evaporated easily corresponded to a larger signal decay rate and the water that evaporated with more difficultly corresponded to a smaller decay rate. Based on this, the water in mixtures can divided into two types: the free water and the bound water. In this study, the water that evaporated during the constant rate stage and falling rate stage was defined as the free water and the bound water, respectively. The T2c was used to discriminate between the free water and the bound water in the T2 spectrum. The T2c divides the T2 spectrum of initial saturated mixtures into two parts. The cumulative signal amplitude from T2min to T2c corresponded to bound water. On the contrary, the cumulative signal amplitude from T2c to T2max corresponded to free water. Therefore, the T2c could be determined from the T2 spectra of mixtures under two saturated states: an initial state and a falling rate state. The mixture under the initial state and falling rate state were the saturated mixture before evaporation and the mixture at the beginning of the falling rate stage, respectively. Based on the two T2 spectra, the cumulative signal amplitude curves of mixtures under two states could be obtained. A line parallel to the T2 axis can be drawn from the maximum cumulative signal amplitude of the falling rate state, which intersects with the cumulative signal amplitude of the initial state. The T2i of the intersect point was the T2 cut-off value. Figure 10 shows the T2c of all eight mixtures.
The relationships between T2c and the clay content of mixtures are shown in Figure 11, which reveals that the T2c decreased as the clay content increased. The relationships between T2c and the clay content of K-Q mixtures and M-Q mixtures can be expressed by Equations (17) and (18), for which the R2 values were 0.987 and 0.912, respectively.
T 2 c = 0.012 C C + 6.626
T 2 c = 0.016 C C + 3.322

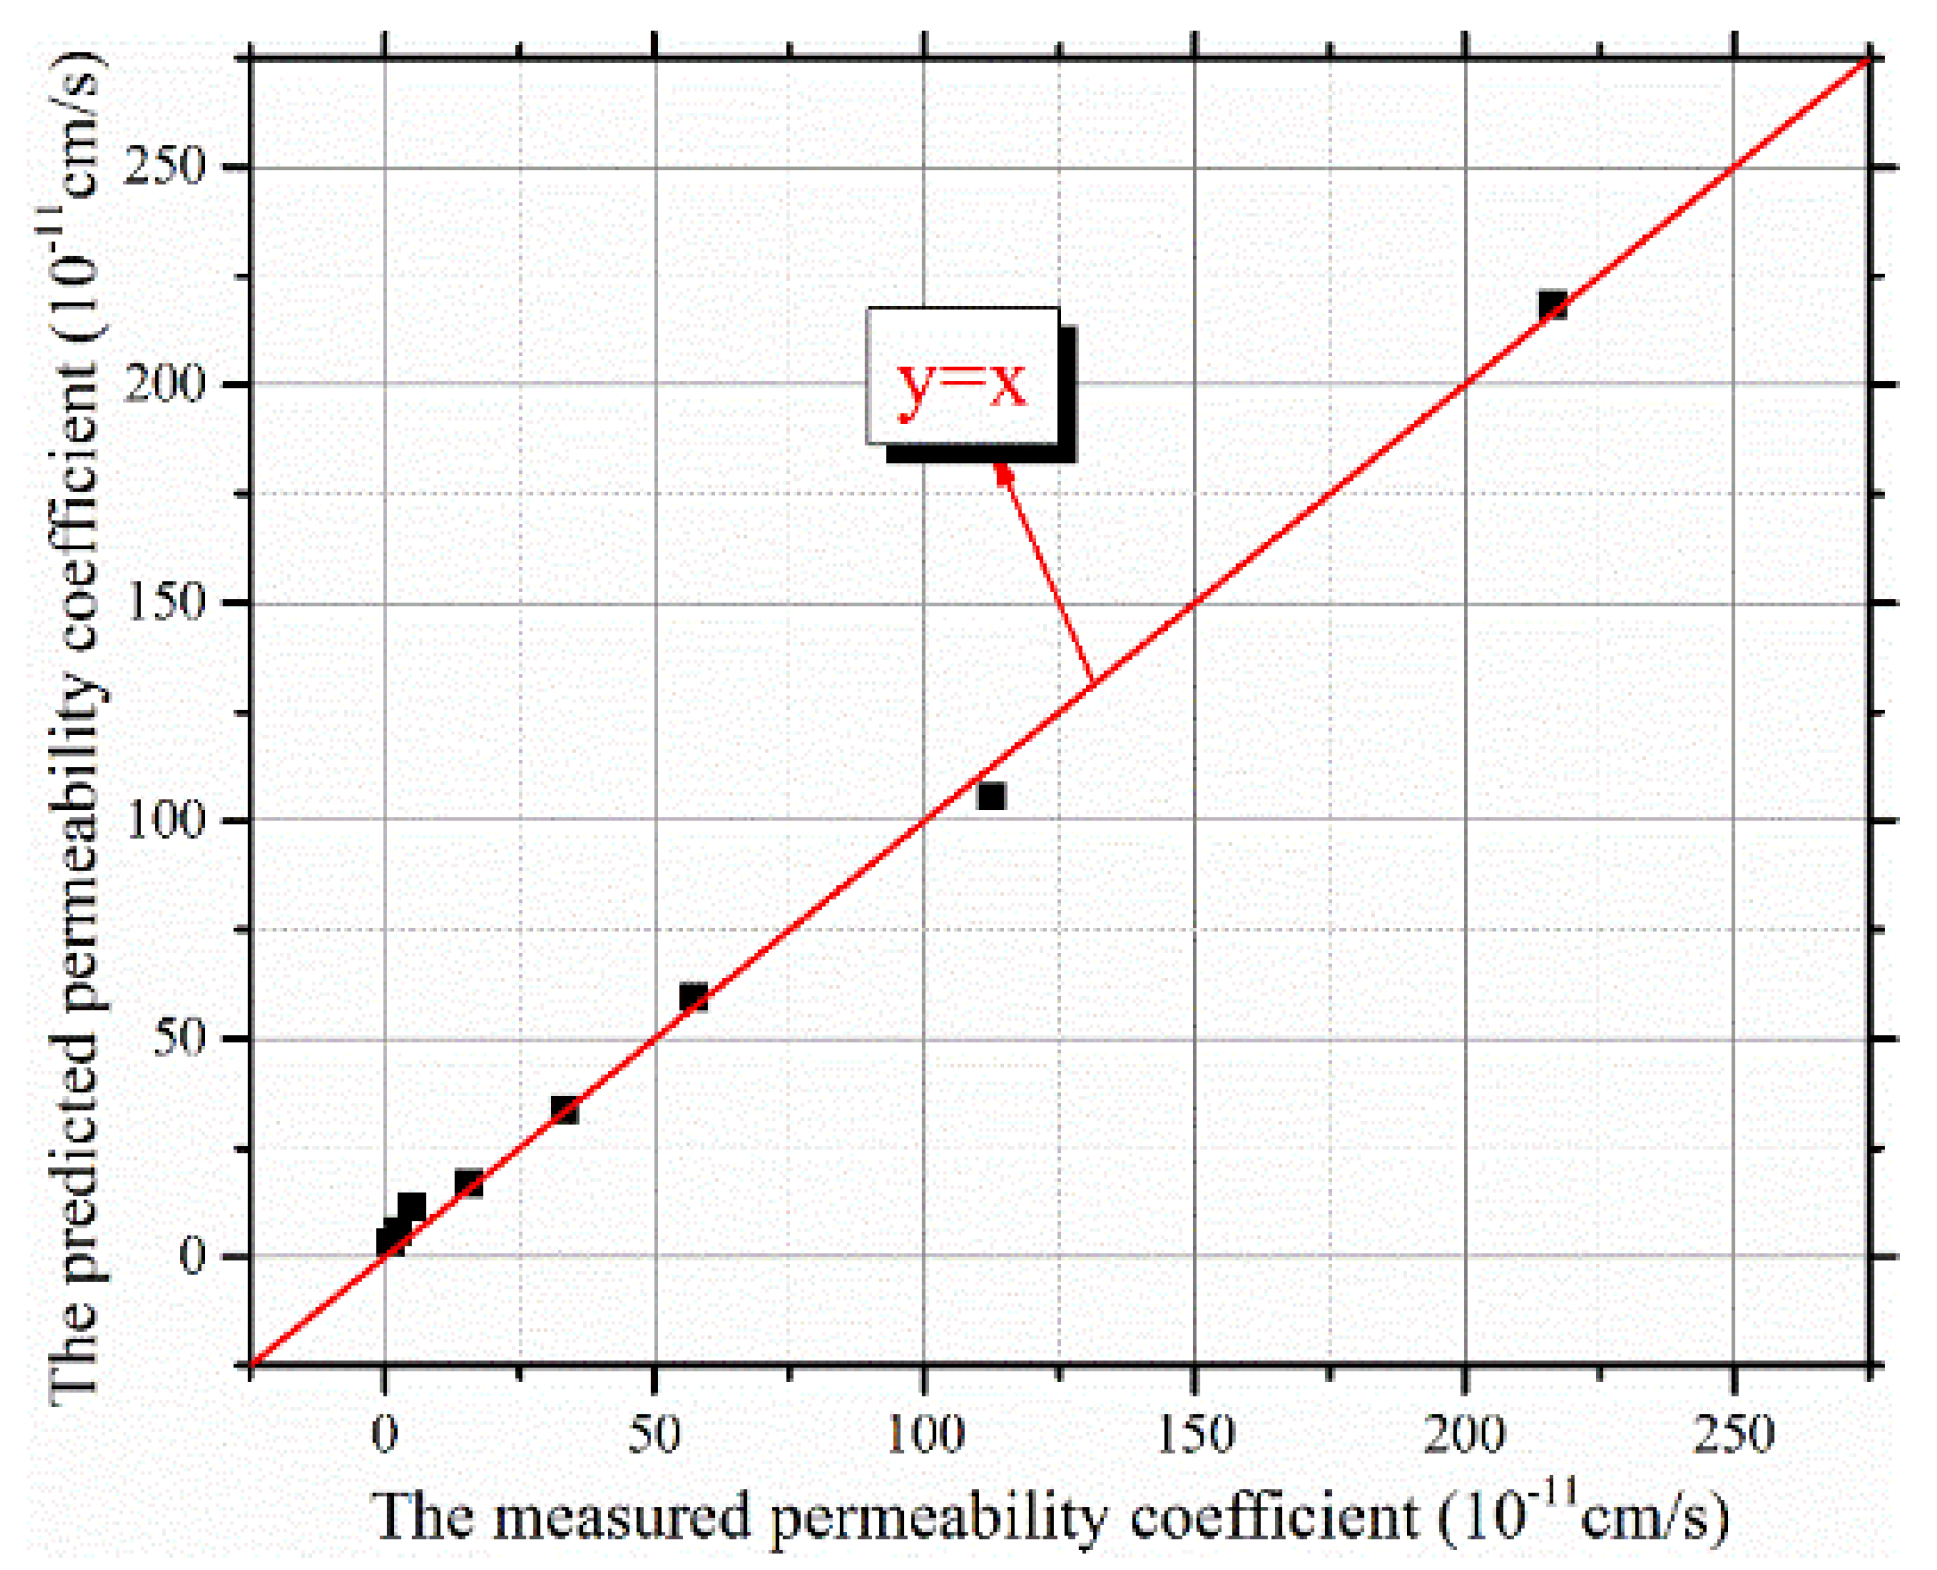
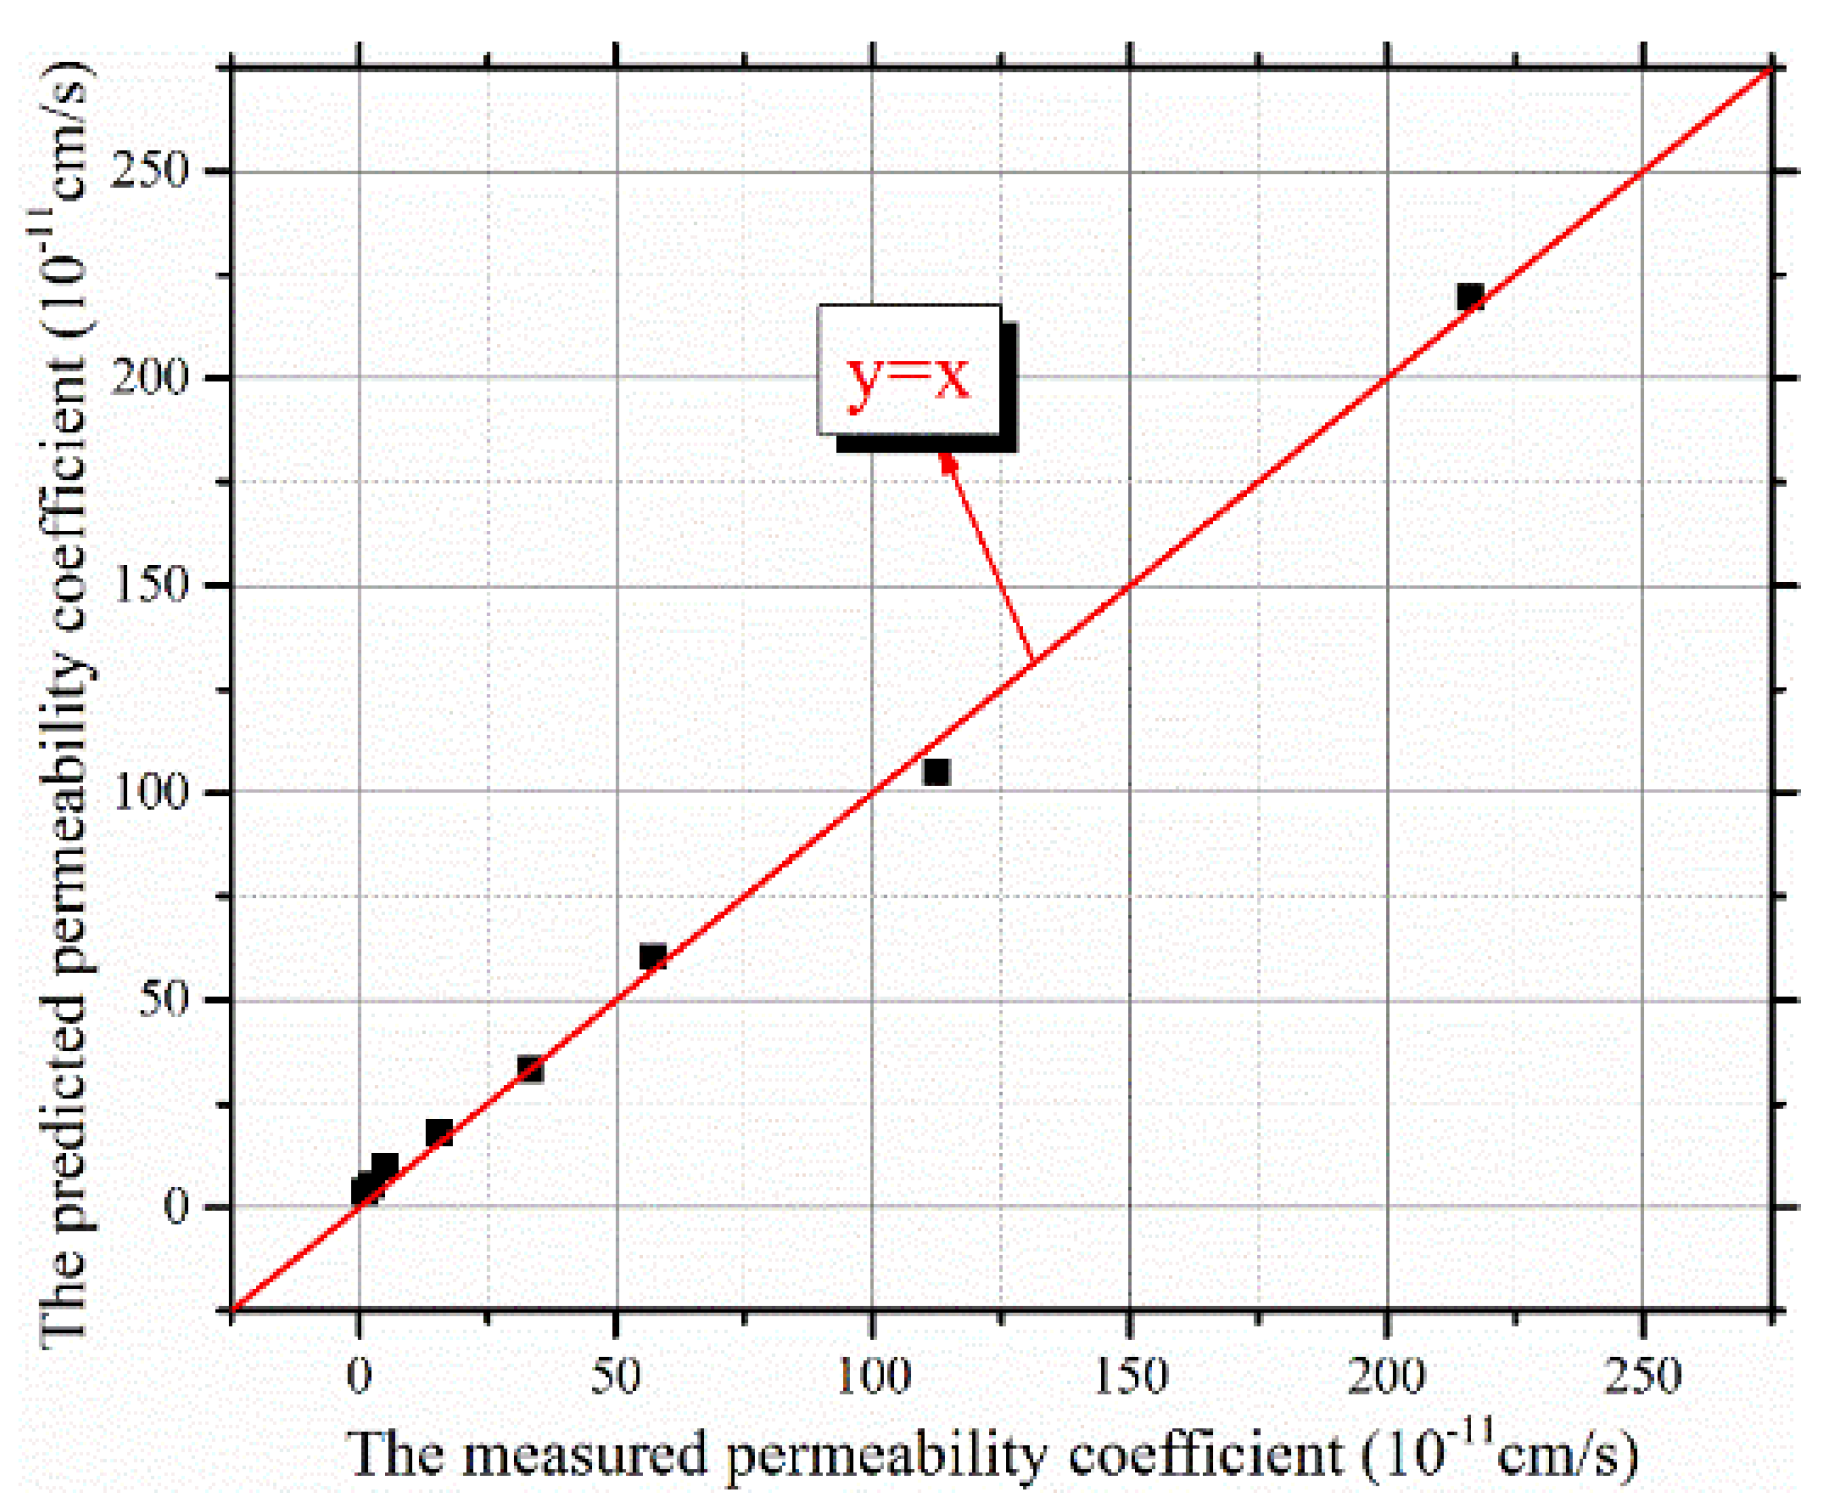
4.2. TC Permeability Coefficient Prediction Model

The variable head permeability test is the traditional method used to measure the permeability coefficients of clay-quartz mixtures. The method is time- and effort-consuming. NMR technology has gradually become a commonly used method for determining the permeability of porous media. For shales, coals, and sandstones, it has been proved that the Schlumberger Doll Research (SDR) model and Timur-Coates model (TC model) can be used to predict permeability. Because of the complexity of the structures, whether these two models are suitable for predicting the permeability of clay-quartz mixtures with different mineral compositions has not been previously verified. The SDR model can be expressed by Equation (19):
k S D R = a φ N M R m ( T 2 g m ) n
where kSDR is the permeability predicted by the SDR model and φNMR is the porosity measured by the NMR test. The empirical constants a, m, and n are related to the basic properties of porous media. This model used the average pore size to predict permeability. However, because the surface relaxivity of mixtures with different mineral compositions varied greatly, the T2gm could not be used directly to compare the average pore size. It is unreasonable to use the SDR model to predict the permeability of clay-quartz mixtures with different mineral compositions.
The TC model can be expressed by Equation (20):
k T C = a φ N M R m ( F F V B F V ) n
where kTC is the permeability predicted by the TC model, FFV is the volume of free fluid, and BFV is the volume of bound fluid. The TC model is also called the free fluid model. In NMR tests, FFV corresponded to the cumulative T2 signal amplitude between T2c and T2max (AFF), and BFV corresponded to the cumulative T2 signal amplitude between T2min and T2c (ABF). Equation (21) can be revised to form:
k T C = a φ N M R m ( A F F A B F ) n
To verify the applicability of the TC model, variable head permeability tests were used to measure the permeability coefficients of the eight mixtures. What is worth noting is that the permeability coefficient (K) determined from variable head permeability tests is not the permeability (k) in Equation (21). The k reflects the inherent permeability of porous media, independent of fluid properties. The K is not only affected by the properties of porous media, but also by the properties of fluids. The relationship between K and k is shown in the following Equation:
K = ρ g η k
where φ, g, and η are the density, gravitational acceleration, and dynamic viscosity coefficient of the fluid, respectively. For the distilled water used in this study, these three parameters were fixed values. Equation (22) can be simplified as follows:
K = b k
By combining Equations (21) and (23), the TC model can be expressed by Equation (24):
K T C = b k T C = b a φ N M R m ( A F F A B F ) n = B φ N M R m ( A F F A B F ) n
After regression fitting, the three constants B, m, and n were 1.527, −3.353, and 0.662, respectively. The R2 of Equation (24) was 0.957. Figure 12 presents the predicted permeability coefficients versus the measured permeability coefficients. The points of the curve were close to the line y = x. This indicated that the accuracy of the TC model met the requirements. The TC model can thus be used to predict the permeability coefficients of clay-quartz mixtures.

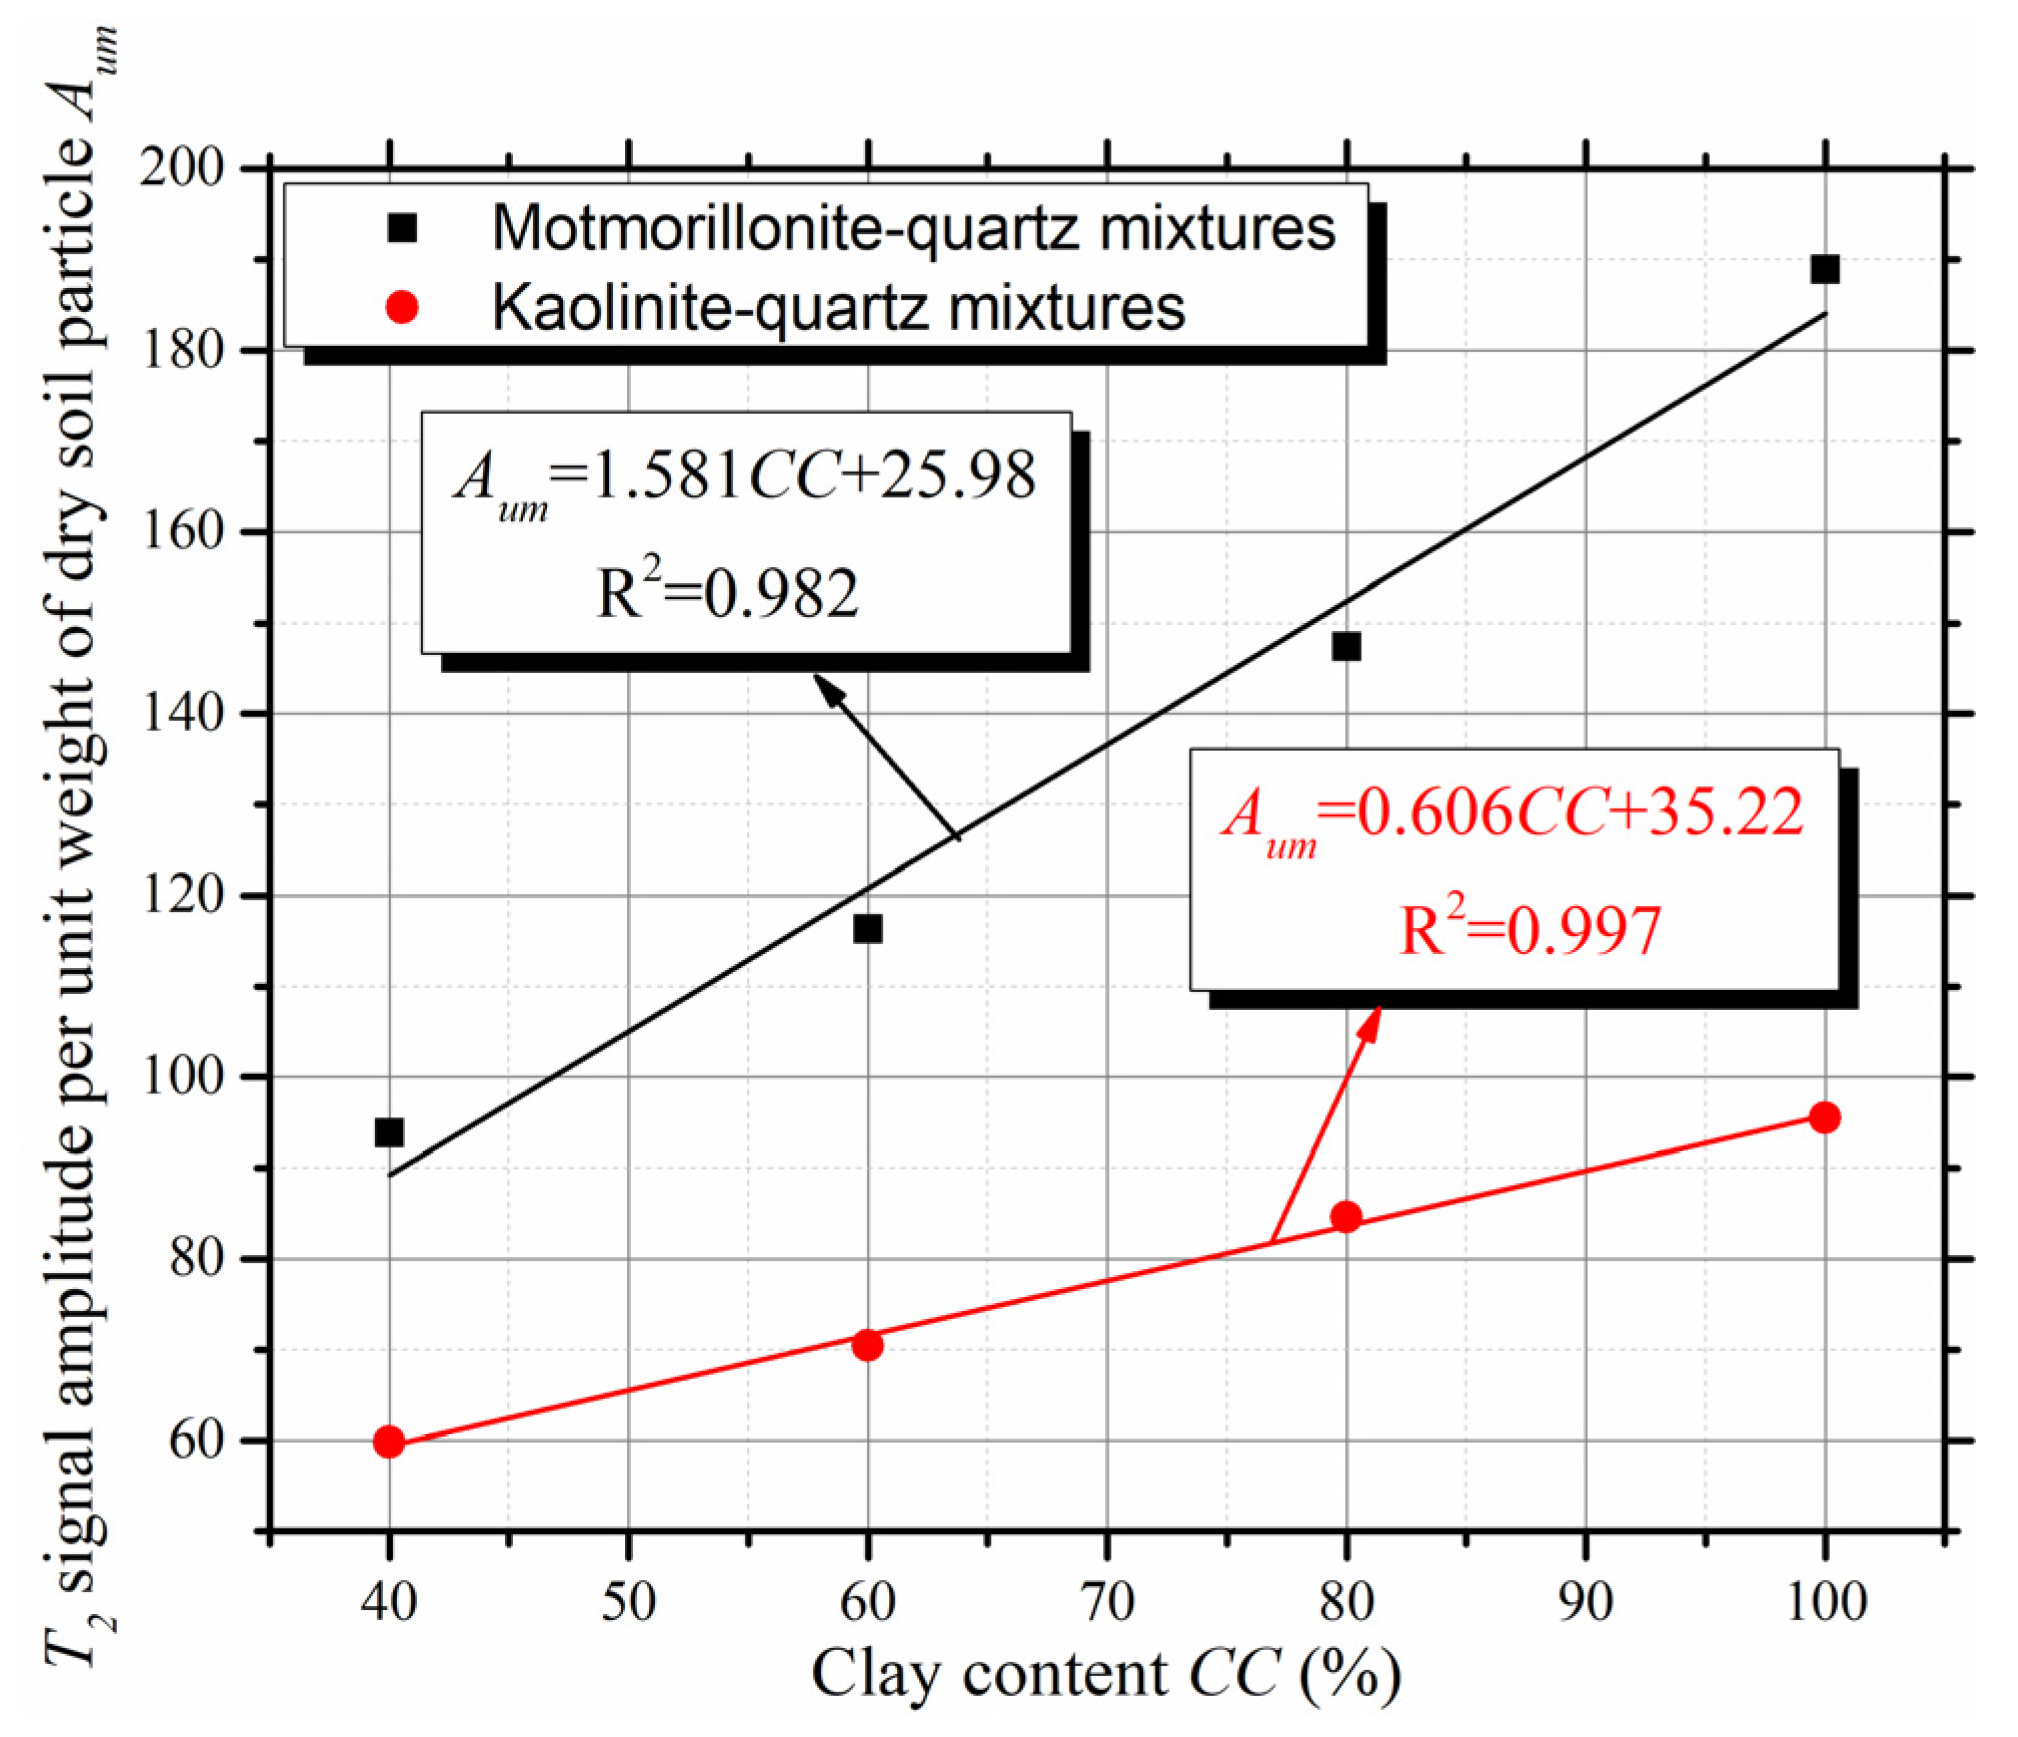
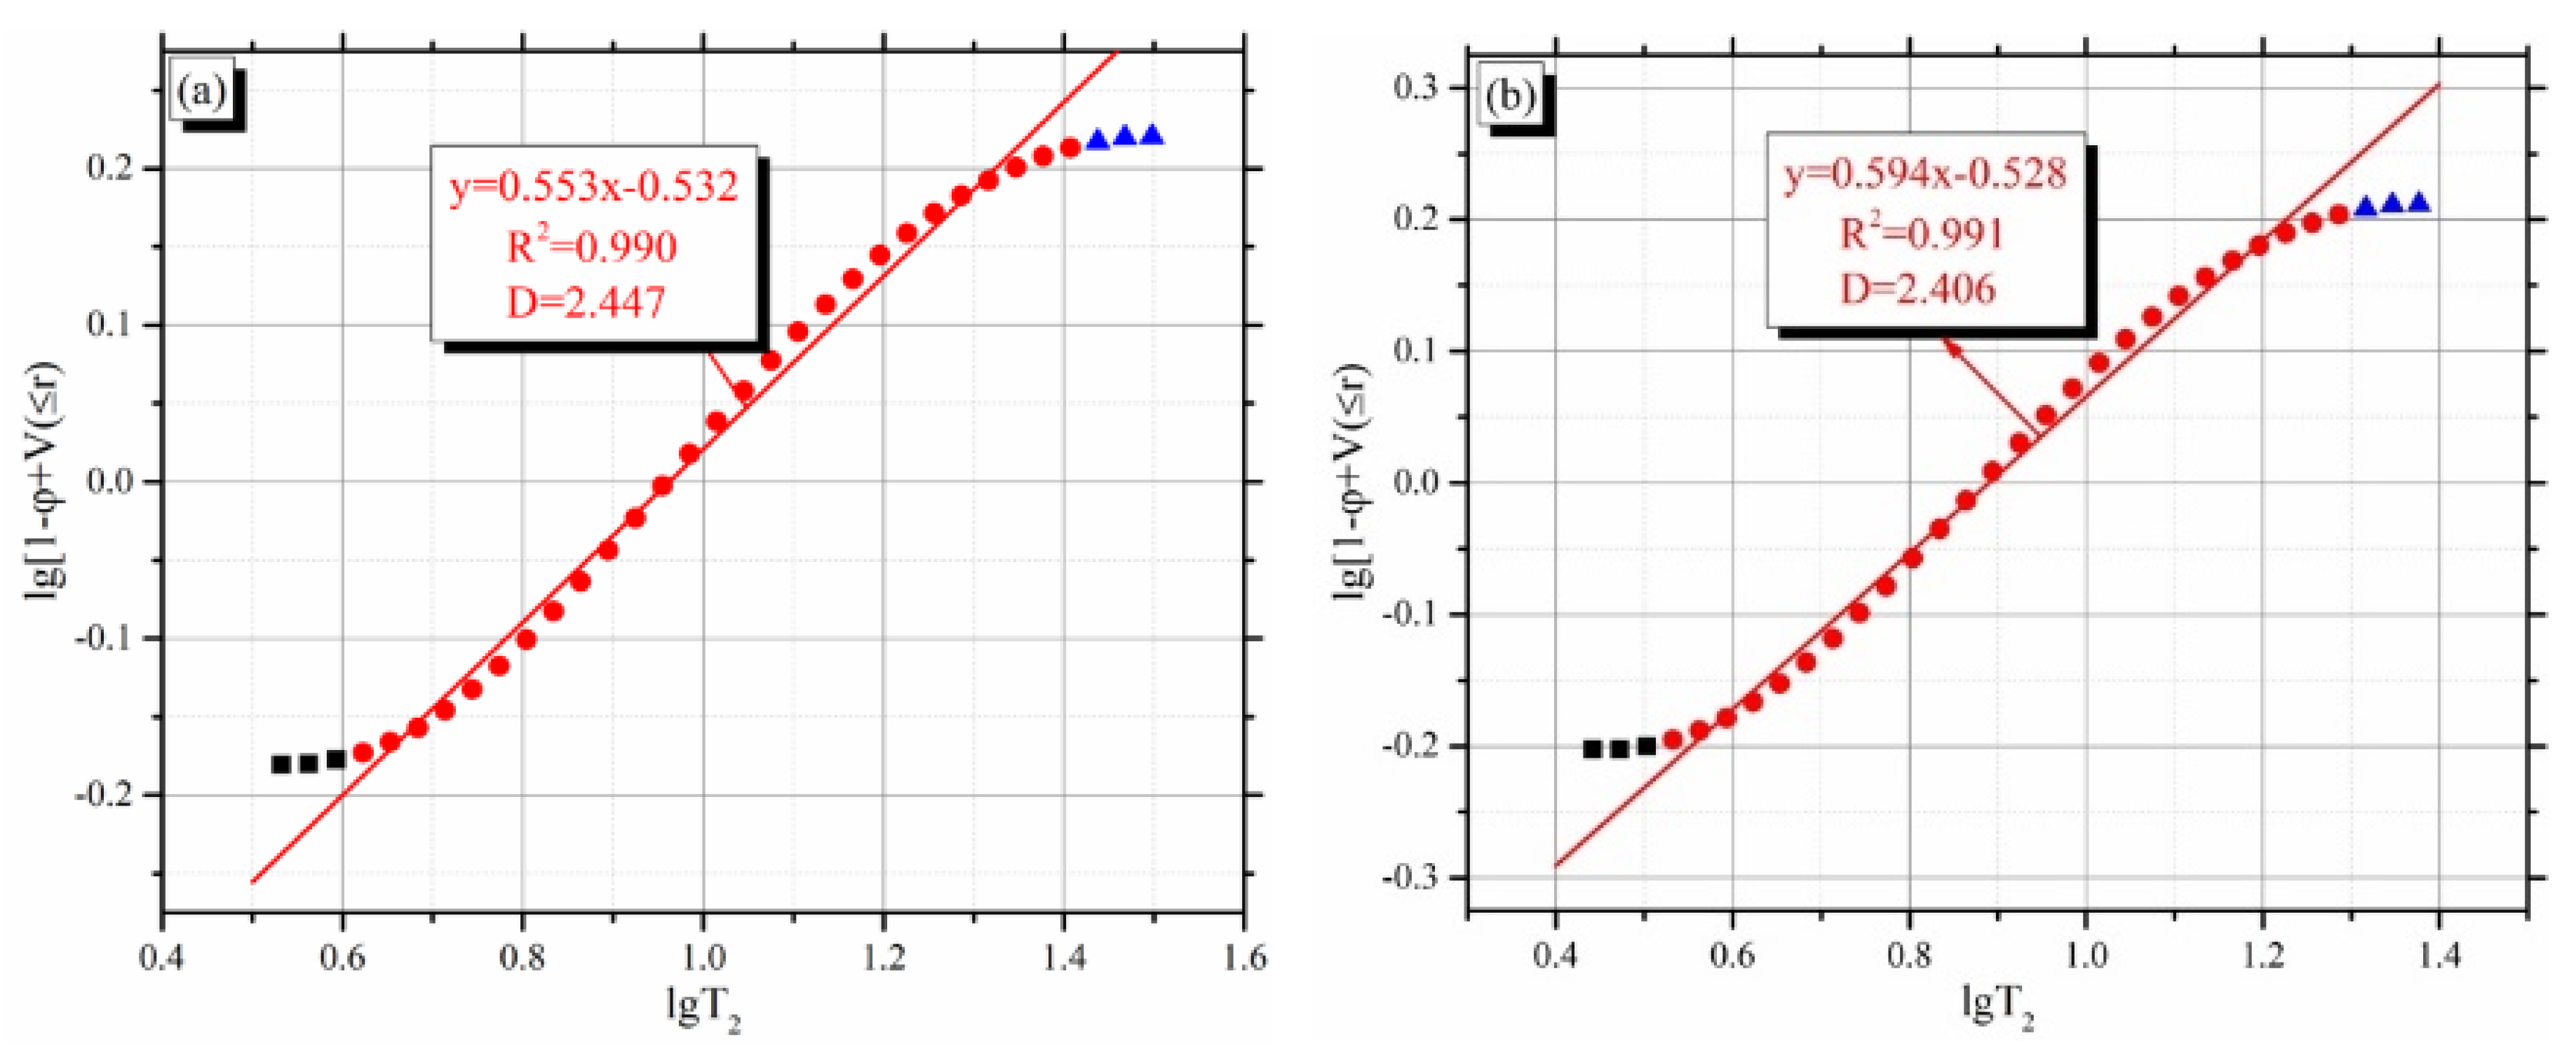
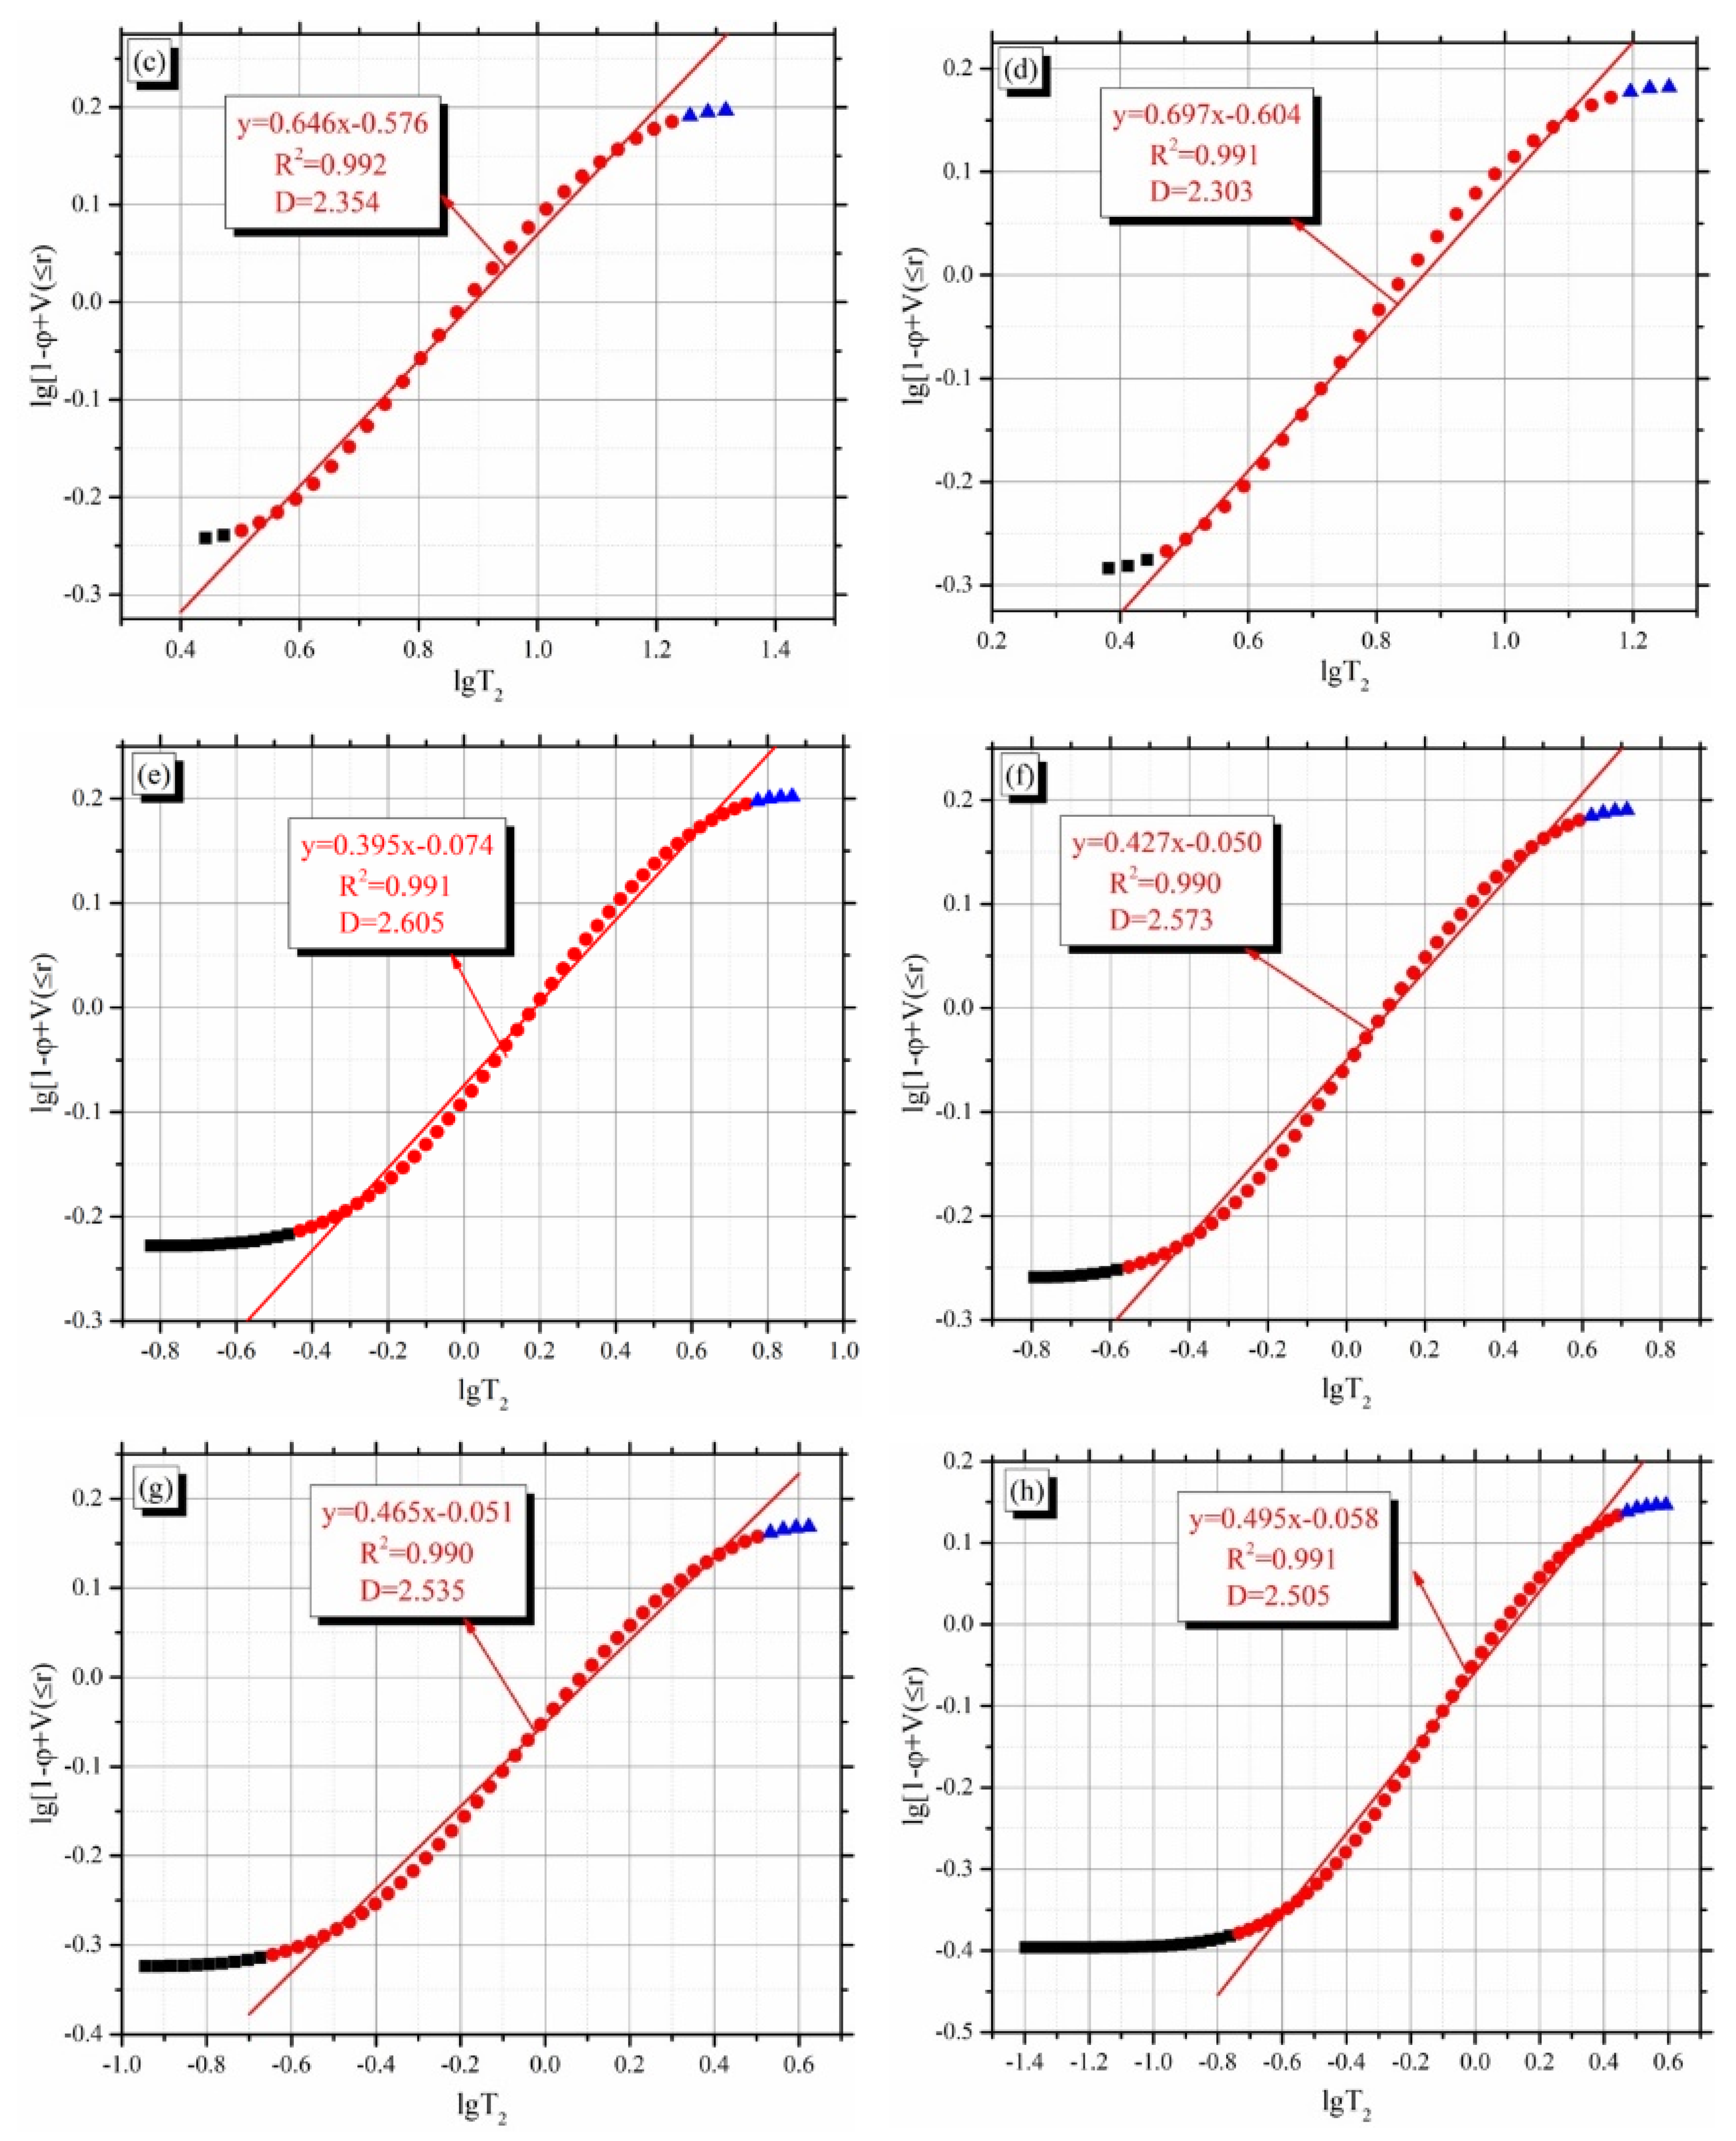
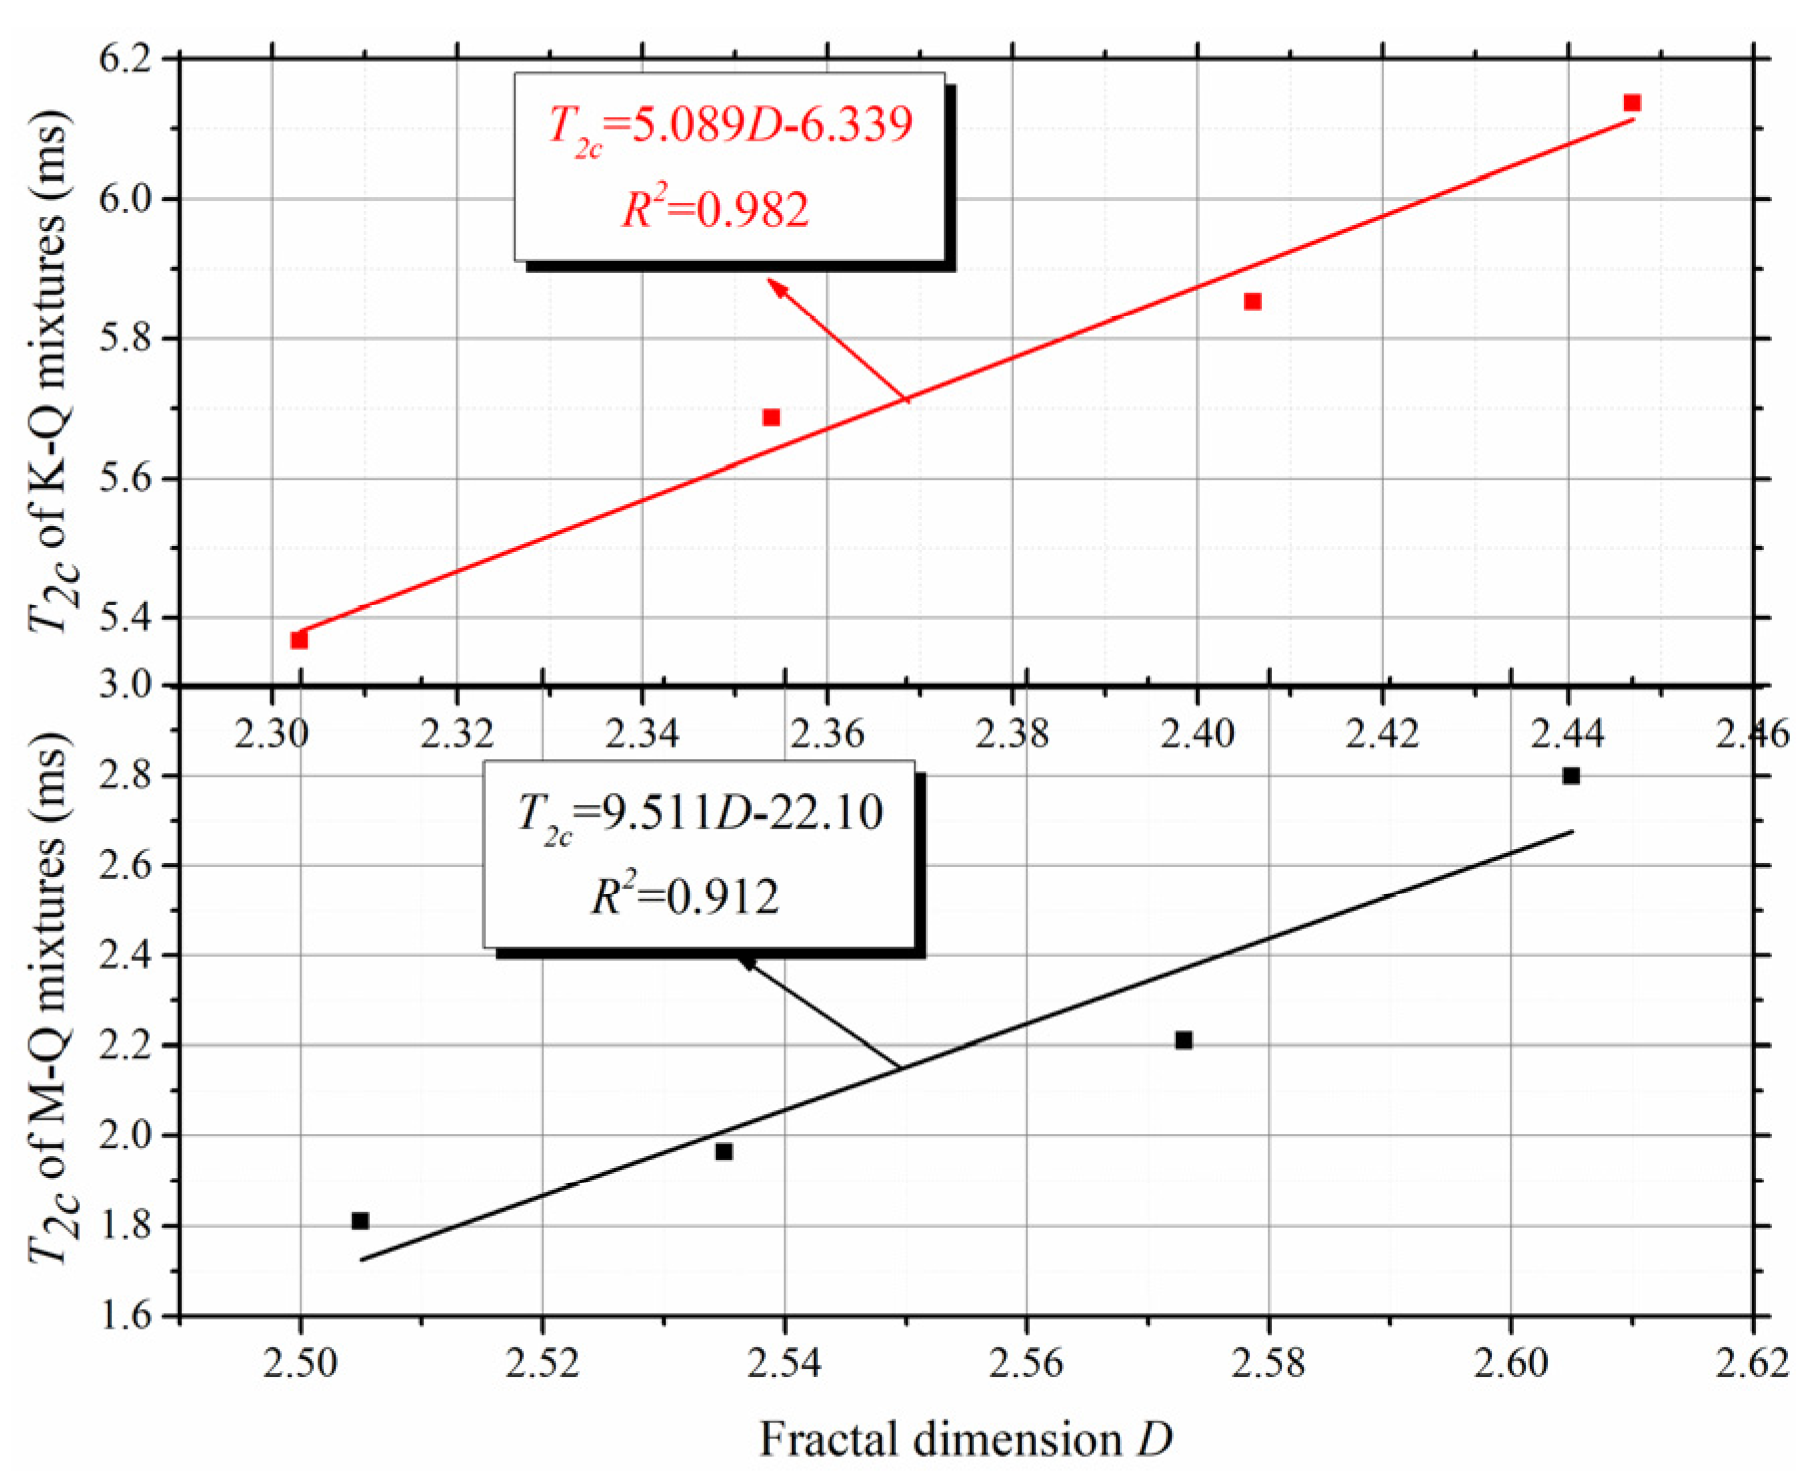
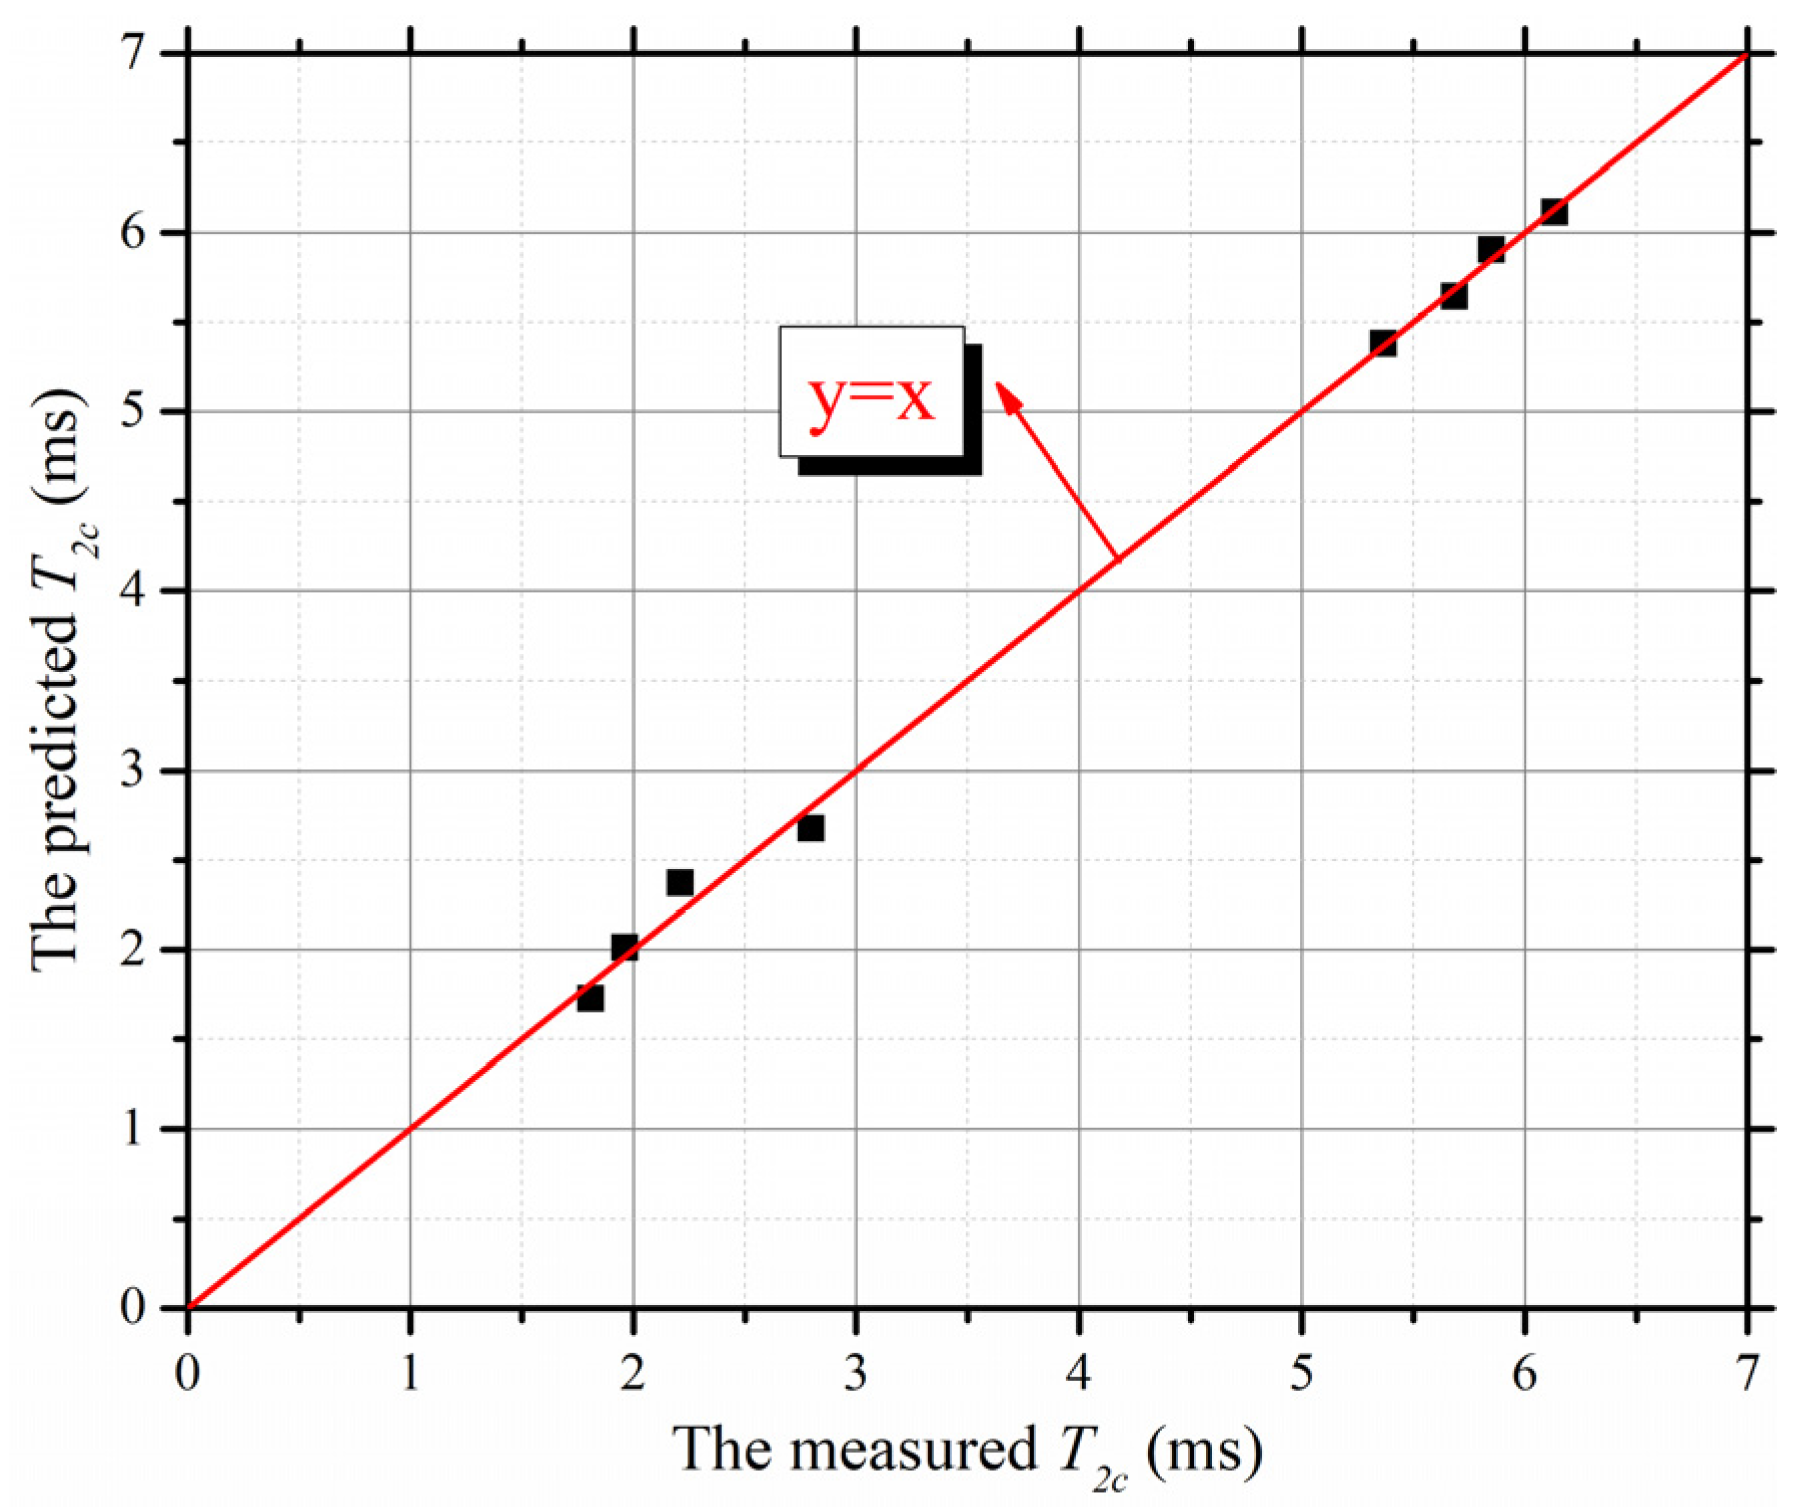
4.3. Determination Method of T2c Based on Fractal Analysis

Before using the TC model to predict the permeability of mixtures, it is necessary to determine T2c. In this study, the T2c was determined by an evaporation test, which is time-consuming. A simple method is thus needed to determine the T2c. According to previous studies, fractal dimensions can be used to determine the T2c because fractal dimensions can reflect the characteristics of the pore distribution in mixtures. The fractal dimensions were determined based on the fractal theory presented in Section 2.1.2. According to Equation (10), there is a liner relationship between lg[1 − φ + V(≤r)] and lgT2. The slope of the curve of lg[1 − φ + V(≤r)] versus lgT2 was obtained by linear regression. The linearity of the points at the beginning and end of the curves was relatively poor because of the scale dependency of the fractal dimension. The fractal dimensions calculated with different length scales are different. To achieve accurate fractal dimensions, we adopted a unified standard for the eight mixtures: maximize the length scale under the condition of the correlation coefficient reaching 0.99. Available length scales (red points in Figure 13) of K40, K60, K80, and K100 were 4.199–25.53, 3.409–19.34, 3.181–16.83, and 2.967–14.65 ms, respectively. Available length scales of M40, M60, M80, and M100 were 0.370–5.543, 0.280–3.917, 0.227–3.181, and 0.185–2.768 ms, respectively. After the slopes of the curves were determined, the fractal dimensions were determined by Equation (11). The fractal dimensions of the eight mixtures are shown in Figure 13.
As shown in Figure 13, the fractal dimensions of mixtures with the same kind of clay mineral decreased as the clay content increased. According to fractal theory [45,48], the more uniform the pore distribution of the mixture is, the smaller the fractal dimension of the mixture is. This indicates that the uniformity of the pore distribution increases as the clay content increases. For mixtures with the same clay content, the fractal dimensions of M-Q mixtures were larger than those of K-Q mixtures. The reason why the M-Q mixture had larger fractal dimensions is that the uniformity of the pore distribution was worse. However, the microscopic mechanism of the difference among fractal dimensions of mixtures with different mineral compositions was not clear. The uniformity of pore distribution was determined by the pore size. The free water distributed in large pore and bound water distributed in small pore. There was a relationship between fractal dimension and bound water or free water. So, the fractal dimensions could be used to predict T2c in this study. The microscopic mechanism of the close relationship between fractal dimension and bound water or free water was also not clear. The two microscopic mechanisms will be explored in future work.
Figure 14 shows the relationships between T2c and fractal dimensions. The relationships between T2c and fractal dimensions of M-Q mixtures and K-Q mixtures are different, but T2c increases with an increase in the fractal dimension. The relationship between T2c and fractal dimensions of M-Q mixtures and K-Q mixtures can be expressed by Equations (25) and (26), respectively:
T 2 c = 9.511 D 22.10
T 2 c = 5.089 D 6.339
The R2 values of Equations (25) and (26) are 0.912 and 0.982, respectively. The predicted T2c versus measured T2c is displayed in Figure 15. The points are close to the line y = x, so the Equations (25) and (26) can be used to predict the T2c of mixtures.
In order to verify the accuracy of predicting the permeability coefficient by using T2c which was predicted from fractal analysis, the T2c values predicted from fractal analysis were used to calculate the AFF and ABF in Equation (24). The predicted permeability coefficients could also be obtained from Equation (24). The predicted permeability coefficients from fractal analysis versus the measured permeability coefficients are presented in Figure 16. According to Figure 16, all the points are close to the line y = x, so the accuracy of predicting the permeability coefficient by using T2c which was predicted from fractal analysis was acceptable.
In order to simplify the prediction process of the permeability coefficient based on NMR technology, fractal analysis was used in this study. The following steps can be followed to predict the permeability coefficients of clay-quartz mixtures: (1) After sample saturation, the NMR test can be carried out on a sample to get the T2 spectrum; (2) the fractal dimension can be determined by fractal analysis based on Equation (10); (3) according to the T2(T2p) corresponding to the peak signal amplitude, the type of clay mineral can be determined. The T2p values of M-Q mixtures and K-Q mixtures are around 1 and 10 ms, respectively; (4) the T2c of M-Q mixtures or K-Q mixtures can be determined by Equation (25) or (26). AFF and ABF can be calculated based on the T2 spectrum; (5) the permeability coefficient can be calculated by Equation (24).

5. Conclusions

This paper mainly focused on the permeability evaluation of clay-quartz mixtures based on NMR tests and fractal analysis. The main conclusions that can be drawn are as follows:
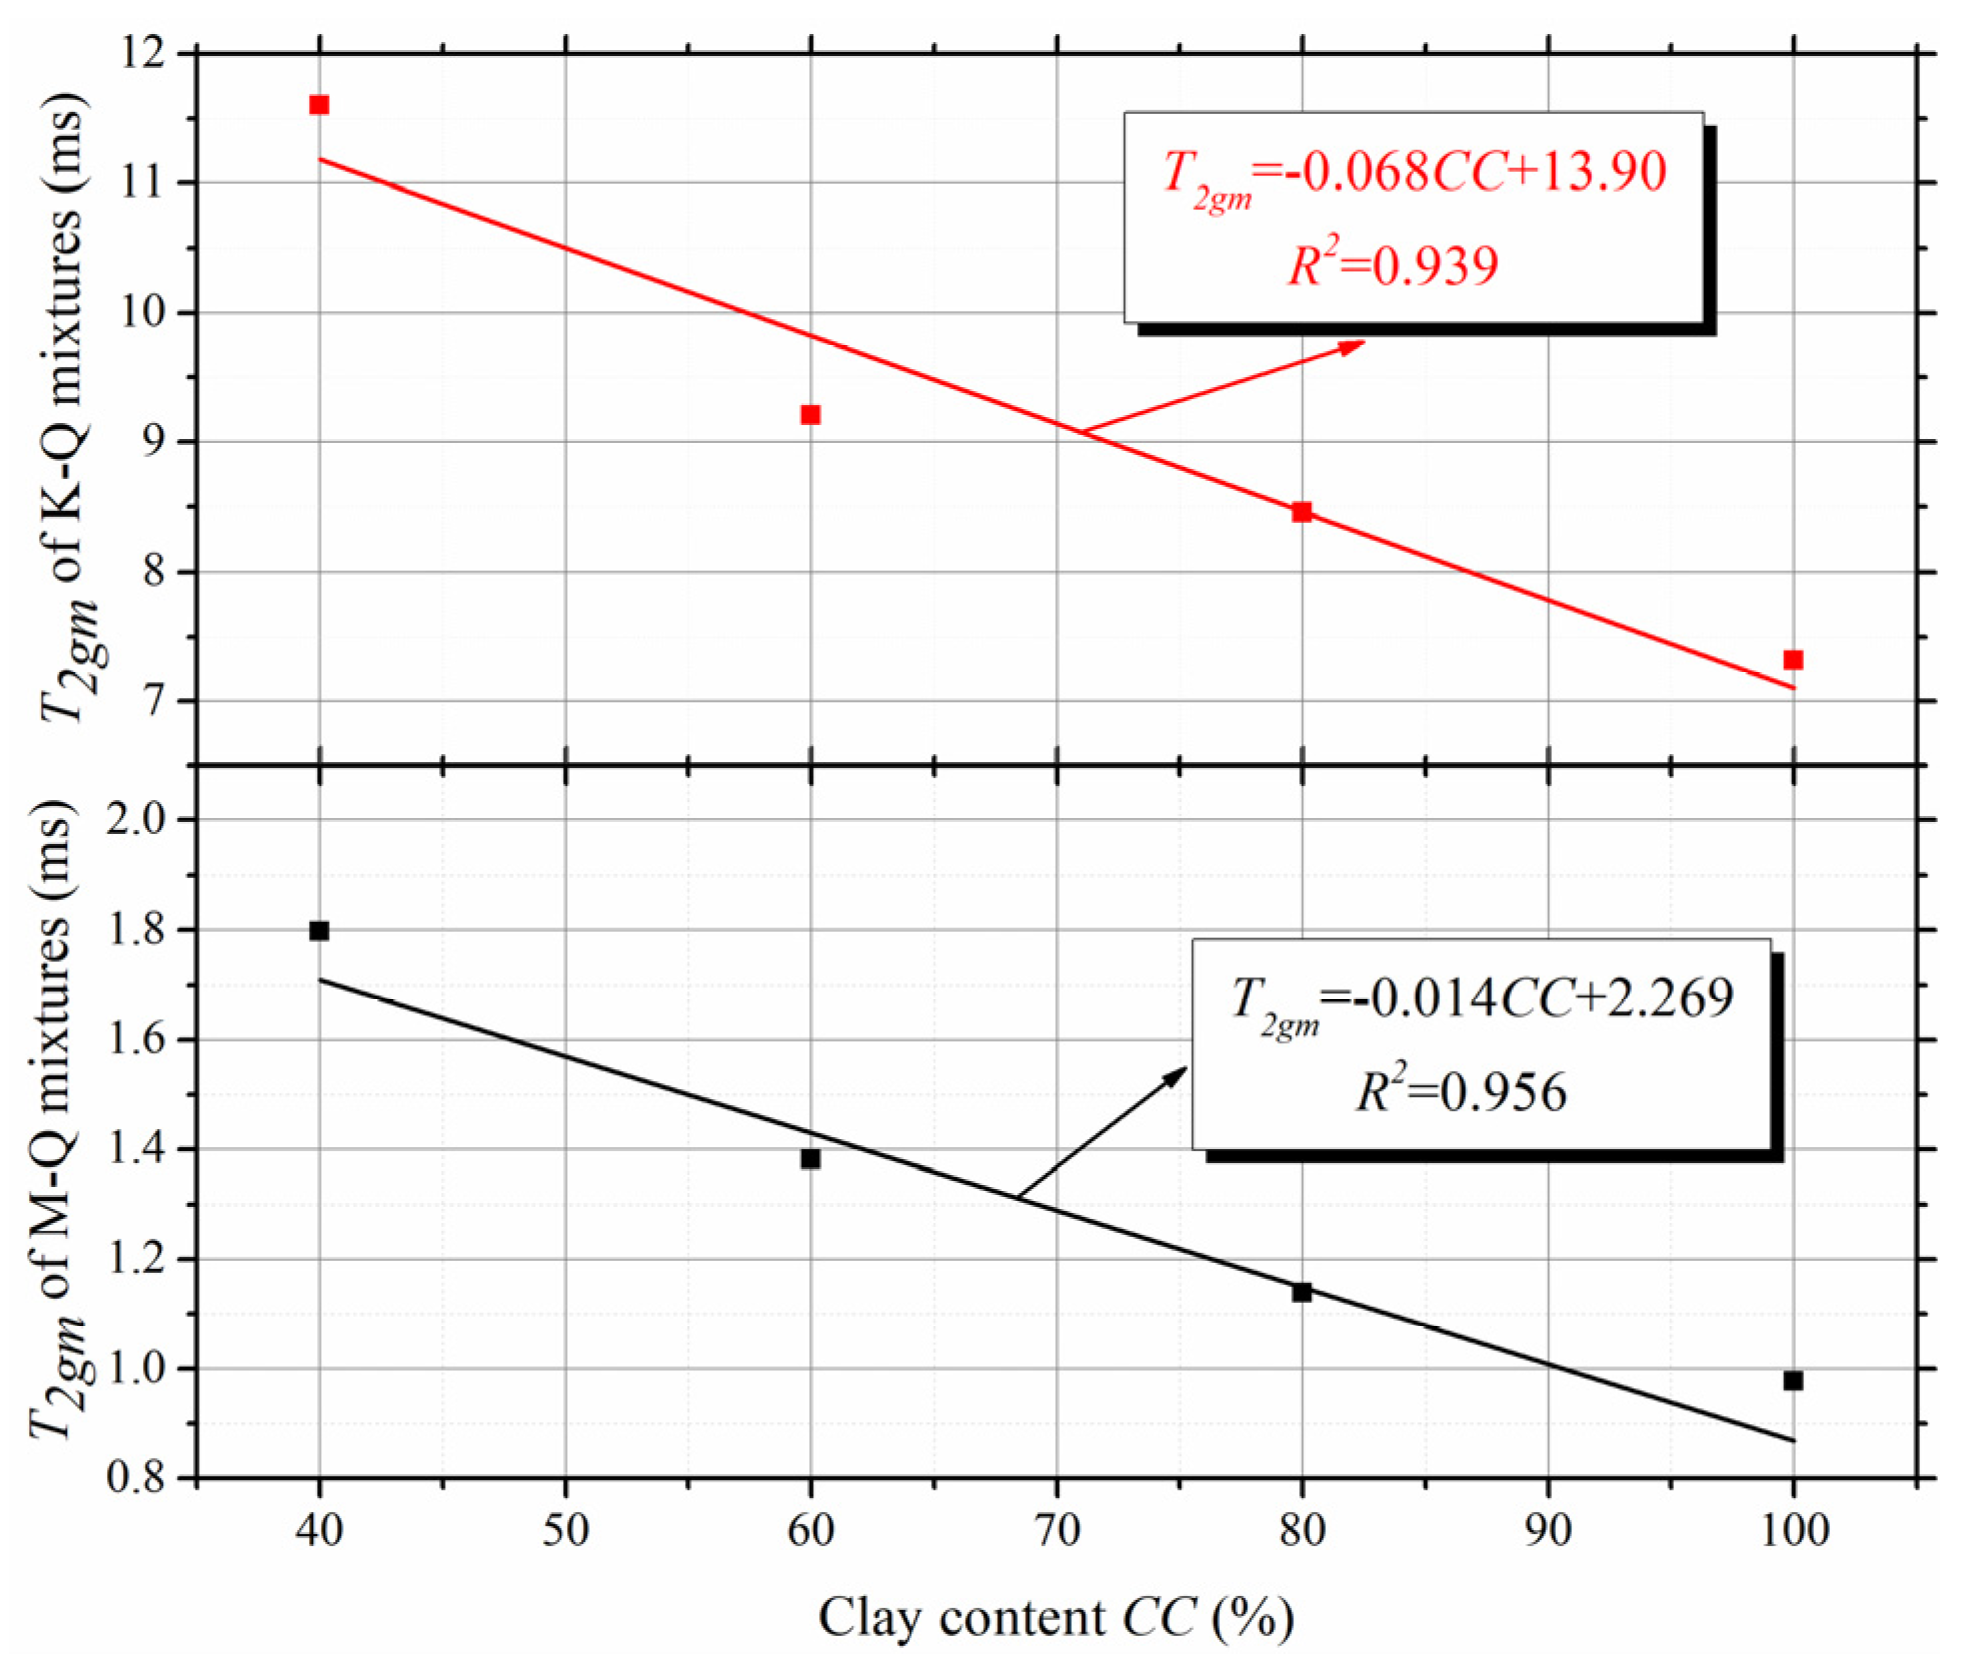
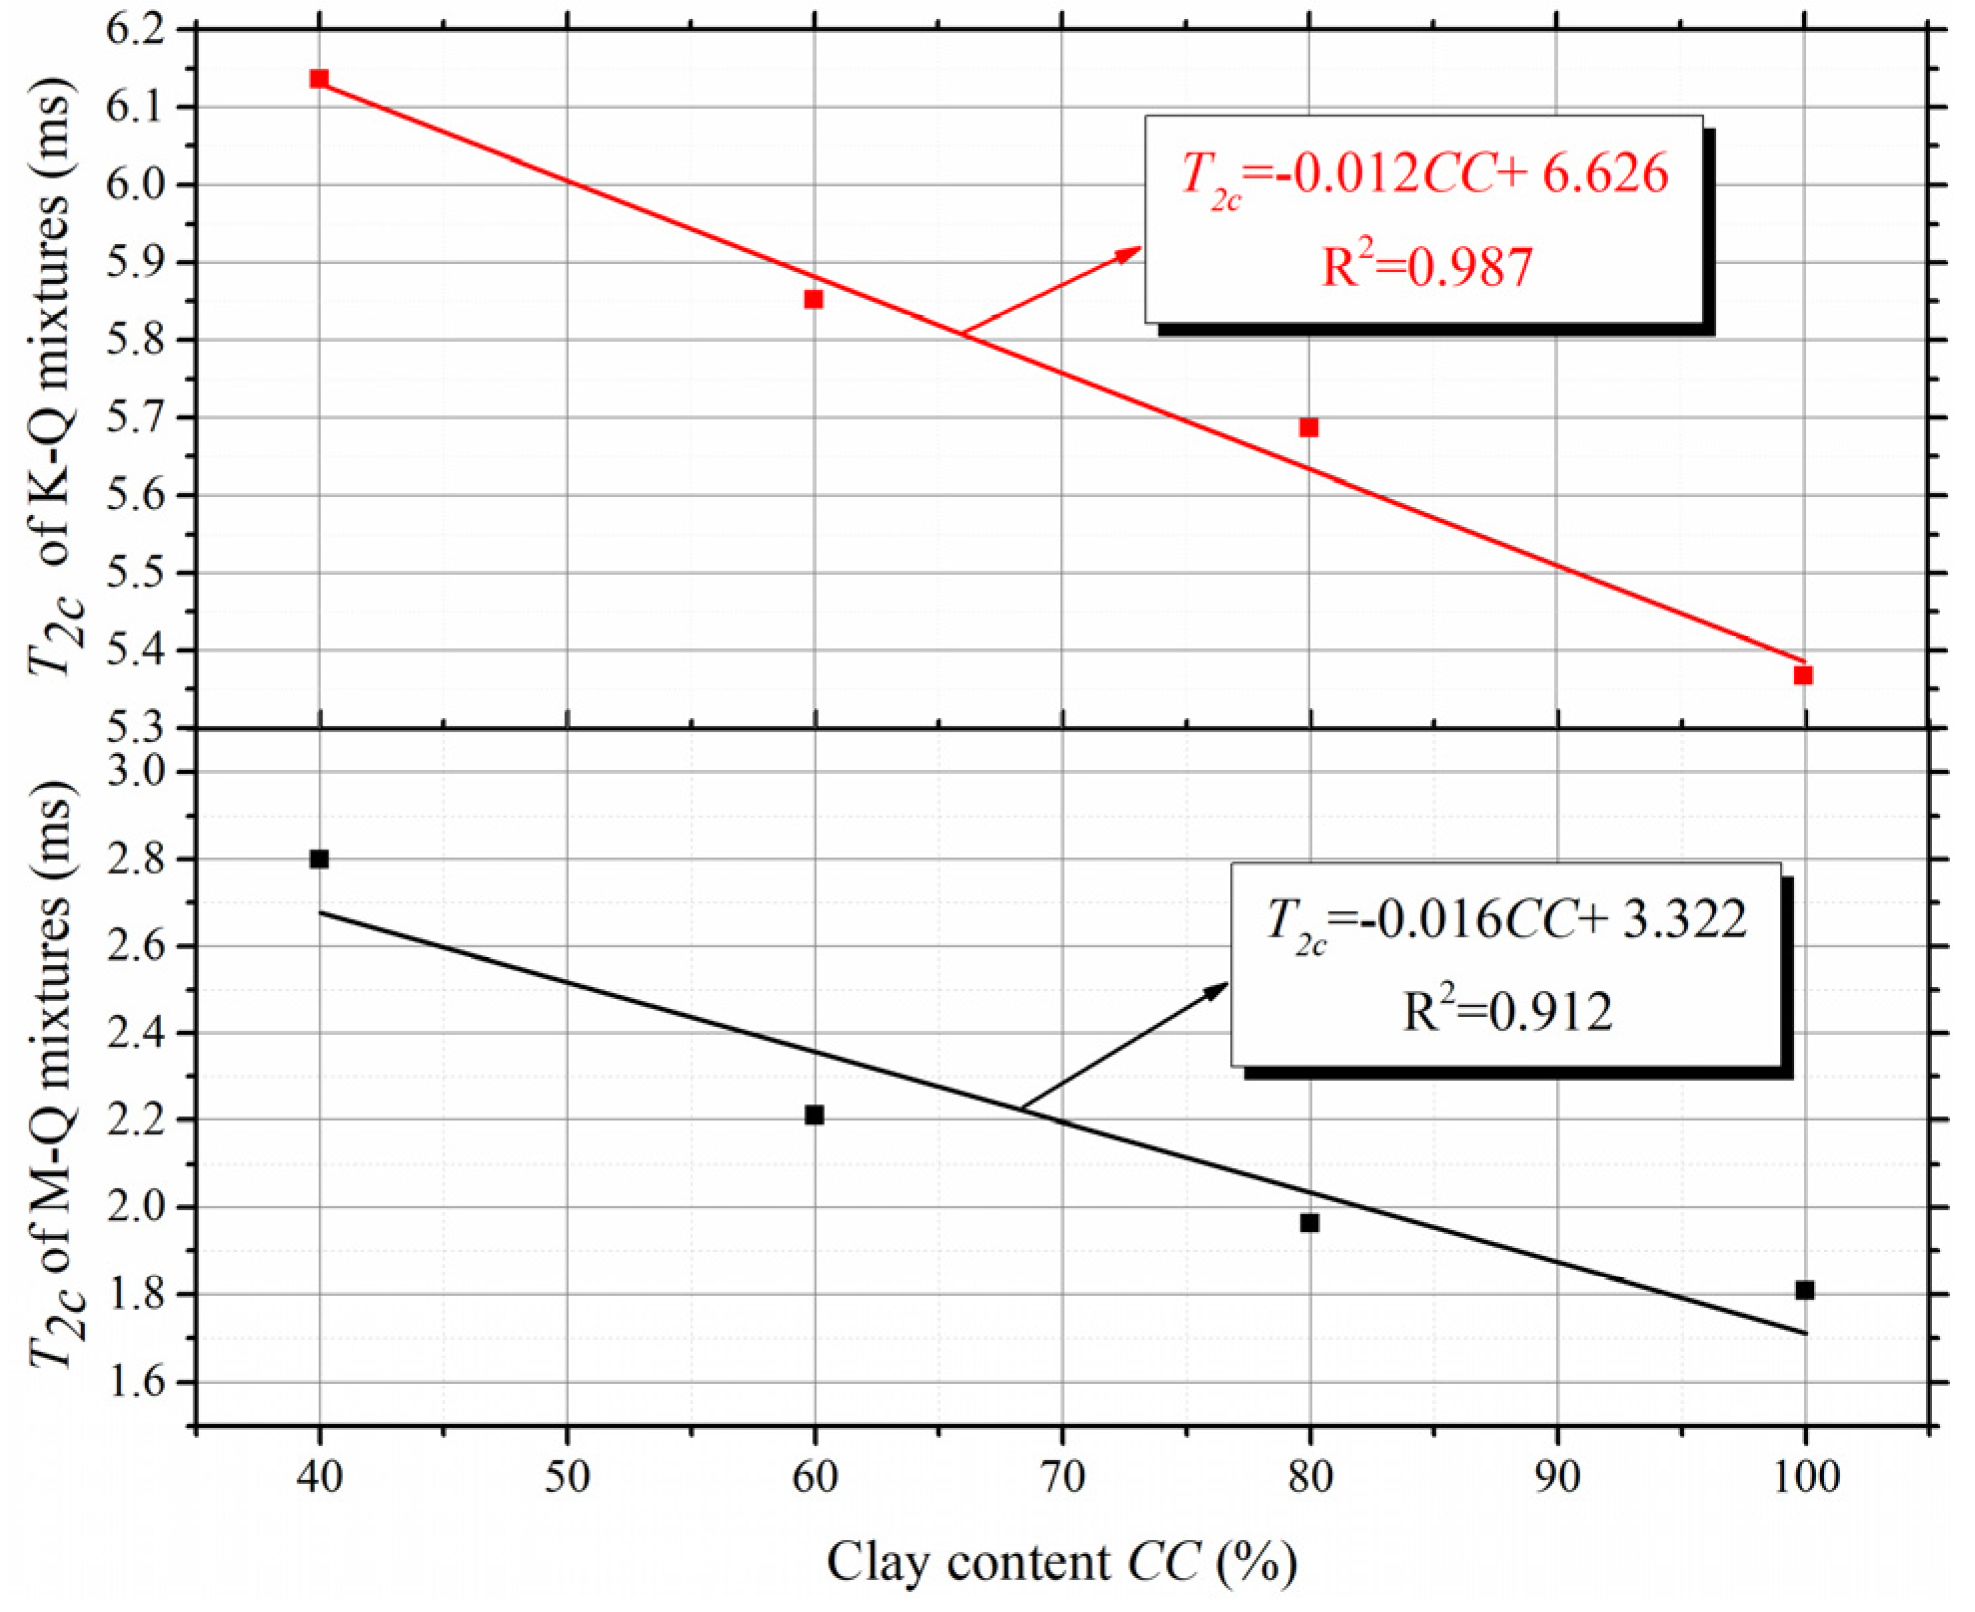
  • The T2 spectra of M-Q mixtures and K-Q mixtures are quite different. The T2p of M-Q mixtures and K-Q mixtures ranged from 1.20 to 2.25 ms and 7.84 to 11.89 ms, respectively. The T2p can be used to determine the kind of clay mineral in the clay-quartz mixture;
  • During evaporation, all the T2 spectra of clay-quartz mixtures shifted to the left. This indicated that shrinkage of the mixture volume led to a decrease of the total pore radius;
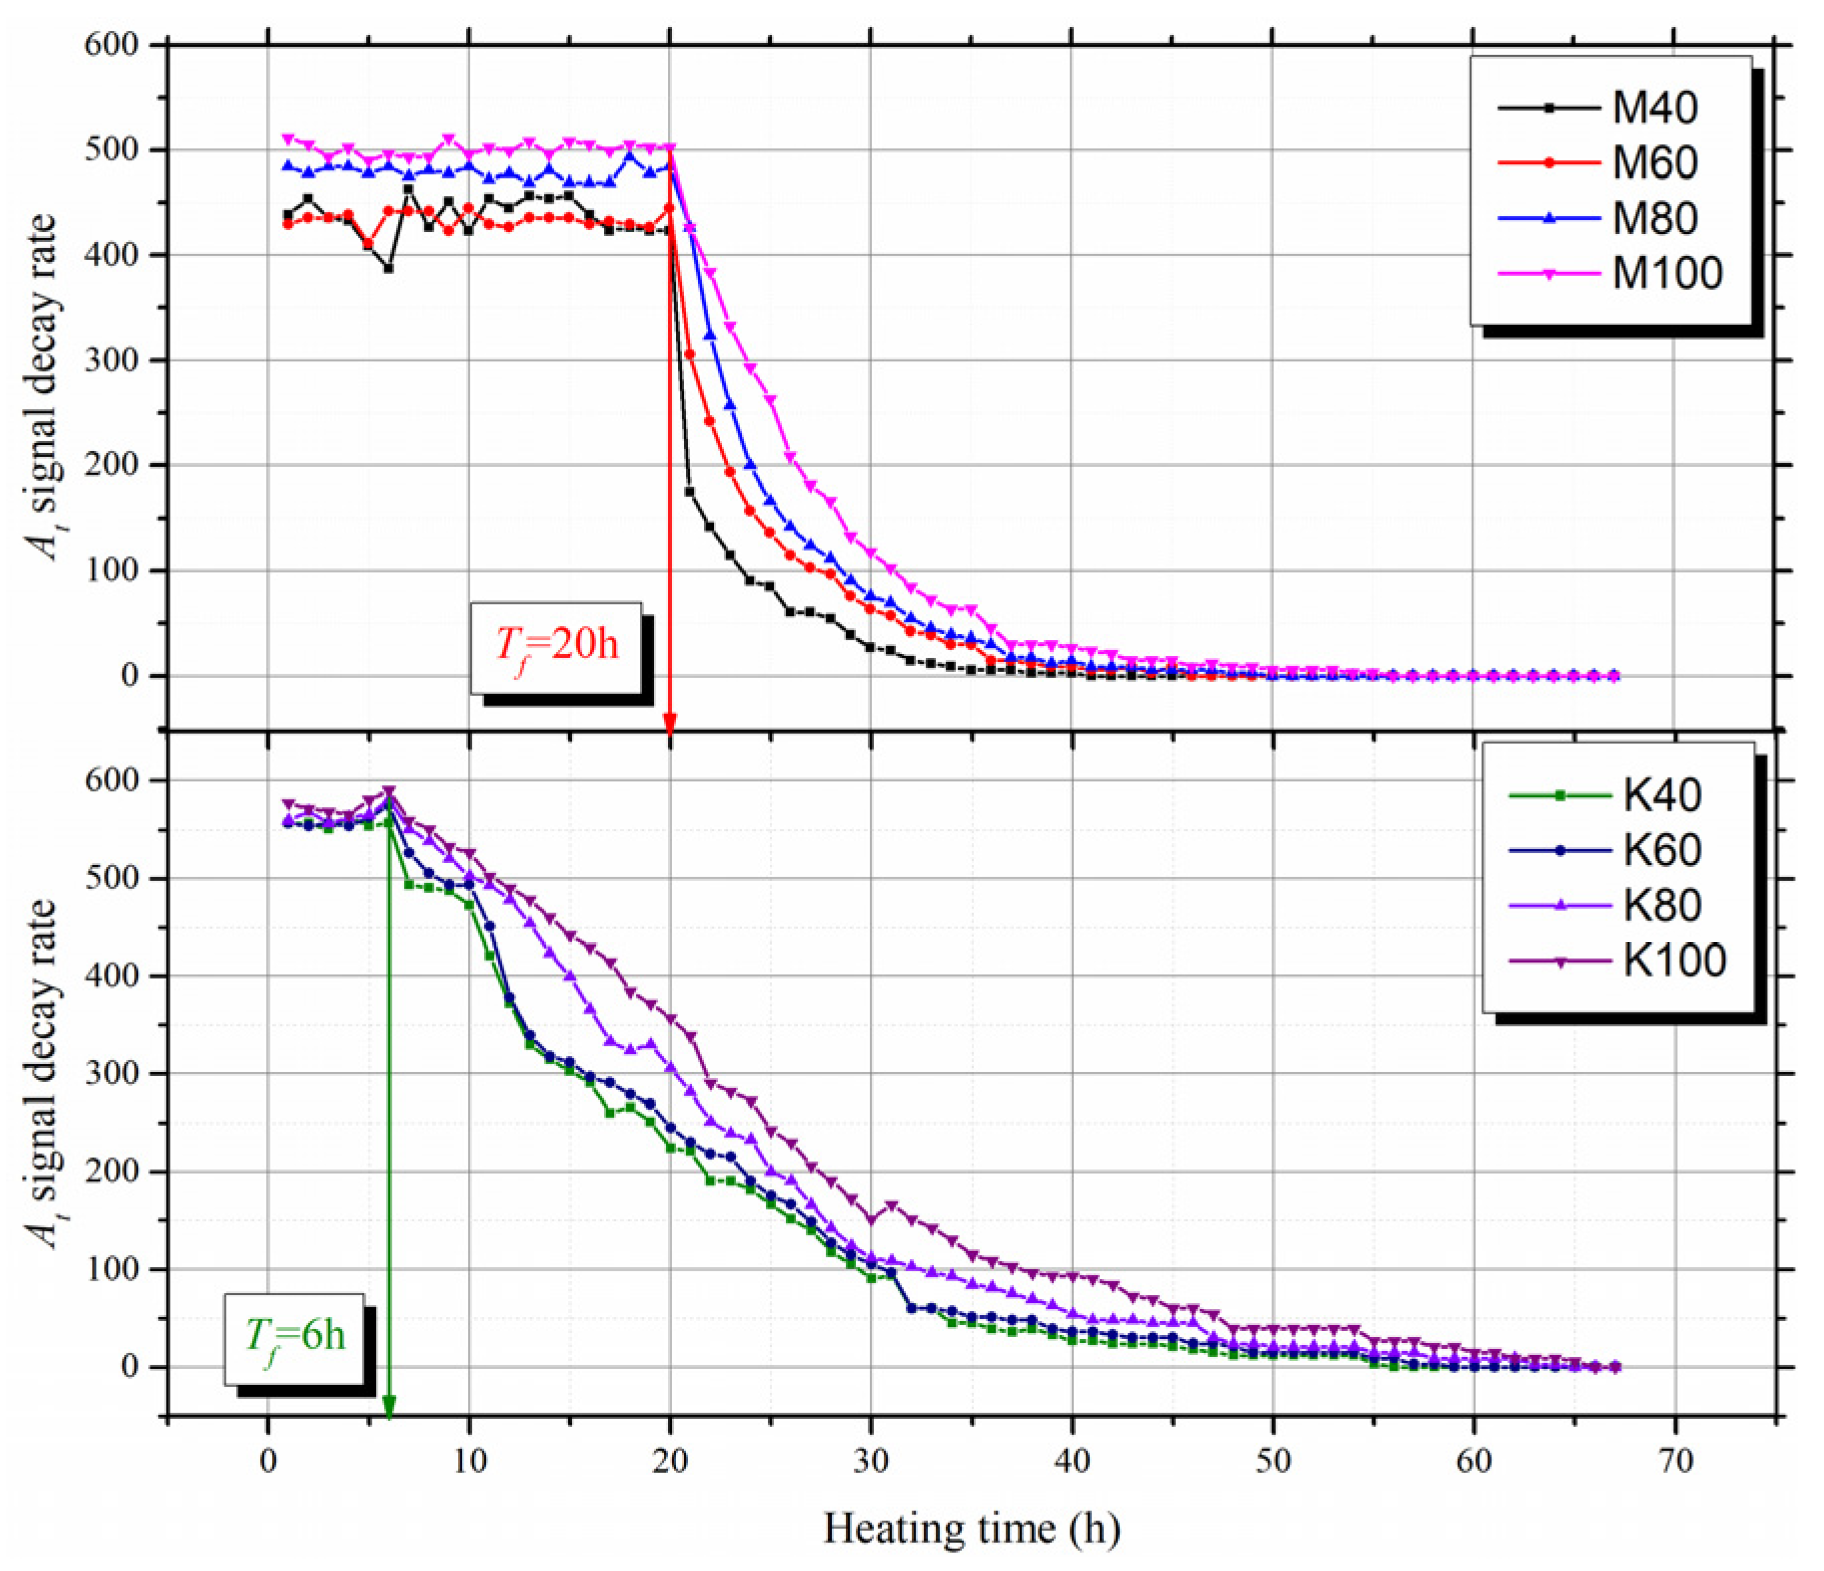
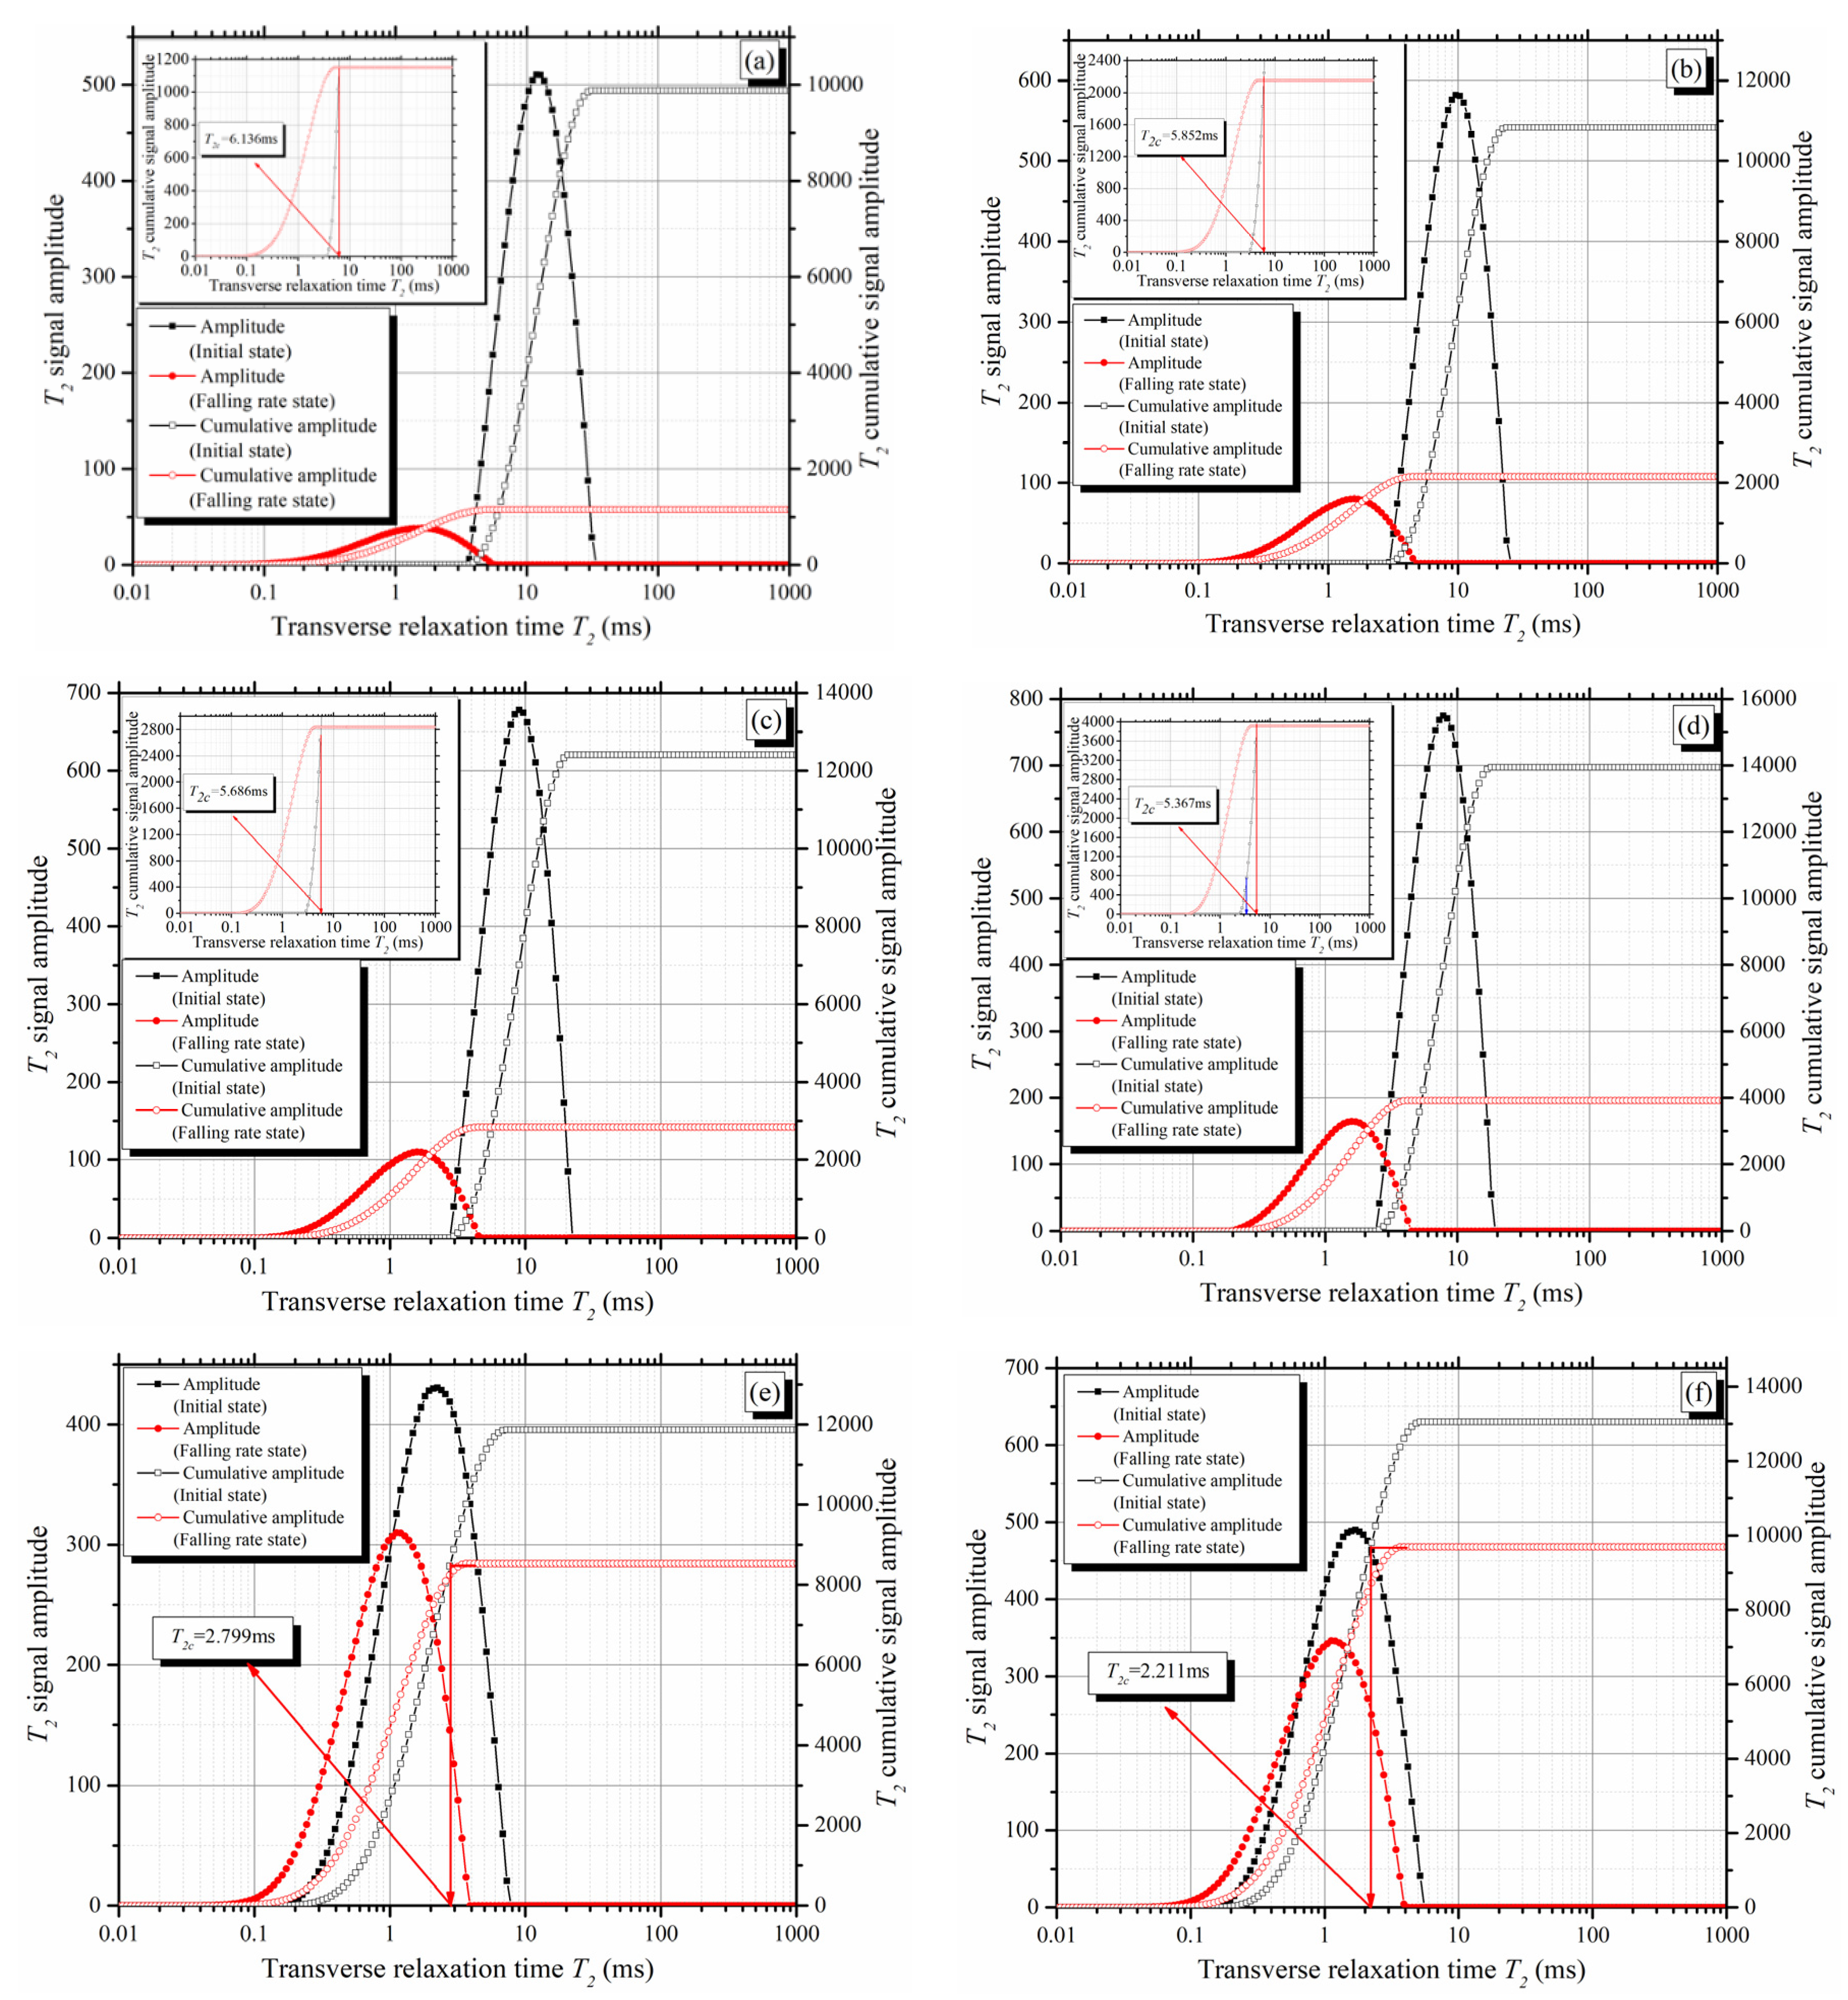
  • According to the decay rate of the T2 total signal amplitude, the evaporation process can be divided into two stages: the constant rate stage and the falling rate stage. The T2 cut-offs can be determined from the T2 spectra of the mixtures at the initial saturated state and the beginning of the falling rate stage;
  • A prediction model for permeability coefficients of clay-quartz mixtures based on the T-C model was established. The relationship between T2 cut-offs and fractal dimensions of T2 spectra of saturated mixtures was also proposed. Based on these, a simplified method for predicting permeability coefficients of clay-quartz mixtures by using only the T2 spectrum of saturated samples without centrifugal and evaporation tests was established. Compared with the traditional method, which is effort- and time-consuming, the new prediction method proposed in this study can determine the permeability coefficients of clay-quartz mixtures rapidly, nondestructively, and accurately.

Author Contributions

Conceptualization, Z.L., A.S., and W.W.; methodology, Z.L., A.S., and W.W.; software, Z.L., A.S., and W.W.; validation, Z.L. and W.W.; formal analysis, Z.L.; investigation, Z.L.; resources, Z.L. and A.S.; data curation, Z.L.; writing—original draft preparation, Z.L.; writing—review and editing, A.S. and W.W.; visualization, Z.L. and W.W.; supervision, A.S.; project administration, A.S.; funding acquisition, A.S. All authors have read and agreed to the published version of the manuscript.

Funding

This research was funded by the National Key Research and Development Program of China, grant number 2018YFB1600200.

Conflicts of Interest

The authors declare no conflicts of interest. There are no personal circumstances or interests that may be perceived as inappropriately influencing the representation or interpretation of the reported research results. The funders had no role in the design of the study; in the collection, analyses, or interpretation of data; in the writing of the manuscript; or in the decision to publish the results.

References

  1. Regadio, M.; Ruiz, A.I.; Rodriguez-Rastrero, M.; Cuevas, J. Containment and attenuating layers: An affordable strategy that preserves soil and water from landfill pollution. Waste Manag. 2015, 46, 408–419. [Google Scholar] [CrossRef] [Green Version]
  2. Al Rashid, Q.A.; Abuel-Naga, H.M.; Leong, E.C.; Lu, Y.; Al Abadi, H. Experimental-artificial intelligence approach for characterizing electrical resistivity of partially saturated clay liners. Appl. Clay Sci. 2018, 156, 1–10. [Google Scholar] [CrossRef]
  3. Karunaratne, G.P.; Chew, S.H.; Lee, S.L.; Sinha, A.N. Bentonite:Kaolinite clay liner. Geosynth. Int. 2001, 8, 113–133. [Google Scholar] [CrossRef]
  4. Zhao, Q.; Choo, H.; Bhatt, A.; Burns, S.E.; Bate, B. Review of the fundamental geochemical and physical behaviors of organoclays in barrier applications. Appl. Clay Sci. 2017, 142, 2–20. [Google Scholar] [CrossRef]
  5. Dolinar, B. Predicting the hydraulic conductivity of saturated clays using plasticity-value correlations. Appl. Clay Sci. 2009, 45, 90–94. [Google Scholar] [CrossRef]
  6. De Camillis, M.; Di Emidio, G.; Bezuijen, A.; Verastegui Flores, D.; Van Stappen, J.; Cnudde, V. Effect of wet-dry cycles on polymer treated bentonite in seawater: Swelling ability, hydraulic conductivity and crack analysis. Appl. Clay Sci. 2017, 142, 52–59. [Google Scholar] [CrossRef]
  7. Lubelli, B.; de Winter, D.A.M.; Post, J.A.; van Hees, R.P.J.; Drury, M.R. Cryo-FIB–SEM and MIP study of porosity and pore size distribution of bentonite and kaolin at different moisture contents. Appl. Clay Sci. 2013, 80–81, 358–365. [Google Scholar] [CrossRef]
  8. Thom, R.; Sivakumar, R.; Sivakumar, V.; Murray, E.J.; Mackinnon, P. Pore size distribution of unsaturated compacted kaolin: The initial states and final states following saturation. Geotechnique 2007, 57, 469–474. [Google Scholar] [CrossRef]
  9. Deng, Y.F.; Wu, Z.L.; Cui, Y.J.; Liu, S.Y.; Wang, Q. Sand fraction effect on hydro-mechanical behavior of sand-clay mixture. Appl. Clay Sci. 2017, 135, 355–361. [Google Scholar] [CrossRef] [Green Version]
  10. Tiwari, B.; Ajmera, B. A new correlation relating the shear strength of reconstituted soil to the proportions of clay minerals and plasticity characteristics. Appl. Clay Sci. 2011, 53, 48–57. [Google Scholar] [CrossRef]
  11. Zhang, H.Y.; Tan, Y.; Zhu, F.; He, D.J.; Zhu, J.H. Shrinkage property of bentonite-sand mixtures as influenced by sand content and water salinity. Constr. Build. Mater. 2019, 224, 78–88. [Google Scholar] [CrossRef]
  12. Watabe, Y.; Yamada, K.; Saitoh, K. Hydraulic conductivity and compressibility of mixtures of Nagoya clay with sand or bentonite. Geotechnique 2011, 61, 211–219. [Google Scholar] [CrossRef]
  13. Behroozmand, A.A.; Keating, K.; Auken, E. A review of the principles and applications of the NMR technique for near-surface characterization. Surv. Geophys. 2014, 36, 27–85. [Google Scholar] [CrossRef]
  14. Li, J.J.; Yin, J.X.; Zhang, Y.N.; Lu, S.F.; Wang, W.M.; Li, J.B.; Chen, F.W.; Meng, Y.L. A comparison of experimental methods for describing shale pore features—A case study in the Bohai Bay Basin of Eastern China. Int. J. Coal Geol. 2015, 152, 39–49. [Google Scholar] [CrossRef]
  15. Lyu, C.H.; Ning, Z.F.; Wang, Q.; Chen, M.Q. Application of NMR T2 to pore size distribution and movable fluid distribution in tight sandstones. Energy Fuels 2018, 32, 1395–1405. [Google Scholar] [CrossRef]
  16. Yao, Y.B.; Liu, D.M.; Che, Y.; Tang, D.Z.; Tang, S.H.; Huang, W.H. Petrophysical characterization of coals by low-field nuclear magnetic resonance (NMR). Fuel 2010, 89, 1371–1380. [Google Scholar] [CrossRef]
  17. Liu, M.; Xie, R.H.; Li, C.X.; Gao, L. A new method for determining tight sandstone permeability based on the characteristic parameters of the NMR T2 distribution. Appl. Magn. Reson. 2017, 48, 1009–1029. [Google Scholar] [CrossRef]
  18. Tan, M.J.; Mao, K.Y.; Song, X.D.; Yang, X.; Xu, J.J. NMR petrophysical interpretation method of gas shale based on core NMR experiment. J. Pet. Sci. Eng. 2015, 136, 100–111. [Google Scholar] [CrossRef]
  19. Yao, Y.B.; Liu, D.M.; Liu, J.G.; Xie, S.B. Assessing the water migration and permeability of large intact bituminous and anthracite coals using NMR relaxation spectrometry. Transp. Porous Med. 2015, 107, 527–542. [Google Scholar] [CrossRef]
  20. Ji, X.F.; Song, D.Y.; Zhao, H.T.; Li, Y.B.; He, K.K. Experimental analysis of pore and permeability characteristics of coal by low-field NMR. Appl. Sci. 2018, 8, 1374. [Google Scholar] [CrossRef] [Green Version]
  21. Coates, G.R.; Xiao, L.; Prammer, M.G. NMR Logging: Principles and Applications; Gulf Publishing Company: Houston, TX, USA, 1999. [Google Scholar]
  22. Kenyon, W.; Day, P.; Straley, C.; Willemsen, J. A three-part study of NMR longitudinal relaxation properties of water-saturated sandstones. SPE Form. Eval. 1988, 3, 622–636. [Google Scholar] [CrossRef]
  23. Timur, A. An investigation of permeability, porosity, & residual water saturation relationships for sandstone reservoirs. Log. Anal. 1968, 9, 10. [Google Scholar]
  24. Li, A.; Ding, W.L.; Wang, R.Y.; He, J.H.; Wang, X.H.; Sun, Y.X.; Gu, Y.; Jiao, N.L. Petrophysical characterization of shale reservoir based on nuclear magnetic resonance (NMR) experiment: A case study of Lower Cambrian Qiongzhusi Formation in Eastern Yunnan Province, South China. J. Nat. Gas Sci. Eng. 2017, 37, 29–38. [Google Scholar] [CrossRef]
  25. Xiao, L.; Li, J.R.; Mao, Z.Q.; Lu, J.; Yu, H.Y.; Guo, H.P.; Li, G.R. A method to determine nuclear magnetic resonance (NMR) T2 cutoff based on normal distribution simulation in tight sandstone reservoirs. Fuel 2018, 225, 472–482. [Google Scholar] [CrossRef]
  26. Zhang, Y.H.; Lebedev, M.; Al-Yaseri, A.; Yu, H.Y.; Xu, X.M.; Iglauer, S. Characterization of nanoscale rockmechanical properties and microstructures of a Chinese sub-bituminous coal. J. Nat. Gas Sci. Eng. 2018, 52, 106–116. [Google Scholar] [CrossRef]
  27. Liu, Y.; Yao, Y.B.; Liu, D.M.; Zheng, S.J.; Sun, G.X.; Chang, Y.H. Shale pore size classification: An NMR fluid typing method. Mar. Pet. Geol. 2018, 96, 591–601. [Google Scholar] [CrossRef]
  28. Testamanti, M.N.; Rezaee, R. Determination of NMR T2 cut-off for clay bound water in shales: A case study of Carynginia Formation, Perth basin, Western Australia. J. Pet. Sci. Eng. 2017, 149, 497–503. [Google Scholar] [CrossRef]
  29. Yuan, Y.J.; Rezaee, R.; Verrall, M.; Hu, S.Y.; Zou, J.; Testmanti, N. Pore characterization and clay bound water assessment in shale with a combination of NMR and low-pressure nitrogen gas adsorption. Int. J. Coal Geol. 2018, 194, 11–21. [Google Scholar] [CrossRef]
  30. Tang, C.S.; Shi, B.; Liu, C.; Gao, L.; Inyang, H.I. Experimental investigation of the desiccation cracking behavior of soil layers during drying. J. Mater. Civ. Eng. 2011, 23, 873–878. [Google Scholar] [CrossRef]
  31. Tang, C.S.; Shi, B.; Liu, C.; Suo, W.B.; Gao, L. Experimental characterization of shrinkage and desiccation cracking in thin clay layer. Appl. Clay Sci. 2011, 52, 69–77. [Google Scholar] [CrossRef]
  32. Ge, X.M.; Fan, Y.R.; Zhu, X.J.; Chen, Y.G.; Li, R.Z. Determination of nuclear magnetic resonance T2 cutoff value based on multifractal theory—An application in sandstone with complex pore structure. Geophysics 2015, 80, D11–D21. [Google Scholar] [CrossRef]
  33. Ouyang, Z.Q.; Liu, D.M.; Cai, Y.D.; Yao, Y.B. Fractal analysis on heterogeneity of pore–fractures in middle–high rank coals with NMR. Energy Fuels 2016, 30, 5449–5458. [Google Scholar] [CrossRef]
  34. Yuan, Y.J.; Rezaee, R. Fractal analysis of the pore structure for clay bound water and potential gas storage in shales based on NMR and N2 gas adsorption. J. Pet. Sci. Eng. 2019, 177, 756–765. [Google Scholar] [CrossRef]
  35. Zheng, S.J.; Yao, Y.B.; Liu, D.M.; Cai, Y.D.; Liu, Y. Characterizations of full-scale pore size distribution, porosity and permeability of coals: A novel methodology by nuclear magnetic resonance and fractal analysis theory. Int. J. Coal Geol. 2018, 196, 148–158. [Google Scholar] [CrossRef]
  36. Zheng, S.J.; Yao, Y.B.; Liu, D.M.; Cai, Y.D.; Liu, Y.; Li, X.W. Nuclear magnetic resonance T2 cutoffs of coals: A novel method by multifractal analysis theory. Fuel 2019, 241, 715–724. [Google Scholar] [CrossRef]
  37. Zhou, L.; Kang, Z.H. Fractal characterization of pores in shales using NMR: A case study from the Lower Cambrian Niutitang Formation in the Middle Yangtze Platform, Southwest China. J. Nat. Gas Sci. Eng. 2016, 35, 860–872. [Google Scholar] [CrossRef]
  38. Filgueira, R.R.; Fournier, L.L.; Cerisola, C.I.; Gelati, P.; Garcia, M.G. Particle-size distribution in soils: A critical study of the fractal model validation. Geoderma 2006, 134, 327–334. [Google Scholar] [CrossRef]
  39. Lipiec, J.; Hatano, R.; Slowinska-Jurkiewicz, A. The fractal dimension of pore distribution patterns in variously-compacted soil. Soil Tillage Res. 1998, 47, 61–66. [Google Scholar] [CrossRef]
  40. Peng, G.; Xiang, N.; Lv, S.Q.; Zhang, G.Q. Fractal characterization of soil particle-size distribution under different land-use patterns in the Yellow River Delta Wetland in China. J. Soils Sediments 2014, 14, 1116–1122. [Google Scholar] [CrossRef]
  41. Xu, Y.F.; Sun, D.A. A fractal model for soil pores and its application to determination of water permeability. Physica A 2002, 316, 56–64. [Google Scholar] [CrossRef]
  42. Jaeger, F.; Rudolph-Mohr, N.; Lang, F.; Schaumann, G.E. Effects of soil solution’s constituents on proton NMR relaxometry of soil samples. Soil Sci. Soc. Am. J. 2008, 72, 1694–1707. [Google Scholar] [CrossRef]
  43. Meyer, M.; Buchmann, C.; Schaumann, G.E. Determination of quantitative pore-size distribution of soils with 1H NMR relaxometry. Eur. J. Soil Sci. 2018, 69, 393–406. [Google Scholar] [CrossRef]
  44. Tian, H.H.; Wei, C.F.; Wei, H.Z.; Zhou, J.Z. Freezing and thawing characteristics of frozen soils: Bound water content and hysteresis phenomenon. Cold Reg. Sci. Technol. 2014, 103, 74–81. [Google Scholar] [CrossRef]
  45. Tao, G.L.; Chen, Y.; Kong, L.W.; Xiao, H.L.; Chen, Q.S.; Xia, Y.X. A simple fractal-based model for soil-water characteristic curves incorporating effects of initial void ratios. Energies 2018, 11, 1419. [Google Scholar] [CrossRef] [Green Version]
  46. Tao, G.L.; Chen, Y.; Xiao, H.L.; Chen, Q.S.; Wan, J. Determining soil-water characteristic curves from mercury intrusion porosimeter test data using fractal theory. Energies 2019, 12, 752. [Google Scholar] [CrossRef] [Green Version]
  47. Zhang, J.R.; Tao, G.L.; Huang, L.; Yuan, L. Porosity models for determining the pore-size distribution of rocks and soils and their applications. Chin. Sci. Bull. 2010, 55, 3960–3970. [Google Scholar] [CrossRef]
  48. Tao, G.L.; Zhang, J.R. Two categories of fractal models of rock and soil expressing volume and size-distribution of pores and grains. Chin. Sci. Bull. 2009, 54, 4458–4467. [Google Scholar] [CrossRef] [Green Version]
  49. Carr, H.Y.; Purcell, E.M. Effects of diffusion on free precession in nuclear magnetic resonance experiments. Phys. Rev. 1954, 94, 630–638. [Google Scholar] [CrossRef]
  50. Meiboom, S.; Gill, D. Modifed spin-echo method for measuring nuclear relaxation times. Rev. Sci. Instrum. 1958, 29, 688–691. [Google Scholar] [CrossRef] [Green Version]
  51. Franzoni, M.B.; Levstein, P.R. Manifestations of the absence of spin diffusion in multipulse NMR experiments on diluted dipolar solids. Phys. Rev. B 2005, 72, 235410. [Google Scholar] [CrossRef] [Green Version]
  52. Petrova, M.V.; Doktorov, A.B.; Lukzen, N.N. CPMG echo amplitudes with arbitrary refocusing angle: Explicit expressions, asymptotic behavior, approximations. J. Magn. Reson. 2011, 212, 330–343. [Google Scholar] [CrossRef] [PubMed]
  53. Jaeger, F.; Bowe, S.; As, H.V.; Schaumann, G.E. Evaluation of 1H NMR relaxometry for the assessment of pore size distribution in soil samples. Eur. J. Soil Sci. 2009, 60, 1052–1064. [Google Scholar] [CrossRef]
  54. Kong, L.W.; Sayem, H.M.; Tian, H.H. Influence of drying-wetting cycles on soil-water characteristic curve of undisturbed granite residual soils and microstructure mechanism by nuclear magnetic resonance (NMR) spin-spin relaxation time (T2) relaxometry. Can. Geotech. J. 2018, 55, 208–216. [Google Scholar] [CrossRef] [Green Version]
  55. Stingaciu, L.R.; Weihermüller, L.; Haber-Pohlmeier, S.; Stapf, S.; Vereecken, H.; Pohlmeier, A. Determination of pore size distribution and hydraulic properties using nuclear magnetic resonance relaxometry: A comparative study of laboratory methods. Water Resour. Res. 2010, 46, W11510. [Google Scholar] [CrossRef] [Green Version]
  56. Song, Y.Q.; Venkataramanan, L.; Hurlimann, M.D.; Flaum, M.; Frulla, P.; Straley, C. T1-T2 correlation spectra obtained using a fast two-dimensional laplace inversion. J. Magn. Reson. 2002, 154, 261–268. [Google Scholar] [CrossRef] [PubMed]
  57. Dines, K.A.; Lytle, R.J. Computerized geophysical tomography. Proc. IEEE 1979, 67, 1065–1073. [Google Scholar] [CrossRef]
  58. Keating, K.; Falzone, S. Relating nuclear magnetic resonance relaxation time distributions to void-size distributions for unconsolidated sand packs. Geophysics 2013, 78, D461–D472. [Google Scholar] [CrossRef]
  59. Prammer, M.; Drack, E.; Bouton, J.; Gardner, J.; Coates, G.; Chandler, R.; Miller, M. Measurements of clay-bound water and total porosity by magnetic resonance logging. Log. Anal. 1996, 37, 22. [Google Scholar]
Figure 1. The grain size distributions of quartz, kaolinite, and montmorillonite. From left to right, the red curve, black curve, and blue curve indicate grain size distributions of kaolinite, montmorillonite, and curve, respectively. The particle size of quartz mineral powder is the largest among the three kinds of mineral powder.
Applsci 10 01585 g001
Figure 2. The T2 spectra of kaolinite-quartz and montmorillonite-quartz saturated mixtures. From left to right, curves with different colors and symbols with different shapes indicate T2 spectra of M100, M80, M60, M40, K100, K80, K60, and K40, respectively. According to T2p, T2 spectra could be divided into two groups. The group on the left and right are the T2 spectra of montmorillonite-quartz and kaolinite-quartz saturated mixtures, respectively.
Applsci 10 01585 g002
Figure 3. The relationship between the T2 total signal amplitude and weight of distilled water. The line is the fitting line of the points. The Equation in the box is the Equation of the line. R2 indicates the correlation coefficient of the Equation.
Applsci 10 01585 g003
Figure 4. The relationship between the T2 signal amplitude per unit weight of dry soil particles (Aum) and clay content (CC). The lines at the top and bottom indicate the relationships between the Aum and CC of montmorillonite-quartz and kaolinite-quartz mixtures, respectively. The Equations in the two boxes are the Equations of the two lines. R2 indicates the correlation coefficient of the Equation.
Applsci 10 01585 g004
Figure 5. The relationship between T2gm and the clay content (CC). The lines at the top and bottom indicate the relationships between the T2gm and CC of kaolinite-quartz (K-Q) and montmorillonite-quartz (M-Q) mixtures, respectively. The Equations in the two boxes are the Equations of the two lines. R2 indicates the correlation coefficient of the Equation.
Applsci 10 01585 g005
Figure 6. The variation of T2 spectra of montmorillonite-quartz mixtures: (a) M40; (b) M60; (c) M80; (d) M100. In (ad), from top to bottom, curves with different colors and symbols with different shapes indicate T2 spectra of montmorillonite-quartz mixtures after heating at different times. The T2 spectra in the box were enlarged and placed in the upper right corner of (ad).
Applsci 10 01585 g006
Figure 7. The variation of T2 spectra of kaolinite-quartz mixtures: (a) K40; (b) K60; (c) K80; (d) K100. In (ad), from top to bottom, curves with different colors and symbols with different shapes indicate T2 spectra of kaolinite-quartz mixtures after heating at different times. The T2 spectra in the box were enlarged and placed in the upper left corner of (ad).
Applsci 10 01585 g007
Figure 8. Variation of the T2 total signal amplitude (At) with respect to the heating time. From top to bottom, curves with different colors and symbols with different shapes indicate variation of M40, M60, M80, M100, K40, K60, K80, and K100, respectively. The scales of the Y axes of the upper and lower parts of the figure are different.
Applsci 10 01585 g008
Figure 9. Variation of the At decay rate with respect to the heating time. From top to bottom, curves with different colors and symbols with different shapes indicate variation of M40, M60, M80, M100, K40, K60, K80, and K100, respectively. The scales of the Y axes of the upper and lower parts of the figure are different. Red and olive vertical line indicate 20 and 6 h, respectively. Tf is the time when the decay rate started to fall.
Applsci 10 01585 g009
Figure 10. T2 cut-offs (T2c) of the eight mixtures: (a) K40; (b) K60; (c) K80; (d) K100; (e) M40; (f) M60; (g) M80; (h) M100. The black curve with a solid square and red curve with solid circle indicate T2 spectra of the saturated mixture before evaporation and the mixture at the beginning of the falling rate stage, respectively. The curves with an open square and open circle indicate the cumulative signal amplitude of T2 spectra with the same color. The intersection of the black curve with the open square and the red curve with the open circle was enlarged and placed in the upper left corner of (ad).
Applsci 10 01585 g010aApplsci 10 01585 g010b
Figure 11. The relationships between T2c and the clay content (CC). The lines at the top and bottom indicate the relationships between the T2c and CC of kaolinite-quartz (K-Q) and montmorillonite-quartz (M-Q) mixtures, respectively. The Equations in the two boxes are the Equations of the two lines. R2 indicates the correlation coefficient of the Equation.
Applsci 10 01585 g011
Figure 12. The predicted permeability coefficients versus the measured permeability coefficients. Red solid line indicates a slope of 1:1. The closer the black point is to the line, the smaller the difference between the predicted and measured permeability coefficient is.
Applsci 10 01585 g012
Figure 13. The fractal dimensions (D) of the eight mixtures: (a) K40; (b) K60; (c) K80; (d) K100; (e) M40; (f) M60; (g) M80; (h) M100. The red solid line is the fitting line of the red circular point. The Equation in the box is the Equation of the line. R2 indicates the correlation coefficient of the Equation. D was calculated by Equation (11).
Applsci 10 01585 g013aApplsci 10 01585 g013b
Figure 14. The relationships between T2c and fractal dimensions (D). The lines at the top and bottom indicate the relationships between T2c and D of kaolinite-quartz (K-Q) and montmorillonite-quartz (M-Q) mixtures, respectively. The Equations in the two boxes are the Equations of the two lines. R2 indicates the correlation coefficient of the Equation.
Applsci 10 01585 g014
Figure 15. The predicted T2c versus the measured T2c. Red solid line indicates a slope of 1:1. The closer the black point is to the line, the smaller the difference between the predicted and measured T2c is.
Applsci 10 01585 g015
Figure 16. The predicted permeability coefficients from fractal analysis versus the measured permeability coefficients. Red solid line indicates a slope of 1:1. The closer the black point is to the line, the smaller the difference between the predicted and measured permeability coefficient is.
Applsci 10 01585 g016
Table 1. Basic properties of quartz, kaolinite, and montmorillonite used in this study.
Property.Materials
QuartzKaoliniteMontmorillonite
Atterberg limits
Plastic limit (%)32.0061.34
Liquid limit (%)68.99178.65
Plasticity index36.99117.31
Grain size distribution
Clay (%;<0.005 mm)1.6370.2384.10
Silt (%; 0.005–0.075 mm)4.1529.7715.90
Sand (%; >0.075 mm)94.2200
Chemical composition
SiO2 (%)98.8557.8266.63
Al2O3 (%)0.5735.2416.07
K2O (%)3.89
Fe2O3 (%)0.081.866.50
CaO (%)0.183.99
MgO (%)0.375.32
Specific gravity2.682.762.61
ClassificationCHCH

