Author Contributions
Conceptualization, Y.J.C. and J.-T.T.; Methodology, Y.J.C.; Software, Y.J.C.; Validation, Y.J.C. and F.-I.C.; Formal Analysis, Y.J.C.; Investigation, Y.J.C. and W.-H.H.; Resources, C.-W.C.; Data Curation, C.-W.C.; Writing-Original Draft Preparation, Y.J.C.; Writing-Review & Editing, W.-H.H.; Visualization, Y.J.C.; Supervision, Y.J.C.; Project Administration, Y.J.C. and J.-T.T.; Funding Acquisition, F.-I.C. All authors have read and agreed to the published version of the manuscript.
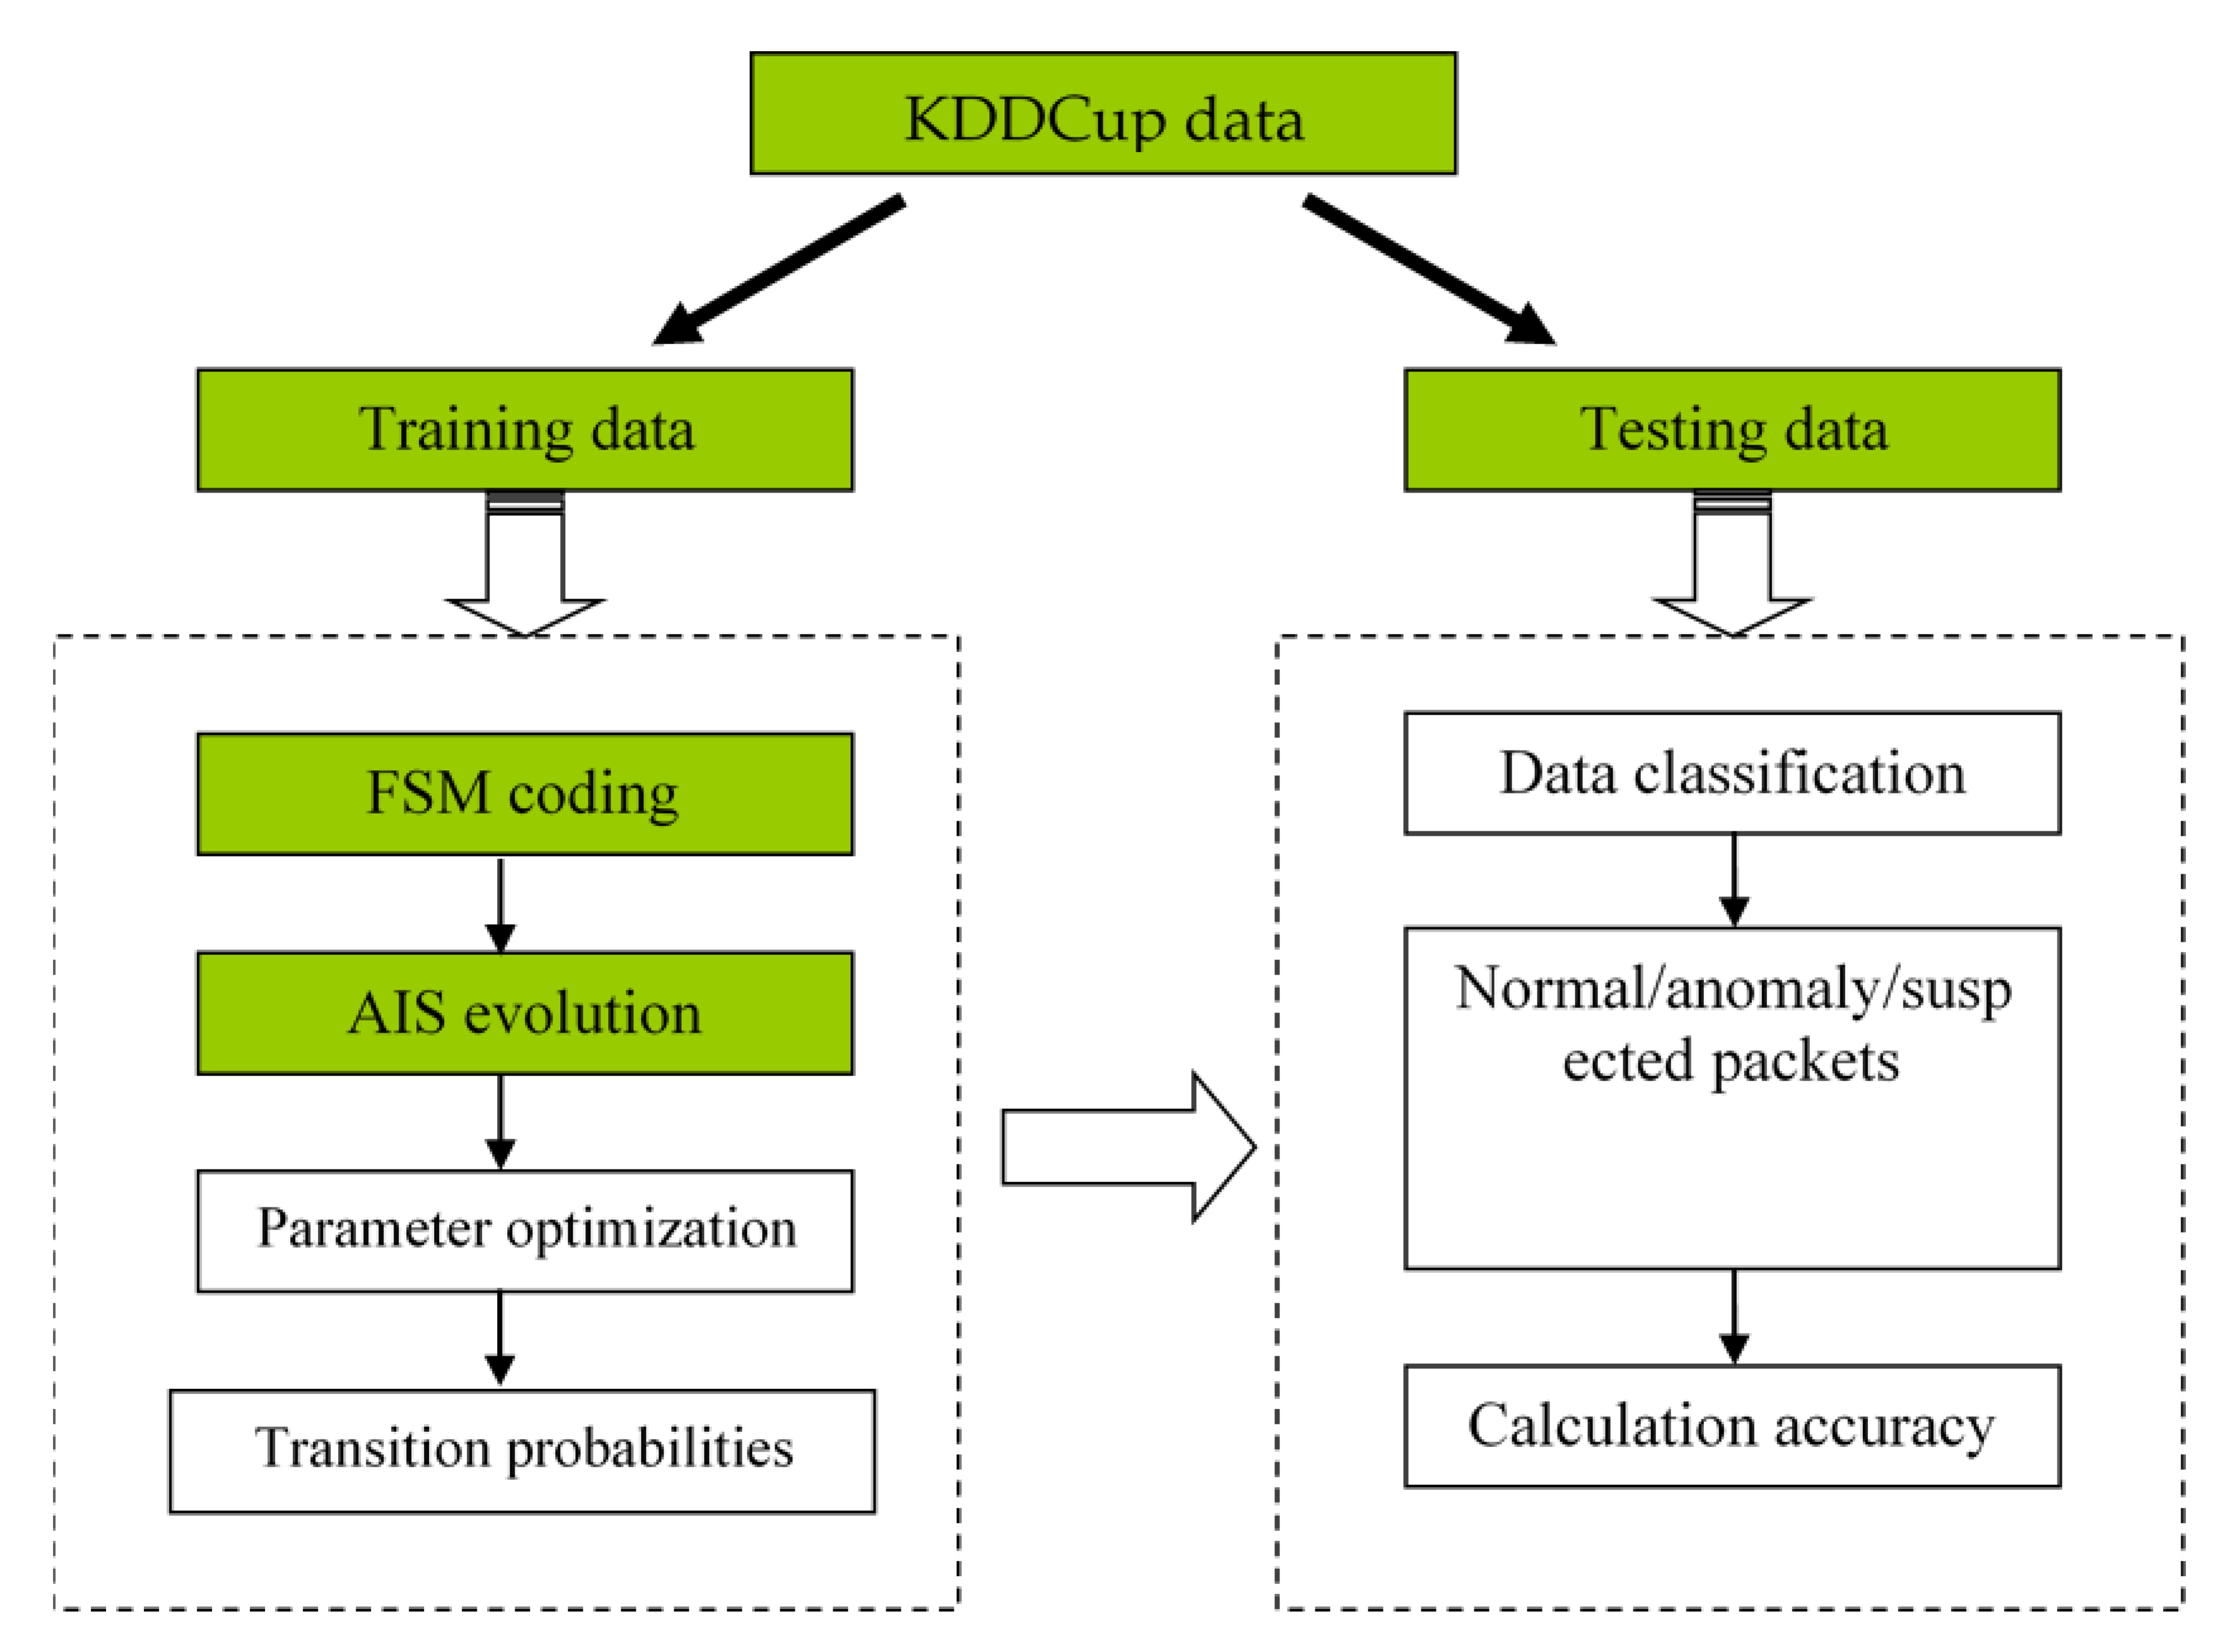
Figure 1.
Procedures for the intrusion detection experiment. A dataset is divided to training and testing sets. The training set is used to adjust transition probabilities of FSMs via AIS according to known attack types. The testing set is used to calculate classification accuracy of trained FSMs by pretending that the attack types were unknown.
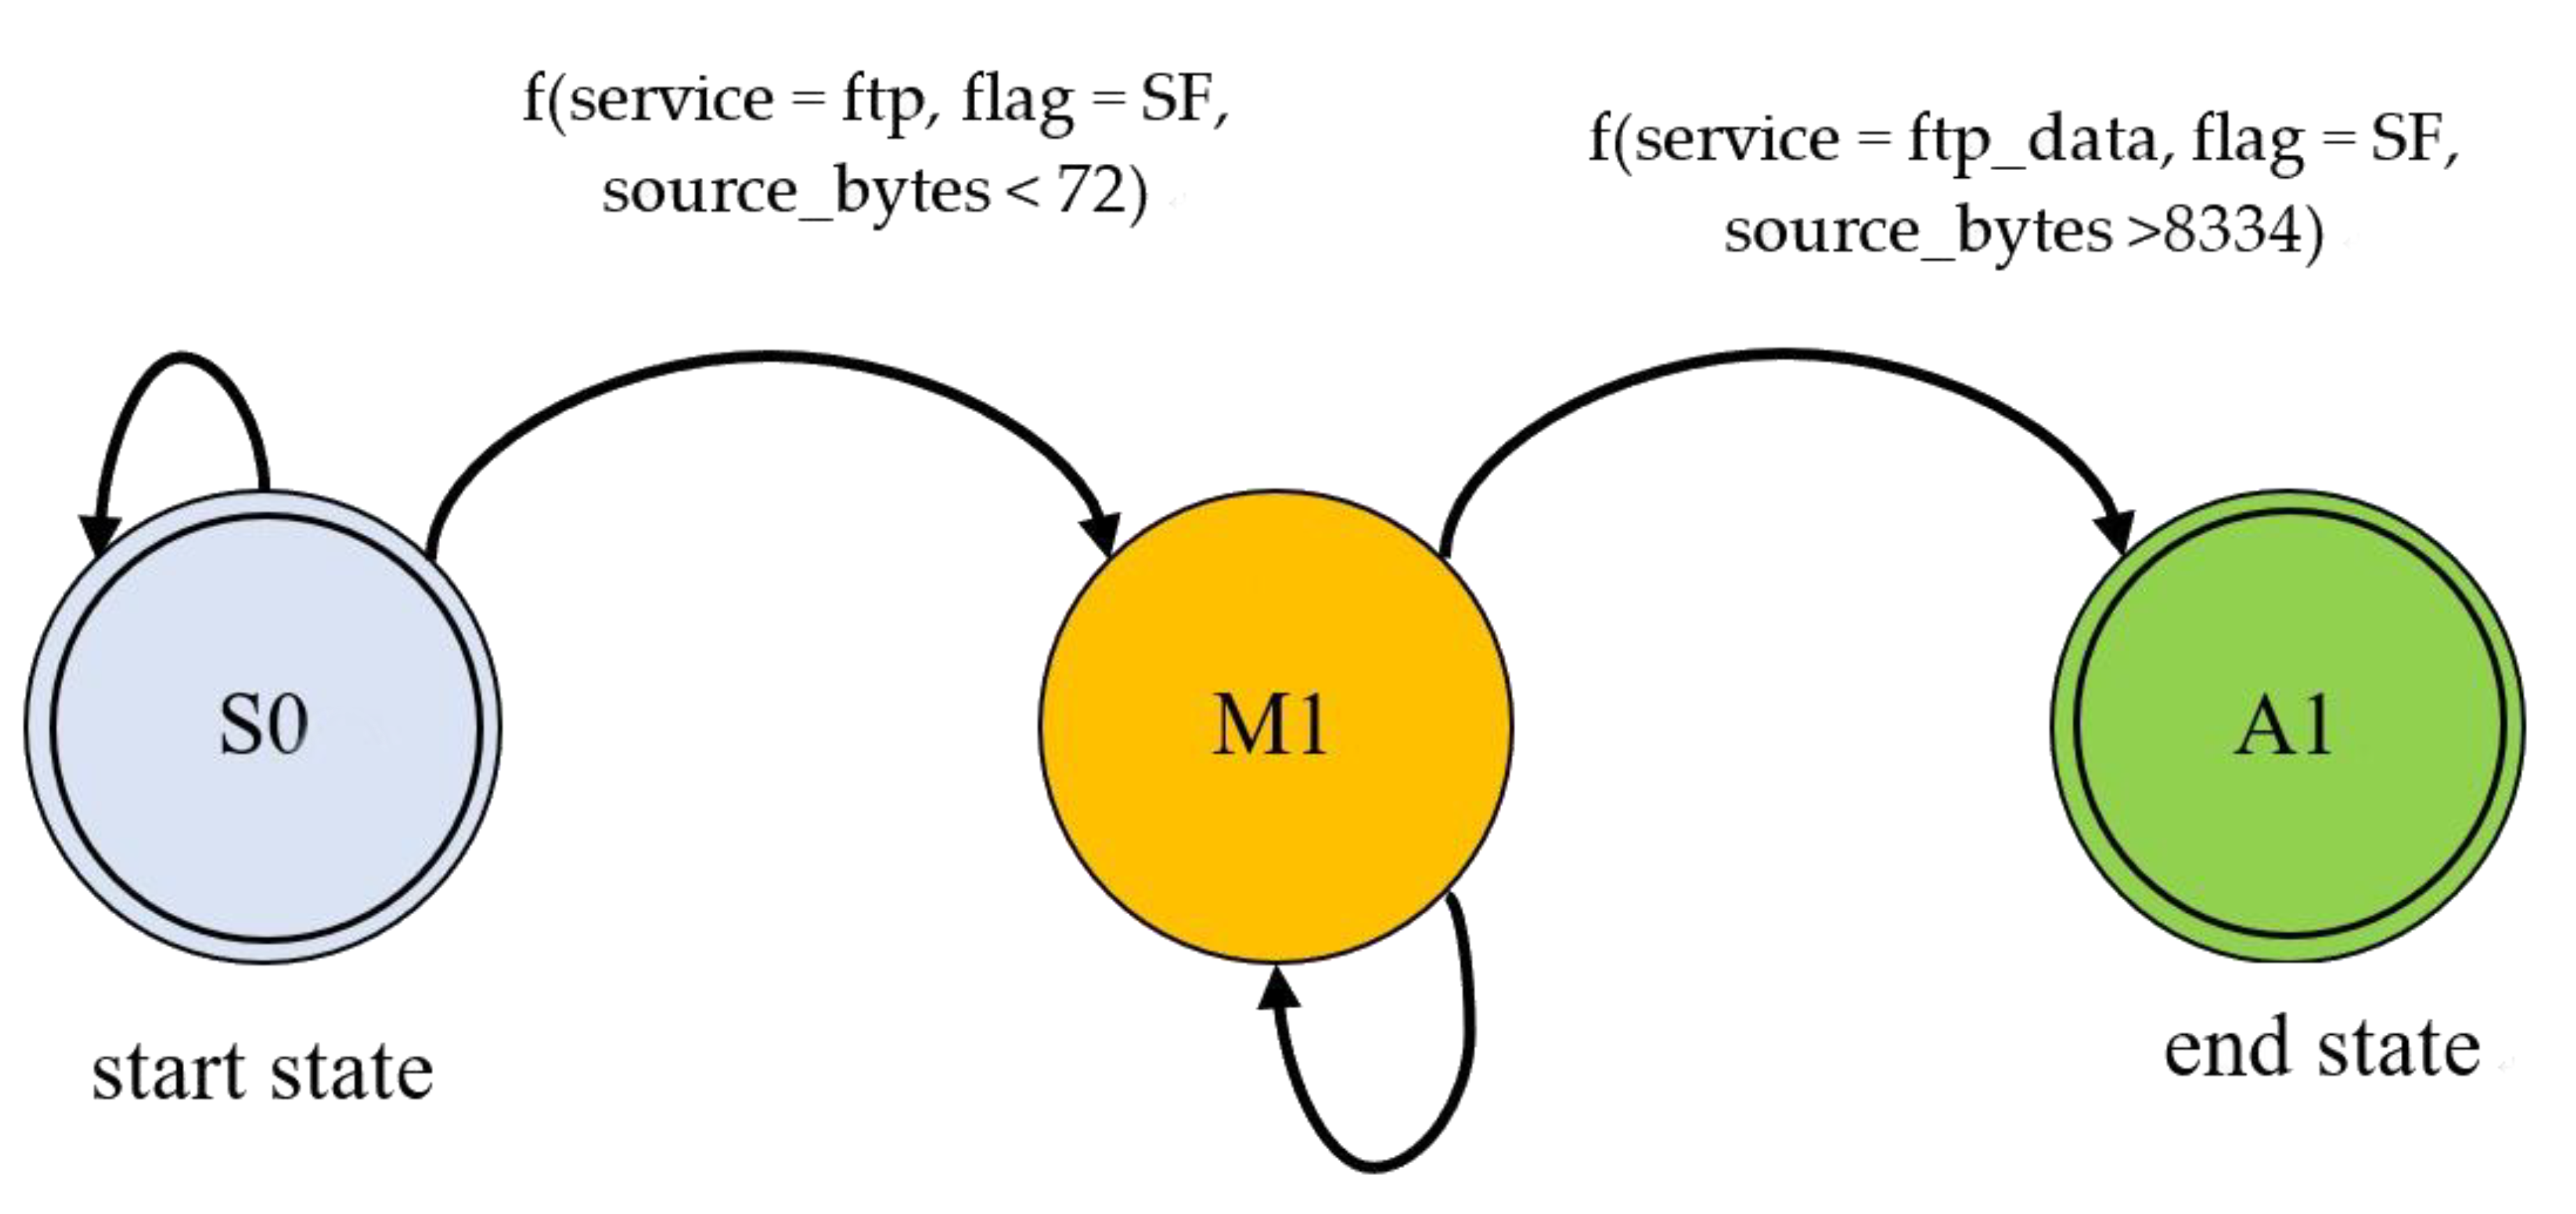
Figure 2.
An illustration explaining the mechanism of state transition for detecting warezmaster among irrelevant packets. At beginning, a suspicious attack is detected, f(service = ftp, flag = SF, source bytes < 72), but the attack activity cannot be certain completely. Therefore, state M1 is entered and the next state will be determined by further information. If sufficient evidence is observed, f(service = ftp data, flag = SF, source bytes > 8334), state A1 is entered and the attack is captured completely.
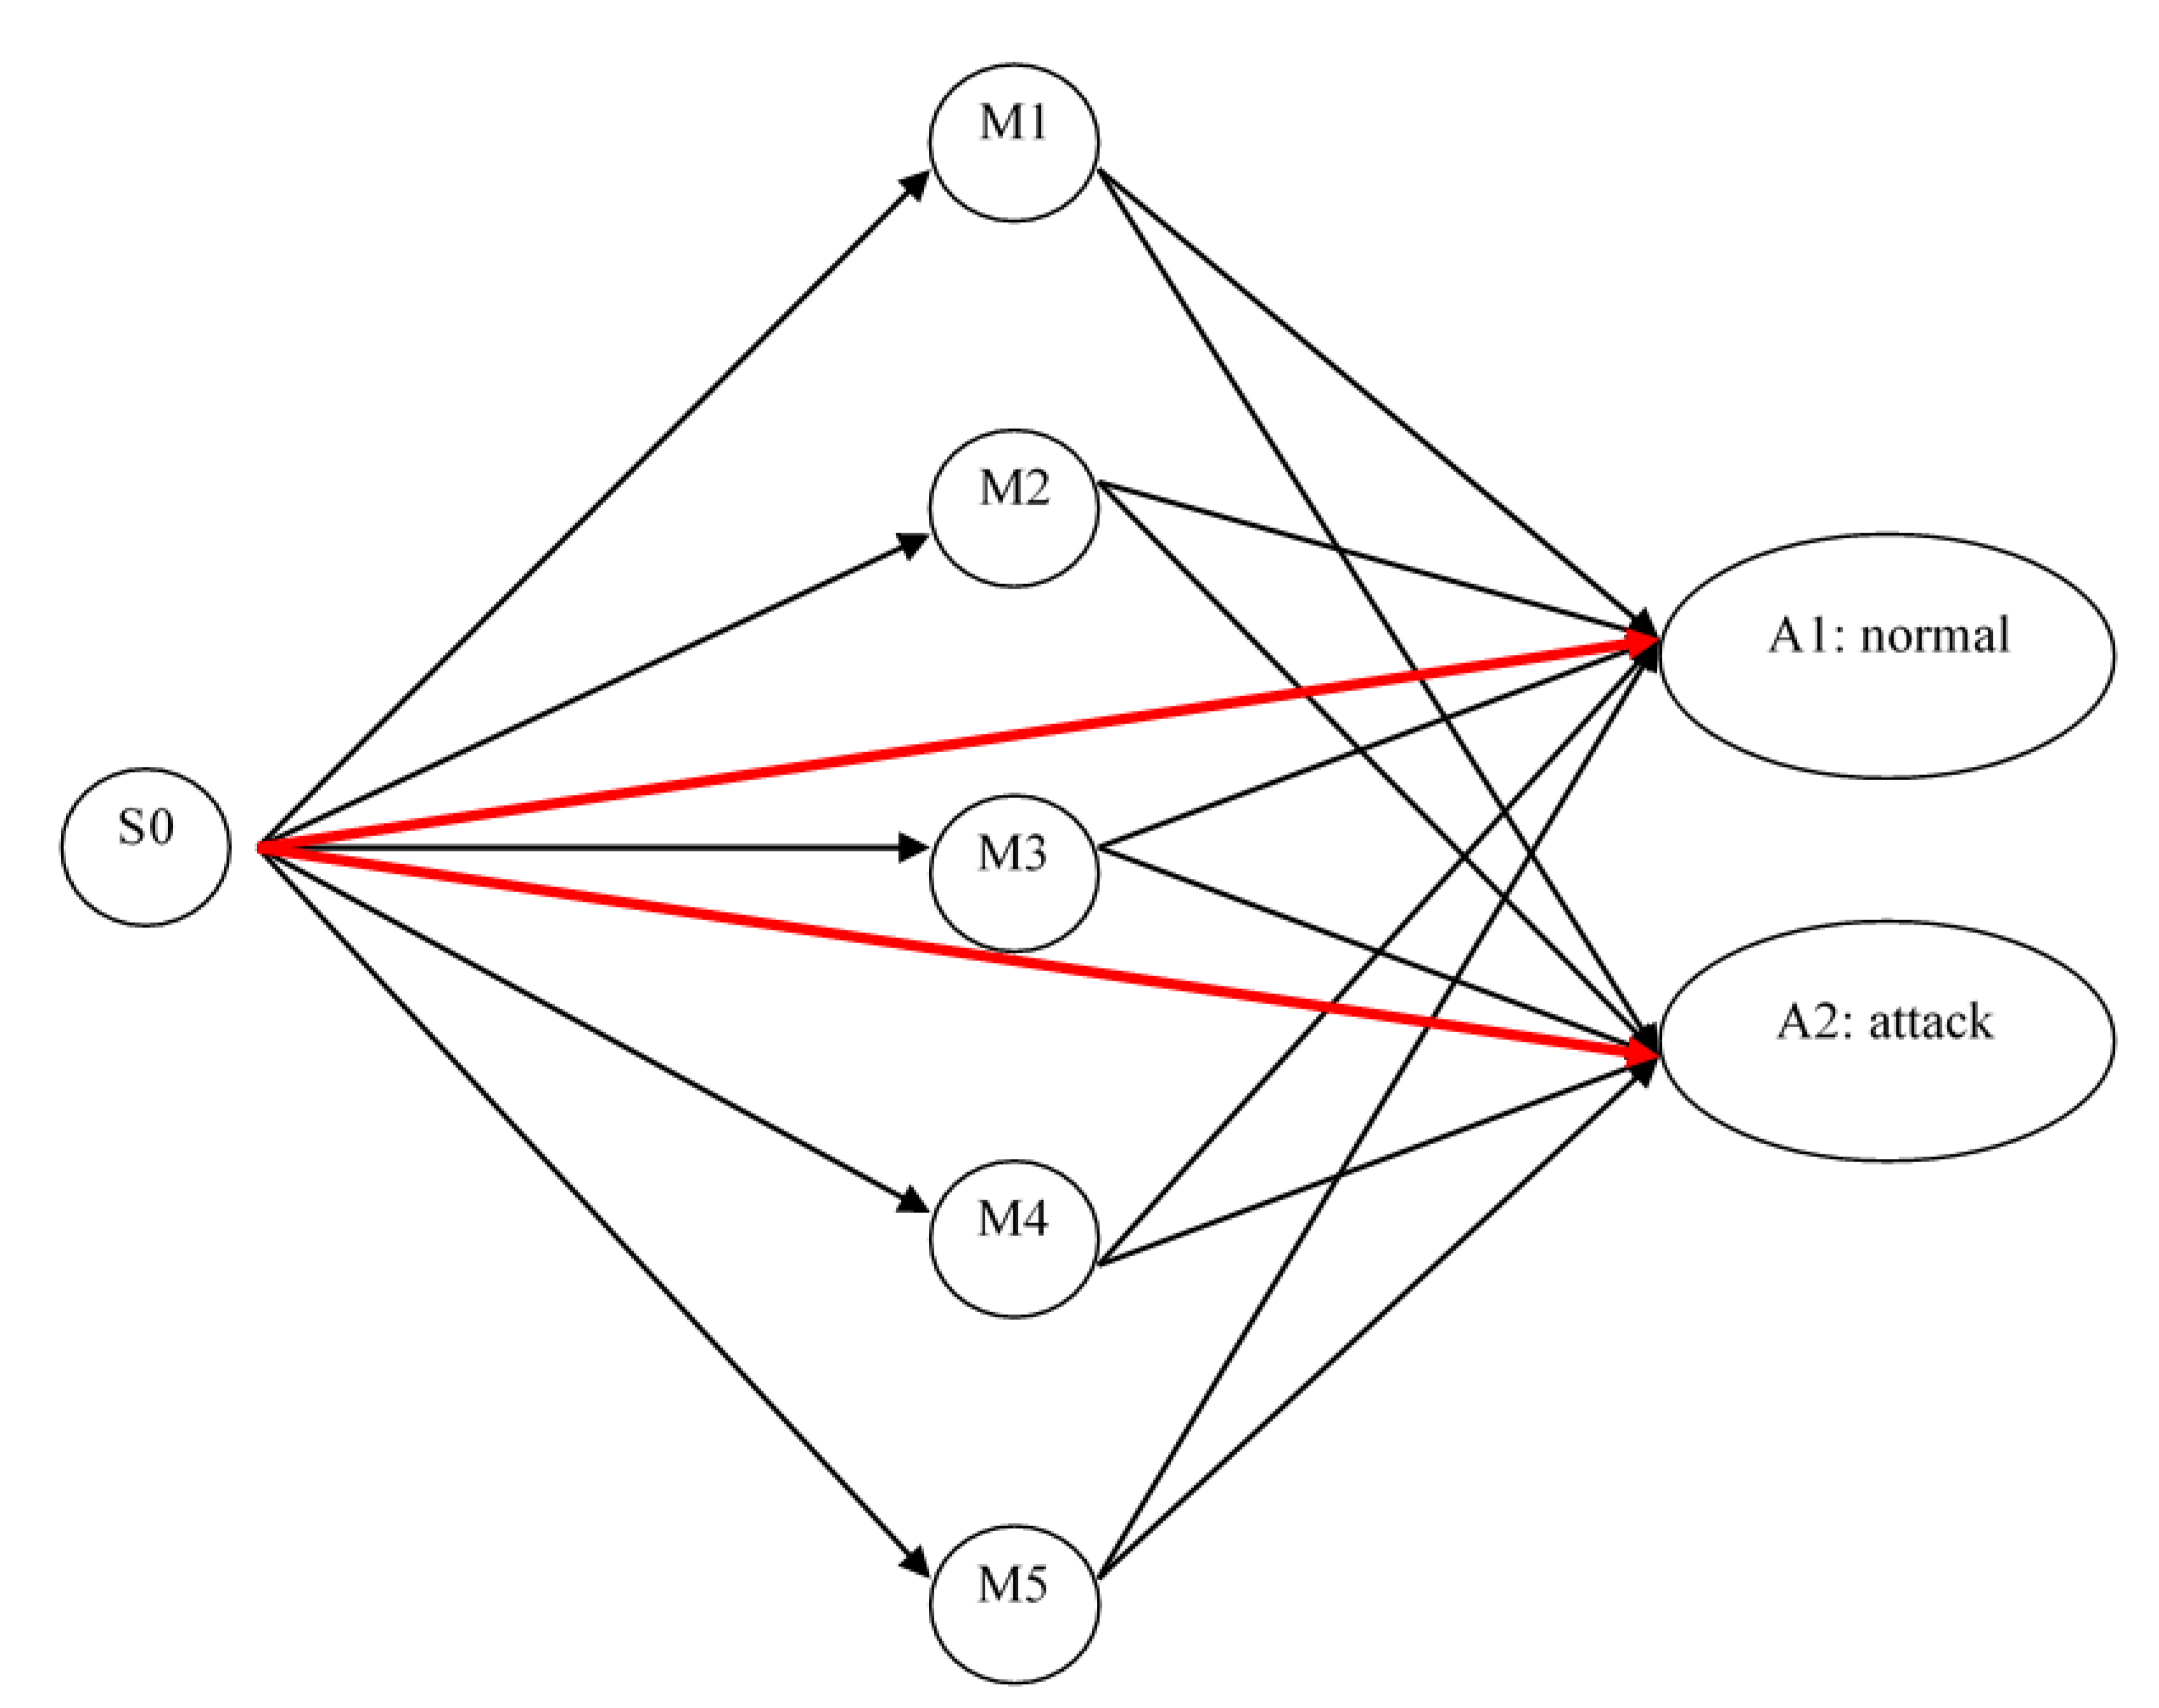
Figure 3.
State and state transitions for the FSM of intrusion detection. Some attacks are easy to be captured, and, therefore, the red lines represent direct transitions to final results. Some attacks are elaborate. We have to wait for subsequent information to make the final decision. Each internal state M1–M5 corresponds to one suspicious attack. The number of states depends on the system resources.
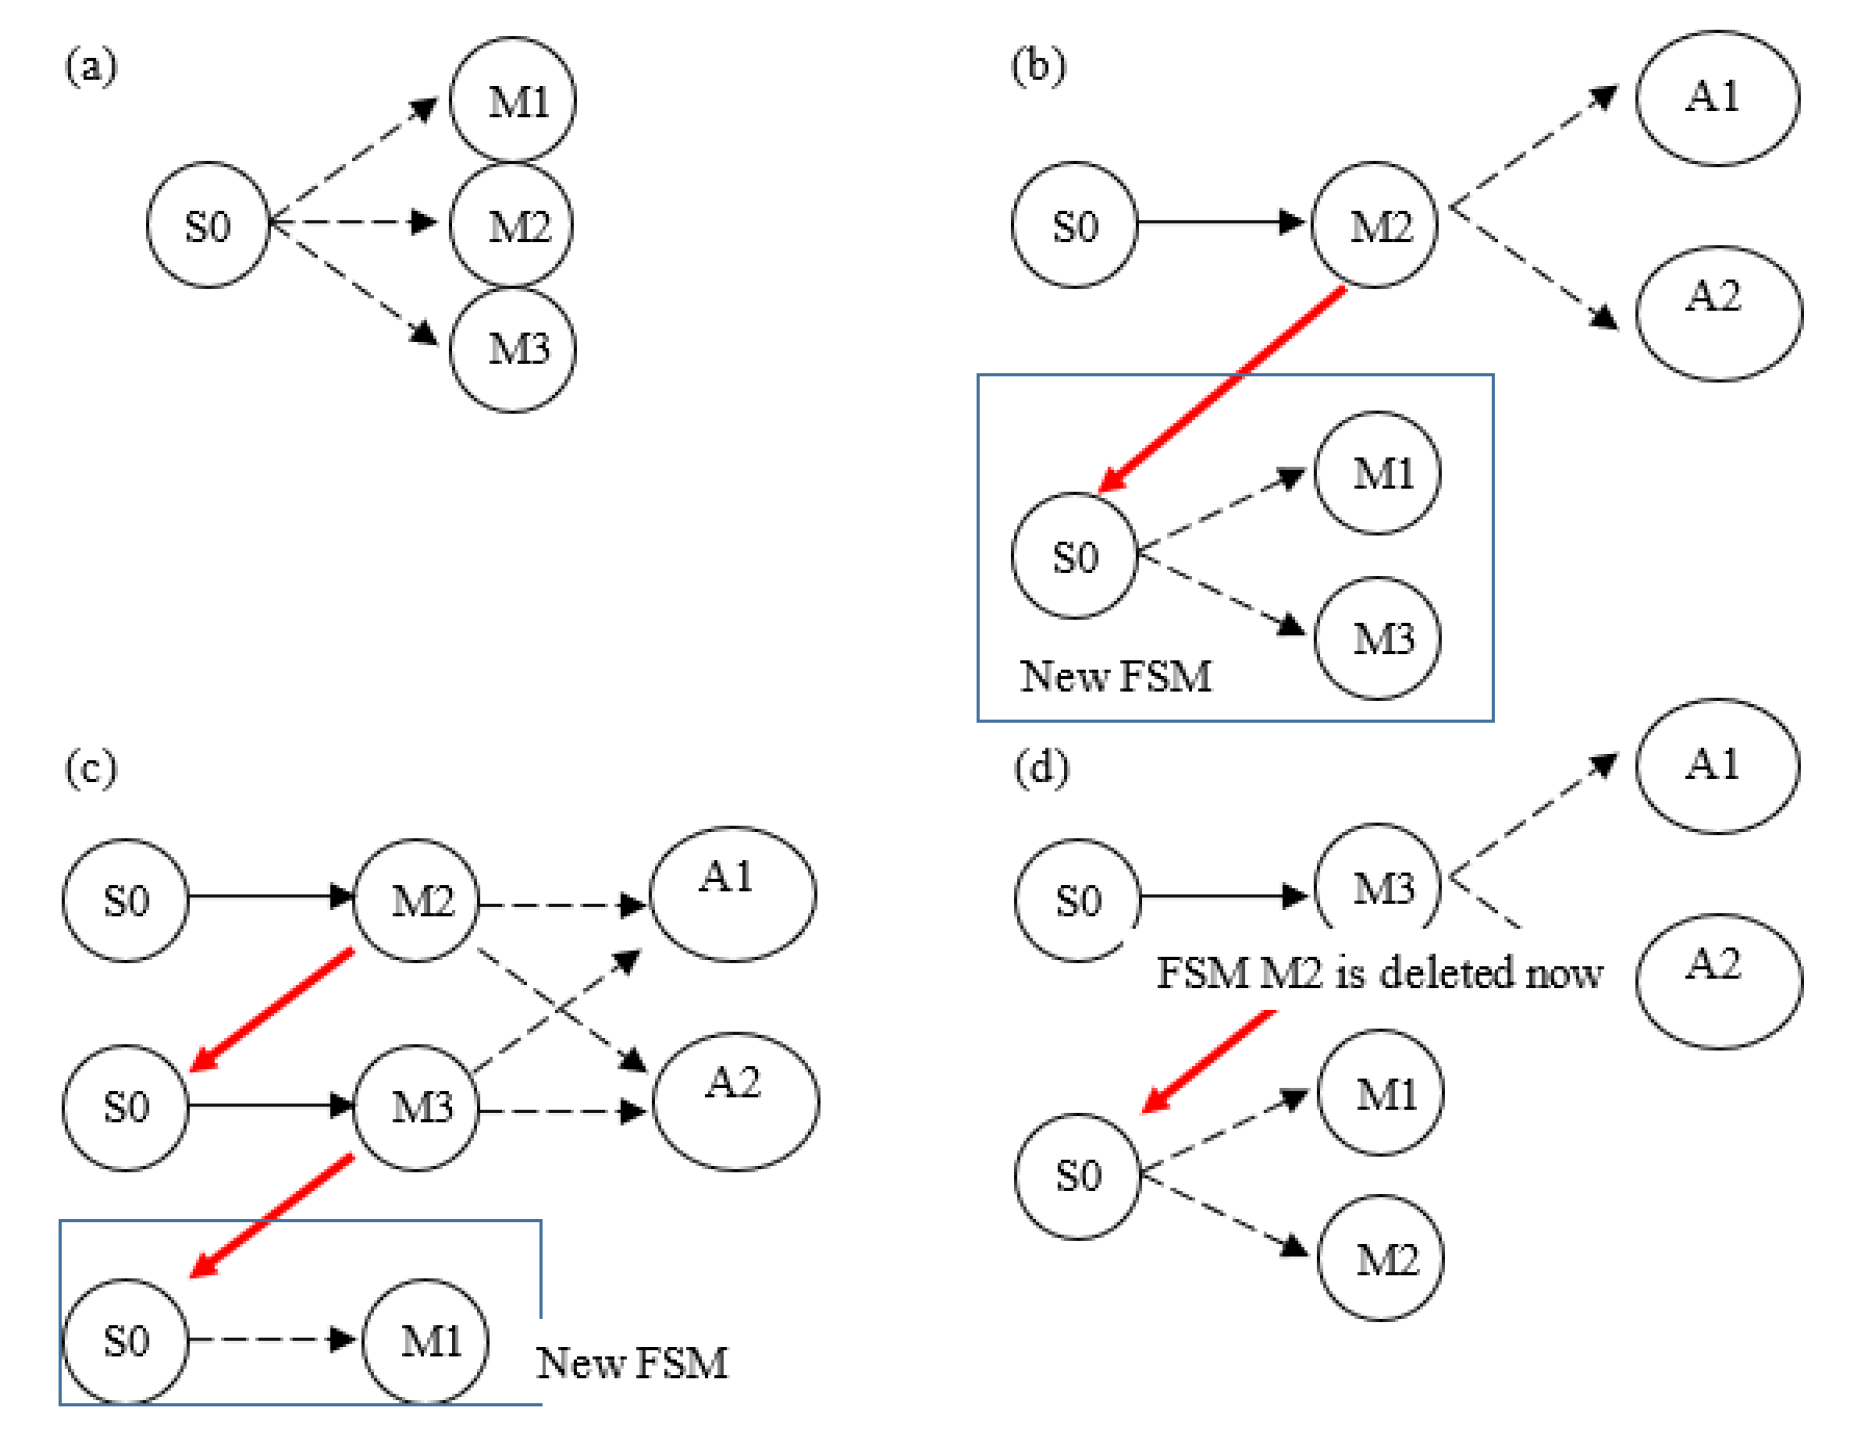
Figure 4.
(a) An FSM tracking M1–M3 is initialized; (b), (c) new FSMs spawned when other intermediate attack types are encountered; (d) the FSM tracking M2 is abandoned after packet count t.
Figure 4.
(a) An FSM tracking M1–M3 is initialized; (b), (c) new FSMs spawned when other intermediate attack types are encountered; (d) the FSM tracking M2 is abandoned after packet count t.
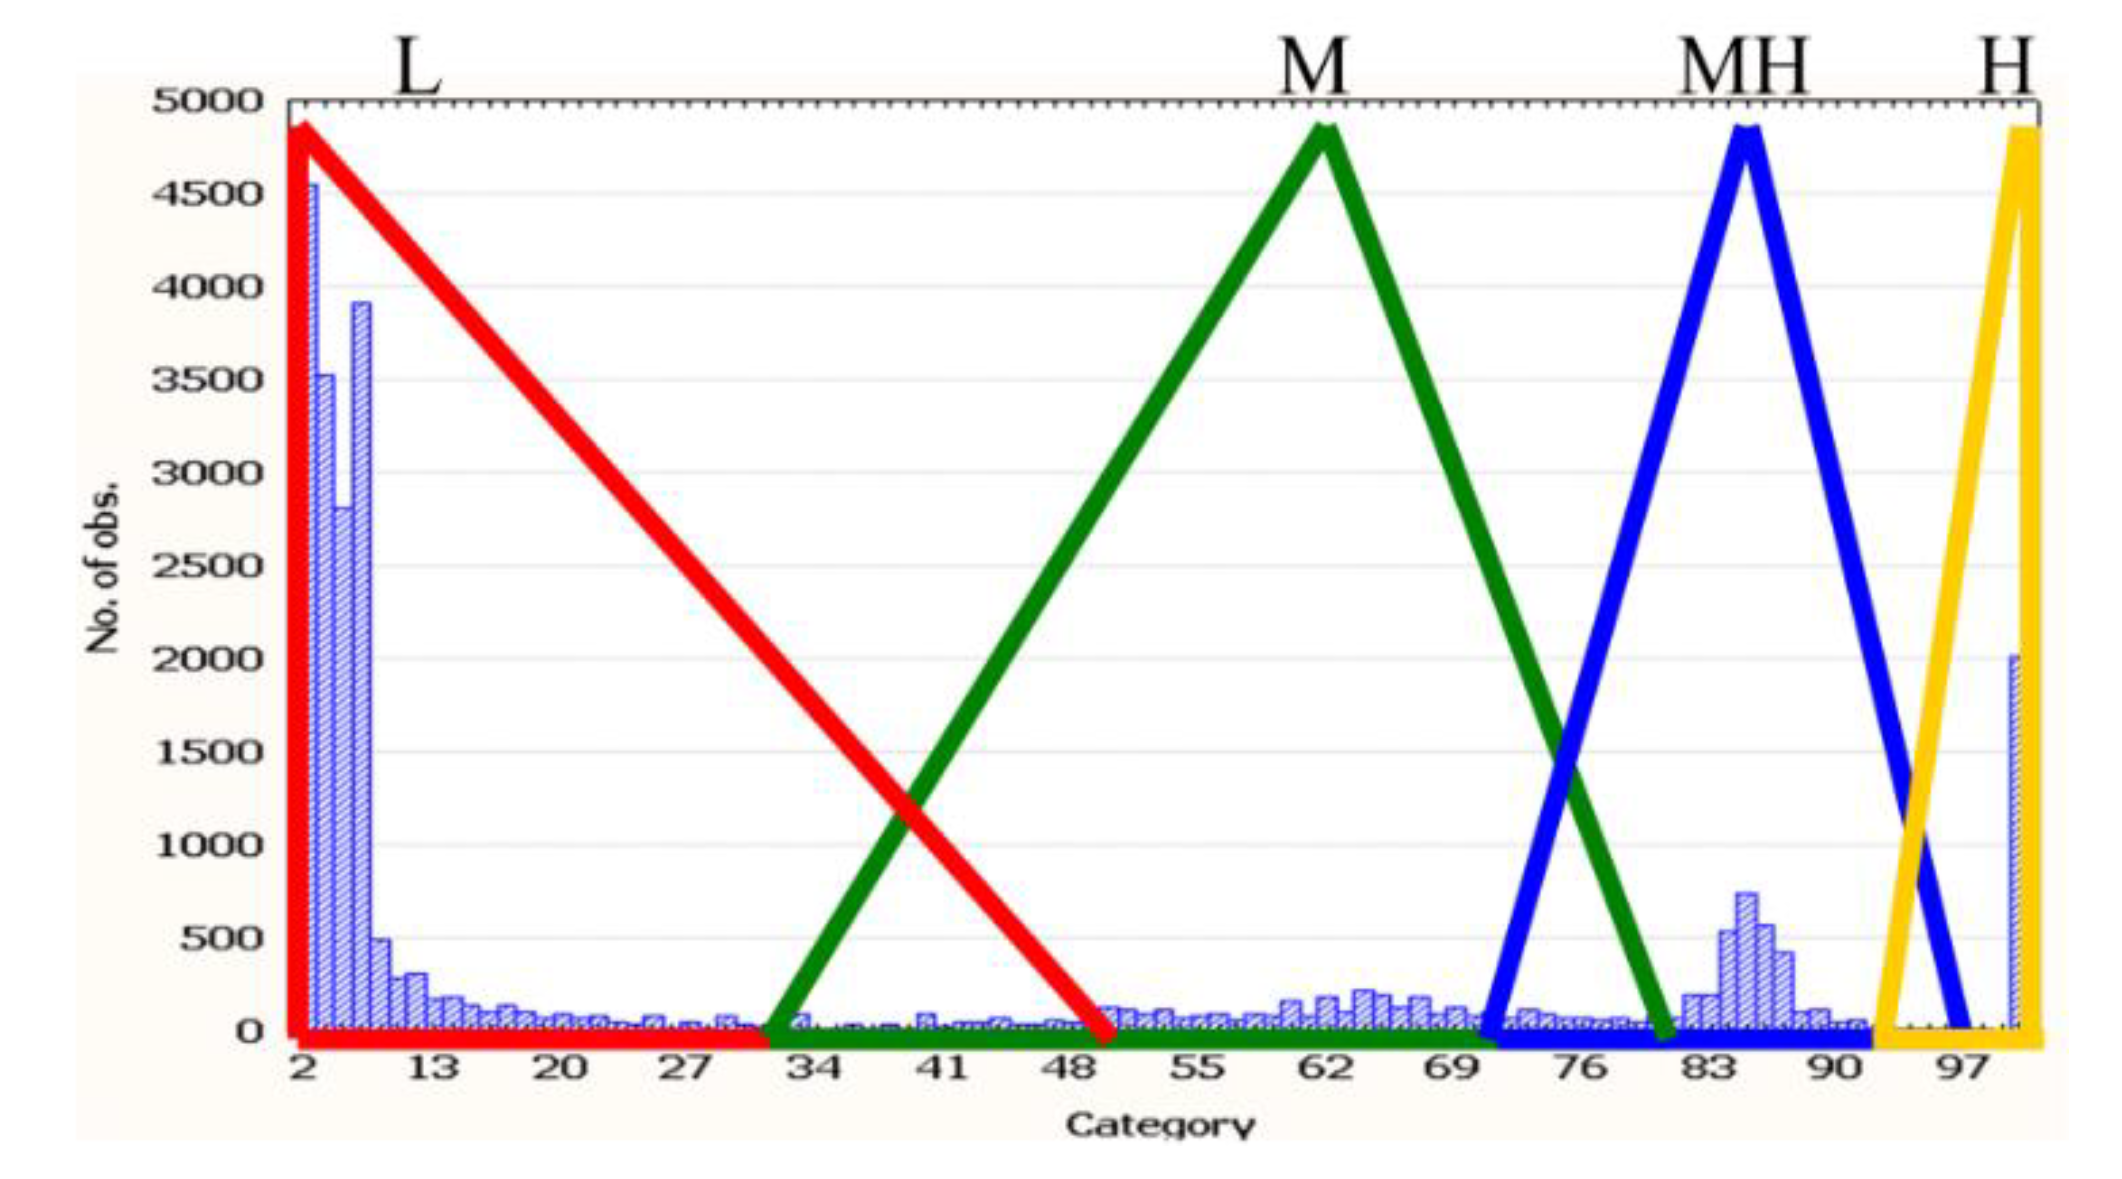
Figure 5.
Quantity features need to be quantized before coded to AIS antibodies. We use histogram to help fuzzy quantizing the quantity values to four categories.
Figure 5.
Quantity features need to be quantized before coded to AIS antibodies. We use histogram to help fuzzy quantizing the quantity values to four categories.
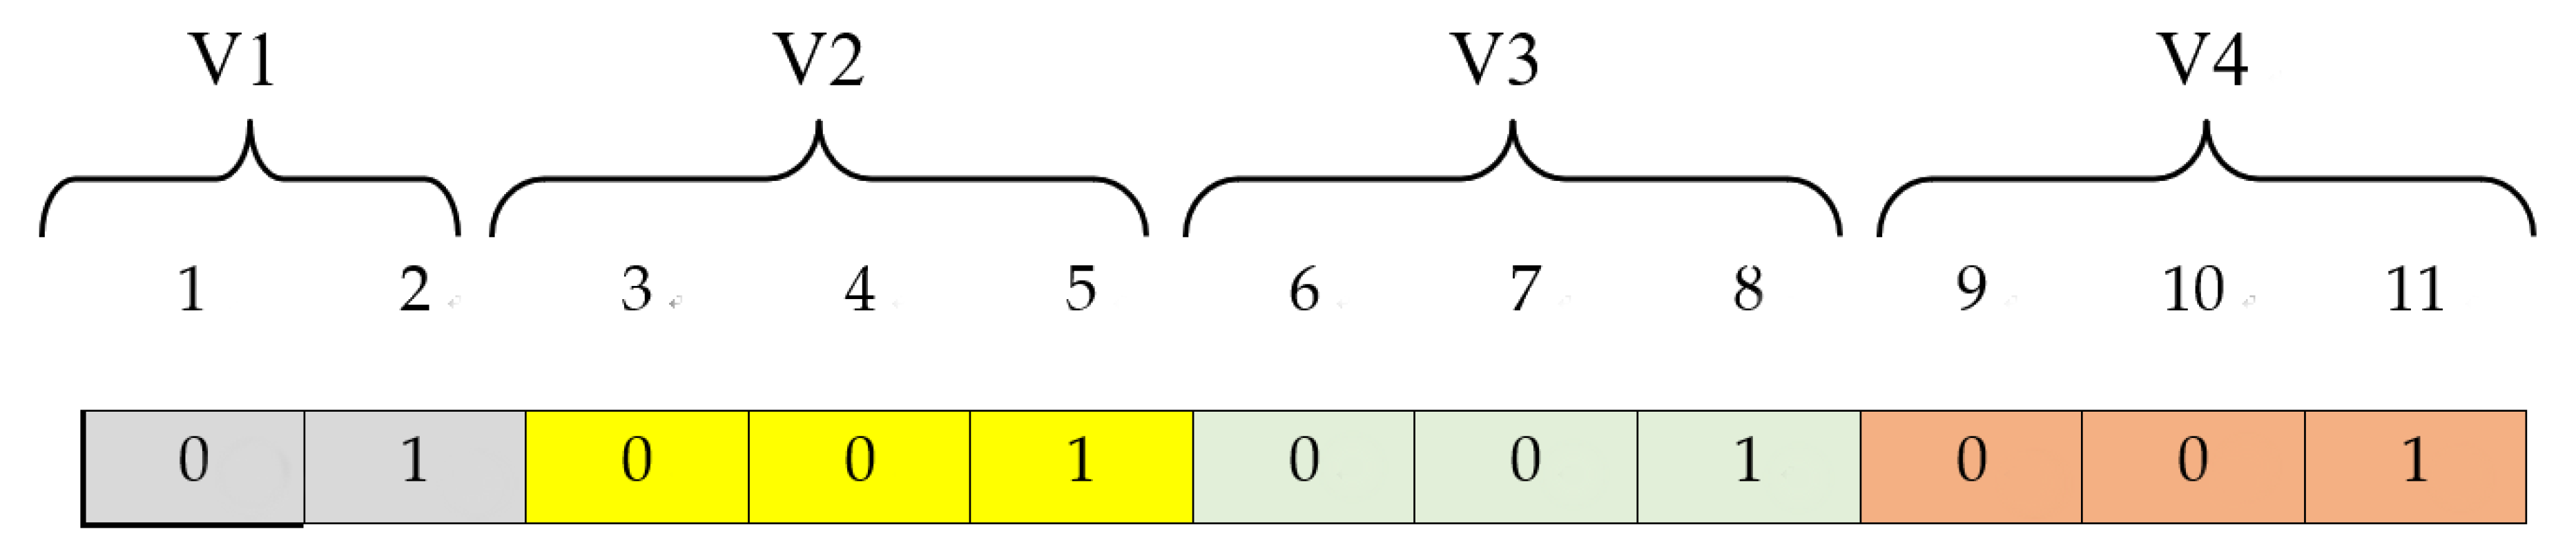
Figure 6.
The encoding scheme for the features in an antibody.
Figure 6.
The encoding scheme for the features in an antibody.
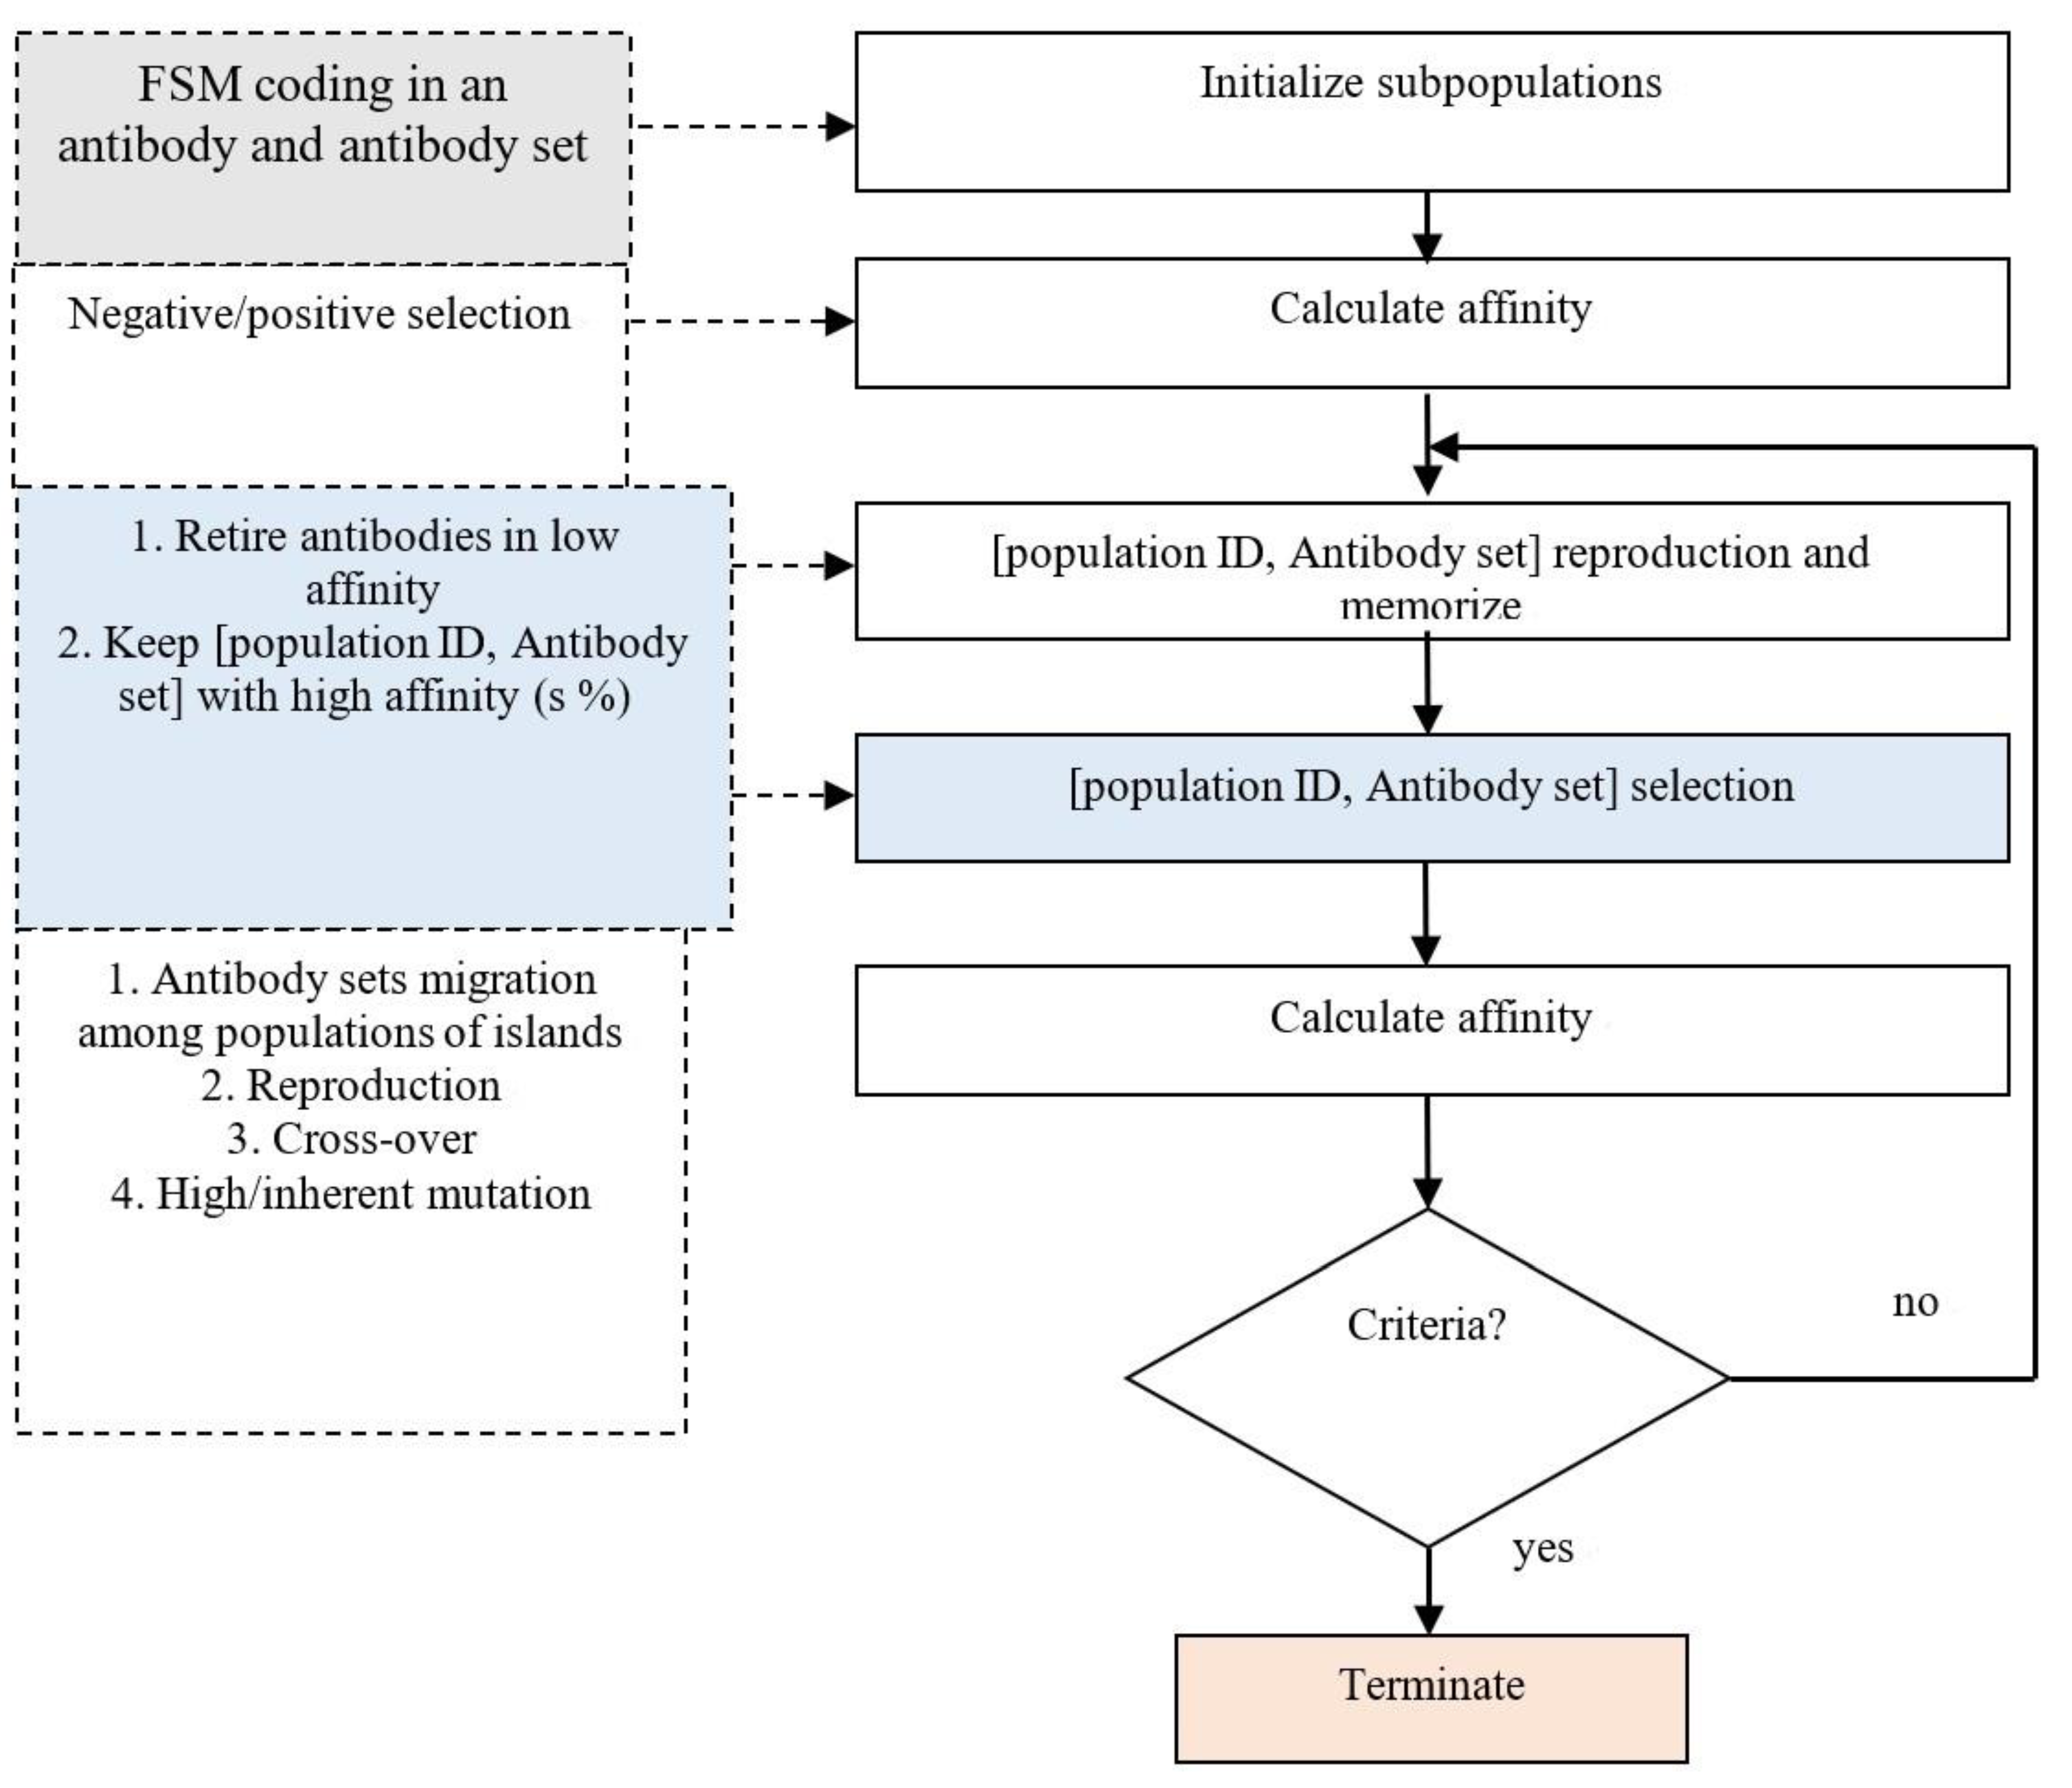
Figure 7.
The computation flow of our AIS training algorithm.
Figure 7.
The computation flow of our AIS training algorithm.
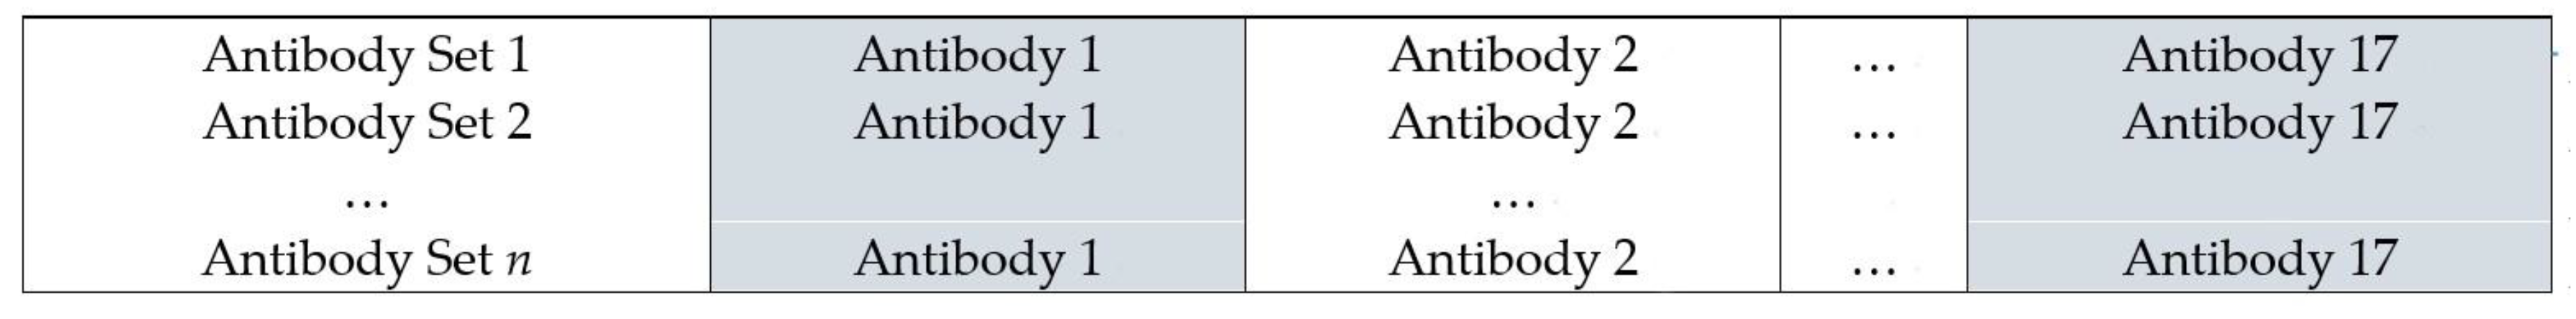
Figure 8.
Allocation of antibodies for the transition functions of an FSM (an antibody set presents an FSM; a population will evolve to select a best antibody set).
Figure 8.
Allocation of antibodies for the transition functions of an FSM (an antibody set presents an FSM; a population will evolve to select a best antibody set).
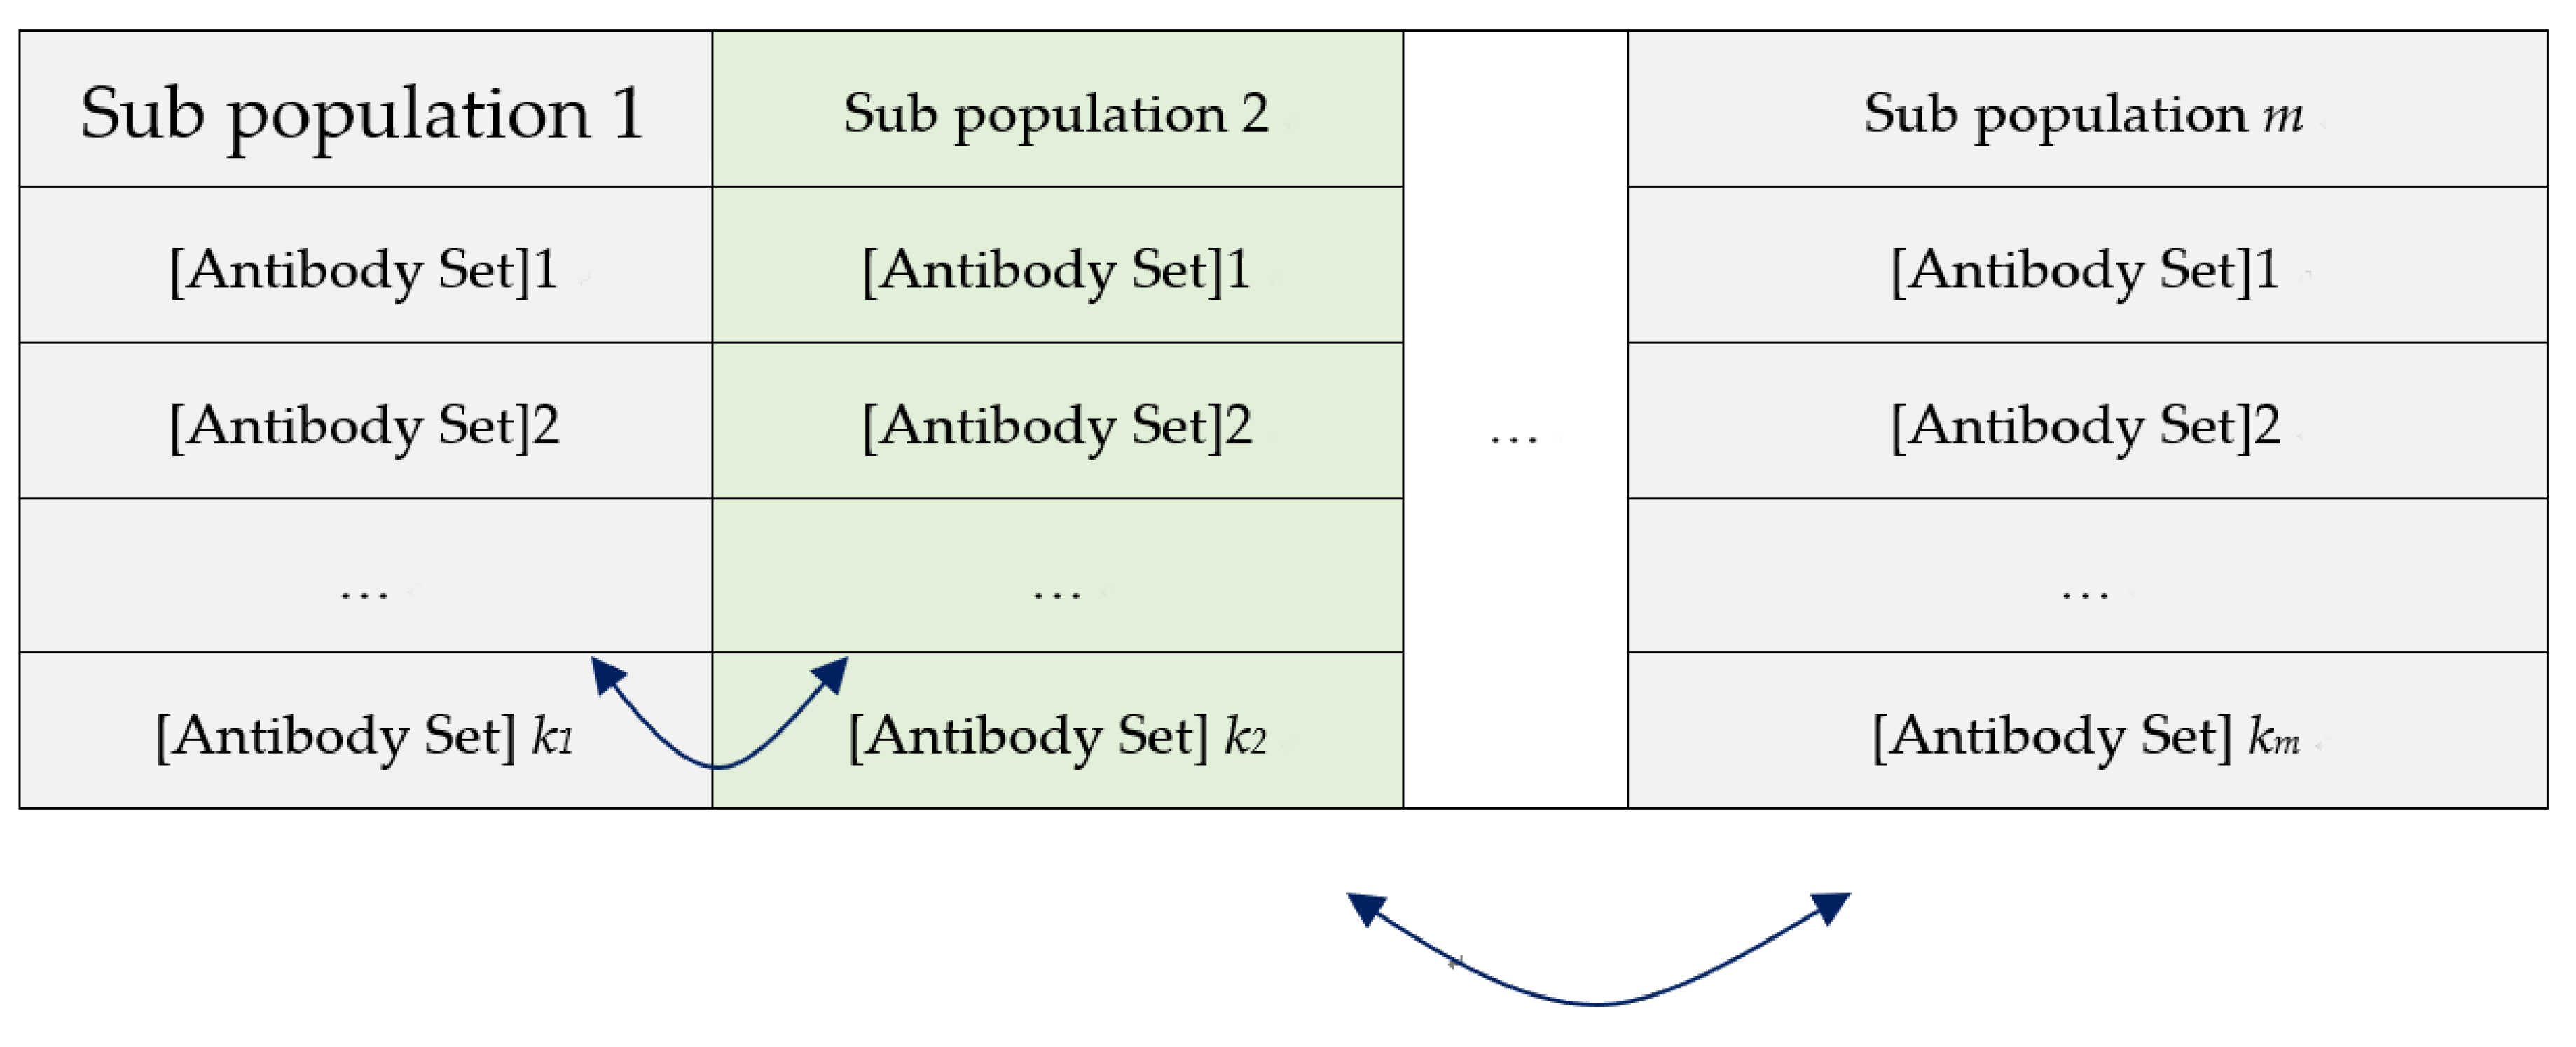
Figure 9.
The antibody sets migration between populations of islands. The best solution is rendered by keeping migration with good antibody sets in different islands to exchange and substitute with part of antibody sets in other populations over time. The migration will be selected according to a predefined probability (migration rate).
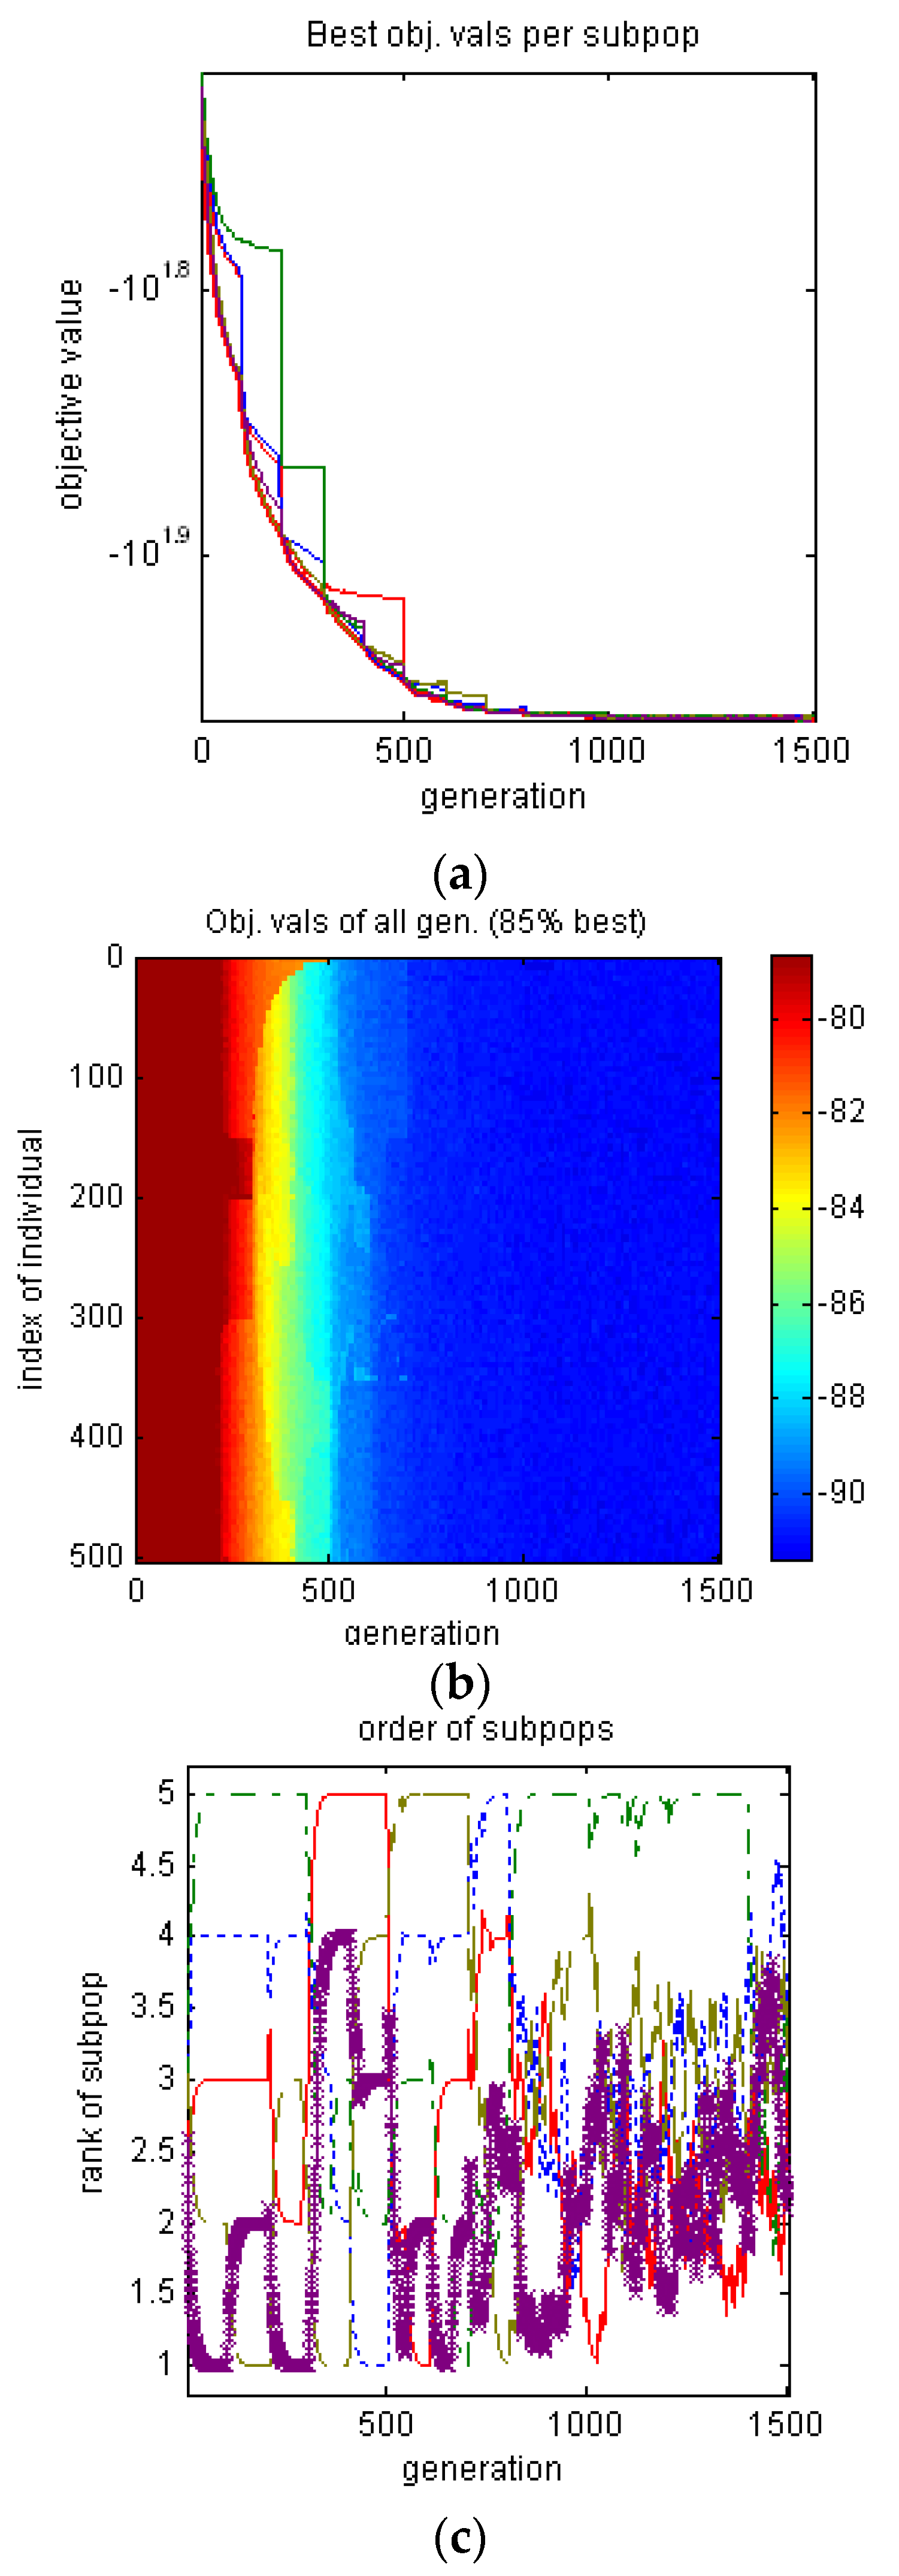
Figure 10.
The convergence of the IGA evolution. (a) The changes of the best affinity in selected five populations among the 1500 generations are shown by the different colors (the thick red line is the best affinity for all populations). Evidently, affinity has gradually converged after 1000th generations. (b) The best affinity changes of antibodies are displayed in 3D heat map. (c) The affinity changes among the populations before 500th generations are fast, and the rate becomes moderate after 500. Slowly converged population may also produce the best affinity antibody due to the IGA migration mechanism with antibody exchange. After 1000 generations, the affinity between populations become indifferent.
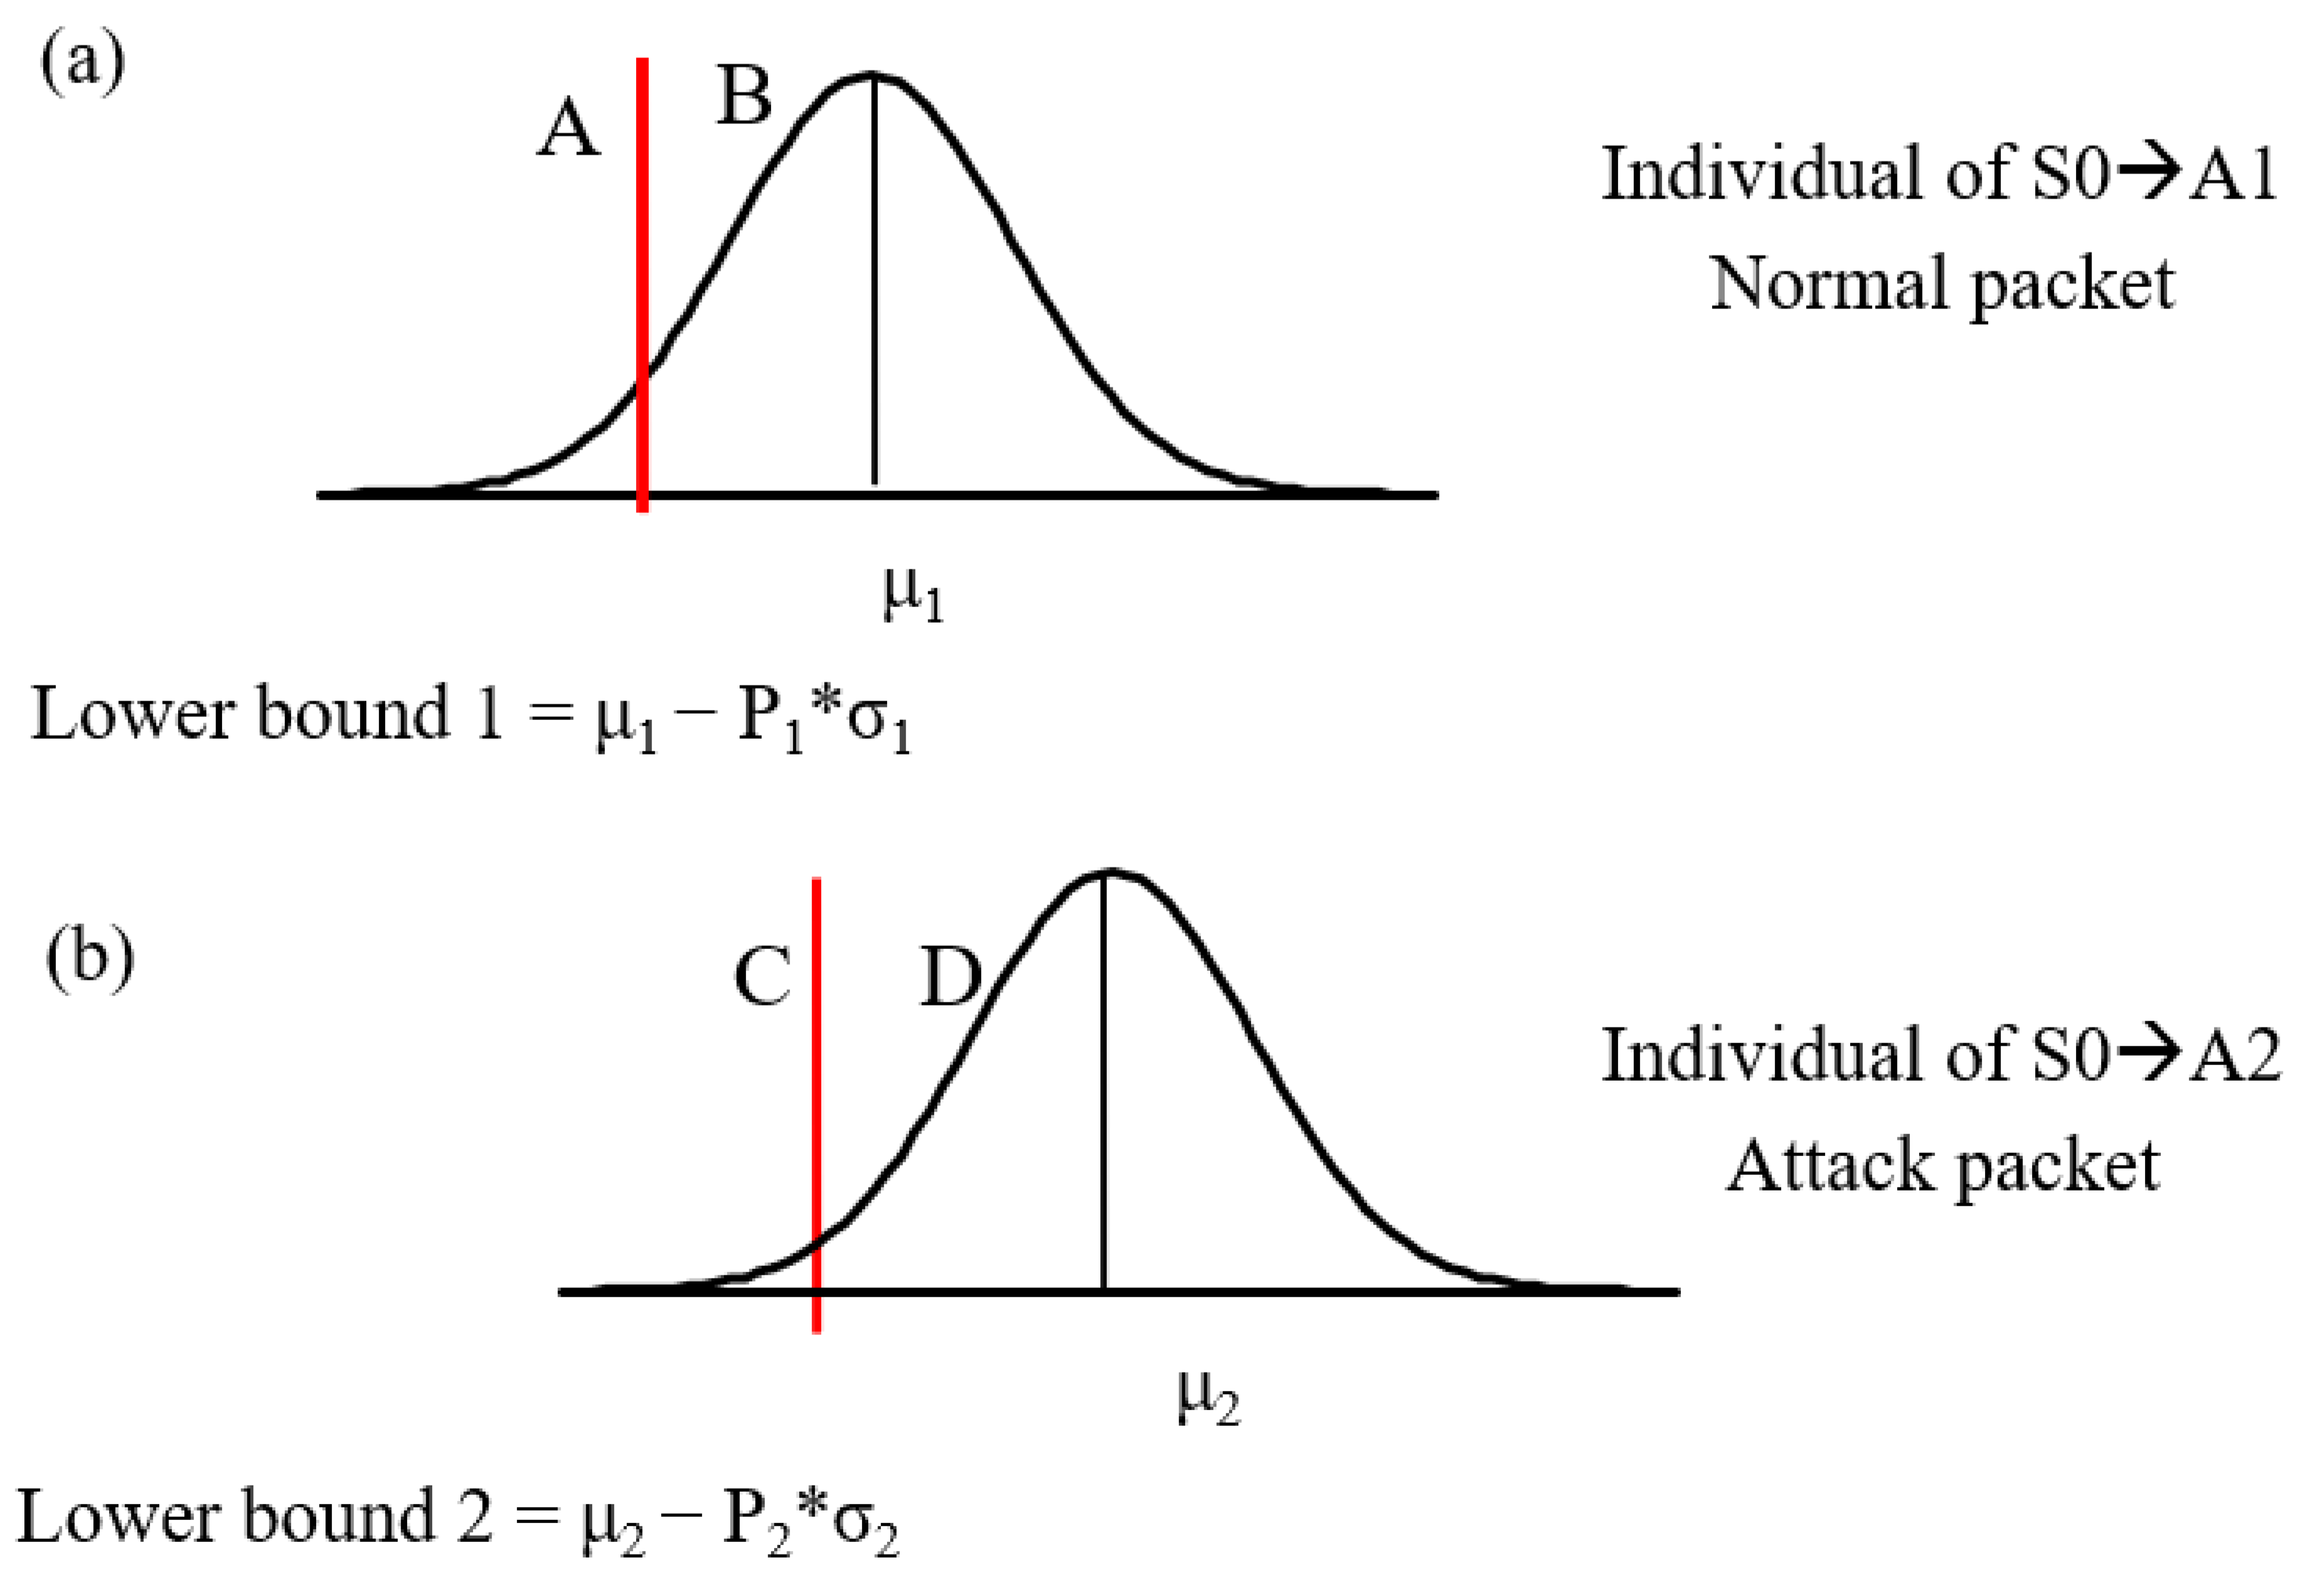
Figure 11.
Attack judgment for antibody affinity. The red lines are the lower bounds of antibodies. (a). When the affinity between the packet and antibody is greater than that of the lower bound 1 (B) and less than that of the lower bound 2 (C), the packet can be determined to be a normal packet. (b) If a packet is (A) and (D) on the same time, it is an attack packet.
Table 1.
A sample of data log in which a warezmaster attack was interlaced by a normal packet.
Table 1.
A sample of data log in which a warezmaster attack was interlaced by a normal packet.
| Packet | Duration | Protocol Type | Service | Flag | Src Bytes | Dst Bytes | Land | Wrong Fragment | Urgent | Hot | Label |
|---|
| 76,627 | 0 | tcp | http | SF | 210 | 542 | 0 | 0 | 0 | 0 | normal |
| 76,628 | 1 | tcp | Smtp | SF | 965 | 328 | 0 | 0 | 0 | 0 | normal |
| 76,629 | 0 | tcp | Smtp | SF | 1191 | 368 | 0 | 0 | 0 | 0 | normal |
| 76,630 | 1 | tcp | Smtp | SF | 1291 | 325 | 0 | 0 | 0 | 0 | normal |
| 76,631 | 0 | tcp | Smtp | SF | 14,081 | 337 | 0 | 0 | 0 | 0 | normal |
| 76,632 | 12 | tcp | ftp | SF | 72 | 300 | 0 | 0 | 0 | 1 | warezmaster |
| 76,633 | 0 | tcp | http | SF | 185 | 635 | 0 | 0 | 0 | 0 | normal |
| 76,634 | 0 | tcp | FTP data | SF | 8334 | 0 | 0 | 0 | 0 | 0 | warezmaster |
| 76,635 | 1 | tcp | smtp | SF | 1640 | 344 | 0 | 0 | 0 | 0 | normal |
| 76,636 | 0 | tcp | http | SF | 307 | 354 | 0 | 0 | 0 | 0 | normal |
| 76,637 | 0 | tcp | http | SF | 219 | 5014 | 0 | 0 | 0 | 0 | normal |
| 76,638 | 0 | tcp | http | SF | 212 | 3902 | 0 | 0 | 0 | 0 | normal |
| 76,639 | 0 | tcp | http | SF | 347 | 5320 | 0 | 0 | 0 | 0 | normal |
| 76,640 | 0 | tcp | http | SF | 327 | 365 | 0 | 0 | 0 | 0 | normal |
| 76,641 | 0 | tcp | http | SF | 296 | 7129 | 0 | 0 | 0 | 0 | normal |
Table 2.
Assignment of state transition to antibodies.
Table 2.
Assignment of state transition to antibodies.
| Current State | S0 |
|---|
| Next state | M1 | M2 | M3 | M4 | M5 | A1 | A2 | |
| Antibody# | 1 | 2 | 3 | 4 | 5 | 6 | 7 | |
| Current State | M1 | M2 | M3 | M4 | M5 |
| Next state | A1 | A2 | A1 | A2 | A1 | A2 | A1 | A2 | A1 | A2 |
| Antibody# | 8 | 9 | 10 | 11 | 12 | 13 | 14 | 15 | 16 | 17 |
Table 3.
Coding scheme for assigning values to categorical features.
Table 3.
Coding scheme for assigning values to categorical features.
| Feature |
|---|
| V1 | V2 | V3 | V4 |
| 0: 1 | L: 3 | ftp: 6 | tcp: 9 |
| 1: 2 | M: 4 | telnet: 7 | udp: 10 |
| | H: 5 | http: 8 | icmp: 11 |
Table 4.
An example for calculating the affinities of two antibodies with respect to attack A.
Table 4.
An example for calculating the affinities of two antibodies with respect to attack A.
| | Antibody Codes | The Affinity of Antibody to Attack A |
|---|
| Attack A | 1 | 0 | 1 | 0 | 1 | 0 | |
| Antibody 1 | 0 | 0 | 1 | 1 | 0 | 0 | 3 |
| Antibody 2 | 1 | 1 | 0 | 0 | 1 | 0 | 4 |
Table 5.
KDDCup data log.
Table 5.
KDDCup data log.
| Duration | Protocol Type | Service | Flag | Src Bytes | Dst Bytes | Land | Wrong Fragment | Urgent | Hot | Label |
|---|
| 0 | udp | private | SF | 105 | 146 | 0 | 0 | 0 | 0 | normal |
| 0 | udp | private | SF | 105 | 146 | 0 | 0 | 0 | 0 | normal |
| 0 | udp | private | SF | 105 | 146 | 0 | 0 | 0 | 0 | normal |
| 0 | udp | private | SF | 105 | 146 | 0 | 0 | 0 | 0 | snmpgetattack |
| 0 | udp | private | SF | 105 | 146 | 0 | 0 | 0 | 0 | snmpgetattack |
| 0 | udp | private | SF | 105 | 146 | 0 | 0 | 0 | 0 | snmpgetattack |
| 0 | udp | domain | SF | 29 | 0 | 0 | 0 | 0 | 0 | normal |
| 0 | tcp | private | SF | 105 | 146 | 0 | 0 | 0 | 0 | normal |
| 0 | udp | private | SF | 105 | 146 | 0 | 0 | 0 | 0 | snmpgetattack |
| 0 | tcp | http | SF | 223 | 185 | 0 | 0 | 0 | 0 | normal |
| 0 | udp | private | SF | 105 | 146 | 0 | 0 | 0 | 0 | snmpgetattack |
| 0 | tcp | http | SF | 230 | 260 | 0 | 0 | 0 | 0 | normal |
Table 6.
Parameter setting in the IGA AIS.
Table 6.
Parameter setting in the IGA AIS.
| Populations | 5 |
|---|
| Population number | 1 | 2 | 3 | 4 | 5 |
| Antibody sets in a population | 100 | 100 | 100 | 100 | 100 |
| Migration interval | 100 |
| Random samples | 200 |
| Migration rate | 0.1 |
| Selection type | Threshold selection |
| Selection pressure | 1.7 |
| Reproduction rate | 0.1 |
| Cross-over rate | 0.3 | 0.4 | 0.5 | 0.6 | 0.7 |
| Mutation rate | 0.02 | 0.05 | 0.02 | 0.05 | 0.02 |
| Stopping criteria | Stopped at 1500th generation |
Table 7.
Illustration of the determination ranges from
Figure 9.
Table 7.
Illustration of the determination ranges from
Figure 9.
| Antibodies to Be Normal Packets | Antibodies to Be Attack Packets | |
|---|
| Less than A | Greater than B | Less than C | Greater than D | Determination |
| yes | | yes | | Unknown | Suspicious |
| | yes | | Yes | Conflict |
| yes | | | yes | Attack |
| | yes | yes | | Normal |
Table 8.
Detection performance for single-type attacks.
Table 8.
Detection performance for single-type attacks.
| | Single-Type Attack (378,067 Records) |
|---|
| | | True condition |
| | | Normal | Attack |
| Predicted condition | Normal | 93,394 (true positive) | 0 (false positive) |
| Attack | 1916 (false negative) | 280,519 (true negative) |
| Indeterminant | Conflict | 167 | 0 |
| unknown | 1895 | 176 |
Table 9.
Detection performance for mixed-type attacks.
Table 9.
Detection performance for mixed-type attacks.
| | Mixed-Type Attack (491,438 Records) |
|---|
| | | True Condition |
| | | Normal | Attack |
| Predicted condition | Normal | 93,394 (true positive) | 3456 (false positive) |
| Attack | 1912 (false negative) | 390,371 (true negative) |
| Indeterminant | Conflict | 167 | 38 |
| Unknown | 1899 | 201 |
Table 10.
Detection performance for new-type attacks, which are completely unseen for the system.
Table 10.
Detection performance for new-type attacks, which are completely unseen for the system.
| | New-Type Attacks (548 Records) Plus Previous Mixed-Type Attacks (491,438) |
|---|
| | | True condition |
| | | Normal | Attack | New Attack |
| Predicted condition | Normal | 81,300 | 2367 | 109 |
| Attack | 3623 | 390,265 | 318 |
| Indeterminant | Conflict | 376 | 423 | 40 |
| Unknown | 423 | 1011 | 81 |


