Mechanical Properties of Concrete Pipes with Pre-Existing Cracks

Abstract
1. Introduction
2. 3-D Finite Element Models
2.1. Pipe Model
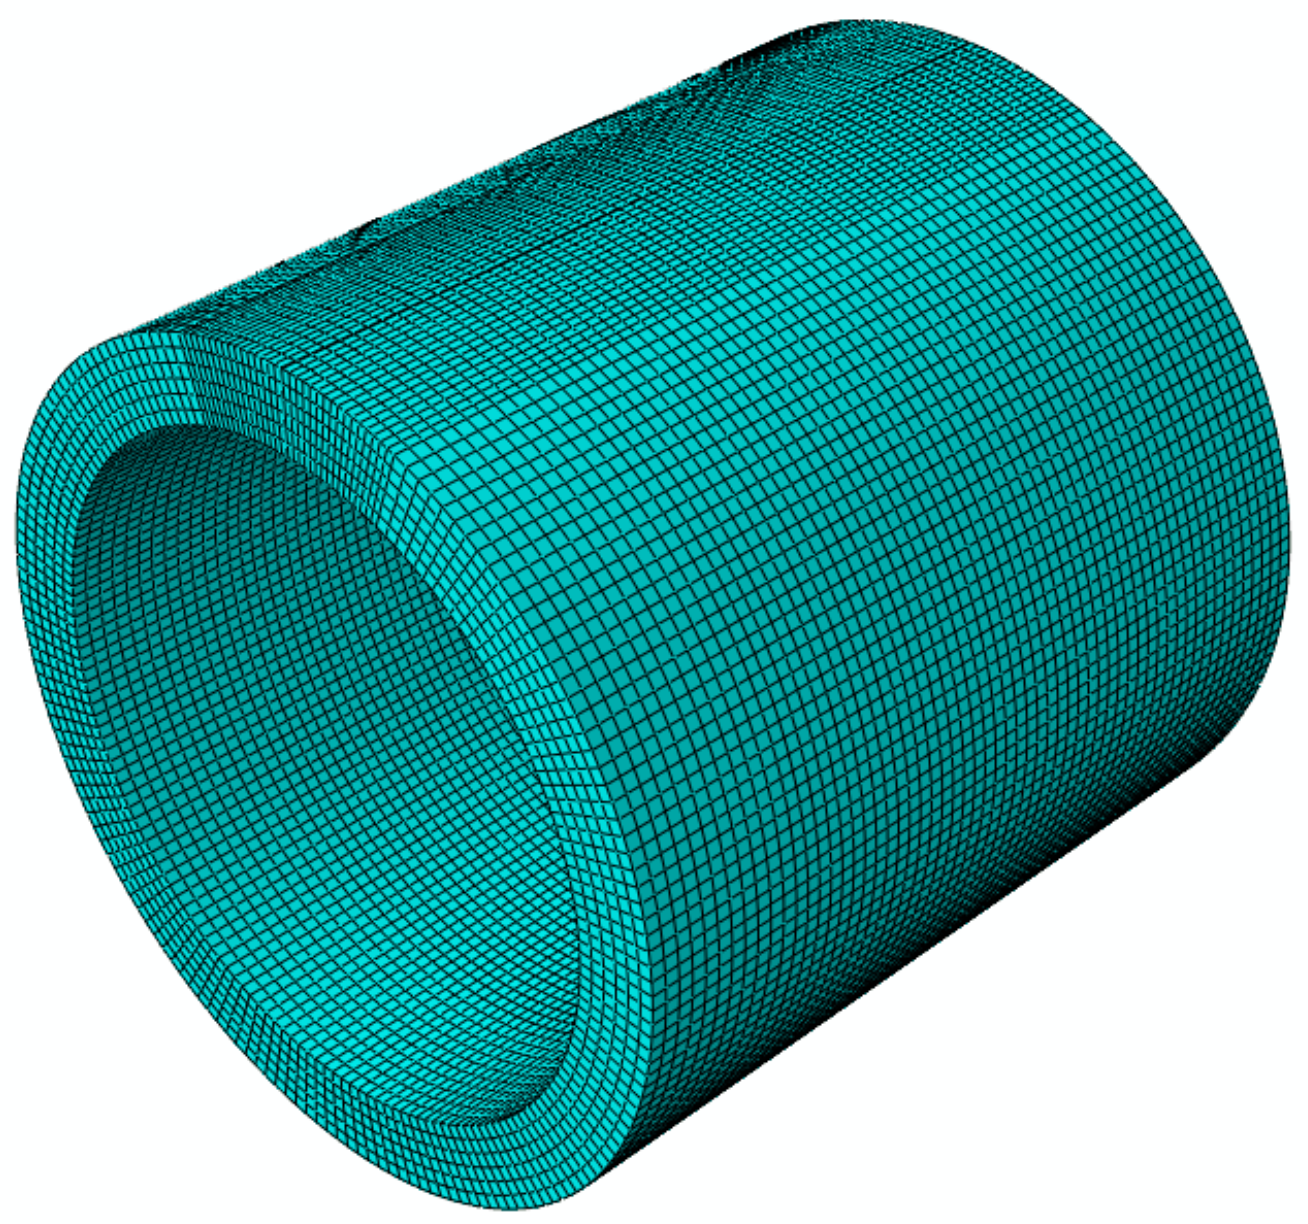
2.2. Mesh Model
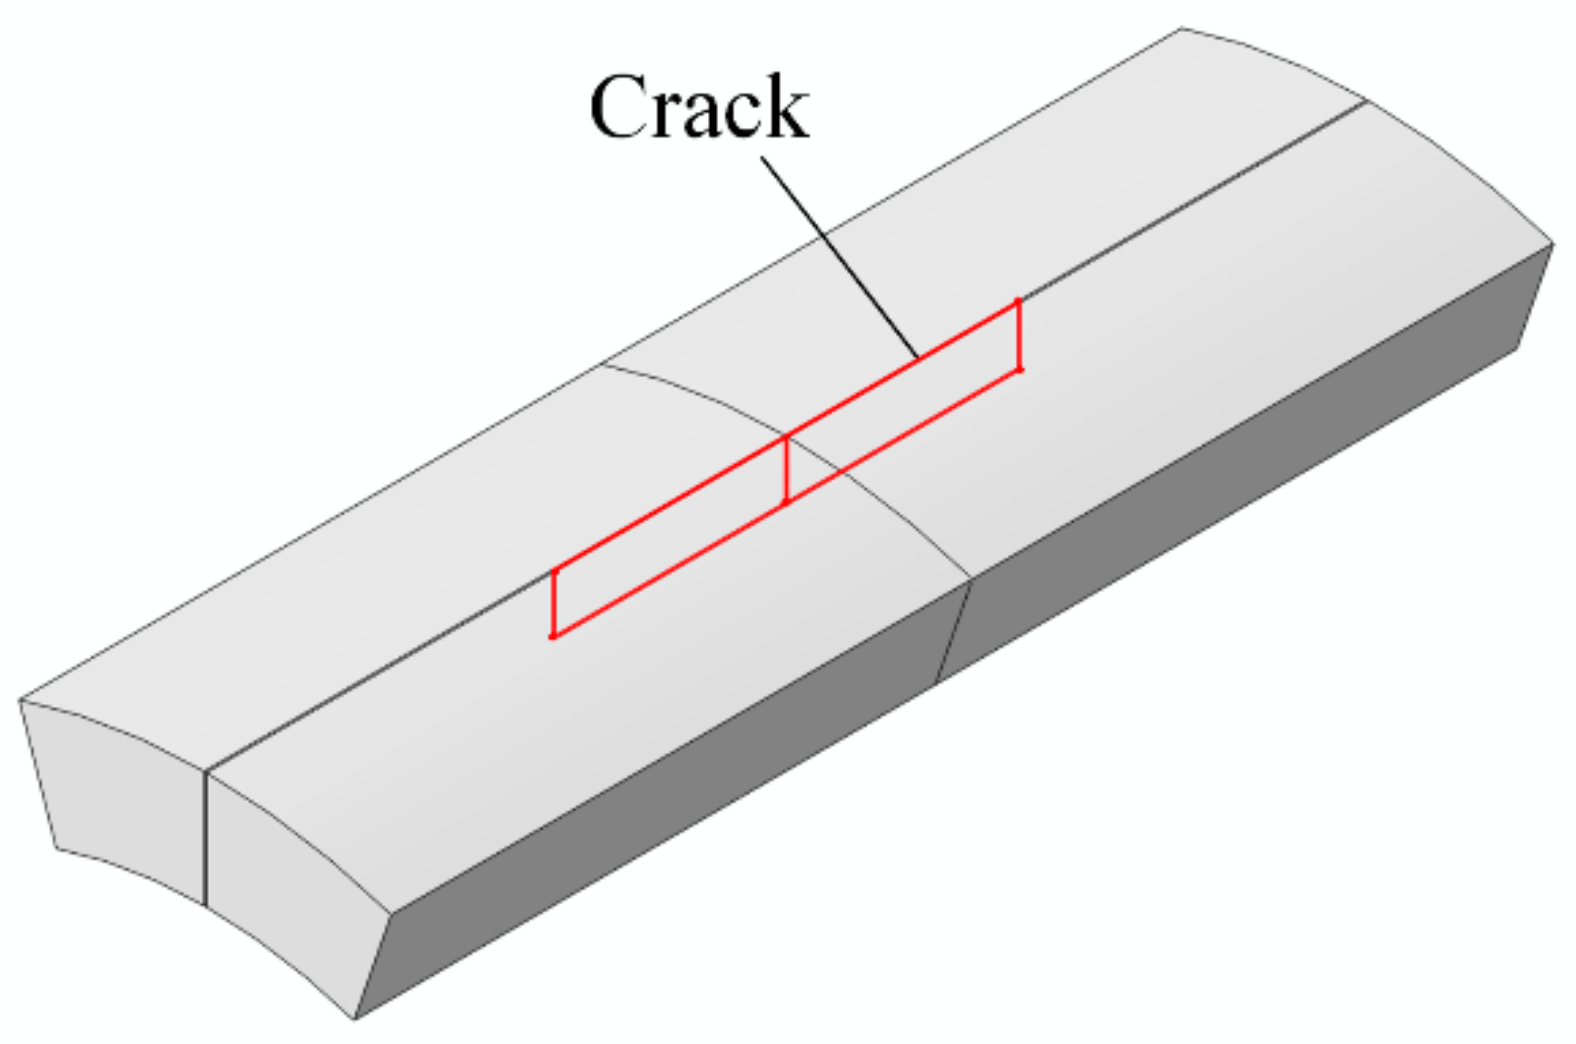
2.3. Crack Model
2.4. Rubber Gasket Model
2.5. Failure Criteria
2.6. Contact Surface Model
2.7. Boundary Conditions and Loads
3. Field Test
3.1. Crack Treatment
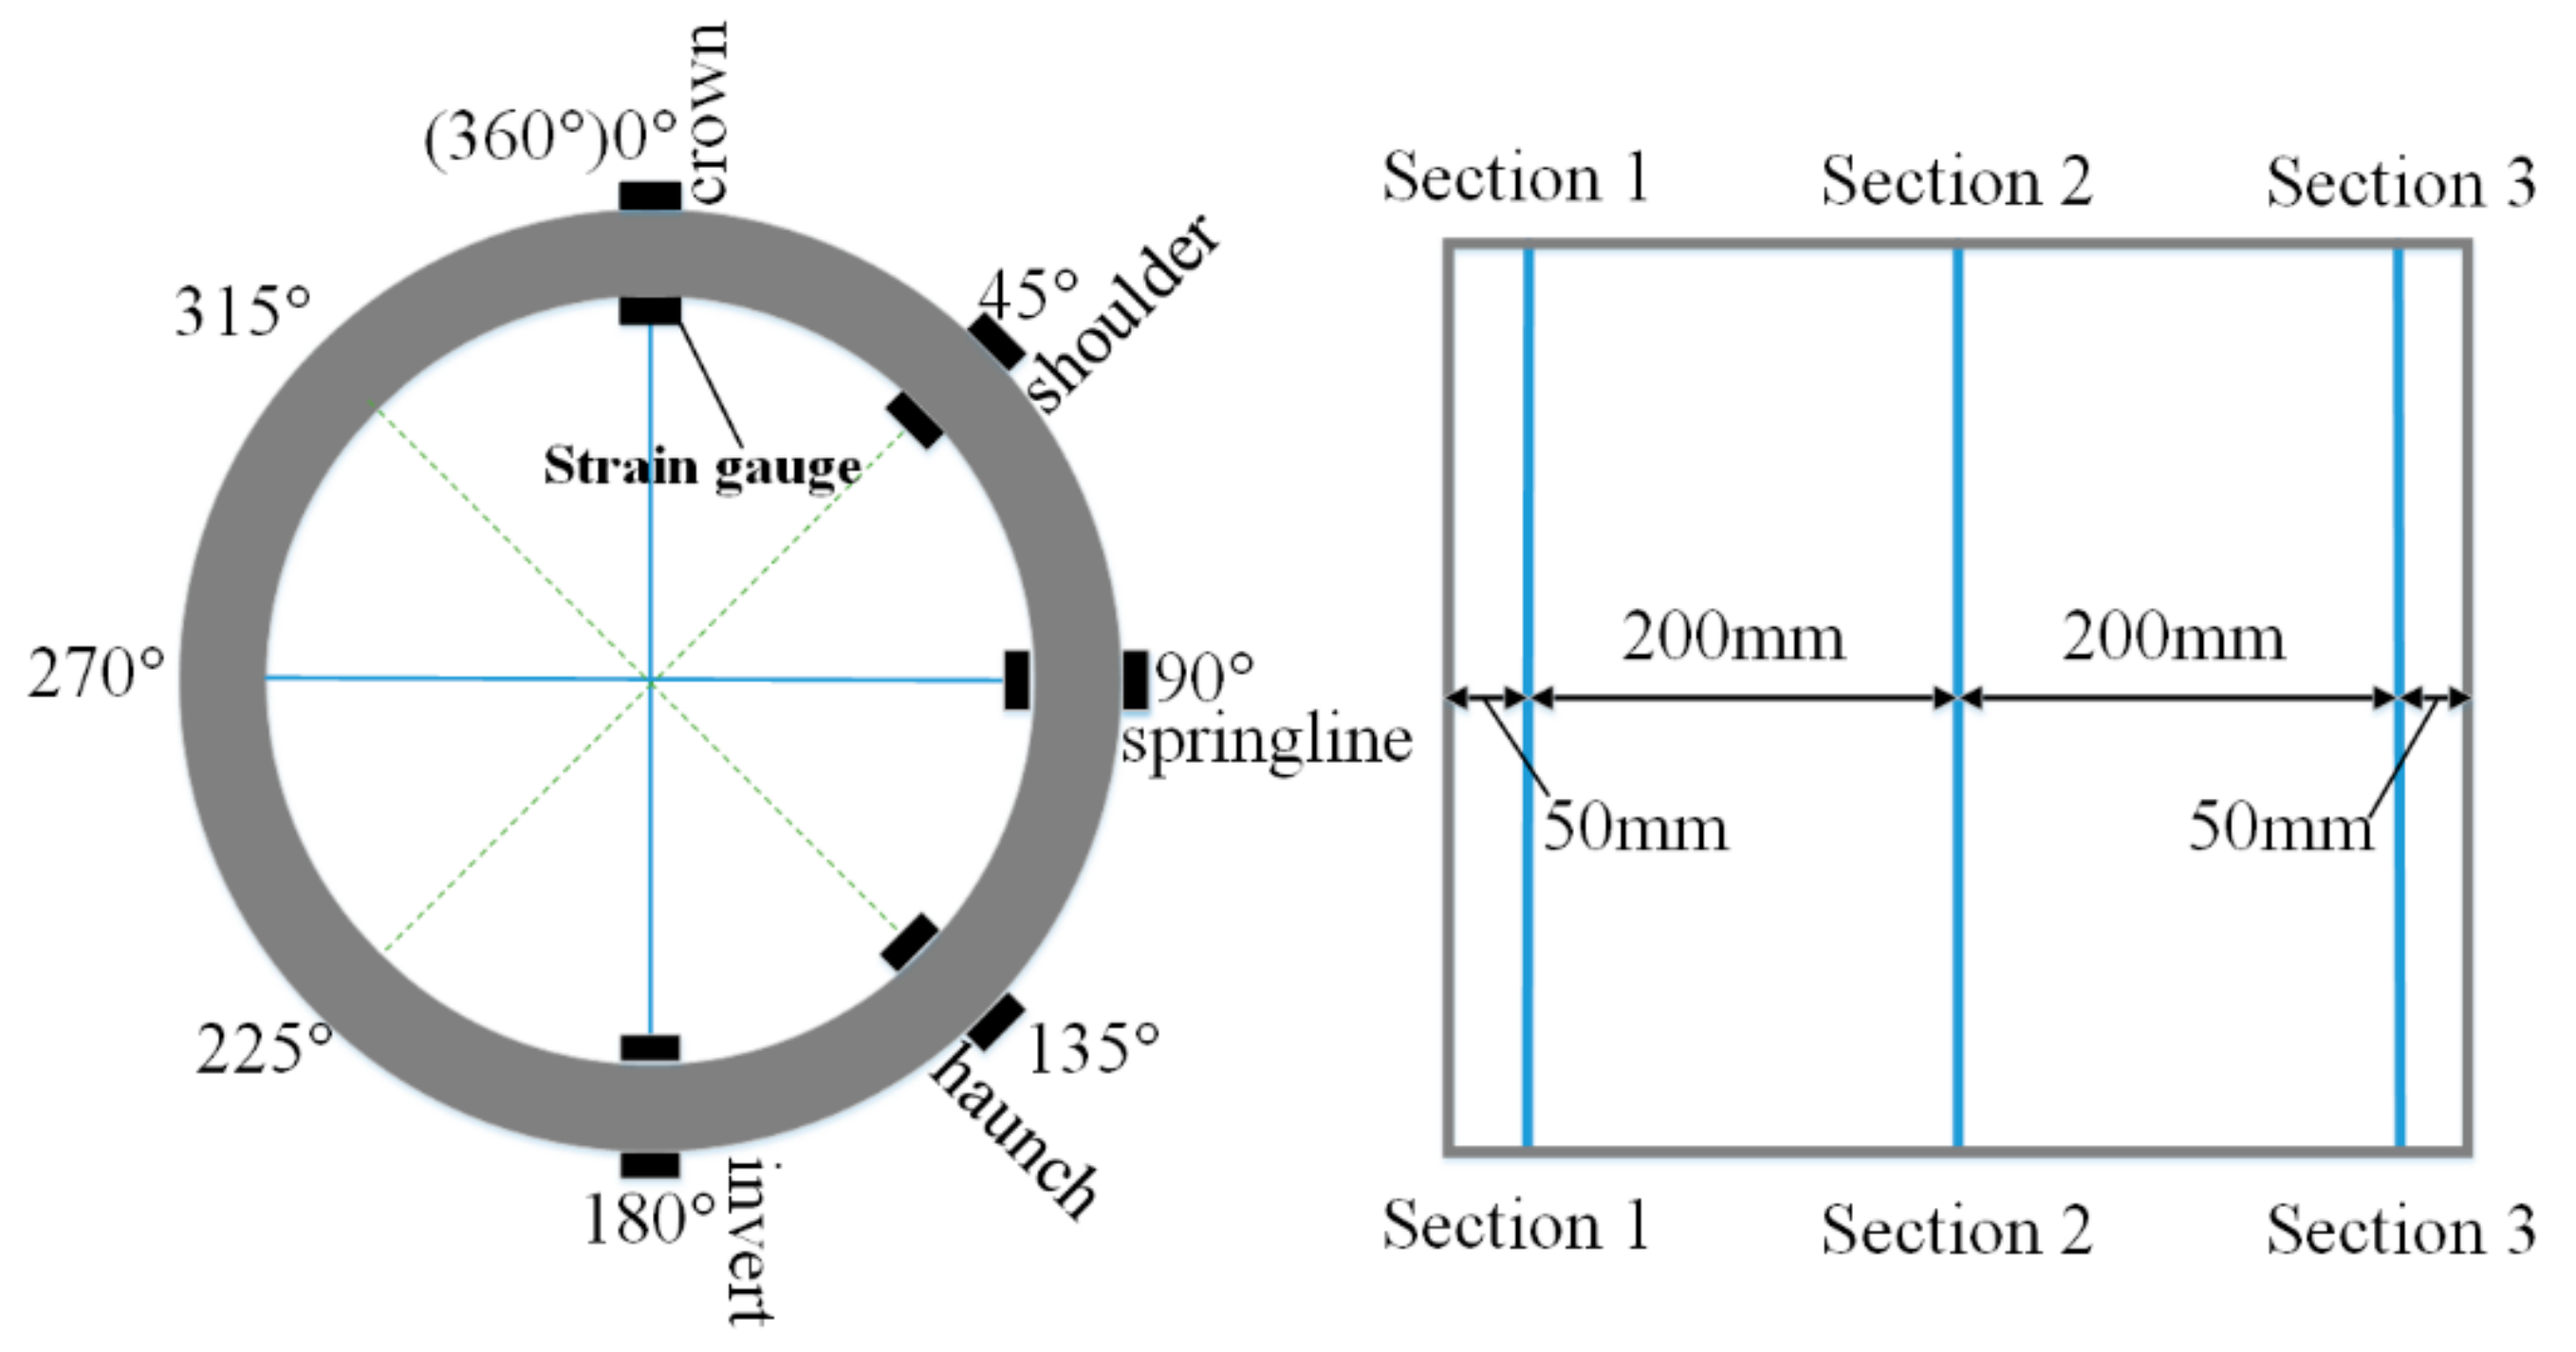
3.2. Strain Gage Layout
3.3. Strain Gage Paste
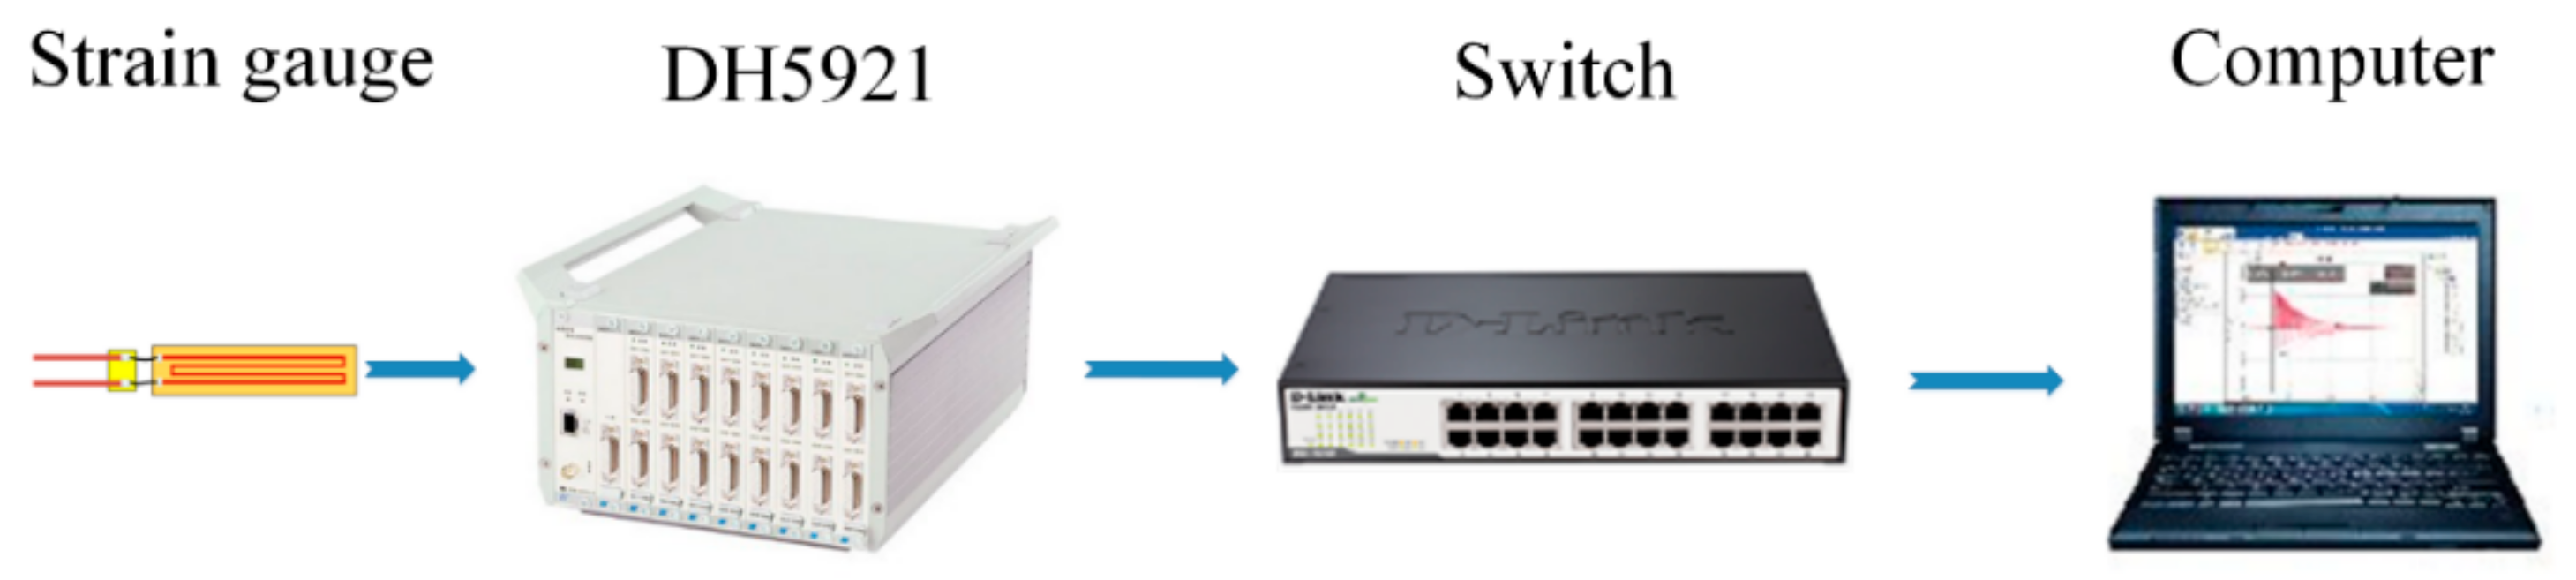
3.4. Data Acquisition Instrument
3.5. Test Device
3.6. Test Process
3.7. Determination of Failure Load
3.8. Design Conditions
4. Results and Discussion
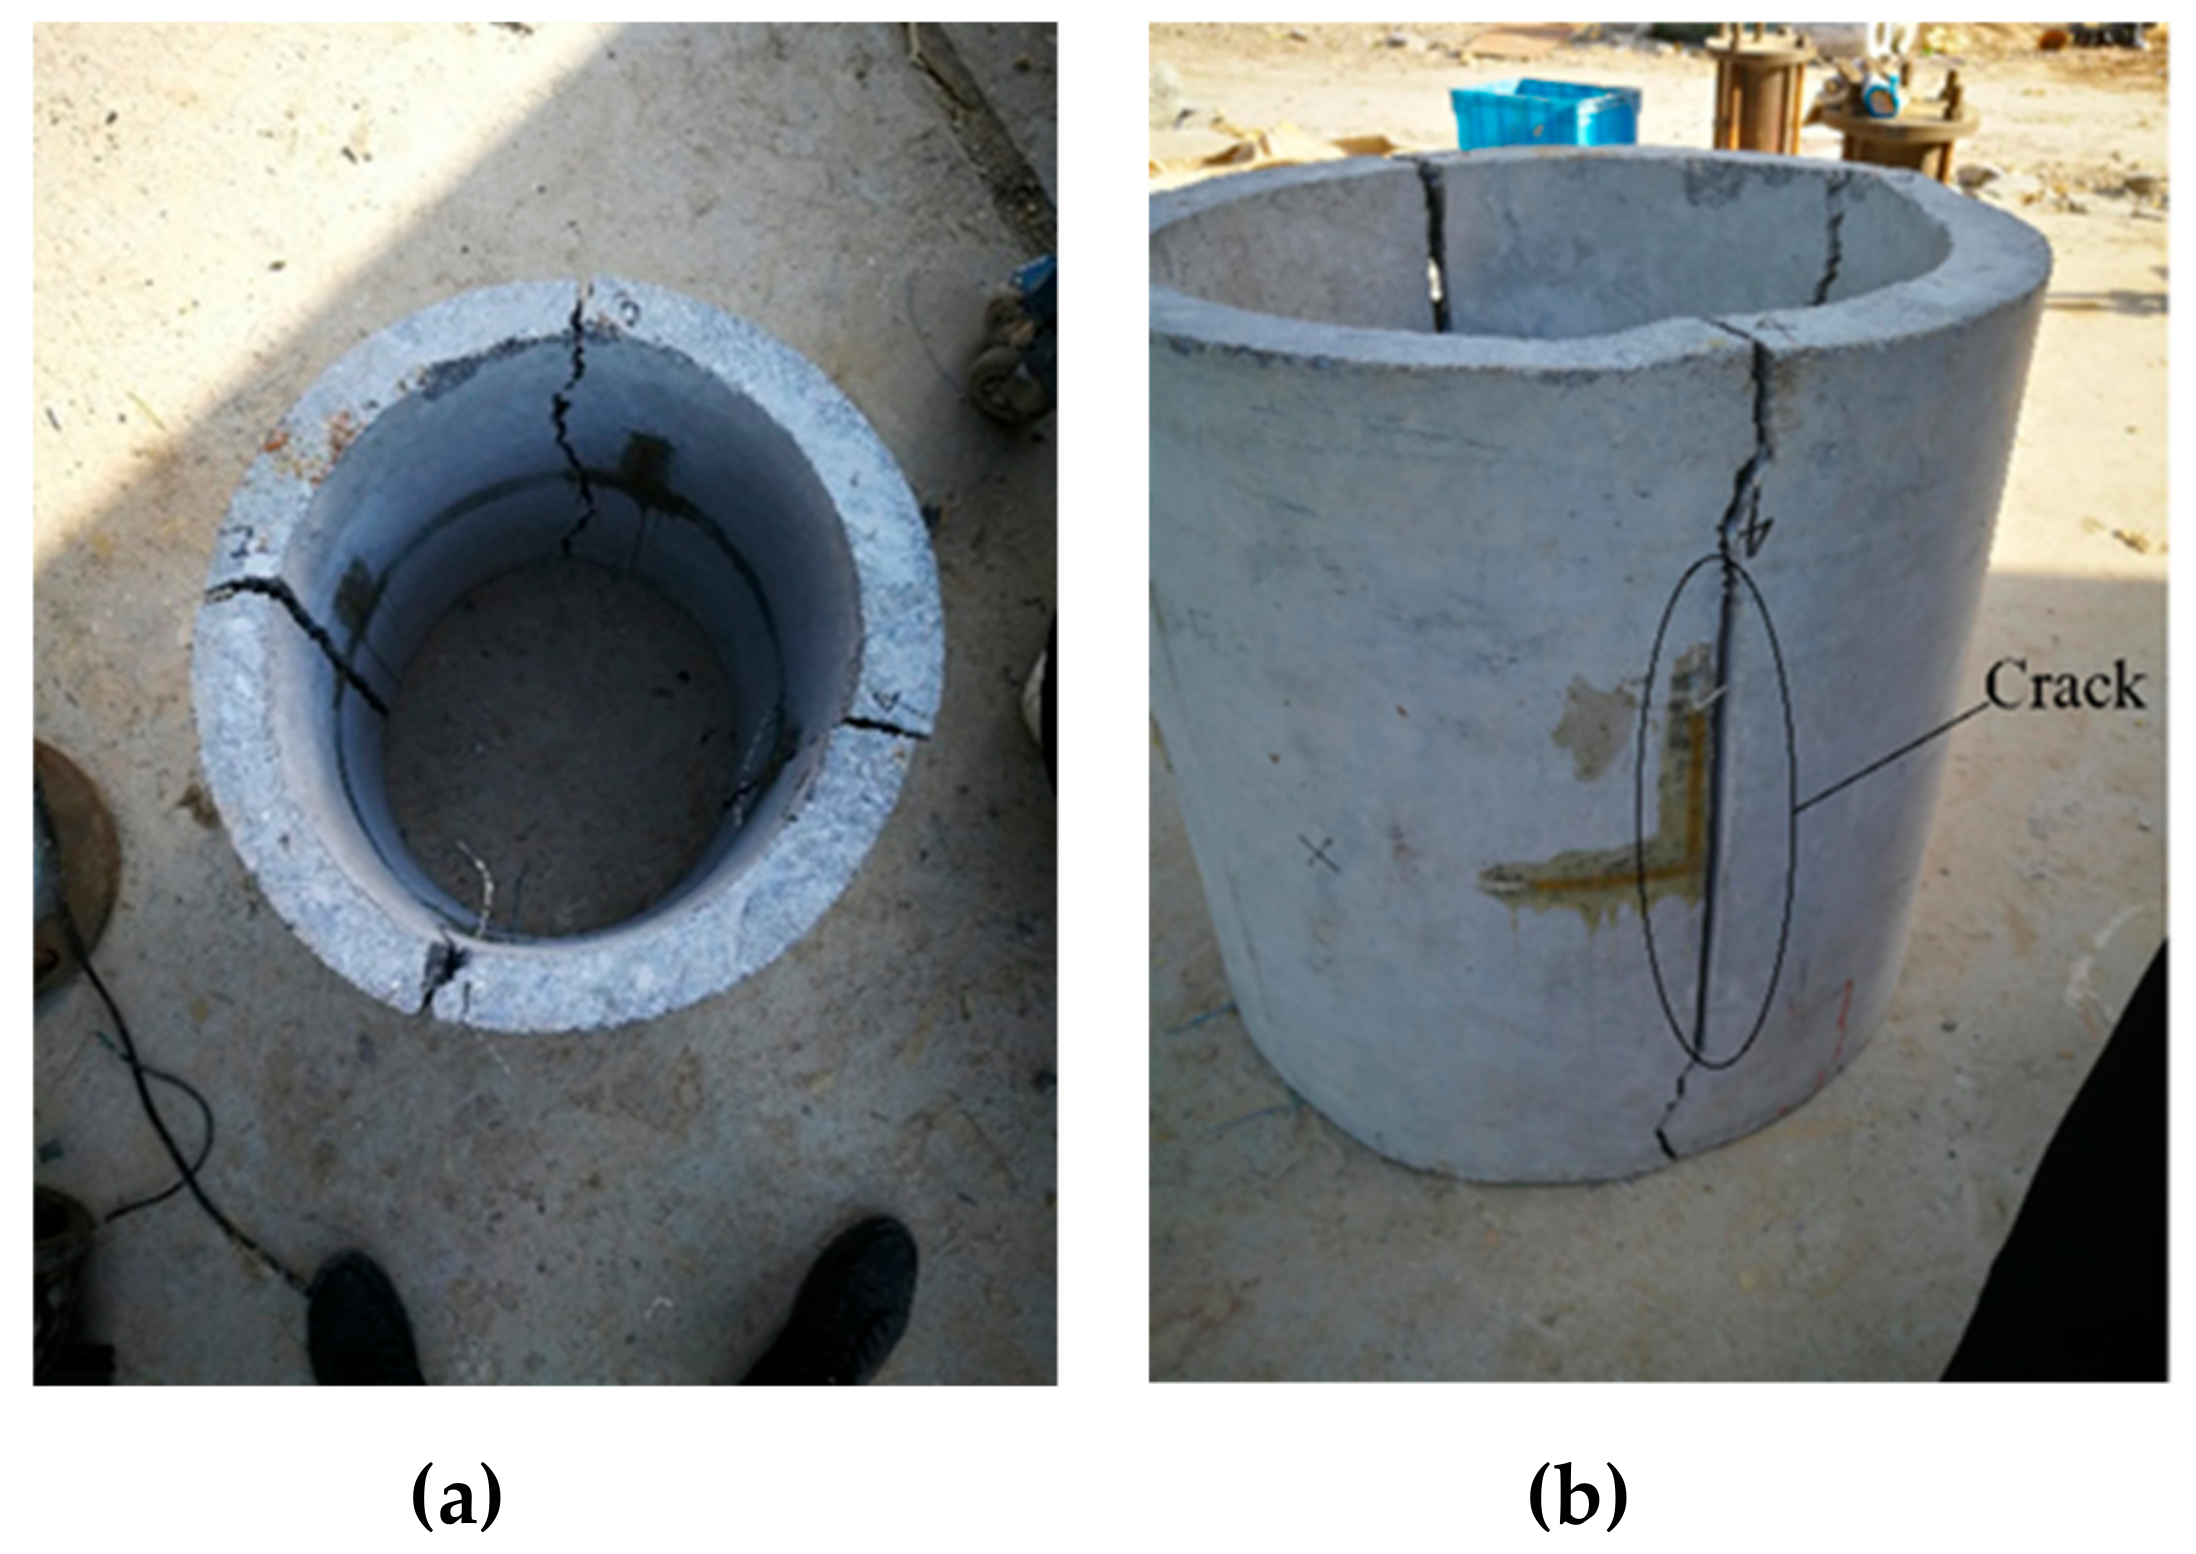
4.1. Test Process
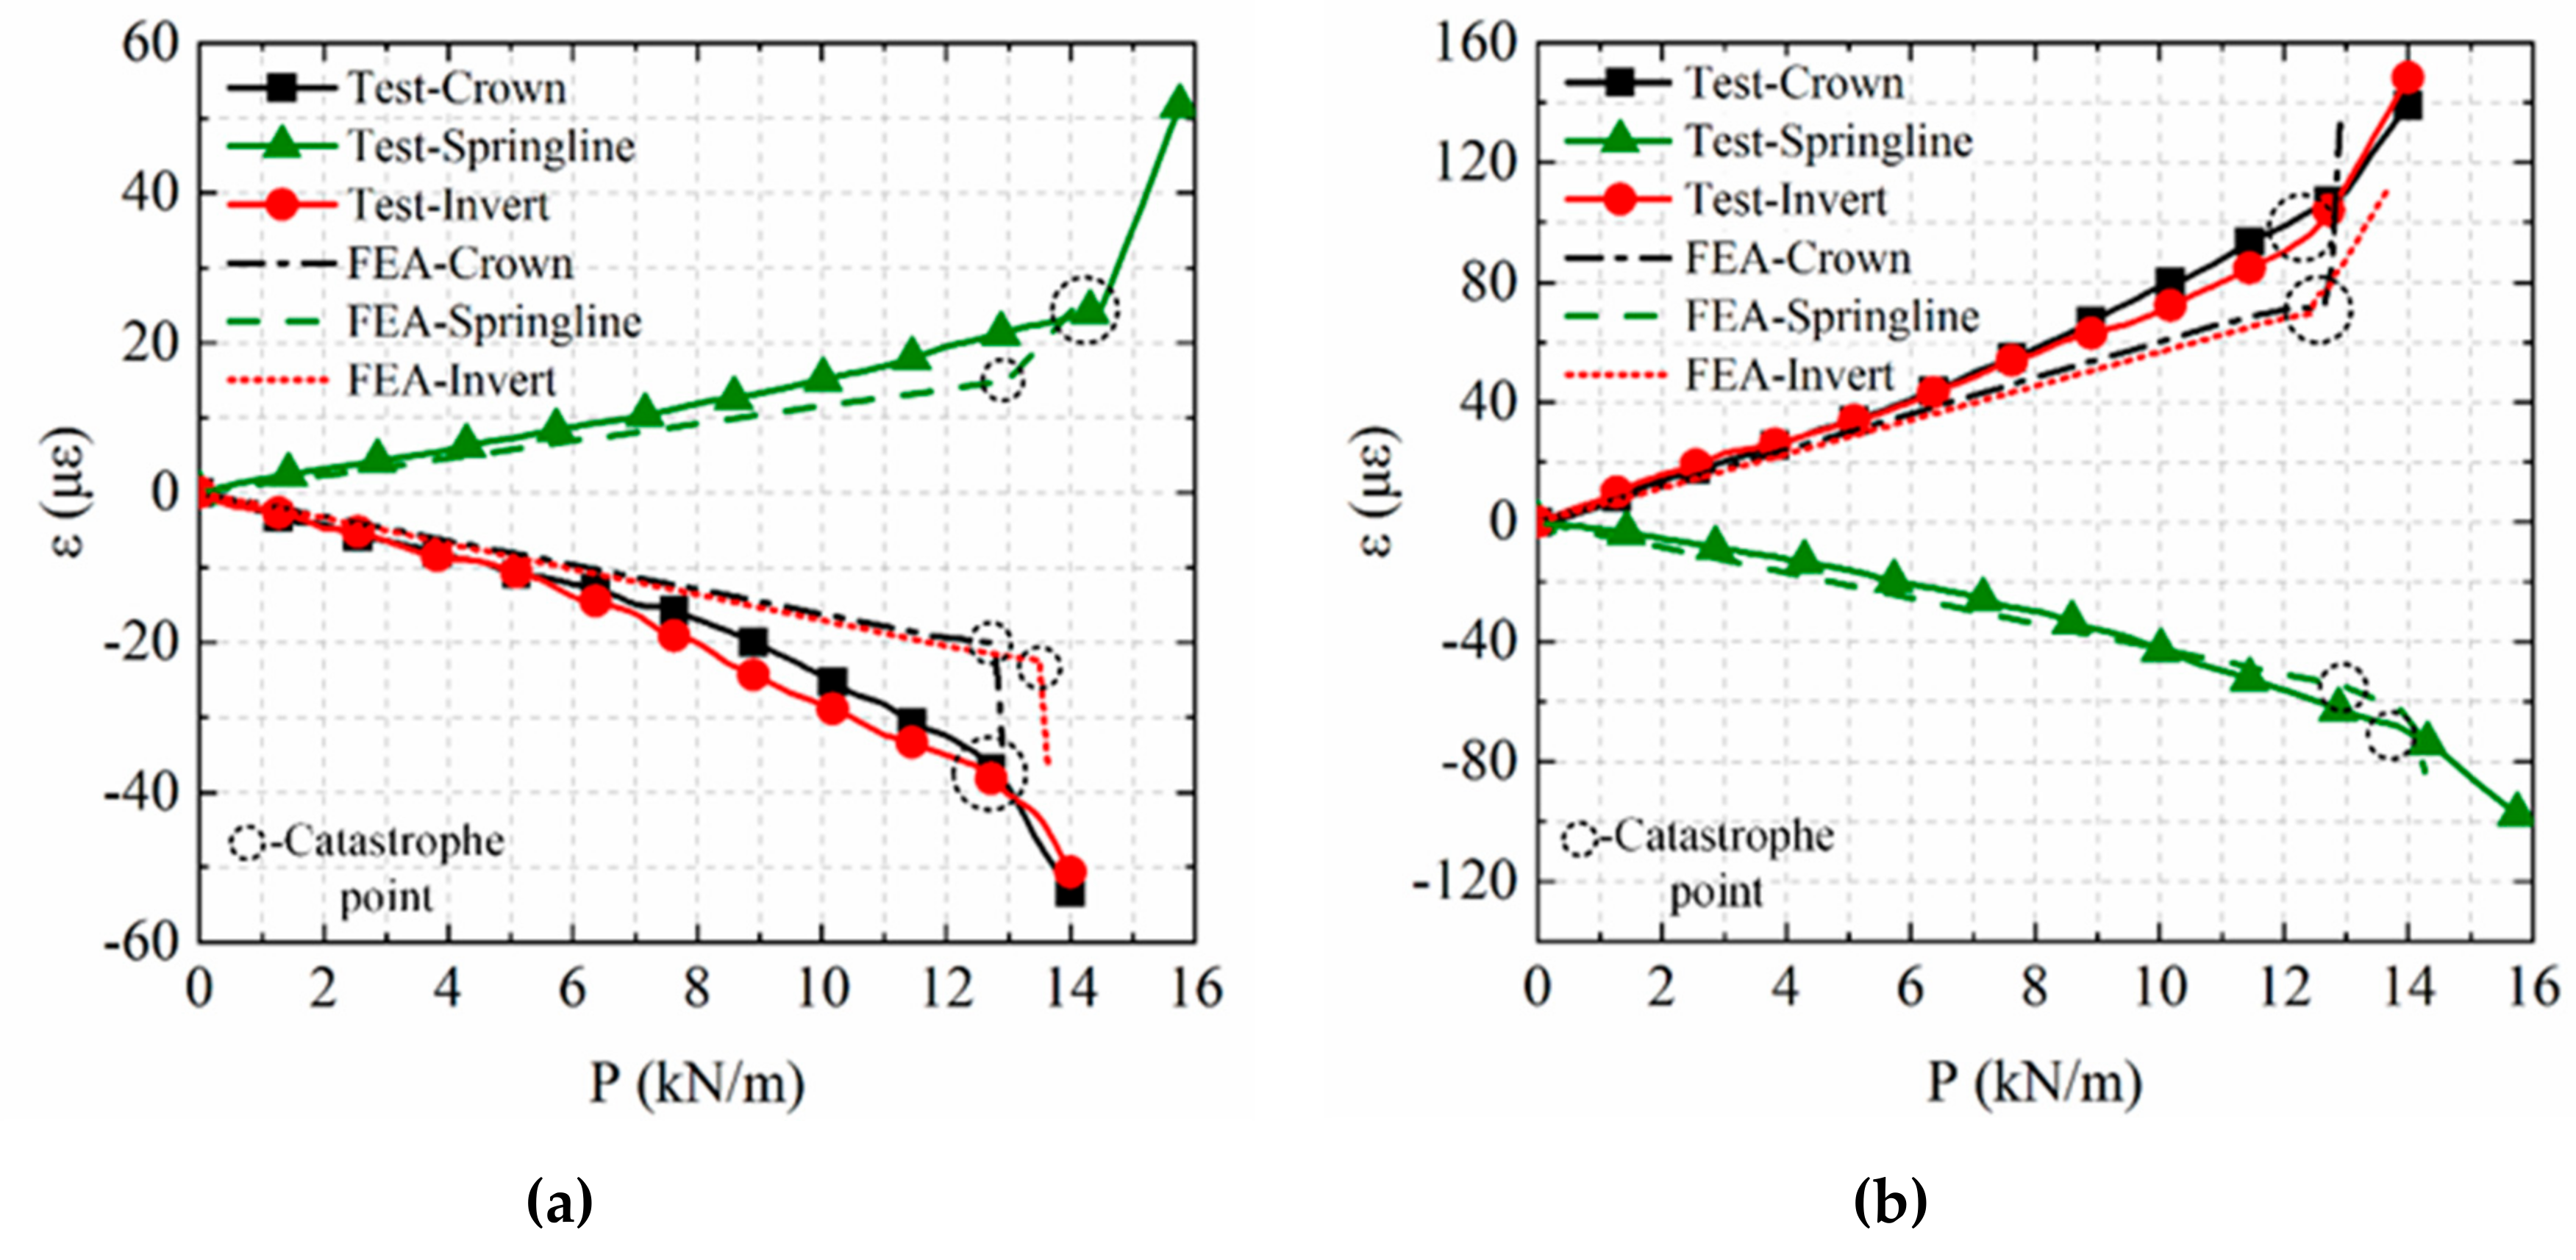
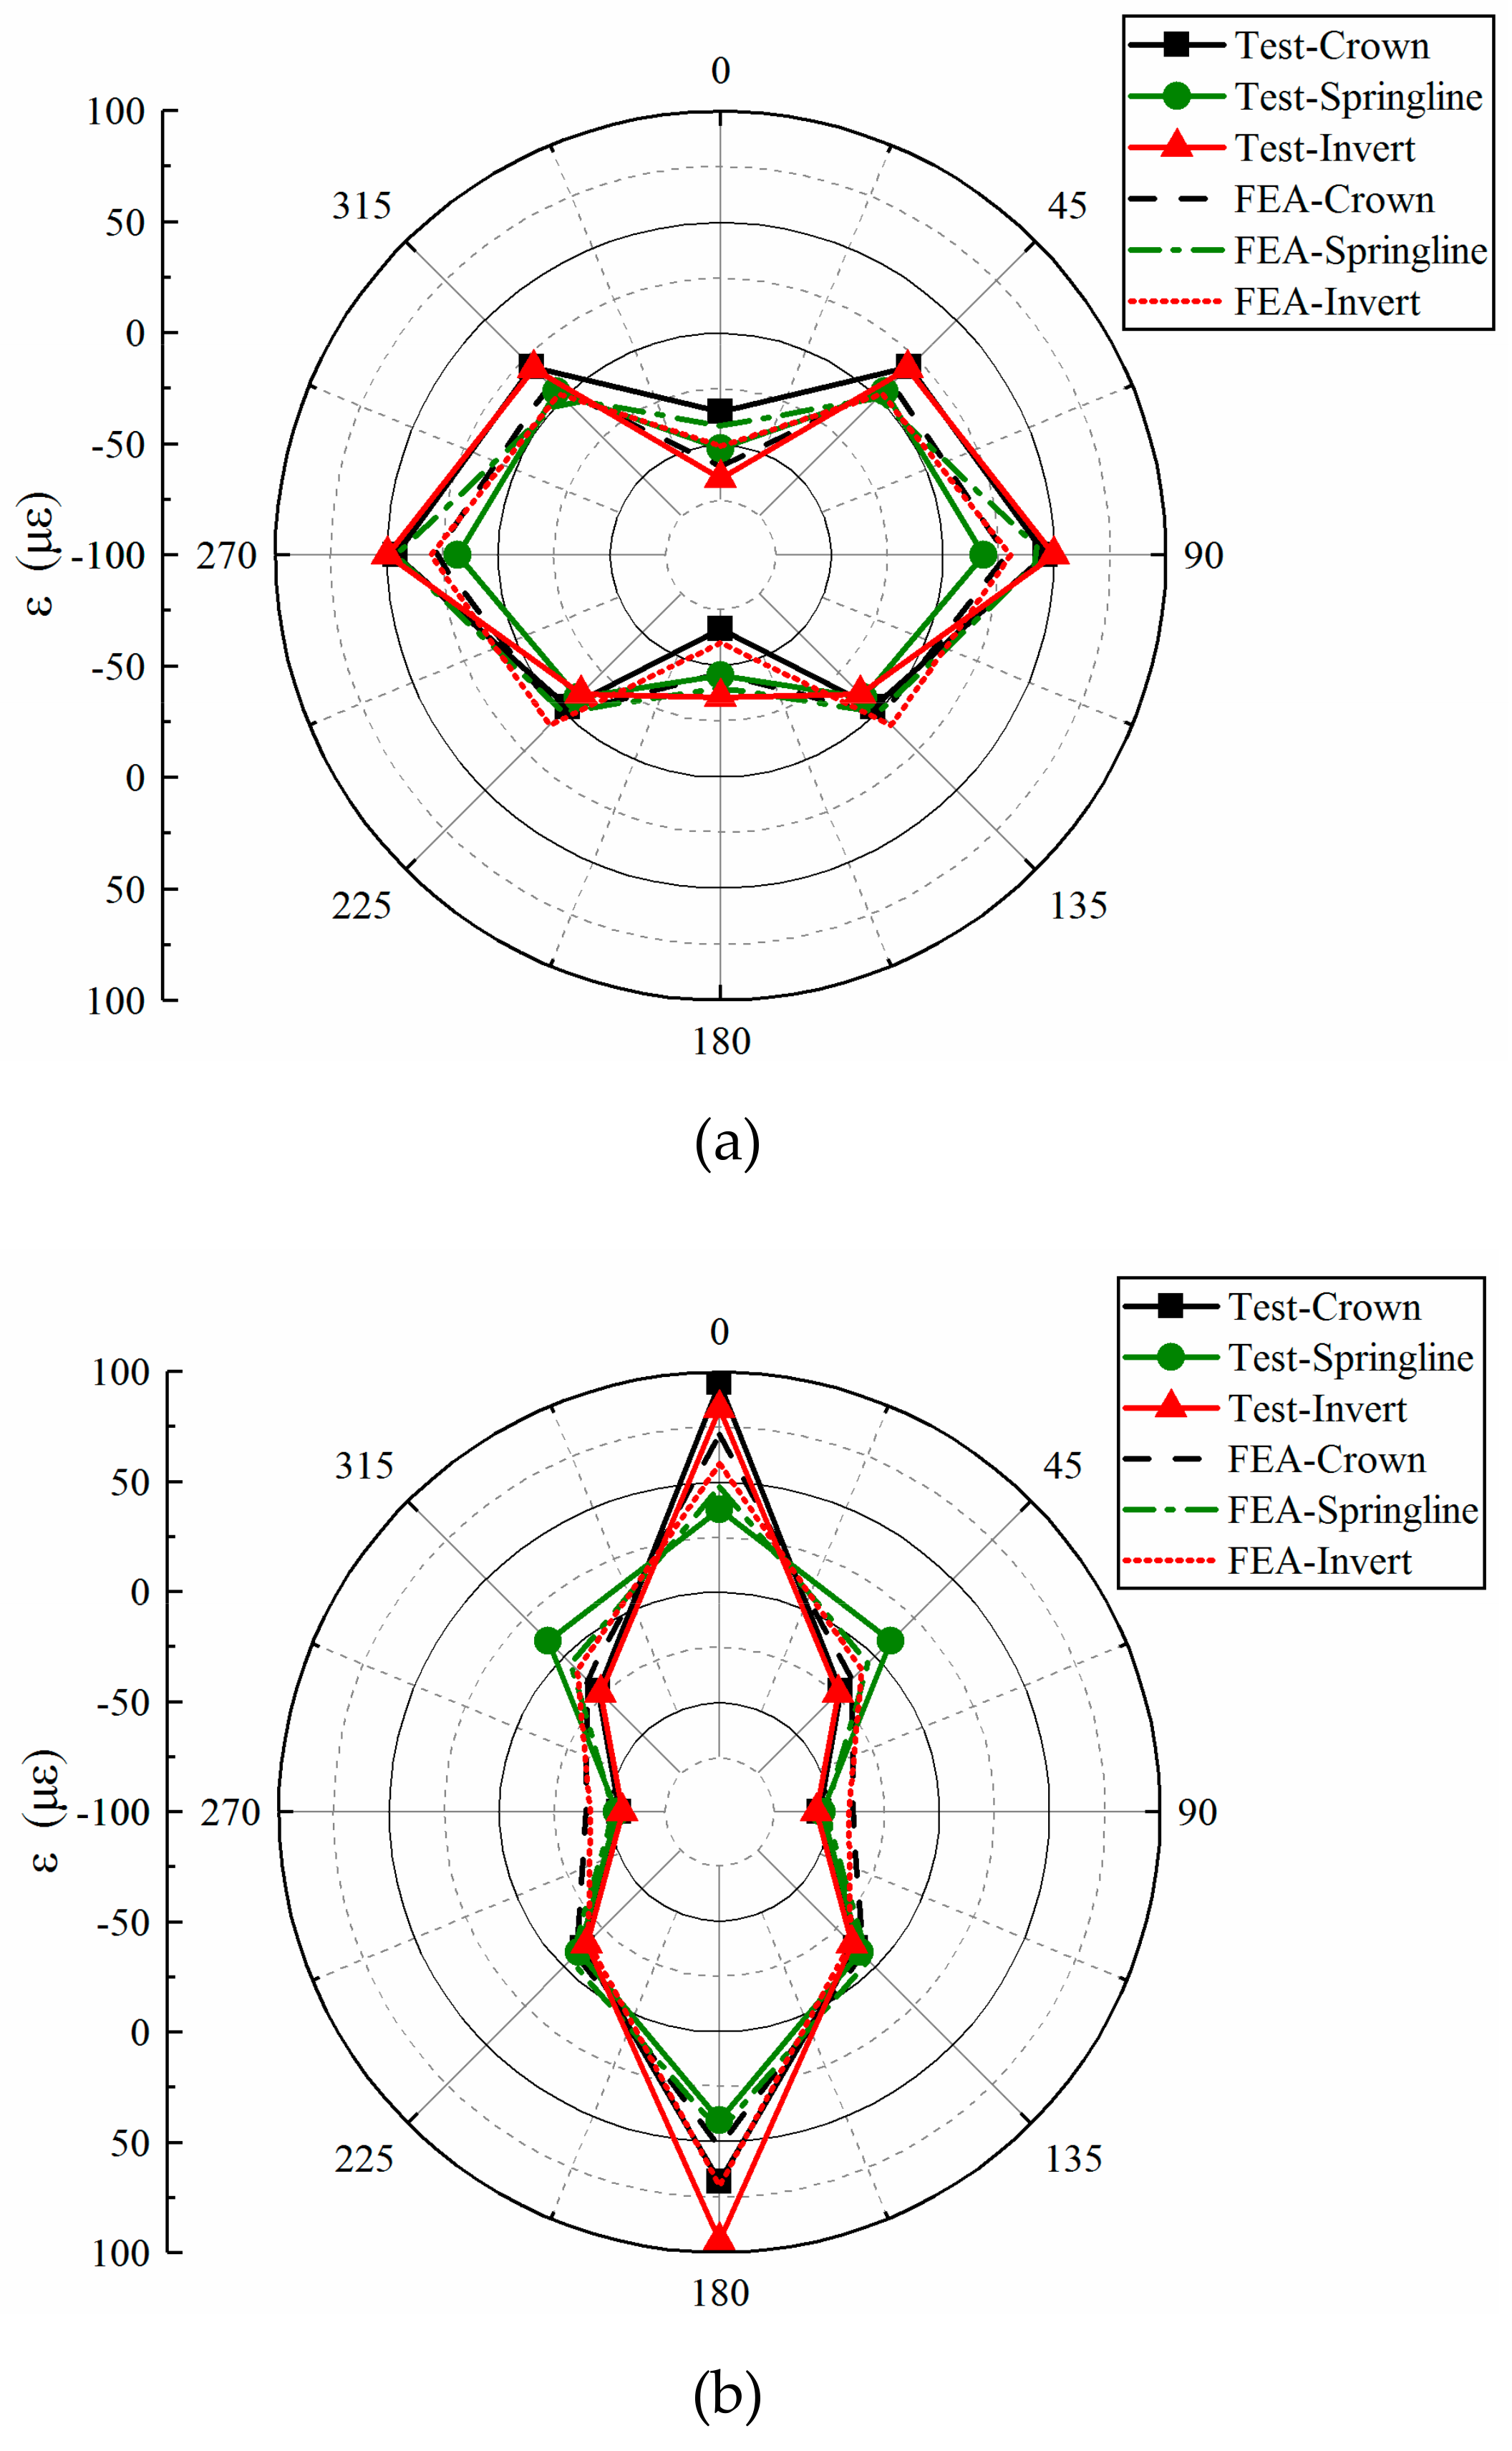
4.2. Comparison between Numerical and Experimental Results of the Intact Pipe
4.3. Comparison between Simulated and Measured Results of the Pipes with Pre-Existing Cracks
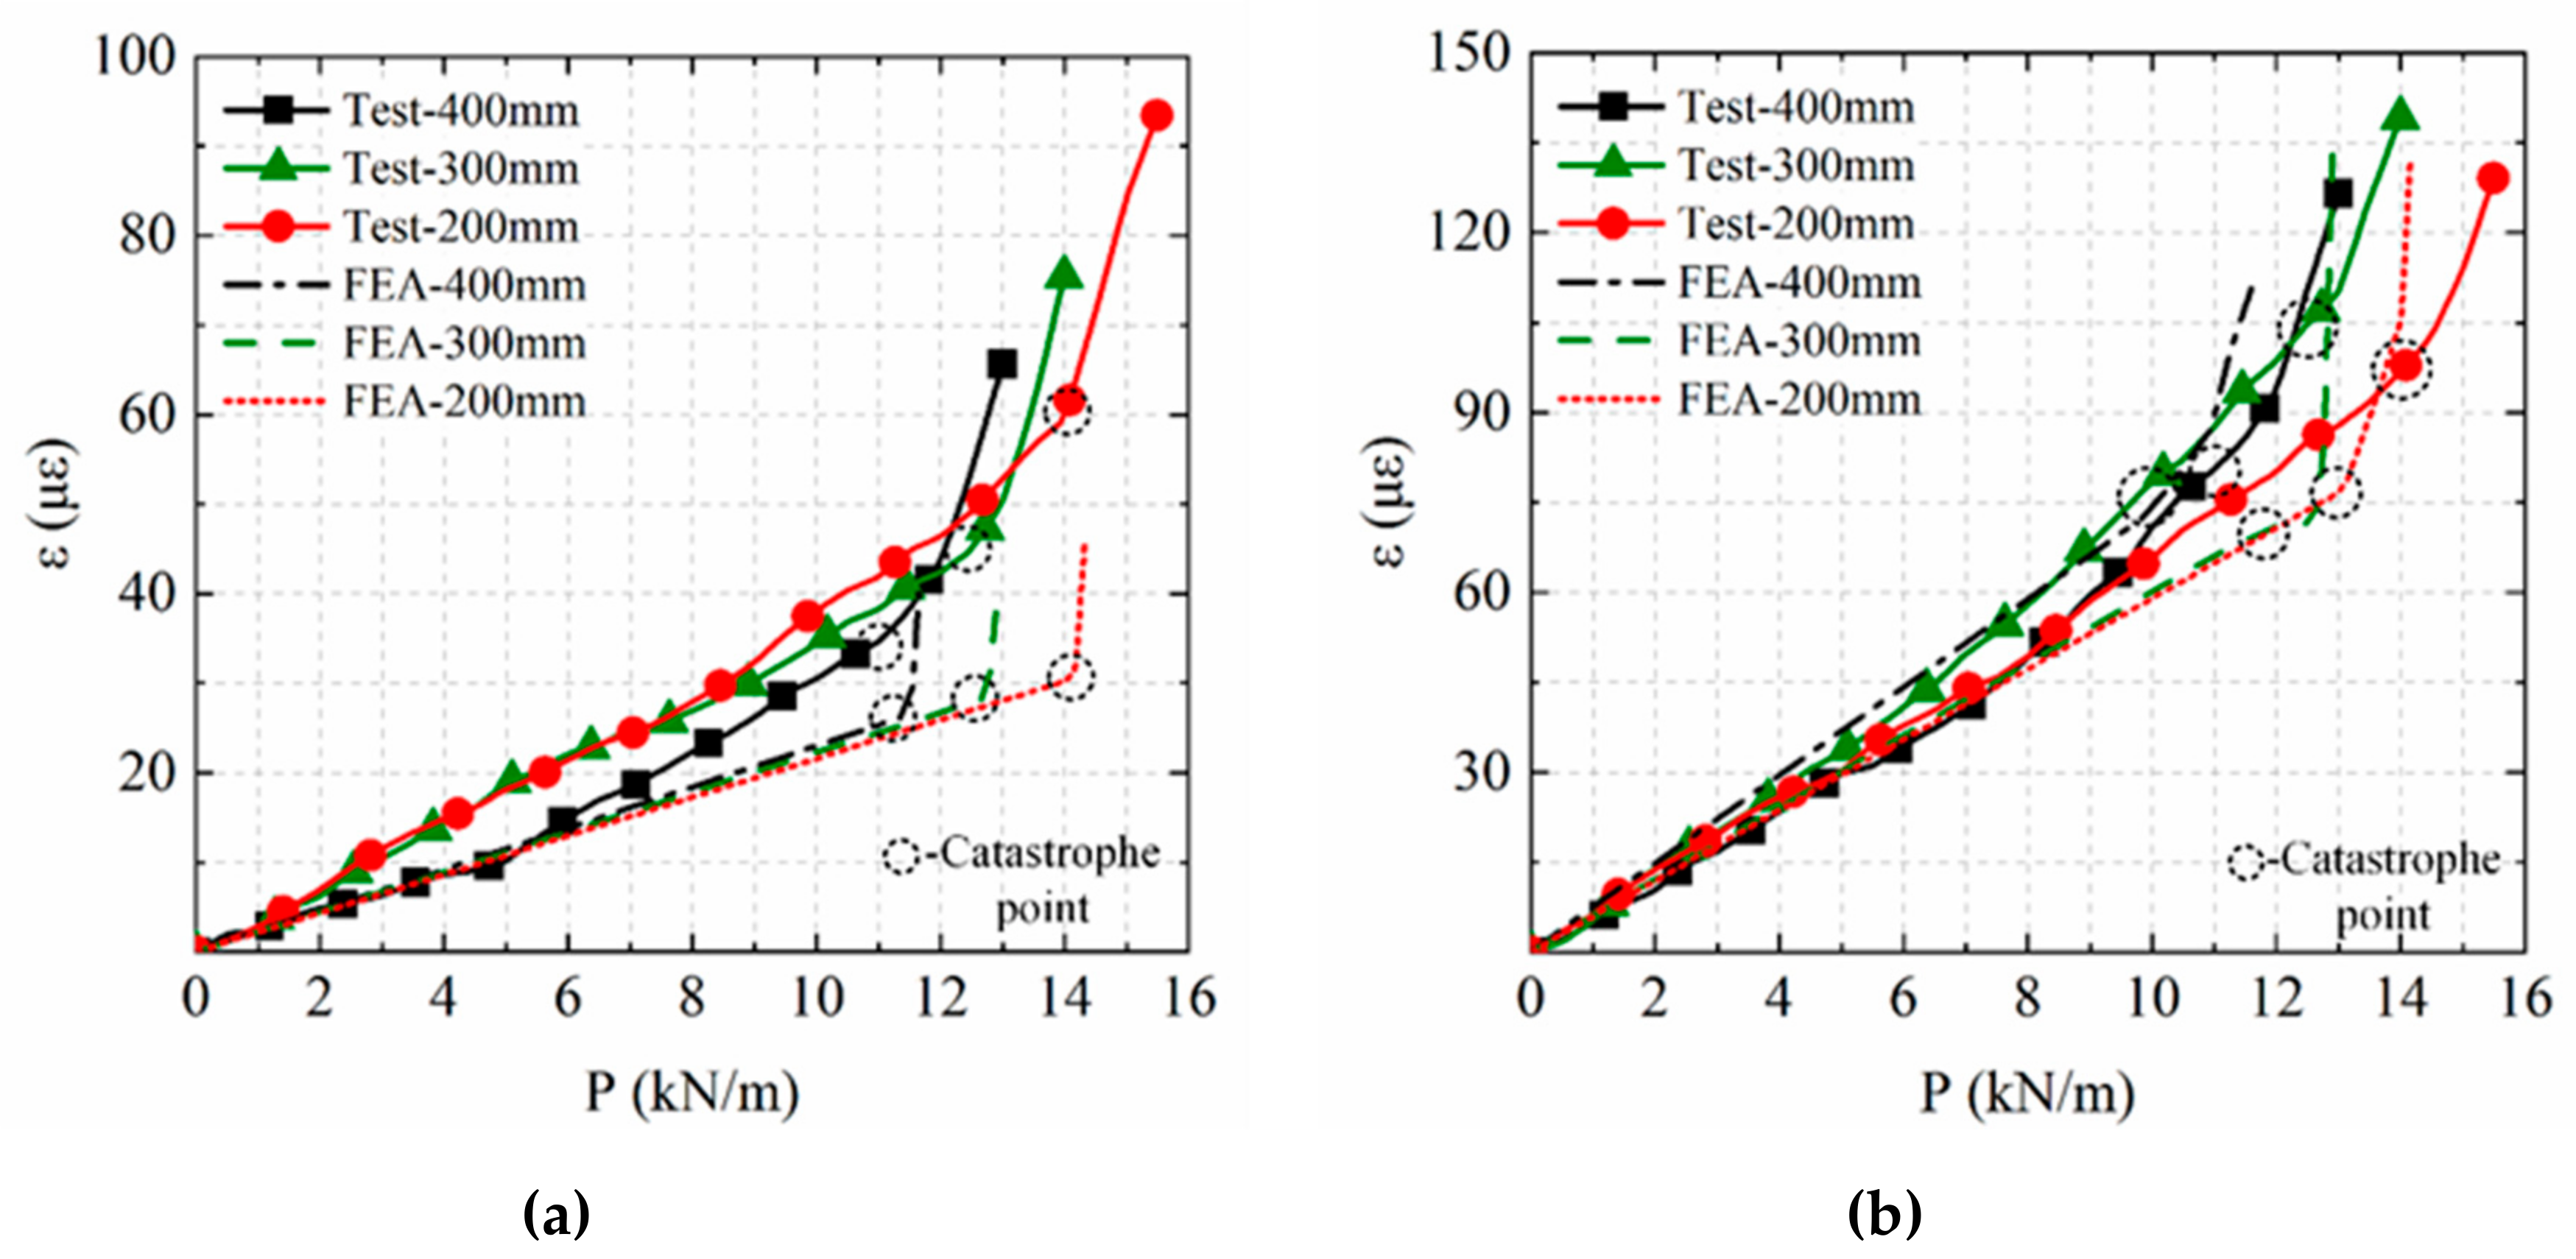
4.3.1. Effect of Crack Length
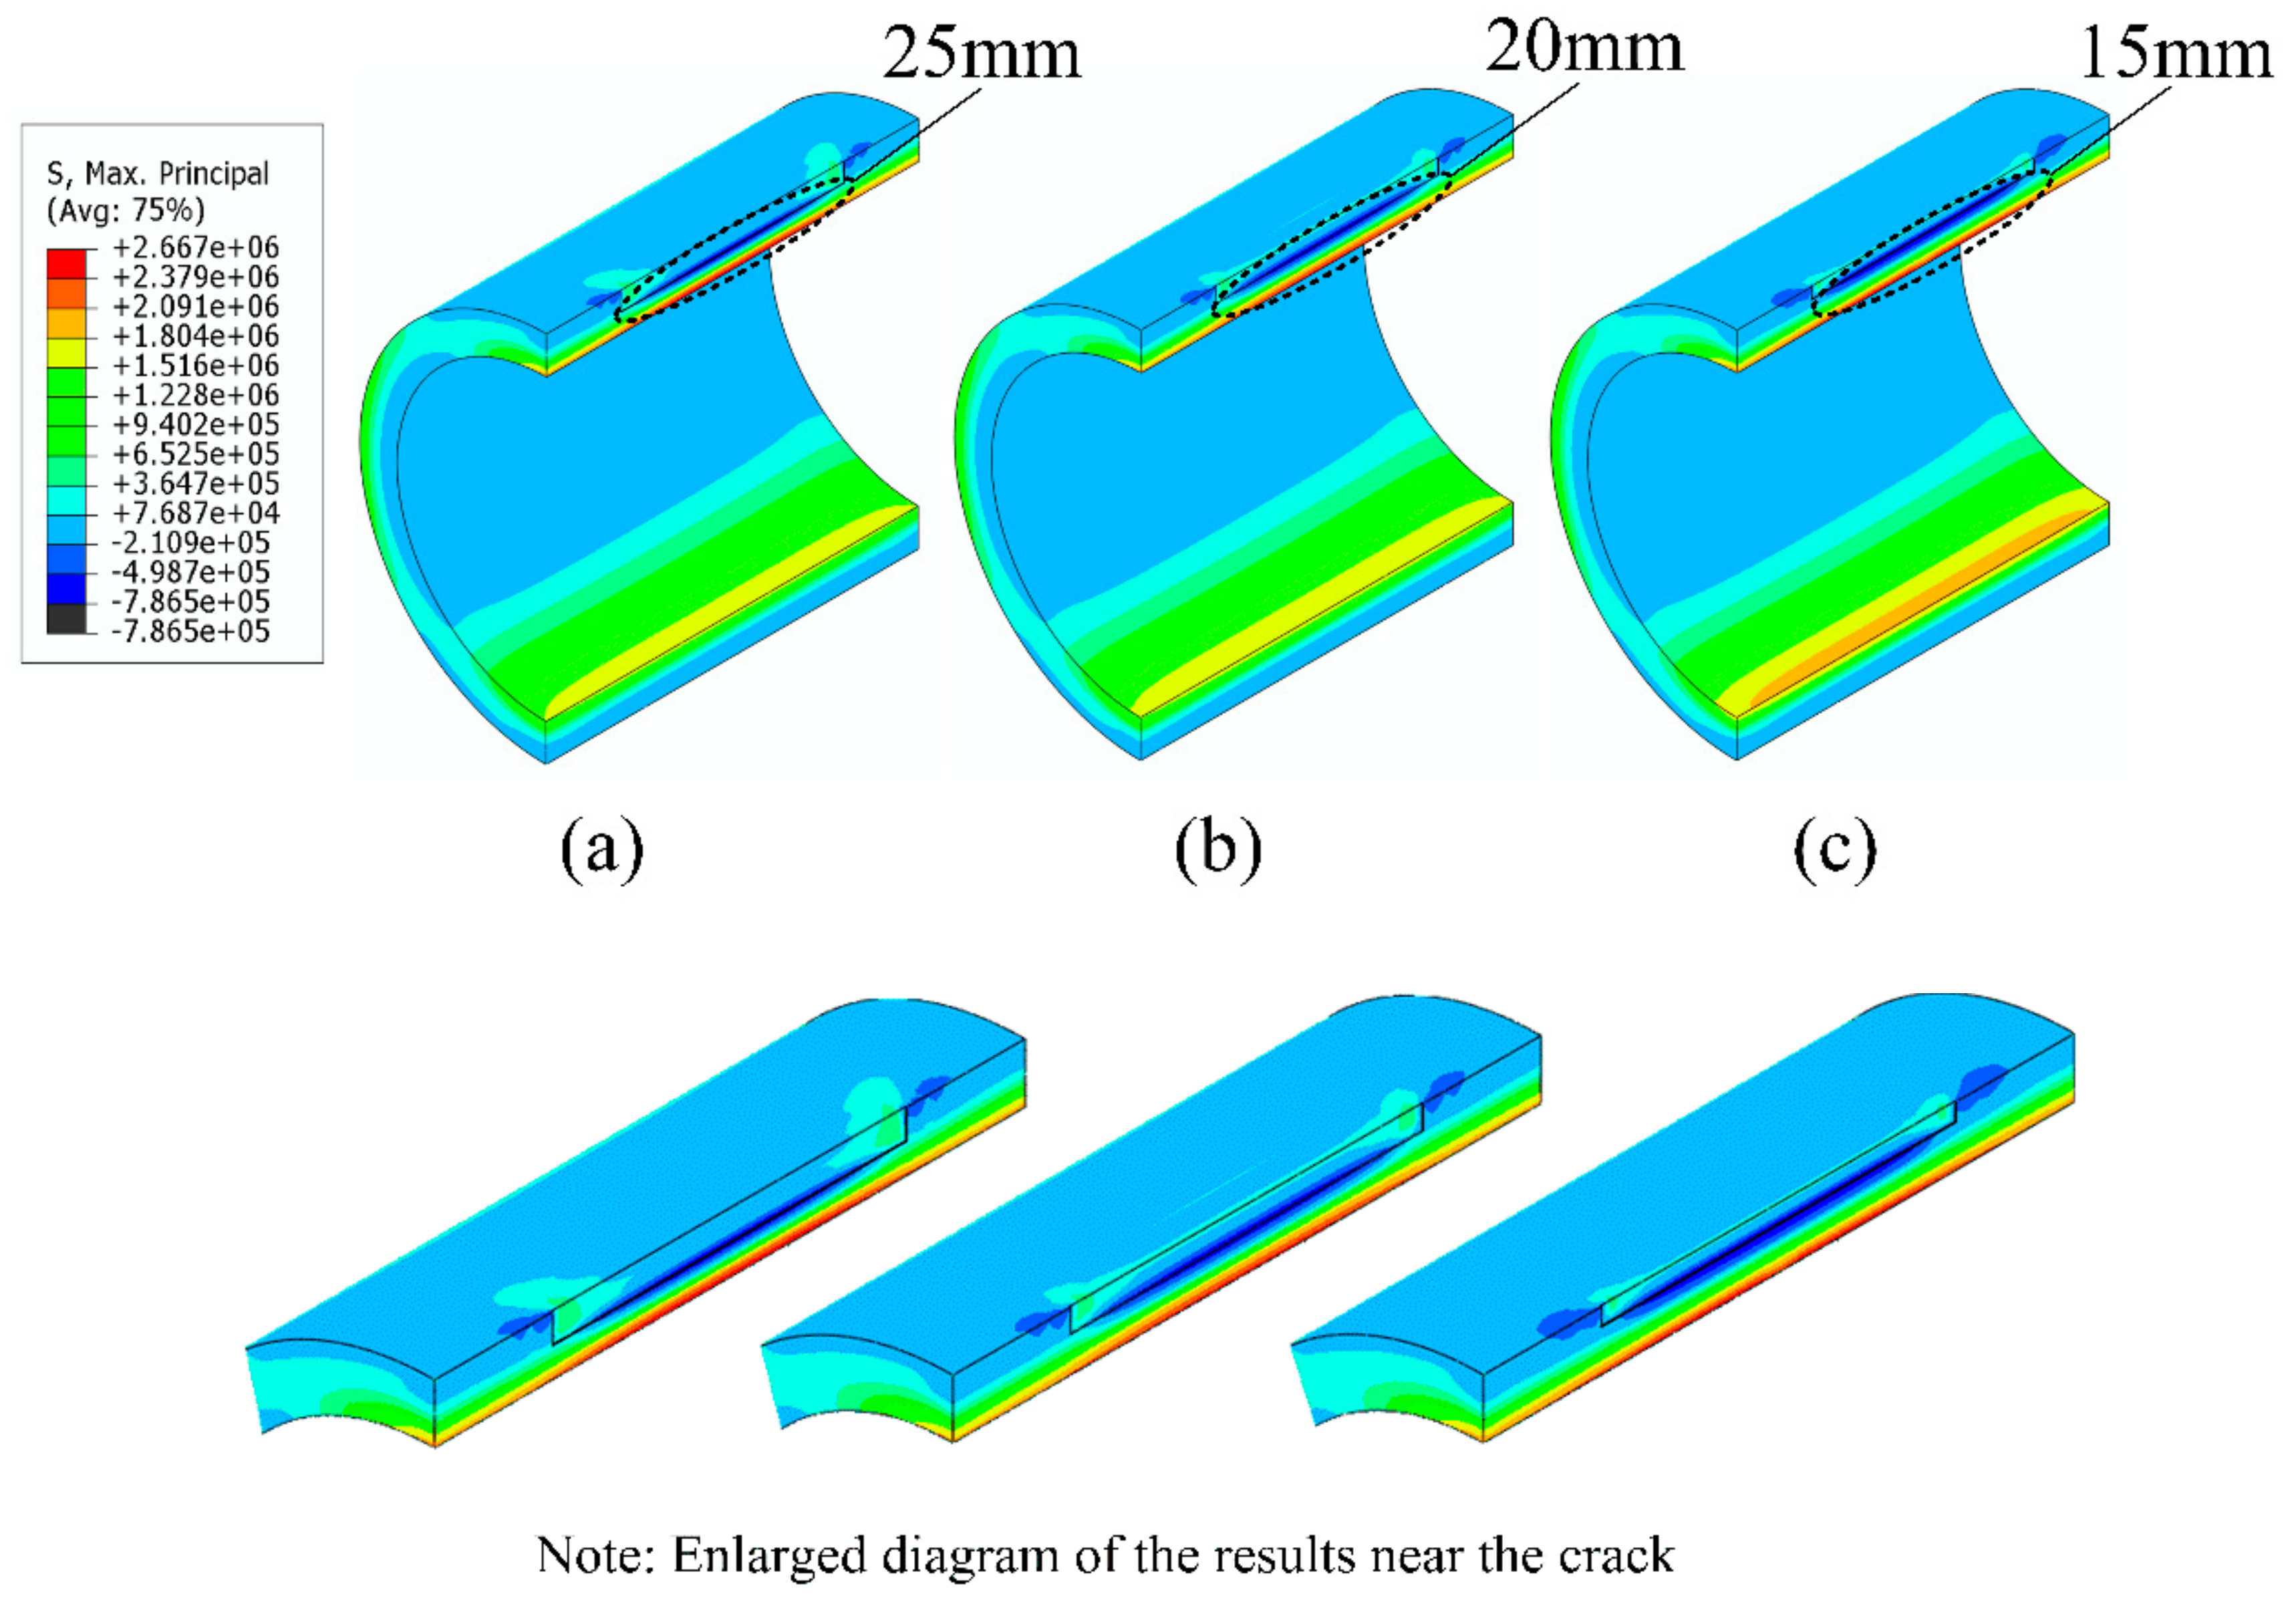
4.3.2. Effect of Crack Depth
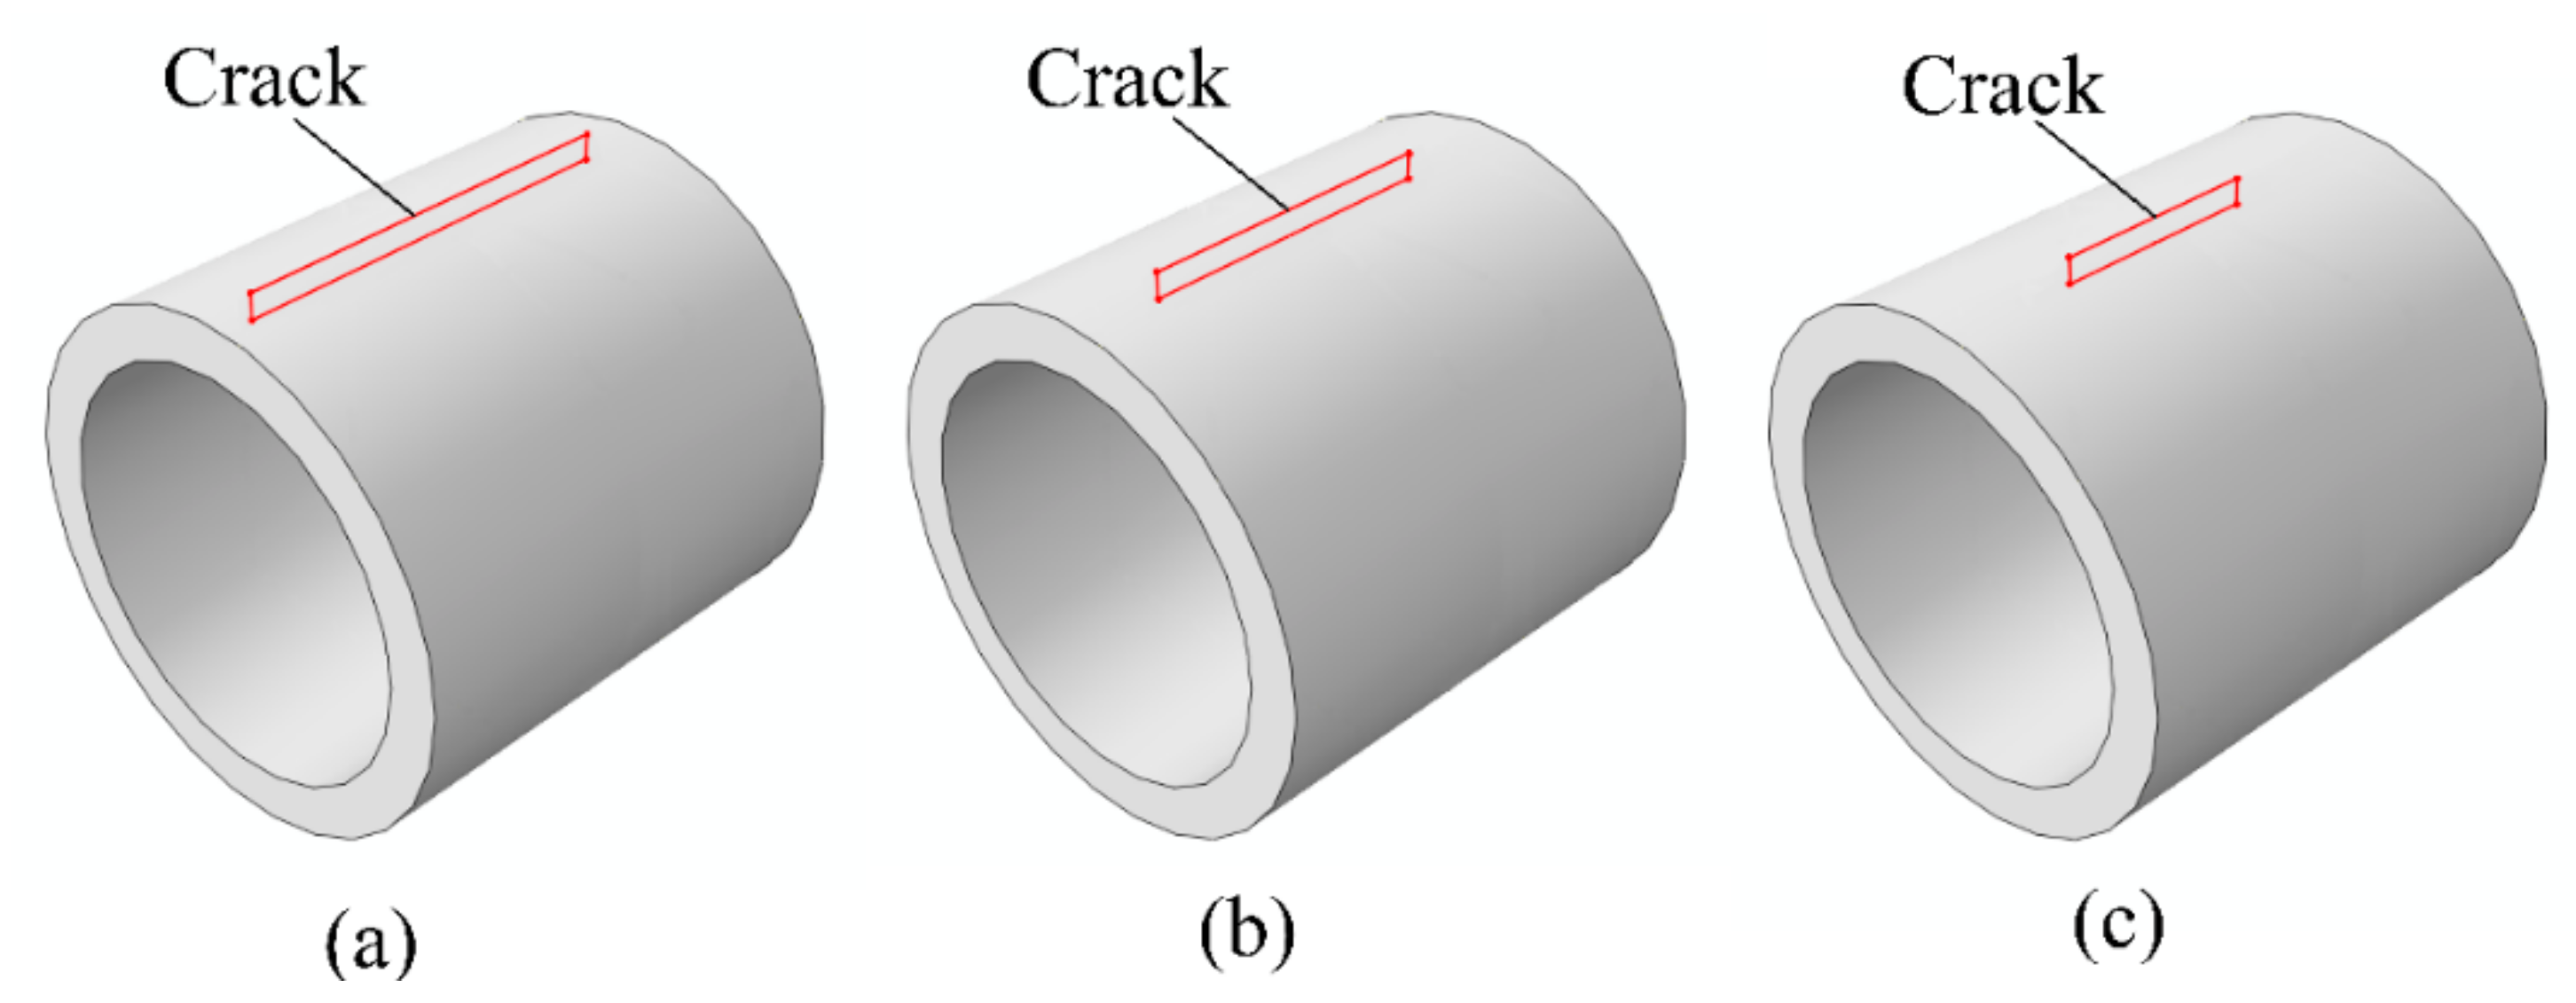
4.3.3. Effect of Crack Location
5. Conclusions
Author Contributions
Funding
Conflicts of Interest
References
- Abel, T. Changes in strength parameters of pipelines rehabilitated with close-fit trolining liners–numerical analysis based on laboratory tests. Arch. Civ. Mech. Eng. 2016, 16, 30–40. [Google Scholar] [CrossRef]
- Buda-Ozog, L.; Skrzypczak, I.; Kujda, J. Cracks analysis in the reinforced concrete pipes. Balt. J. Road Bridge Eng. 2017, 12, 88–93. [Google Scholar] [CrossRef]
- Nourpanah, N.; Taheri, F. Development of a reference strain approach for assessment of fracture response of reeled pipelines. Eng. Fract. Mech. 2010, 77, 2337–2353. [Google Scholar] [CrossRef]
- Nourpanah, N.; Taheri, F. Ductile crack growth and constraint in pipelines subject to combined loadings. Eng. Fract. Mech. 2011, 78, 2010–2028. [Google Scholar] [CrossRef]
- Robert, D.J.; Rajeev, P.; Kodikara, J.; Rajani, B. Equation to predict maximum pipe stress incorporating internal and external loadings on buried pipes. Can. Geotech. J. 2016, 53, 1315–1331. [Google Scholar] [CrossRef]
- Li, C.; Zhong, Z.; Bie, C.; Liu, X. Field performance of large section concrete pipes cracking during jacking in Chongqing—A case study. Tunn. Undergr. Space Technol. 2018, 82, 568–583. [Google Scholar] [CrossRef]
- Jayadevan, K.R.; Østby, E.; Thaulow, C. Fracture response of pipelines subjected to large plastic deformation under tension. Int. J. Press. Vessel. Pip. 2004, 81, 771–783. [Google Scholar] [CrossRef]
- Lay, G.R.; Brachman, R.W.I. Full-scale physical testing of a buried reinforced concrete pipe under axle load. Can. Geotech. J. 2013, 51, 394–408. [Google Scholar] [CrossRef]
- Silva, J.D.; El Debs, M.K.; Beck, A.T. Reliability evaluation of reinforced concrete pipes in crack opening limit state. Rev. IBRACON Estrut. Mater. 2008, 1, 314–330. [Google Scholar] [CrossRef][Green Version]
- BaZant, Z.P.; Cao, Z. Size effect in brittle failure of unreinforced pipes. J. Proc. 1986, 83, 369–373. [Google Scholar]
- Hajali, M.; Alavinasab, A.; Shdid, C.A. Structural performance of buried prestressed concrete cylinder pipes with harnessed joints interaction using numerical modeling. Tunn. Undergr. Space Technol. 2016, 51, 11–19. [Google Scholar] [CrossRef]
- Brachman, R.W.; Moore, I.D.; Rowe, R.K. The performance of a laboratory facility for evaluating the structural response of small-diameter buried pipes. Can. Geotech. J. 2000, 37, 281–295. [Google Scholar] [CrossRef]
- An, C.; Castello, X.; Duan, M.; Toledo Filho, R.D.; Estefen, S.F. Ultimate strength behaviour of sandwich pipes filled with steel fiber reinforced concrete. Ocean Eng. 2012, 55, 125–135. [Google Scholar] [CrossRef]
- Hu, S.W.; Liu, X.Y. Overload test and failure mechanism analysis of prestressed concrete cylinder pipe. Shuili Fadian Xuebao (J. Hydroelectr. Eng.) 2012, 31, 103–107. [Google Scholar]
- Hu, S.W.; Shen, J.; Wang, D.L.; Cai, X. Experiment and numerical analysis on super caliber prestressed concrete cylinder pipes with cracks. J. Hydraul. Eng. 2010, 41, 876–882. [Google Scholar]
- Zhang, C.J.; Chen, Y.L.; Li, Y.; Wang, J. Study on mechanism and prevention of cracking in prestressed concrete cylinder pipe of large diameter. J. Northwest Sci-Tech Univ. Agric. For. 2005, 33, 93–98. [Google Scholar]
- Zhu, J.J.; Hu, S.W. Study on external overload experiment of steel sleeve concrete pipeline (SSCP). Water Resour. Hydropower Eng. 2018, 49, 59–66. [Google Scholar]
- Zhao, X.L.; Dou, T.S.; Yan, J.Q.; Wang, R.L. Experimental study on bearing capacity of Longitudinal cracks on the outer surface of PCCP. China Concr. Cem. Prod. 2012, 12, 37–40. [Google Scholar]
- Zhu, H.H.; Guo, H.L.; Yan, S.D.; Li, C.F. Study on bearing capacity of buried pipeline containing corrosion defects under external force. J. Saf. Sci. Technol. 2018, 14, 70–75. [Google Scholar]
- Dou, T.S.; Cheng, B.Q.; Hu, H.; Xia, S.F.; Yang, J.X.; Zang, Q. The prototype test study of prestressed concrete cylinder pipe structure Deformation law II: The external pressure. J. Hydraul. Eng. 2018, 49, 207–215. [Google Scholar]
- Valiente, A. Stress corrosion failure of large diameter pressure pipelines of prestressed concrete. Eng. Fail. Anal. 2001, 8, 245–261. [Google Scholar] [CrossRef]
- Lee, J.; Fenves, G.L. Plastic-damage model for cyclic loading of concrete structures. J. Eng. Mech. 1998, 124, 892–900. [Google Scholar] [CrossRef]
- Li, B.; Fang, H.; He, H.; Yang, K.; Chen, C.; Wang, F. Numerical simulation and full-scale test on dynamic response of corroded concrete pipelines under multi-field coupling. Construction and Building Materials 2019, 200, 368–386. [Google Scholar] [CrossRef]
- Fang, H.; Li, B.; Wang, F.; Wang, Y.; Cui, C. The mechanical behaviour of drainage pipeline under traffic load before and after polymer grouting trenchless repairing. Tunnelling and Underground Space Technology 2018, 74, 185–194. [Google Scholar] [CrossRef]
- Zhai, K.; Fang, H.; Fu, B.; Wang, F.; Hu, B. Mechanical response of externally bonded CFRP on repair of PCCPs with broken wires under internal water pressure. Construction and Building Materials 2020, 239, 117878. [Google Scholar] [CrossRef]
- General Administration of Supervision, Inspection and Quarantine of the People’s Republic of China. GB/T 16752-2017, Test Methods of Concrete and Reinforced Concrete Sewer Pipes; Standards Press of China: Beijing, China, 2017. [Google Scholar]
- Li, B.; Fang, H.; Yang, K.; He, H.; Tan, P.; Wang, F. Mechanical Response and Parametric Sensitivity Analyses of a Drainage Pipe under Multiphysical Coupling Conditions. Complexity 2019. [Google Scholar] [CrossRef]
- Vazouras, P.; Karamanos, S.A.; Dakoulas, P. Mechanical behavior of buried steel pipes crossing active strike-slip faults. Soil Dyn. Earthq. Eng. 2012, 41, 164–180. [Google Scholar] [CrossRef]
- General Administration of Supervision, Inspection and Quarantine of the People’s Republic of China. GB/T 11836-2009, Concrete and Reinforced Concrete Sewer Pipes; Standards Press of China: Beijing, China, 2009. [Google Scholar]


| Property | Value |
|---|---|
| Concrete | C50 |
| Elastic modulus, E (MPa) | 32500 |
| Poisson’s ratio, υ | 0.20 |
| Density, ρ (kg/m3) | 2500 |
| Compressive strength, σc (MPa) | 26.6 |
| Tensile strength, σt (MPa) | 2.66 |
| Dilation angle, ψ (°) | 30.0 |
| Eccentricity, e | 0.10 |
| The ratio of the initial equibiaxial compressive yield stress to the initial uniaxial compressive yield stress, n. | 1.16 |
| The ratio of the second stress invariant on the tensile meridian to the second stress invariant on the compressive meridian at an initial yield for any given values of the pressure invariant at which the maximum principal stress is negative, k. | 0.67 |
| Viscosity parameter, μ | 0.005 |
| Scheme | Numbie (104) | σmax (MPa) | T (h) |
|---|---|---|---|
| 1 | 6.00 | 2.44 | 1.2 |
| 2 | 6.35 | 2.51 | 1.8 |
| 3 | 6.65 | 2.61 | 2.2 |
| 4 | 7.00 | 2.63 | 3.1 |
| E (GPa) | ρ (kg·m-3) | υ |
|---|---|---|
| 18 | 1000 | 0.3 |
| Nominal Bore D0/mm | Effective Length L/mm ≥ | Grade I Pipe | Grade II Pipe | ||||
|---|---|---|---|---|---|---|---|
| Wall Thickness t/mm ≥ | Failure Load/(kN/m) | Internal Water Pressure/ MPa | Wall Thickness t/mm ≥ | Failure Load /(kN/m) | Internal Water Pressure / MPa | ||
| 350 | 35 | 12 | 45 | 19 | |||
| 400 | 1000 | 40 | 14 | 0.02 | 47 | 19 | 0.04 |
| 450 | 45 | 16 | 50 | 19 | |||
| Group | Crack Length (mm) | Crack Depth (mm) | Crack Location |
|---|---|---|---|
| 1 | 400 | 25 | Crown |
| 2 | 300 | ||
| 3 | 200 | ||
| 4 | 300 | 20 | Crown |
| 5 | 10 | ||
| 6 | 300 | 25 | Springline |
| 7 | Invert |
| Working Condition | Intact Pipe | Pre-existing Cracks Pipe | |||||||||
|---|---|---|---|---|---|---|---|---|---|---|---|
| Crack Length (mm) | Crack Depth (mm) | Crack Location | |||||||||
| Contrast | 400 | 300 | 200 | 25 | 20 | 15 | Crown | Spring-Line | Invert | ||
| Numerical simulation | Average failure load (kN/m) | 21.7 | 10 | 11.7 | 13.2 | 11.7 | 13 | 13.4 | 11.7 | 13.1 | 12 |
| Reduction rate (%) | - | 54 | 46 | 39 | 46 | 40 | 38 | 46 | 40 | 45 | |
| Test | Average failure load (kN/m) | 23 | 11 | 12.5 | 14 | 12.5 | 13 | 14 | 12.5 | 13.6 | 12.3 |
| Reduction rate (%) | - | 52 | 49 | 43 | 46 | 43 | 39 | 46 | 41 | 47 | |
© 2020 by the authors. Licensee MDPI, Basel, Switzerland. This article is an open access article distributed under the terms and conditions of the Creative Commons Attribution (CC BY) license (http://creativecommons.org/licenses/by/4.0/).
Share and Cite
Zhang, Z.; Fang, H.; Li, B.; Wang, F. Mechanical Properties of Concrete Pipes with Pre-Existing Cracks. Appl. Sci. 2020, 10, 1545. https://doi.org/10.3390/app10041545
Zhang Z, Fang H, Li B, Wang F. Mechanical Properties of Concrete Pipes with Pre-Existing Cracks. Applied Sciences. 2020; 10(4):1545. https://doi.org/10.3390/app10041545
Chicago/Turabian StyleZhang, Zongyuan, Hongyuan Fang, Bin Li, and Fuming Wang. 2020. "Mechanical Properties of Concrete Pipes with Pre-Existing Cracks" Applied Sciences 10, no. 4: 1545. https://doi.org/10.3390/app10041545
APA StyleZhang, Z., Fang, H., Li, B., & Wang, F. (2020). Mechanical Properties of Concrete Pipes with Pre-Existing Cracks. Applied Sciences, 10(4), 1545. https://doi.org/10.3390/app10041545