Localisation of Vertical Auditory Phantom Image with Band-limited Reductions of Vertical Interchannel Crosstalk


Abstract
1. Introduction
1.1. Background
1.2. Aim of the Study
2. Methods
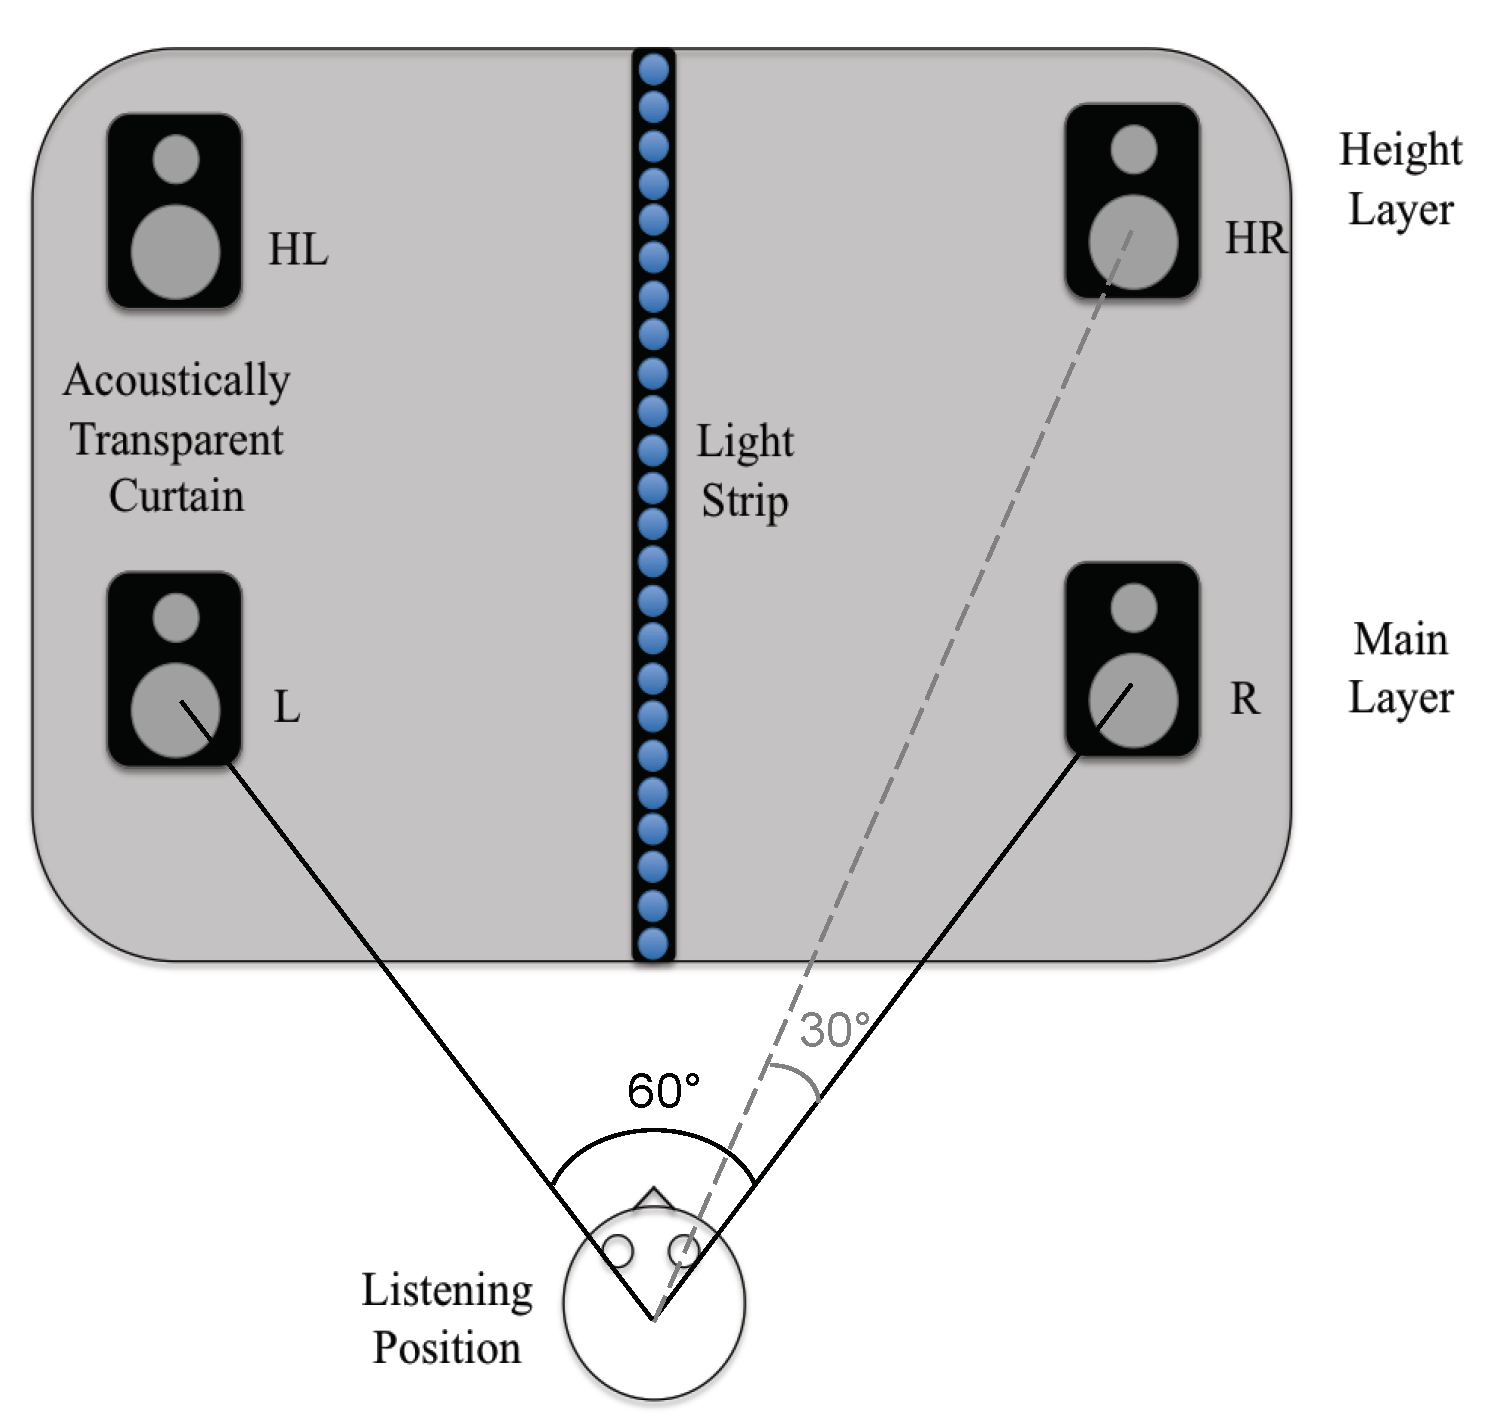
2.1. Physical Setup
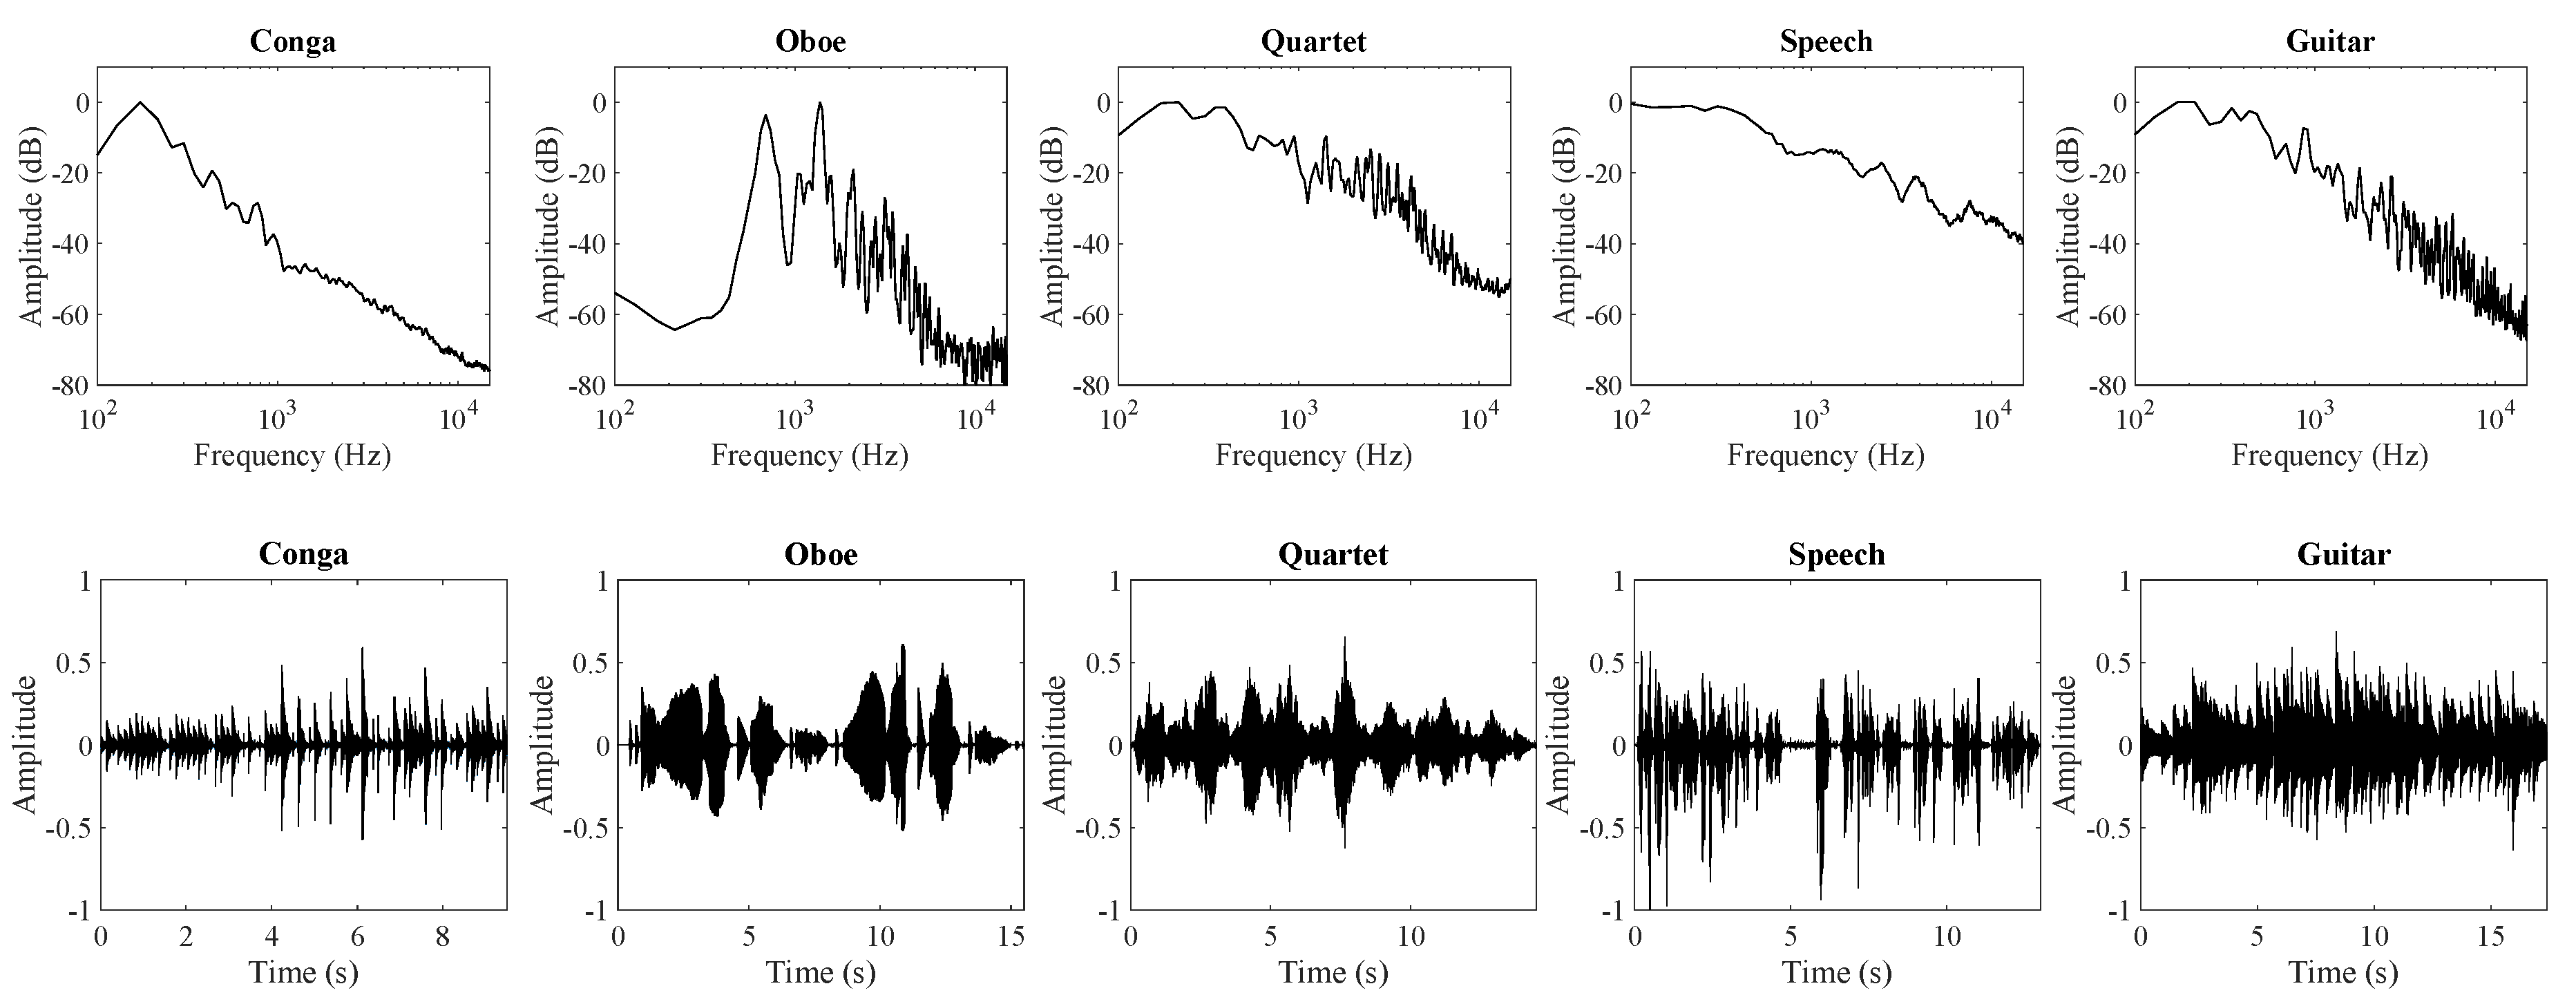
2.2. Test Stimuli
- Full band VLT (FB): octave-band-dependent attenuation is applied to the height layer.
- VLTs for 1 kHz band and above (1 + B): octave-band-dependent attenuation is only applied to the 1 kHz band and above.
- 4 kHz band VLT (4B): only the band centred at 4 kHz is attenuated.
- 8 kHz band VLT (8B): only the band centred at 8 kHz is attenuated.
- Blanket VLT: attenuation is applied to the height layer as a whole.
- Main layer only: only the main layer is presented.
- Height layer only: only the height layer is presented.
- Vertically oriented phantom image with 0 dB ICLD: no level attenuation was applied, thus creating a vertical phantom centre image between the two loudspeaker layers.
2.3. Subjects
2.4. Test Protocol
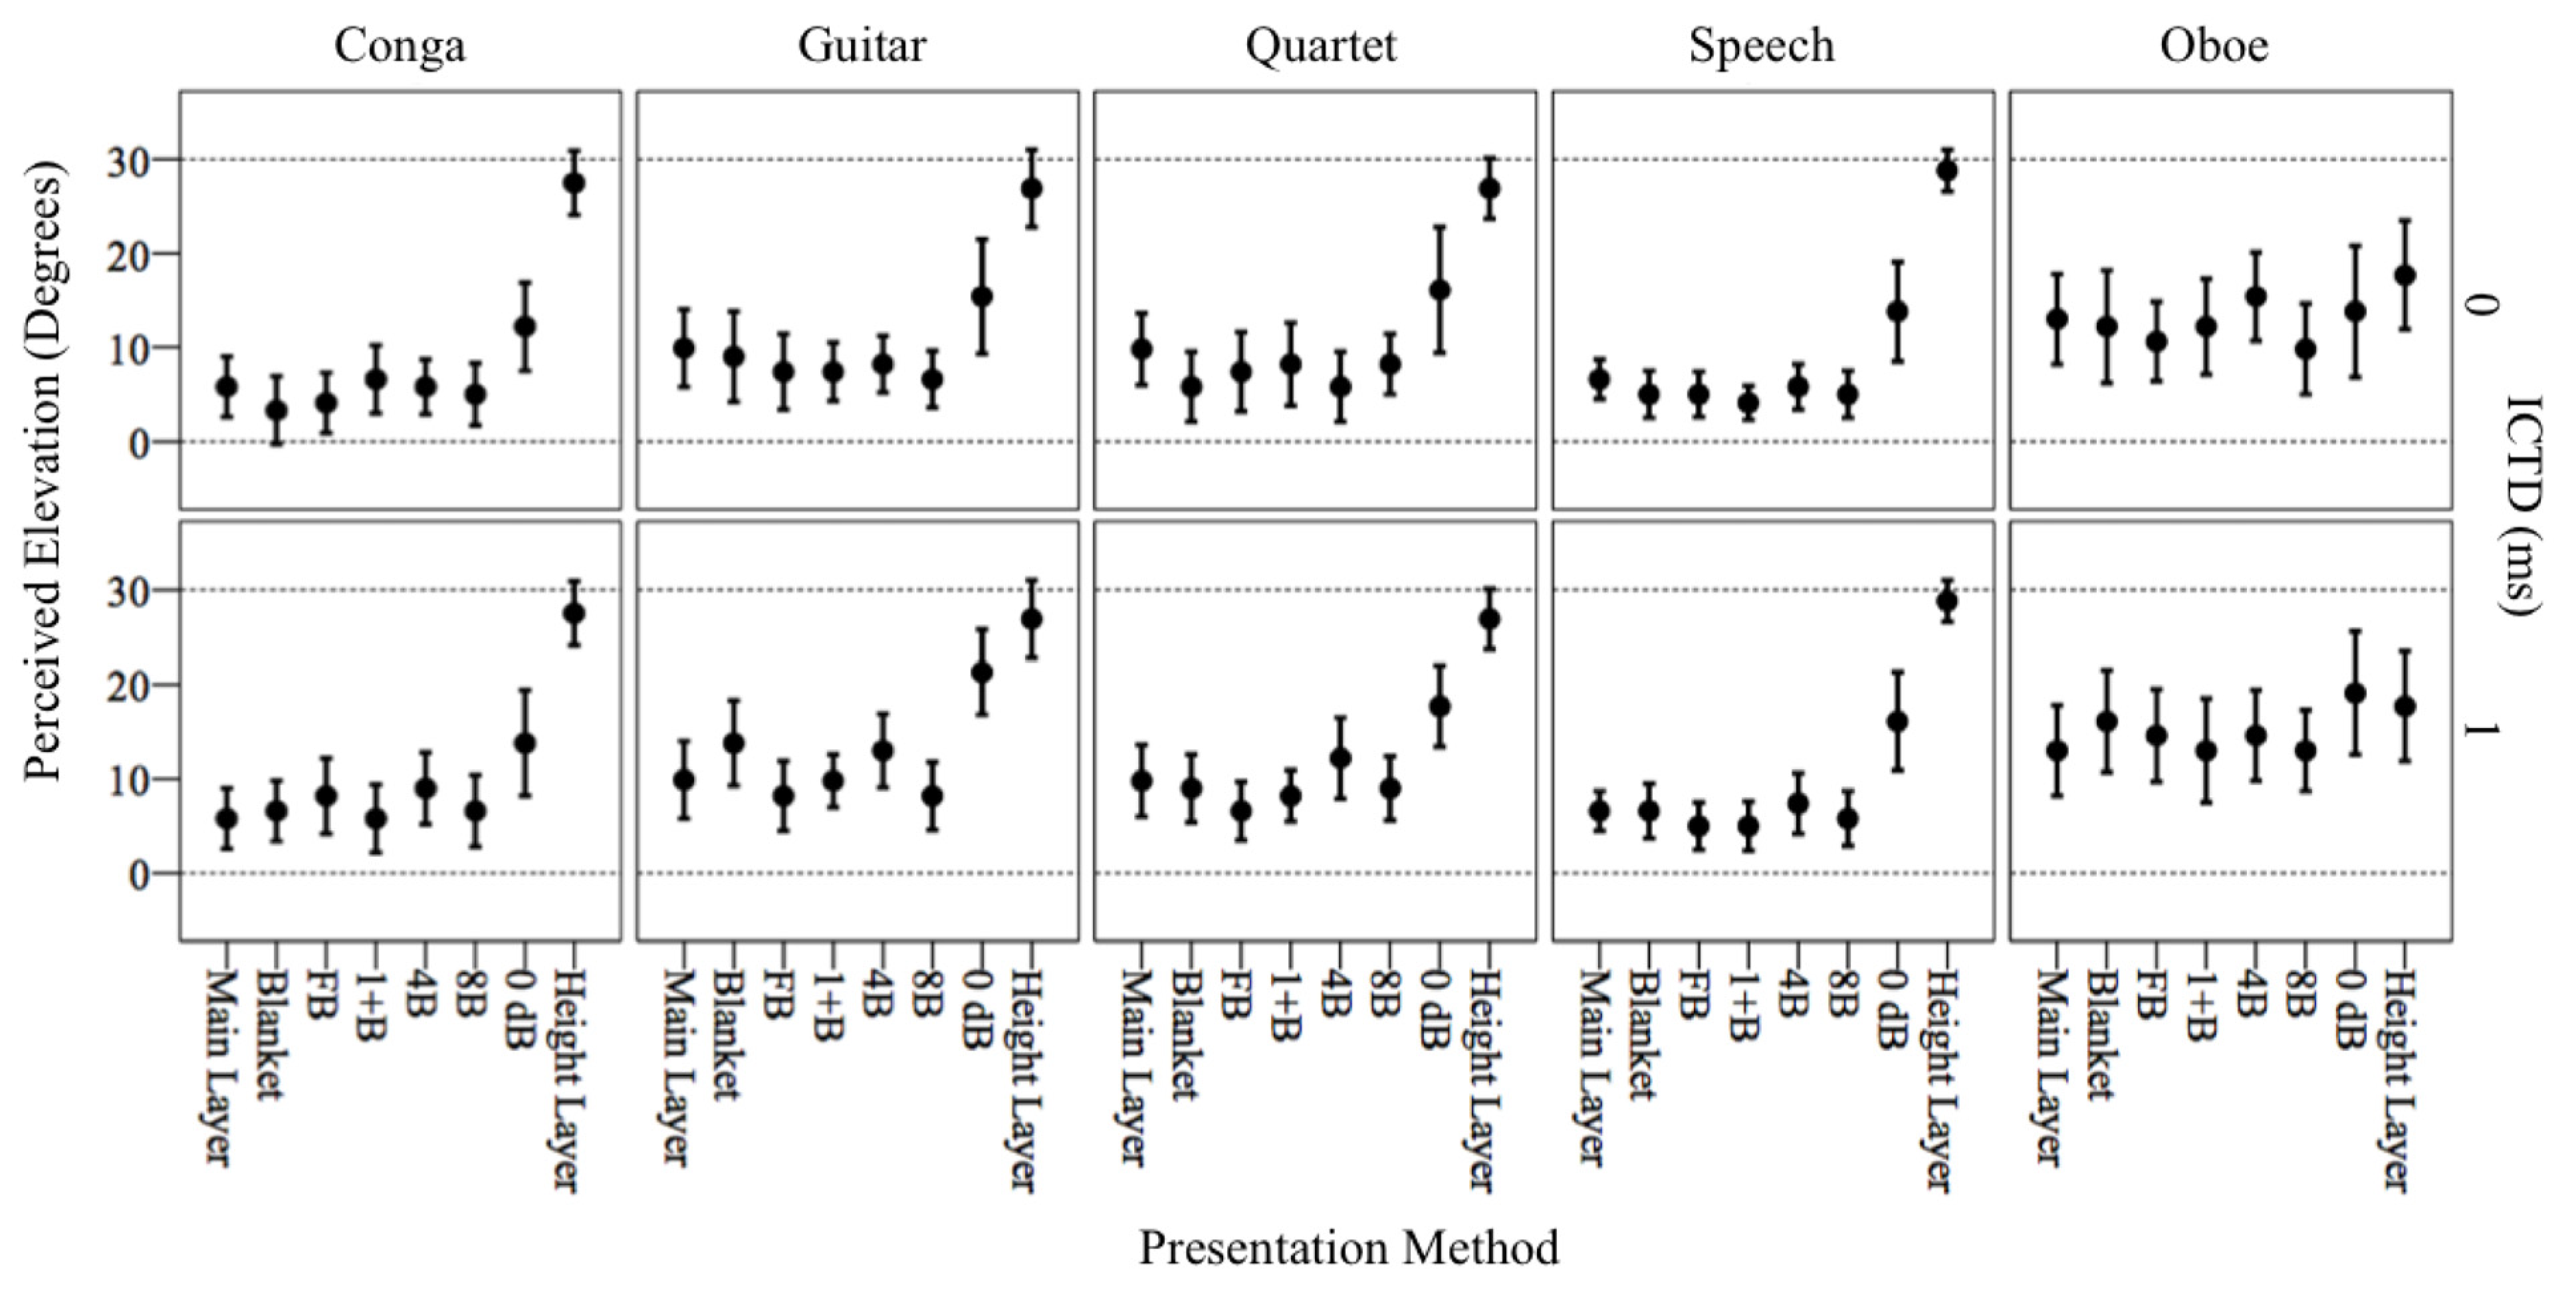
3. Results
4. Discussion
4.1. The Effecitveness of the Band-limited VLT Methods
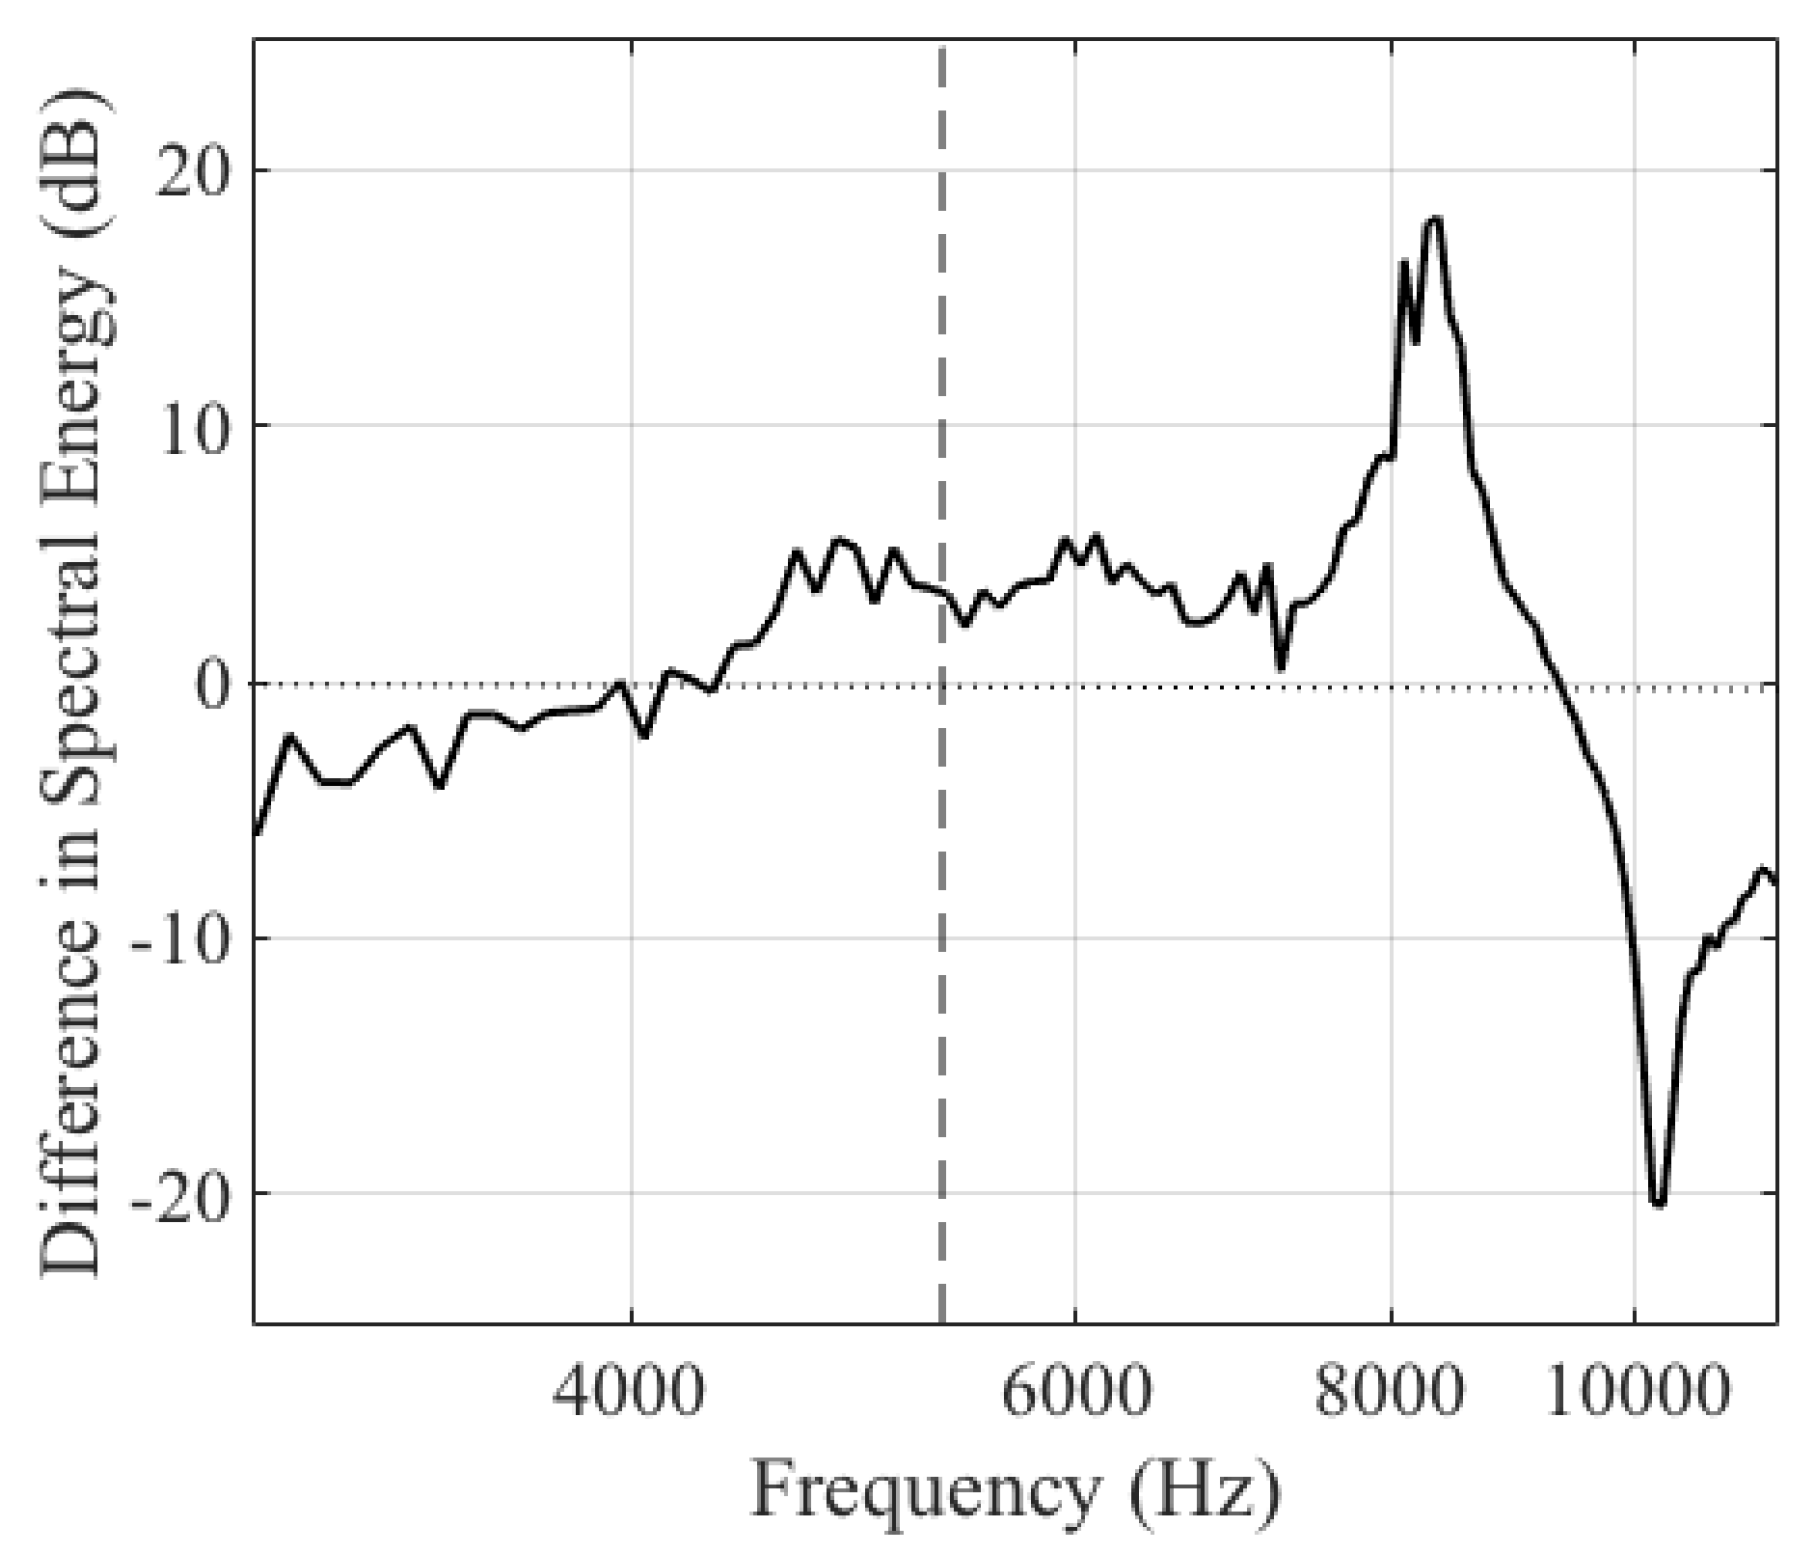
4.2. The Relationship Between Perceived Source Elevation and the Vertical Localisation Threshold
4.3. Practical Implications
5. Conclusions
- It is possible to successfully prevent the localisation interference effect of VIC by attenuating only some specific octave bands of the VIC, each by the amount specified Table 1; for example, (i) all of the bands centred at 1 kHz and above, (ii) only the band centred at 4 kHz only, and (iii) only the band centred at 8 kHz.
- The influence of VIC on vertical localisation has a sound source dependency due to frequency-related psychoacoustic phenomena, such as the pitch-height effect and the phantom image elevation effect. The results suggest that, in vertical quadraphonic reproduction, sound sources with a narrow frequency spectrum (e.g., oboe) would not have a significant VIC influence on perceived vertical image position, since the image would be localised at a vertical position inherent from the frequency content, regardless of the presentation method.
- In addition, the results support a previous finding that neither the precedence effect nor localisation dominance operates vertically. That is, in the vertical domain, time delay between two loudspeakers alone would not cause the auditory image to be localised at the position of the earlier loudspeaker, and a certain level reduction would be necessary for this.
Author Contributions
Funding
Acknowledgments
Conflicts of Interest
References
- Dolby Atmos. Available online: http://www.dolby.com/us/en/brands/dolby-atmos.html (accessed on 4 January 2020).
- Listening Formats: Auro 3D. Available online: http://www.auro-3d.com/system/listening-formats (accessed on 4 January 2020).
- Lee, H. The Relationship between Interchannel Time and Level Differences in Vertical Sound Localisation and Masking. In Proceedings of the Audio Engineering Society 131st Convention, New York, NY, USA, 20–23 October 2011. Preprint 8556. [Google Scholar]
- Litovsky, R.Y.; Coulburn, S.H.; Yost, W.A.; Guzman, S.J. The precedence Effect. J. Acoust. Soc. Am. 1999, 106, 1633–1654. [Google Scholar] [CrossRef] [PubMed]
- Blauert, J. Spatial Hearing: The Psychophysics of Human Sound Localisation; MIT Press: Cambridge, UK, 1997. [Google Scholar]
- Wallis, R.; Lee, H. The Effect of Interchannel Time Difference on Localisation in Vertical Stereophony. J. Audio. Eng. Soc. 2015, 63, 767–776. [Google Scholar] [CrossRef]
- Wallis, R.; Lee, H. Vertical Stereophonic Localisation in the Presence of Interchannel Crosstalk: The Analysis of Frequency-Dependent Localisation Thresholds. J. Audio. Eng. Soc. 2016, 64, 762–770. [Google Scholar] [CrossRef]
- Wallis, R.; Lee, H. The Frequency Dependency of Localisation Thresholds in the Presence of Reflections. In Proceedings of the 29th Tonmeistertagung, Cologne, Germany, 17–20 November 2016; Verbond Deutscher Tonmeister: Cologne, Germany, 2016. [Google Scholar]
- Wallis, R.; Lee, H. The Reduction of Vertical Interchannel Crosstalk: The Analysis of Localisation Thresholds for Natural Sound Sources. Appl. Sci. 2017, 7, 278. [Google Scholar] [CrossRef]
- Mironovs, M.; Lee, H. The Influence of Source Spectrum and Loudspeaker Azimuth on Vertical Amplitude Panning. In Proceedings of the Audio Engineering Society 142nd Convention, Berlin, Germany, 20–23 May 2017. Preprint 9782. [Google Scholar]
- Pratt, C.C. The Spatial Character of High and Low Tones. J. Exp. Psychol. 1930, 13, 278–285. [Google Scholar] [CrossRef]
- Roffler, S.K.; Butler, R.A. Factors that Influence the Localisation of Sound in the Vertical Plane. J. Acoust. Soc. Am. 1968, 43, 1255–1259. [Google Scholar] [CrossRef] [PubMed]
- Cabrera, D.; Tiley, S. Vertical Localisation and Image Size Effects in Loudspeaker Reproduction. In Proceedings of the AES 24th International Conference on Multichannel Audio, Banff, AB, Canada, 26–28 June 2003. [Google Scholar]
- Blauert, J. Sound Localisation in the Median Plane. Acta Acust. United Acust. 1969, 22, 205–213. [Google Scholar]
- Lee, H. Effects of Interchannel Crosstalk in Multichannel Microphone Technique. PhD Thesis, University of Surrey, Gilford, UK, 2006. [Google Scholar]
- Lindberg, M. 3D Recording with the “2L Cube”. Available online: http://www.2l.no/artikler/2L-VDT.pdf (accessed on 4 January 2020).
- AMBEO for Loudspeakers. Available online: https://en-uk.sennheiser.com/ambeo-blueprints-loudspeakers (accessed on 4 January 2020).
- International Telecommunication Union. Recommendation ITU-R BS.1116-1: Methods for the Subjective Assessment of Small Impairments in Audio Systems Including Multichannel Sound Systems; International Telecommunications Union: Geneva, Switzerland, 1994. [Google Scholar]
- International Telecommunication Union. Advanced Sound System for Programme Production; International Telecommunications Union: Geneva, Switzerland, 2018. [Google Scholar]
- Hansen, V.; Munch, G. Making Recordings for Simulation Tests in the Archimedes Project. J. Audio. Eng. Soc. 1991, 39, 768–774. [Google Scholar]
- Shaw, E.A.G.; Teranishi, R. Sound Pressure Generated in an External-Ear Replica and Real Human Ears by a Nearby Point Source. J. Acoust. Soc. Am. 1968, 44, 240–249. [Google Scholar] [CrossRef] [PubMed]
- Hebrank, J.; Wright, D. Spectral Cues used in the Localisation of Sound Sources on the Median Plane. J. Acoust. Soc. Am. 1974, 56, 1829–1834. [Google Scholar] [CrossRef] [PubMed]
- Lee, H. Perceptual Band Allocation (PBA) for the Rendering of Vertical Image Spread with a Vertical 2D Loudspeaker Array. J. Audio Eng. Soc. 2016, 64, 1003–1013. [Google Scholar] [CrossRef]
- De Boer, K. A Remarkable Phenomenon with Stereophonic Sound Reproduction. Philips Tech. Rev. 1947, 9, 8–13. [Google Scholar]
- Lee, H. Sound Source and Loudspeaker Base Angle Dependency of Phantom Image Elevation Effect. J. Audio Eng. Soc. 2018, 65, 733–748. [Google Scholar] [CrossRef][Green Version]
- Lee, H.; Gribben, C. Effect of Vertical Microphone Layer Spacing for a 3D Microphone Array. J. Audio Eng. Soc. 2014, 62, 870–884. [Google Scholar] [CrossRef][Green Version]
- Gribben, C.; Lee, H. The Perception of Band-Limited Decorrelation Between Vertically Oriented Loudspeakers. IEEE-ACM Trans. Audio Speech Lang. Process. 2020. [Google Scholar] [CrossRef]
- Forward-Backward Filtering. Available online: https://ccrma.stanford.edu/~jos/fp/Forward_Backward_Filtering.html (accessed on 11 February 2020).
- Lee, H.; Johnson, D.; Mironovs, M. A New Response Method for Auditory Localisation and Spread Tests. In Proceedings of the Audio Engineering Society 140th Convention, Paris, France, 4–7 June 2016. [Google Scholar]
- McGill, R.; Tukey, J.W.; Larsen, W.A. Variations of Box Plots. Am. Stat. 1978, 32, 12–16. [Google Scholar]
- Gardener, B.; Martin, K. HRTF Measurements of a KEMAR Dummy-Head Microphone. 2000. Available online: http://sound.media.mit.edu/resources/KEMAR.html (accessed on 4 January 2020).
- Furuya, H.; Fujimoto, K.; Ji, C.Y.; Higa, N. Arrival Direction of Late Sound and Listener Envelopment. Appl. Acoust. 2001, 62, 125–136. [Google Scholar] [CrossRef]


| Centre Frequency (Hz) | Height Layer Attenuation (dB) | |
|---|---|---|
| Guitar, Speech, Oboe and Quartet | Conga | |
| 63 | −6 | −6 |
| 125 | −7 | −6 |
| 250 | −7 | −5 |
| 500 | −8.5 | −6 |
| 1 k | −11 | −6 |
| 2 k | −10 | −6 |
| 4 k (0 ms) | −9.5 | −11 |
| 4 k (1 ms) | −9.5 | −6 |
| 8 k (0 ms) | −13.5 | −6 |
| 8 k (1 ms) | −10 | −6 |
| 16 k | −8 | −6 |
| Method | LAeq (dB) |
|---|---|
| FB | 70.0 |
| 1 + B | 71.2 |
| 4B | 72.2 |
| 8B | 72.4 |
| Blanket | 70.4 |
| 0 dB ICLD | 73.1 |
© 2020 by the authors. Licensee MDPI, Basel, Switzerland. This article is an open access article distributed under the terms and conditions of the Creative Commons Attribution (CC BY) license (http://creativecommons.org/licenses/by/4.0/).
Share and Cite
Wallis, R.; Lee, H. Localisation of Vertical Auditory Phantom Image with Band-limited Reductions of Vertical Interchannel Crosstalk. Appl. Sci. 2020, 10, 1490. https://doi.org/10.3390/app10041490
Wallis R, Lee H. Localisation of Vertical Auditory Phantom Image with Band-limited Reductions of Vertical Interchannel Crosstalk. Applied Sciences. 2020; 10(4):1490. https://doi.org/10.3390/app10041490
Chicago/Turabian StyleWallis, Rory, and Hyunkook Lee. 2020. "Localisation of Vertical Auditory Phantom Image with Band-limited Reductions of Vertical Interchannel Crosstalk" Applied Sciences 10, no. 4: 1490. https://doi.org/10.3390/app10041490
APA StyleWallis, R., & Lee, H. (2020). Localisation of Vertical Auditory Phantom Image with Band-limited Reductions of Vertical Interchannel Crosstalk. Applied Sciences, 10(4), 1490. https://doi.org/10.3390/app10041490