Article

Tribological Investigation on the Friction and Wear Behaviors of Biogenic Lubricating Greases in Steel–Steel Contact

1
Laboratory of Machine Elements and Tribology, Department of Mechanical Engineering and Production, Faculty of Engineering Technology and Computer Science, Hamburg University of Applied Sciences (HAW-Hamburg), 20099 Hamburg, Germany
2
Department of Chemical Engineering, University of Huelva, 21071 Huelva, Spain
3
Pro2TecS-Chemical Product and Process Technology Research Centre, Complex Fluid Engineering Laboratory, University of Huelva, 21071 Huelva, Spain
4
INEGI, Universidade do Porto, Rua Roberto Frias s/n, 4200-465 Porto, Portugal
5
FEUP, Faculdade de Engenharia da Universidade do Porto, Rua Roberto Frias s/n, 4200-465 Porto, Portugal
*
Author to whom correspondence should be addressed.
Appl. Sci. 2020, 10(4), 1477; https://doi.org/10.3390/app10041477
Submission received: 23 January 2020 / Revised: 11 February 2020 / Accepted: 17 February 2020 / Published: 21 February 2020
(This article belongs to the Special Issue Green Lubricants 2019)

Abstract

:
The applications of biogenic lubricating greases to machine elements play important roles in the reduction of friction energy and minimizing wear in a tribological contact, as well as the prevention of environmental pollution. The aim of this work was to investigate completely biogenic lubricating greases from a tribological point of view. Model greases were examined using a ball on a disc tribometer at a constant normal force to investigate the friction and wear process according to Fleischer’s energetic wear model. Using the energy-based wear model, the friction and wear process could be interpreted as a cause–effect sequence. Moreover, the influence of the model grease composition on the friction and wear process was analyzed. In addition, rolling bearing tests were performed to investigate the tribological behaviors of some selected biogenic greases during real machine element contact. These tests allowed for the quantification of the friction torque behavior of the full bearing and the evaluation of the wear obtained through lubricant analysis procedures. This experimental work provides useful information regarding the influence that the composition of biogenic model greases has on friction and wear behaviors in a tribological contact.

1. Introduction

The use of biodegradable greases for different industrial applications is remarkably important for avoiding direct and indirect environmental pollution [1,2,3]. In this sense, some lubricant industries focus on developing their products from renewable resources in order to minimize adverse impacts on the environment. As discussed and reported in previous works [4,5,6,7], the use of vegetable oil instead of mineral oil as a liquid lubricant shows some advantages, such as good lubricity, the ability to adhere to metal surfaces, non-toxicity, and low volatility, as well as some disadvantages, such as poor oxidative stability and low temperature flow properties. However, these negative features can be overcome or minimized by using additives or inducing chemical modifications [5,6,8,9,10,11]. Completely biogenic lubricating greases can be obtained by replacing the mineral base oil with a vegetable oil, as well as by substituting traditionally used thickener agents (metallic soaps or polyurea compounds) with biogenic thickeners. In some research [12,13,14,15,16,17,18,19], some formulations, such as those based on castor or soybean oil used as a biodegradable base oil, and natural thickeners like cellulose derivatives, chitin, glyceryl stearates, or sorbitan stearates, were rheologically and tribologically investigated and compared with some traditional greases, such as lithium-12-hydroxysteate lubricating grease. The results of these works showed that some formulations provided similar or better thermal, rheological, and mechanical properties than traditional lubricating greases for potential lubricating applications. Moreover, bio-grease formulations, based on castor oil as the base oil and sorbitan and glyceryl monostearate or acylated chitosan as the thickener agents, generally yielded lower friction coefficient values than the reference lithium greases in several tribological tests [14].
The friction process leads to irreversible effects, namely wear, inside a tribological system; therefore, irreversible effects are the results of friction energy input into a tribological system [20]. This approach indicates that the friction and wear process is a cause–effect sequence [21]. One of the models that describes the relationship between friction and wear is Fleischer’s energy-based wear model, which is based on the energy accumulation hypothesis [22,23]. Most of the friction energy dissipates as heat into a tribological contact, while the rest accumulates in the surface layer. If the accumulated energy reaches a critical energy level, particle separation from the contacting surface occurs and the stored energy dissipates. The basic parameter in Fleischer’s wear model is the apparent friction energy density ( e R * ), which presents a relationship between the friction work ( W R ) and the wear volume ( V V ). Fleischer’s energy-based wear model plays an important role in evaluating the service life and reliability of tribological contacts. In some previous studies [24,25,26,27,28], Fleischer’s wear model, or a modified version of it, was used to describe wear processes and predict wear in various types of tribosystems, such as piston–cylinder contacts or journal bearings. Moreover, some studies [29,30] attempted to assess the selected materials in terms of wear resistance, as well as in terms of energy using Fleischer’s wear model in pin–disk test devices. In addition, the influence of entropy transport on the ability of a system to resist tribological stress [31,32] relates to the apparent friction energy density.
In this experimental study, a series of biogenic lubricating greases were tested in a tribometer using a material combination of a steel ball on a steel plate to investigate the friction and wear process according to Fleischer’s energetic wear model. In addition, rolling bearing tests were carried out to assess the lubrication performance of some selected biogenic lubricating greases. These tests included both power loss and wear tests in real applications. These real application tests allowed for the quantification of the friction torque behavior of the full bearing at different operating conditions and the wear produced through lubricant analysis procedures, i.e., ferrometry and ferrography.

2. Energy-Based Wear Model and Apparent Friction Energy Density

Friction energy causes wear effects on a tribocontact (on the contacting surfaces). In the energy-based wear model, Fleischer [22] defined the term “apparent friction energy density, e R * ” in order to describe the relationship between friction and wear. The apparent friction energy density ( e R * ) represents the amount of friction work ( W R ) in relation to the wear volume ( V V ):
e R * = W R V V .
Assuming that the friction shear stress ( τ R ) can be determined from the friction coefficient ( f ) and the nominal contact pressure ( P a ):
τ R = f · P a ,
the linear wear intensity ( I h ) [33] according to Fleischer’s fundamental equation of wear can be obtained using:
I h = τ R e R * .
In general, the expended energy consists of several components; therefore, there are also several components of wear [22]. Therefore, the apparent energy density can be extended to:
1 e R * = α 1 e R 1 * + α 2 e R 2 * + α 3 e R 3 *
by considering the applied lubricant as a friction body. The parameters α 1 , α 2 , and α 3 represent the energy proportion factors, which represent the distribution of the friction energy to the respective friction bodies in a tribological system [34].
If the apparent friction energy density is considered in the steady-state phase of solid-state wear, Equation (1) can be rewritten as follows:
e R * = W R V V = F R · s R A R · h v = τ R · 1 I h = τ R I h ,
where F R is the fiction force, s R is the friction distance, A R is the frictional contact area (wear area), and h v   is the wear depth.
Fleischer’s energetic wear model was based on the so-called hypothesis of energy storage [22,23]. This hypothesis considered that the formation of a wear particle would occur only after repeated contacting since the critical energy level is usually not exceeded by the energy impulse of contact [22]. According to the energy accumulation hypothesis, a part of the energy of each impulse would be stored in a tribologically stressed material [22]. When the accumulated energy reached the critical energy value, a wear particle would form, i.e., particle separation from the contacting surface would occur and the accumulated energy would dissipate, indicating that the energy of a single contact ( W R e ) in the friction process partly accumulates and partly dissipates [22]:
W R e = W s t o r e e + W D i s s e .
Fleischer et al. [22] described the critical energy level required for the formation of the wear particle by identifying the average fracture energy density with the application of a critical number of contacts ( n k ):
e B ¯ = ζ R · e R e · ( n k 1 ) + e R e ,
where ζ R is the energy accumulation number and e R e is the energy density of a single contact.
The previously given equation of the apparent frictional energy density (Equation (1)) can be rewritten [22] as:
e R * = n k υ V · e B ¯ 1 + ζ R · ( n k 1 )
by introducing the wear number ( υ V ):
υ V = V V V R ,
where V R is the frictional volume.
Figure 1 shows the graph of the basic energy equation of wear and allows for visualization of the relationship between the apparent energy density ( e R * ), the intensity of wear ( I h ), and the friction shear stress ( τ R ). Fleischer [23] divided this plot into five different friction and wear states (areas 0–4) according to the occurring mechanisms, as shown in Figure 1 and Table 1. Range 1 is hydrodynamic lubrication, which leads to negligible wear intensities and zero wear in fluid friction. The other remarkable friction state is solid friction i.e., range 4, which leads to the immediate separation of material. The middle ranges, namely quasi-fluid friction, mixed friction, and solid friction with elastic and/or plastic deformation mechanisms, are also considered.

3. Experimental Section

3.1. Materials

Completely biogenic lubricating greases (1–13) and two reference semi-biogenic lubricating greases (R1, R2) were produced by Fuchs Europe Schmierstoffe (Mannheim, Germany) and Fuchs Lubritech (Kaiserslautern, Germany). Moreover, four completely biogenic lubricating greases (S1–S4) from Pro2TecS (University of Huelva, Huelva, Spain) were investigated in this study. All biogenic lubricating grease samples were formulated with different biogenic oils, e.g., high-oleic sunflower oil (HOSO), glycerol, castor oil, and a combination of HOSO and castor oil, to form the base oils. Moreover, different natural products, e.g., beeswax, corncob grits, natural cellulose, and lignin, were used as thickener agents. For confidentiality reasons, we are not able to give information on the percentage of each thickener in Fuchs greases. More details regarding the biogenic grease samples from Pro2TecS can be found elsewhere [35,36]. The compositions of all the biogenic grease samples are depicted in Table 2.

3.2. Tribological Tests on the Ball-on-Disc Tribometer

A tribometer designed by the Laboratory for Machine Elements and Tribology (MuT) at the Hamburg University of Applied Sciences (HAW-Hamburg, Germany), as shown in Figure 2, was used to determine the friction coefficient values of tribologically stressed material combinations. The test set-up was composed of a rotatory plate and a fixed ball. In the tribometer, the steel plate was lubricated with a grease sample and stressed by applying a normal force. By means of a load cell, the friction force was measured during the test, thereby allowing the friction coefficient to be determined.
In the MuT laboratory of HAW-Hamburg, all tests were carried out in rotational mode with a relative speed of 0.129 m·s−1, using a steel ball (100Cr6) 12.7 mm in diameter and steel plates (S235JR (St37), Zentrale Laborwerkstatt at the HAW-Hamburg, Hamburg, Germany). In order to achieve comparable results, frictional and wear behaviors of the model greases were investigated under the same test parameters and conditions for the tribometer. All the steel plates were metallographically grinded and polished with a soft finish diamond paste of particle size 3 µm in order to significantly reduce surface roughness. Grease layers of the same thickness were applied to the steel plates, as shown in Figure 2. The normal load was kept constant at 12.62 N, with a resulting Hertzian stress value of 930.76 MPa and a test duration of 5 min. Each test was replicated ten times on the same track at an ambient temperature of 22 ± 1 °C in order to get a representative average friction coefficient value.
To quantify the wear of the solids, the wear marks on the steel plates created after the ten repetitions of the test on the same track of the tribometer were investigated using white light interferometry with a Zygo Nexview apparatus (Middlefield, OH, USA). Wear depths were quantified by means of the Zygo Mx software.

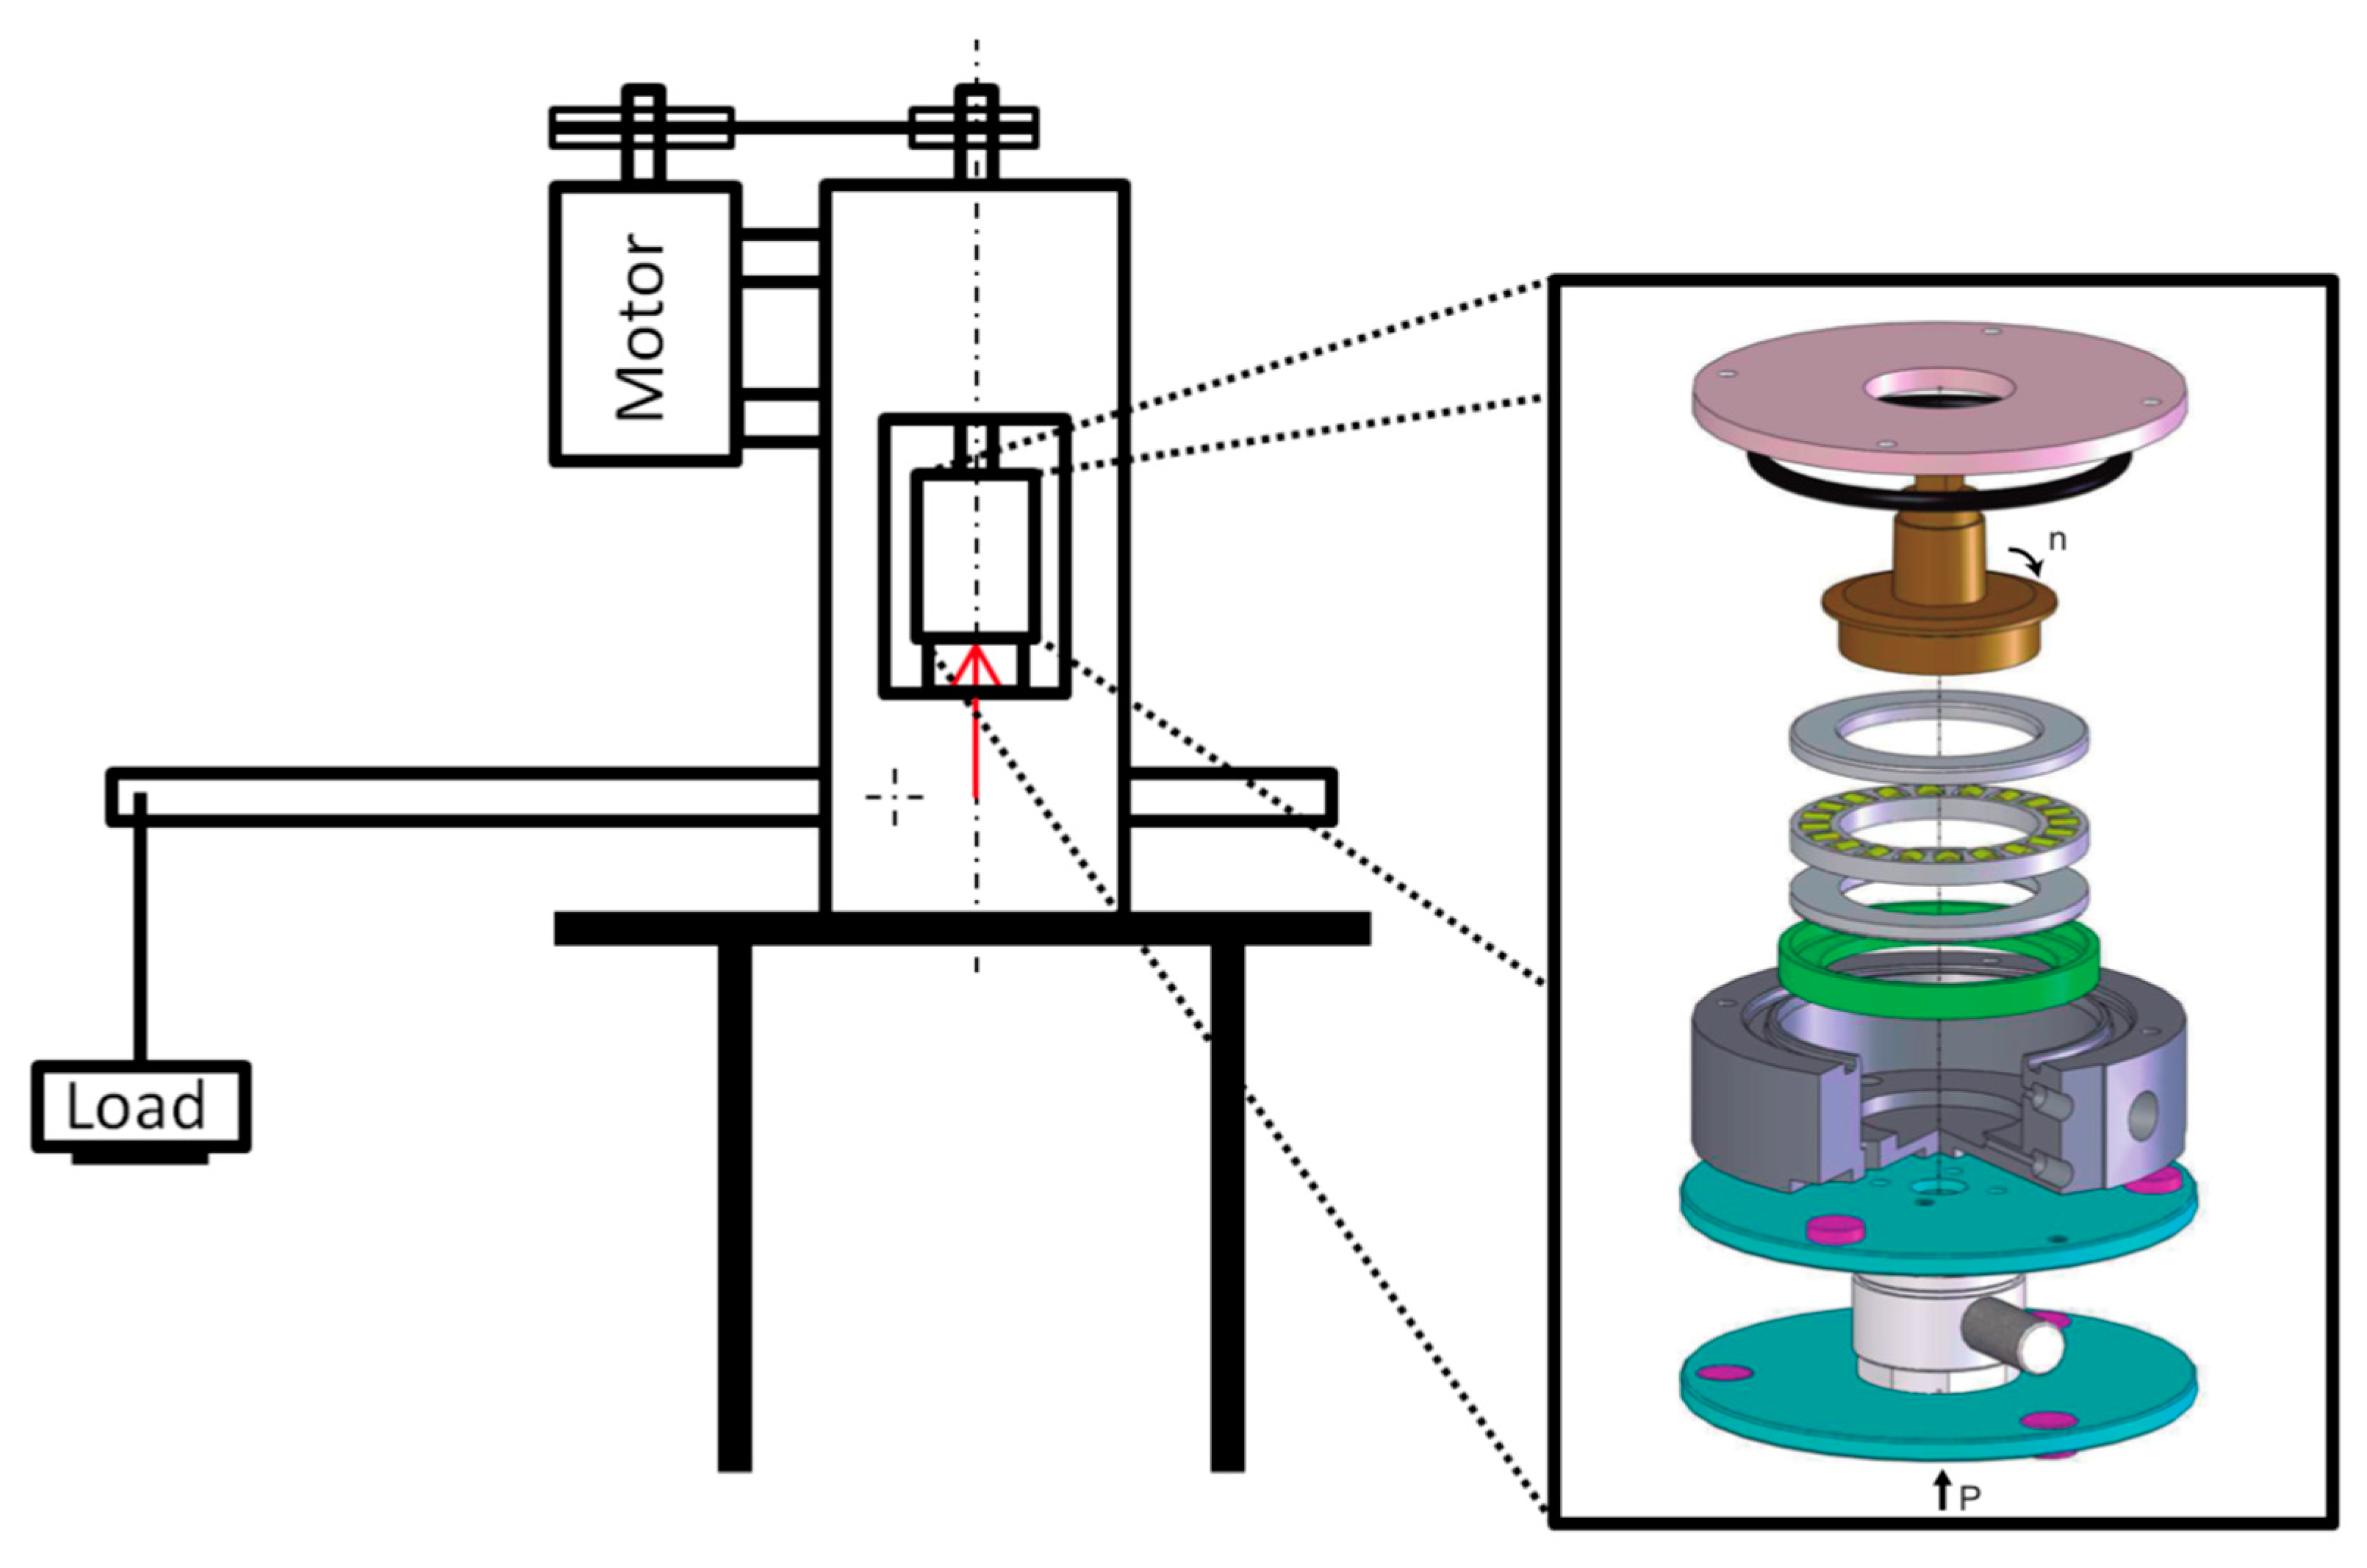
3.3. Rolling Bearing’s Friction Torque Tests

In order to assess the tribological behavior of the biogenic greases on real machine element contacts, rolling bearing (RB) tests were performed with selected model greases 1 and 2 in a dedicated rolling bearing test rig, as seen in Figure 3. In this test rig, the rolling bearing was subjected to a constant axial load (P) applied from bottom to top; the thrust roller bearing tested in this work operated in a vertical arrangement [37,38,39,40].
An electrical motor provided the necessary power to overcome the power loss of the system and keep the rotational speed steady. A belt-pulley arrangement transmitted the power from the motor to the rolling bearing shaft, forcing the upper raceway to rotate. The lower raceway was fixed to the bearing house and the torque cell, while the rolling elements’ cage rotated due to the motion imposed by the upper raceway. A piezoelectric reaction torque cell KISTLER® 9339A (Kistler Group, Winterthur, Switzerland) was used to measure the friction torque. For each speed step tested, five torque measurements were performed.
The tests were performed with a thrust ball bearing (TBB) 51107 from SKF (SKF Group, Gothenburg, Sweden). The TBB had 21 rolling elements that were 6 mm in diameter and the raceways had a mean diameter of 43.5 mm. Regarding the thrust load, the tests were performed with approximately 5 kN. Given the number of rolling elements of the TBB and the radius of curvature, the maximum Hertzian pressure was around 2 GPa during the ball–raceway contact. Since the melting temperature of the thickeners was around 60 °C, we chose to control the temperature inside the TBB at 50 °C. Since the temperature did not reach 60 °C, the thickener did not melt and therefore the structure should have only been affected by the mechanical working, avoiding a premature degradation of the grease structure.

3.3.1. Power Loss Tests

The operating conditions chosen for the power loss tests are shown in Table 3. The tests performed were well above the minimum required load (0.02C) while also not exceeding the maximum dynamic load rating (P/C ≈ 25%, P: equivalent dynamic bearing load (kN), C: basic dynamic load rating (kN)).
The friction torque measuring procedure involved the following steps:
  • The machine was loaded with 5 kg (load on the bearing ≈1000 N) and the motor was started, with the speed increasing to 500 rpm for 5 min.
  • The load was increased to 25 kg (5 kN) and the speed was set at 100 rpm.
  • Temperature stabilization was undertaken (less than 1 °C degree variation in a time window of 10 min).
  • The friction torque was measured five times at constant operating conditions.
  • The rotational speed was increased. Steps 3 and 4 were repeated to reach the required rotational speed.
  • The test was stopped.
The total test duration was between 6 and 7 h to allow for the temperature to stabilize at 50 °C every time the speed was increased. The rolling bearing test rig was able to maintain the temperature at 50 °C with less than 1 °C deviation for all rotational speeds by using an external thermal bath.

3.3.2. Wear Tests

In the case of the wear tests, given that at 50 °C the specific film thickness (Λ (–)) value, which represents the relationship between the lubricant minimum film thickness and the surface roughness, only reached 0.5 above 400 rpm, these tests were run at a rotational speed of 200 rpm. Table 4 shows the operating conditions of the wear tests.
After the test, a grease sample was collected for wear particle analysis via ferrometry and ferrography. More details regarding this wear particle analysis procedure can be found elsewhere [41].

3.3.3. Grease Volume

In order to fill part of the chamber of the rolling bearing house while also assuring that all the rolling elements were wet up to half of their diameter, 10 mL of grease was used; 2 mL was spread across the rolling bearings raceways and the holes between the cage and the rolling elements, while the other 8 mL was put in the rolling bearing house. Figure 4 shows the grease spread on the different parts of the rolling bearing assembly.

4. Results and Discussion

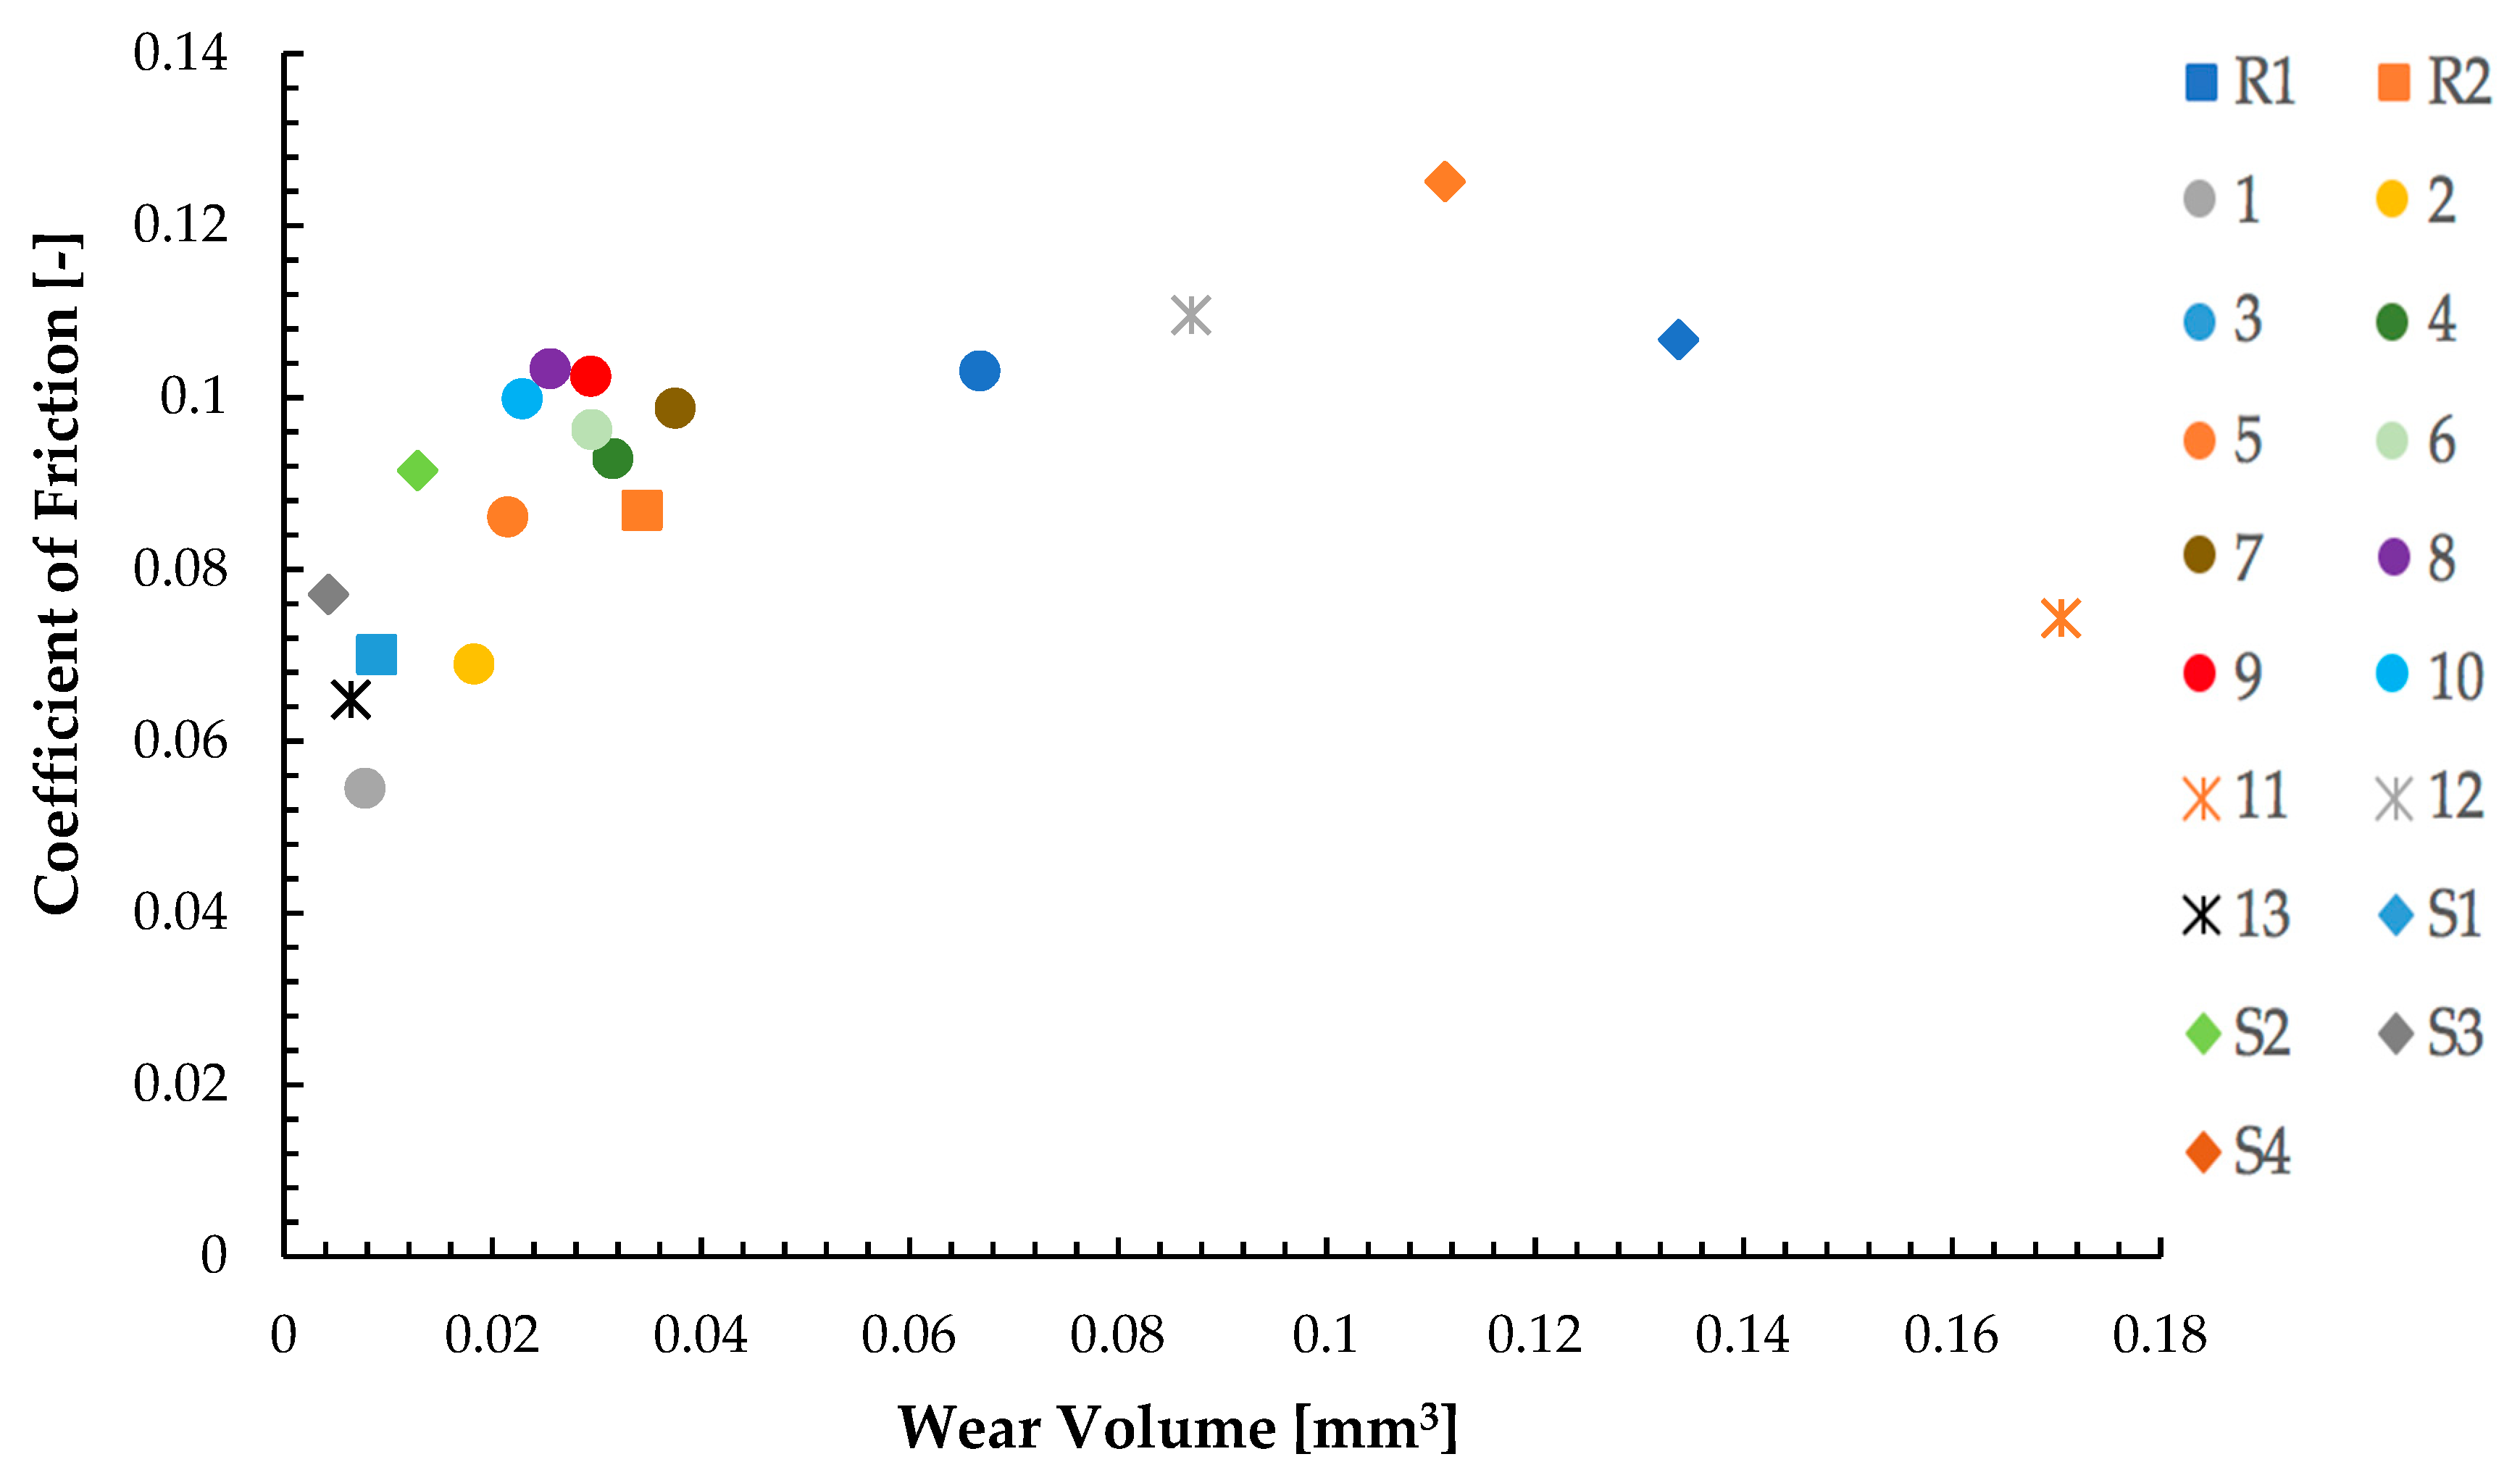
4.1. Apparent Friction Energy Density

The average friction coefficient and the average volume of the wear tracks on the steel plate were obtained after performing the frictional tests in the tribometer; results from all the examined model greases are shown in Figure 5.
According to the data in Figure 5, a linear correlation was found between the friction coefficient and the wear data for most of the examined model grease samples. In this sense, the biogenic grease samples that exhibited low friction coefficient values, such as grease samples R1, 1, 2, 5, 13, and S3, produced less wear on the steel plate. On the other hand, the use of some biogenic grease samples, such as 3, 12, S1, and S4, provided high friction coefficient values, which were reflected in the wear volume.
Moreover, biogenic grease sample 11, which was based on a mixture of castor oil and HOSO as the base oil, stood out because of its low friction coefficient but exhibited the highest wear volume in comparison with model greases 1 and 2, which also contained castor oil and HOSO. Under appropriate assumptions, the microstructure and physical and chemical properties of the thickeners of biogenic grease 11 could lead to a negative influence in the present steel ball on the steel disc frictional contact. Biogenic grease 11, which was based on ethyl cellulose and carnauba wax as the thickener, which was a different composition to biogenic grease samples 1 and 2, presented a coarse and fragile structural appearance, probably due to its poor mechanical stability and low resistance to structural breakdown. This property can cause the grease microstructure to be easily destroyed upon tribological contact. Therefore, the grease can be gradually ejected from the contact, eventually yielding lubricant starvation.
The effects of the different thickeners were also illustrated when comparing the results provided by biogenic greases 6, 8, and 10. Biogenic grease 10, which was prepared with a natural cellulose fiber of 120 µm in length as the thickener, exhibited the least wear on the steel plate compared with model grease 6, which was based on a natural cellulose fiber 18 µm in length, and grease 8, which was based on a natural cellulose fiber 20–40 µm in length. This result indicated that the longer the natural cellulose fiber of the thickener was, the lower the wear volume on the steel plate (i.e., 22% lower for sample 10 compared to sample 6).
These results showed that the different behaviors of different grease lubricant formulations were more explicitly observed in the wear results than in the frictional results in the tribological process.
To illustrate the wear on the steel plates produced from the ten repetitions of the measurements on the same track in the tribometer, the wear marks were investigated using an optical 3D surface profilometer, as shown in Figure 6. The pictures allowed for the contacting surface on the steel plate to be observed. As seen in Figure 6, while the use of biogenic grease 3 and reference grease R2 caused wide and strong abrasive wear, biogenic grease 2 and reference grease R1 produced wide but less pronounced wear on the steel disc. Looking at the detail, the use of biogenic grease 3 and reference grease R2 caused higher wear depth values, which are described as “Mean [µm]” in Figure 6, compared with biogenic grease 2 and reference grease R1. These data support the wear data shown in Figure 5.
Figure 7 shows the apparent friction energy densities ( e R * ) plotted as a function of the wear intensities ( I h ) for all the model greases. In this study, Fleischer’s wear model was experimentally used to investigate the relationship between friction and wear in a state of mixed friction, where only the wear on the steel plate was taken into consideration. In this sense, the apparent friction energy densities ( e R * ), which describe the amount of friction work required for the separation of the friction-exposed material, and the wear intensities ( I h ), which are expressed by the wear depth ( h v ) divided by the wear path (i.e., friction distance, s R ), were determined according to Equation (5). As in Figure 7, there was an inverse relationship between the e R * and I h , indicating that the greases that exhibited the highest friction energy densities caused the lowest wear intensities on the steel plate. For example, reference grease sample R1 showed the highest value of e R * and the lowest intensity of wear on the steel plate.
For further comprehension, the values of the three associated tribological parameters e R * , I h , and τ R were plotted on a graph depicting the basic energy equation of wear for the model greases (Figure 8). As observed, all the model greases were in the range of 1, indicating that all the lubricating grease experiments in the tribometer were conducted in the quasi-fluid-friction/mixed-friction state, thereby leading to deformation on the steel plates.
Finally, the results of the measured tribological parameters, i.e., e R * , I h , and τ R , showed that all the model grease samples applied some friction pairings, such as the toothed wheel or rolling bearing, according to a large number of studies looking at different machine elements [22].

4.2. Rolling Bearings Test Results

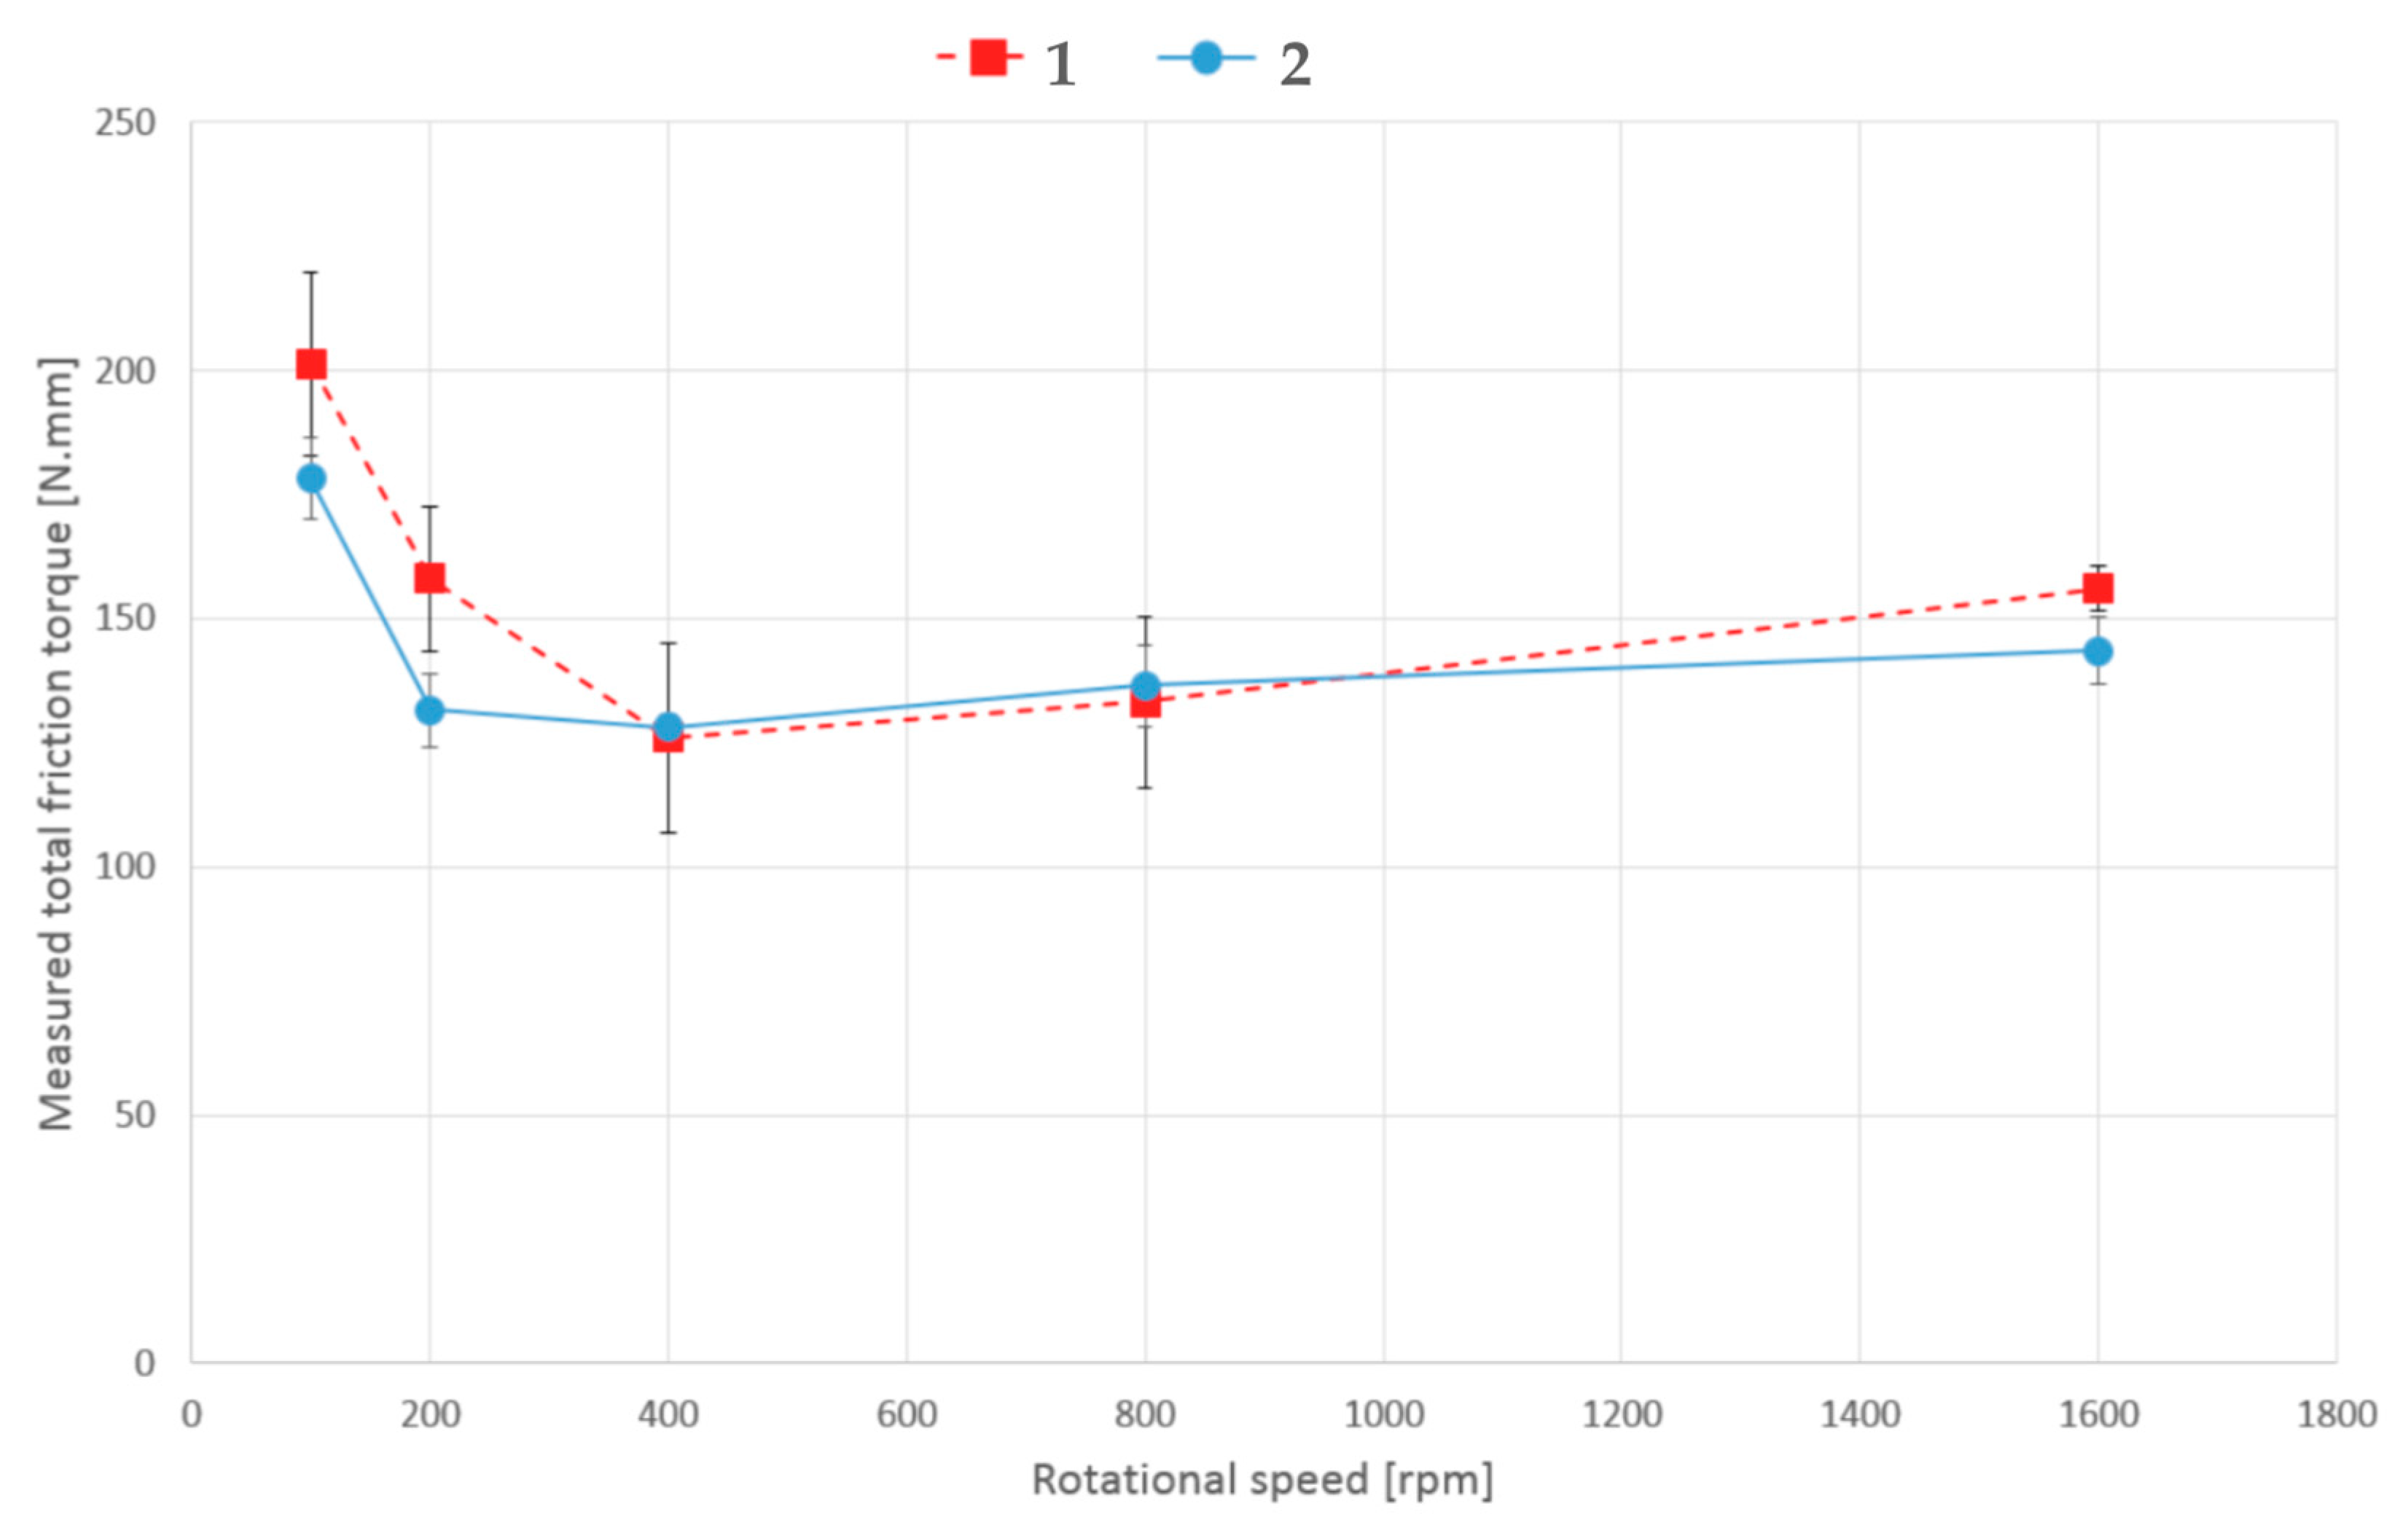
4.2.1. Power Loss Tests
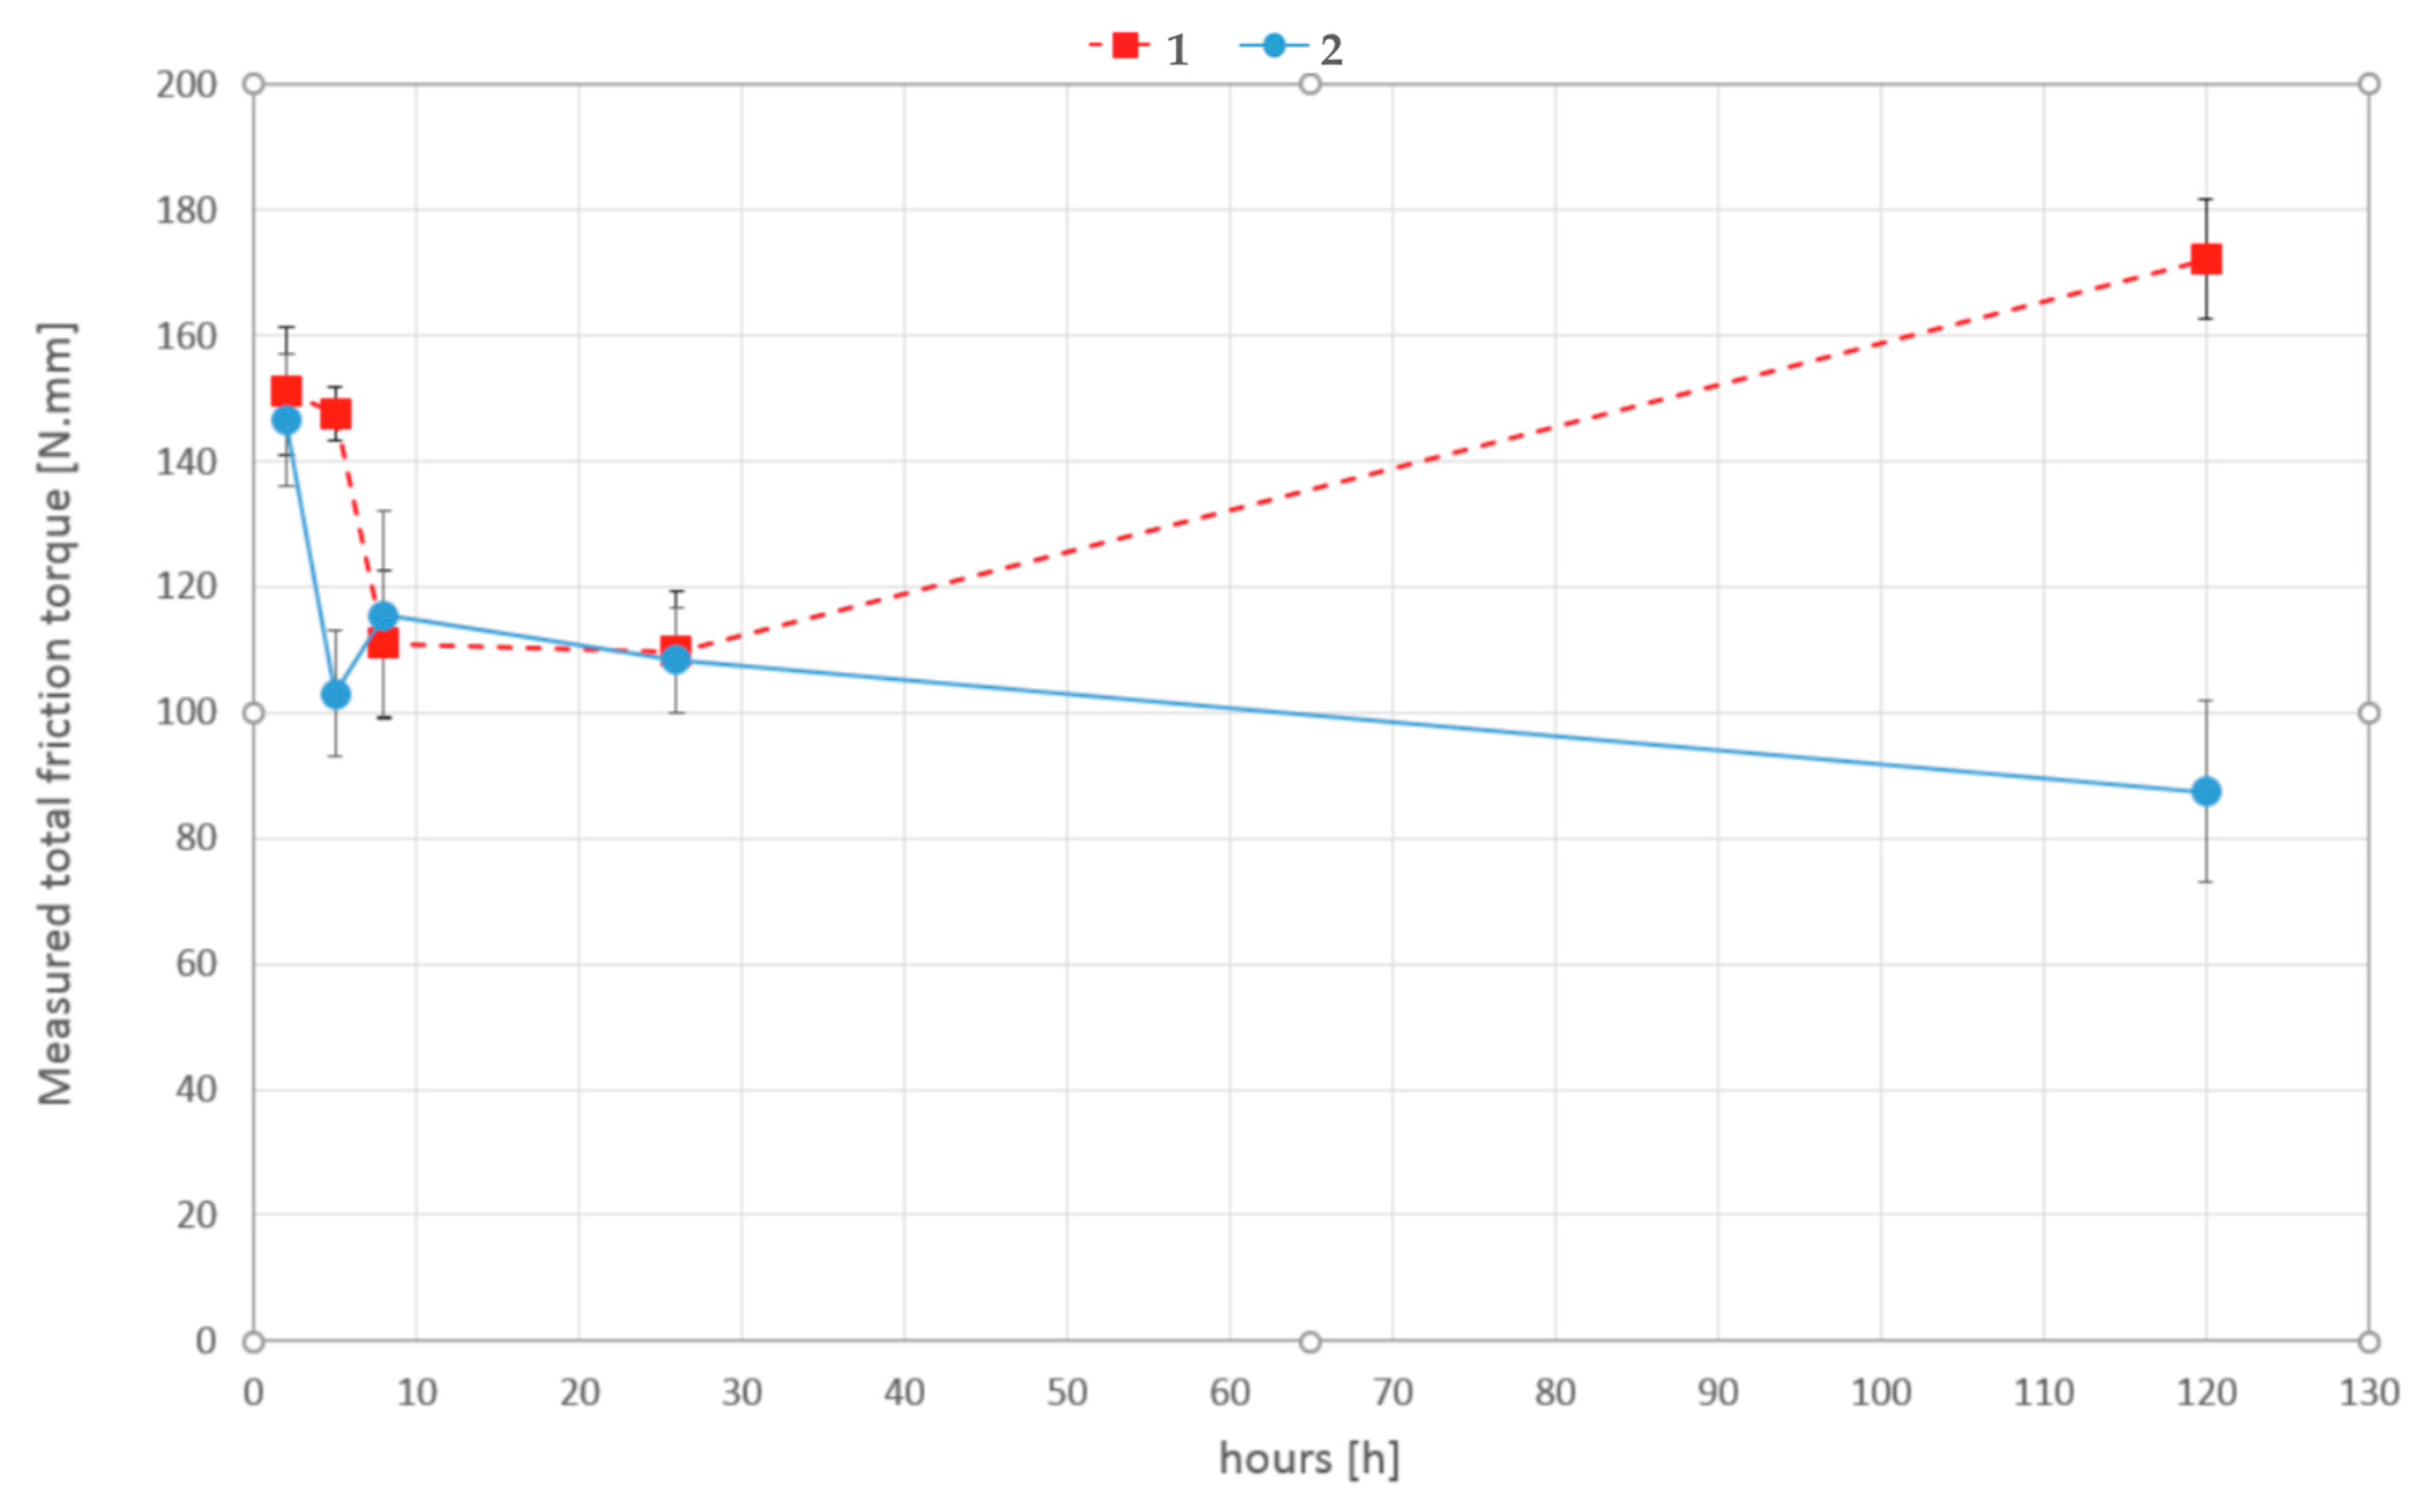
Figure 9 shows the value of the rolling bearing friction torque (Mt), which was the average of five replicates for each of the biogenic greases selected. For the rolling bearing tests, model grease samples 1 and 2 were selected since they produced lower friction coefficient values and the smallest wear marks from the ball on the disc tribometer.
As expected, the friction torque at very low speeds was high and decreased rapidly as the speed increased and the lubricant film built up. In this low-speed region, the sliding friction torque was dominant due to more frequent interactions of the surface asperities [42,43]. The friction torque then reached a minimum value around 400 rpm for both greases; above that speed, the friction torque started to increase again, albeit only slightly. This increase was due to greater drag losses and increased rolling friction torque [37,38,39,40,42].
Moreover, grease 1 showed higher friction torque than grease 2, both at low and high speeds. From our understanding, the differences found at low speeds should be related to the thickener type and oil-bleeding rate, while at high speeds, the differences should mainly be related to the higher base-oil viscosity of grease 1. This approach was supported by data regarding base-oil viscosity and oil-bleeding tests. The base-oil viscosity of each grease was determined at 40 °C and 100 °C according to the ASTM (American Society for Testing and Materials) D341 test (Standard Practice for Viscosity-Temperature Charts for Liquid Petroleum Products). The results showed that although model grease samples 1 and 2 contained the same type of base oil, i.e., a combination of castor oil and HOSO, grease sample 1 had a higher value of base-oil viscosity at 40 °C and 100 °C than model grease 2. In addition to this analysis, the bleed-oil of each grease was extracted using a non-standard dynamic bleeding process, similar to the ASTM D4425 standard method. The bleed-oil obtained through this non-standard dynamic method showed the same viscosity as the bleed-oil obtained using the static ASTM D6184 method. This dynamic method was used to calculate the oil-bleeding rate of each grease sample. The results showed that the amount was very similar between the two greases, although slightly higher for model grease 2 due to having a lower base-oil viscosity. Finally, grease 2 showed a better wear performance from a power loss perspective.

4.2.2. Wear Tests

As previously stated, the wear tests were performed under 5 kN, 200 rpm, and at 50 °C over 120 h. During this time, the friction torque was measured 2 h after the start of the test and then at 5, 8, 26, and 120 h, after which the machine was stopped.
The friction torque measured over time is shown in Figure 10. In the first hours of operation at 200 rpm, the friction torque was higher due to the grease churning. After approximately 5 h, the friction torque reduced substantially for the rest of the test. The exception was grease 1, which showed a very steep friction torque increase between 26 and 120 h. Either way, grease 1 generally showed a higher friction torque than grease 2.
After 120 h, both greases displayed a very dark coloration, particularly between the rolling elements and the raceway, as shown in Figure 11. This dark coloration was probably related to the presence of metallic particles originating from the wear process, but also due to some temperature-induced oxidation.
Finally, a sample of each grease was collected at the end of the power loss tests and wear tests for particle analysis. The ferrometry and ferrography analysis results are shown in Table 5. The indexes of small (DS, smaller than 1–2 µm) and large particles (DL, larger than 5 µm) refer to the concentration and size of particles found in a given sample of grease (100 mg diluted with 20 mL of an adequate solvent), collected after the power loss and wear tests. The particle concentration index (CPUC) and the severity of wear index (ISUC) can be estimated from DS and DL follows:
Particle   Concentration   Index   ( CPUC )   = DS + DL
Severity   of   Wear   Index   ( ISUC )   =   DL 2   DS 2
Based on these indexes and the ferrography analysis, a classification may be established according to wear severity, presence of fatigue or adhesion wear particles, and the presence of friction polymers and black oxides. More details regarding these procedures can be found elsewhere [44,45,46]. According to the results of the power loss tests, grease 1 showed more severe wear with a higher particle concentration index (CPUC) and severity of wear index (ISUC), suggesting once again that grease 2 performed better. Moreover, as seen in this table, the results of the wear tests were considerably higher than the results obtained for the power loss tests.

5. Conclusions

In this study, completely biogenic lubricating greases were tribologically investigated using a ball-on-disc tribometer and compared with two traditional reference greases. A linear relationship was observed between the friction coefficient and the wear data for most of the examined model grease samples. This result revealed that the lower the friction coefficient was, the lower the wear volume that occurred on the steel plate due to the friction process. Moreover, the results showed how the different compositions of model greases highly influenced the frictional and wear behaviors. Using Fleischer’s energetic wear model, the apparent friction energy density ( e R * ), the intensity of wear ( I h ), and the friction shear stress ( τ R ) for all the model greases were experimentally estimated and the relationship between these tribological parameters was calculated. Plotting these three associated tribological parameters on the Fleischer’s graph of the basic energy equation of wear for the model greases allowed for the determination of the friction and wear states the experiments were conducted in, which was a combination of fluid friction and mixed friction for all the grease samples. In addition, the estimation of the apparent friction energy density revealed that the grease-lubricated contacts with high friction energy densities led to low wear intensities on the steel plate.
In order to assess the tribological behavior of the biogenic greases in real machine elements, rolling bearing power loss and rolling bearing wear tests were carried out with two selected biogenic grease samples. Results from the power loss tests showed that model grease 2, which had a lower base-oil viscosity, provided smaller friction torque values than model grease 1 under the operating conditions of the experiment. Comparing the tested greases, model grease 2 showed a better overall performance, a slightly lower internal torque loss, and less wear particle generation even though both model greases were similar in composition, with sample 2 containing sorbitan monostearate instead of beeswax in the thickener blend. Regarding the wear tests, similar conclusions were found, i.e., higher friction torque was associated with greater wear. Model grease 1 exhibited higher wear indexes and showed worse performance than model grease 2. Moreover, both grease samples showed very dark coloration after the test, and a considerable number of wear particles were found, some with large dimensions.

Author Contributions

Most of the experiments and writing were done by N.A., E.K., J.M.F., and J.H.O.S. D.E.P.G. contributed by supervising the experimental work and writing the paper. Rolling bearing tests were performed by J.H.O.S. and D.E.P.G. at INEGI (Institute of Science and Innovation in Mechanical and Industrial Engineering). J.M.F. designed and synthetized the bio-thickeners of samples S1–S4 at Pro2TecS (University of Huelva). All authors have read and agreed to the published version of the manuscript.

Funding

This research, which is part of the research Project “Tribiogen”, was funded by the German Ministry of Education and Research, grant number FKZ13FH018IX4. The authors gratefully acknowledge the financial support.

Acknowledgments

The authors acknowledge Fuchs Europe Schmierstoffe (Mannheim, Germany) and Fuchs Lubritech (Kaiserslautern, Germany) for kindly providing the model samples. Finally, the authors also gratefully acknowledge Beatriz Graça for her support and help in performing the rolling bearing tests.

Conflicts of Interest

The authors declare no conflict of interest.

References

  1. Bartz, J.W. Lubricants and the environment. Tribol. Int. 1998, 31, 35–47. [Google Scholar] [CrossRef]
  2. Wilson, B. Lubricants and functional fluids from renewable resources. Ind. Lubr. Tribol. 1998, 50, 6–15. [Google Scholar] [CrossRef]
  3. Boyde, S. Green lubricants. Environmental benefits and impacts of lubrication. Green Chem. 2002, 4, 293–307. [Google Scholar] [CrossRef]
  4. Erhan, S.Z.; Asadauskas, S. Lubricant basestocks from vegetable oils. Ind. Crops Prod. 2000, 11, 277–282. [Google Scholar] [CrossRef]
  5. Adhvaryu, A.; Erhan, S.Z. Epoxidized soybean oil as a potential source of high-temperature lubricants. Ind. Crops Prod. 2002, 15, 247–254. [Google Scholar] [CrossRef]
  6. Adhvaryu, A.; Erhan, S.Z.; Perez, J.M. Tribological studies of thermally and chemically modified vegetable oils for use as environmentally friendly lubricants. Wear 2004, 257, 359–367. [Google Scholar] [CrossRef]
  7. Erhan, S.Z.; Sharma, B.K.; Perez, J.M. Oxidation and low temperature stability of vegetable oil-based lubricants. Ind. Crops Prod. 2006, 24, 292–299. [Google Scholar] [CrossRef]
  8. Adhvaryu, A.; Sung, C.; Erhan, S.Z. Fatty acids and antioxidant effects on grease microstructures. Ind. Crops Prod. 2005, 21, 285–291. [Google Scholar] [CrossRef]
  9. Quinchia, L.A.; Delgado, M.A.; Valencia, C.; Franco, J.M.; Gallegos, C. Viscosity Modification of High-Oleic Sunflower Oil with Polymeric Additives for the Design of New Biolubricant Formulations. Environ. Sci. Technol. 2009, 43, 2060–2065. [Google Scholar] [CrossRef]
  10. Quinchia, L.A.; Delgado, M.A.; Valencia, C.; Franco, J.M.; Gallegos, C. Viscosity modification of different vegetable oils with EVA copolymer for lubricant applications. Ind. Crops Prod. 2010, 32, 607–612. [Google Scholar] [CrossRef]
  11. García-Zapateiro, L.A.; Delgado, M.A.; Franco, J.M.; Valencia, C.; Ruiz-Méndez, M.V.; Garcés, R.; Gallegos, C. Oleins as a source of estolides for biolubricant applications. Grasas y Aceites 2010, 61, 171–174. [Google Scholar]
  12. Sánchez, R.; Franco, J.M.; Delgado, M.A.; Valencia, C.; Gallegos, C. Effect of thermo-mechanical processing on the rheology of oleogels potentially applicable as biodegradable lubricating greases. Chem. Eng. Res. Des. 2008, 86, 1073–1082. [Google Scholar] [CrossRef]
  13. Sánchez, R.; Franco, J.M.; Delgado, M.A.; Valencia, C.; Gallegos, C. Development of new green lubricating greases formulations based on cellulosic derivatives and castor oil. Green Chem. 2009, 11, 686–693. [Google Scholar] [CrossRef]
  14. Sánchez, R.; Franco, J.M.; Kuhn, E.; Fiedler, M. Tribological characterization of green lubricating greases formulated with castor oil and different biogenic thickener agents: A comparative experimental study. Ind. Lubr. Tribol. 2011, 63, 446–452. [Google Scholar] [CrossRef]
  15. Sánchez, R.; Franco, J.M.; Delgado, M.A.; Valencia, C.; Gallegos, C. Thermal and mechanical characterization of cellulosic derivatives-based oleogels potentially applicable as bio-lubricating greases: Influence of ethyl cellulose molecular weight. Carbohydr. Polym. 2011, 83, 151–158. [Google Scholar] [CrossRef]
  16. Sánchez, R.; Stringari, G.B.; Franco, J.M.; Delgado, M.A.; Valencia, C.; Gallegos, C. Use of chitin, chitosan and acylated derivatives as thickener agents of vegetable oils for bio lubricant applications. Carbohydr. Polym. 2011, 85, 705–714. [Google Scholar] [CrossRef]
  17. Alfonso, J.E.M.; Yañez, R.; Valencia, C.; Franco, J.M.; Díaz, M.J. Optimization of the Methylation Conditions of Kraft Cellulose Pulp for Its Use As a Thickener Agent in Biodegradable Lubricating Greases. Ind. Eng. Chem. Res. 2009, 48, 6765–6771. [Google Scholar] [CrossRef]
  18. Núñez, N.; Alfonso, J.E.M.; Valencia, C.; Sánchez, M.C.; Franco, J.M. Rheology of new green lubricating grease formulations containing cellulose pulp and its methylated derivative as thickener agents. Ind. Crops Prod. 2012, 37, 500–507. [Google Scholar] [CrossRef]
  19. Sánchez, R. Rheological and mechanical properties of oleogels based on castor oil and cellulosic derivatives potentially applicable as bio-lubricating greases: Influence of cellulosic derivatives concentration ratio. J. Ind. Eng. Chem. 2011, 17, 705–711. [Google Scholar] [CrossRef]
  20. Acar, N.; Franco, J.M.; Kuhn, E. On the shear-induced structural degradation of lubricating greases and associated activation energy: An experimental rheological study. Tribol. Int. 2020, 144, 106105. [Google Scholar] [CrossRef]
  21. Kuhn, E. Friction and wear of a grease lubricated contact—An energetic approach. In Tribology: Fundamentals and Advancements; Gegner, J., Ed.; InTech: London, UK, 2013; ISBN 978-953-51-1135-1. [Google Scholar]
  22. Fleischer, G.; Gröger, H.; Thum, H. Verschleiß und Zuverlässigkeit; VEB Verlag Technik: Berlin, Germany, 1980. [Google Scholar]
  23. Fleischer, G. Zum Energetischen Niveau von Reibpaarungen. In Schmierungstechnik 16; VEB Verlag Technik: Berlin, Germany, 1985. [Google Scholar]
  24. Sequard-base, J.; Lenauer, C.; Lazarev, V.; Gavrilov, K.; Doikin, A.; Vorlaufer, G. A Modified Energy-Based Model for Describing Wear Processes Applied to an Internal Combustion Engine. Int. J. Comp. Methods Exp. Meas. 2015, 3, 150–164. [Google Scholar] [CrossRef] [Green Version]
  25. Brinkschulte, L.; Mattes, J.; Geimer, M. An approach to wear simulation of hydrostatic drives to improve the availability of mobile machines. In Proceedings of the 11th International Fluid Power Conference, Aachen, Germany, 19–21 March 2018. [Google Scholar]
  26. Bartel, D.; Bobach, L.; Illner, T.; Deters, L. Simulating transient wear characteristics of journal bearings subjected to mixed friction. J. Eng. Tribol. 2012, 226, 1095–1108. [Google Scholar] [CrossRef]
  27. Lang, J.; Knoll, G.; Schönen, R.; Jaitner, D.; Schiffgens, H.J.; Schlüter, S. Simulation of a High-Pressure Fuel Pump under Thermo-Elastohydrodynamic Conditions; Springer Fachmedien: Wiesbaden, Germany, 2018. [Google Scholar] [CrossRef]
  28. Foko, F.; Heimes, J.; Magyar, B.; Sauer, B. Reibenergiebasierte verschleisssimulation für radialwellendichtringe. In Proceedings of the Gft-Conference, Göttingen, Germany, 23–25 September 2019. [Google Scholar]
  29. Kučera, M.; Chotčborský, R. Analysis of the process of abrasive wear under experimental conditions. Sci. Agric. Bohem. 2013, 44, 102–106. [Google Scholar] [CrossRef]
  30. Kučera, M.; Pršan, J.; Kostoláni, P. A systemic approach to testing the tribological properties of selected materials of agricultural machines. J. Cent. Eur. Agric. 2014, 15, 146–159. [Google Scholar] [CrossRef]
  31. Kuhn, E. Tribological stress of lubricating greases in the light of system entropy. Lubricants 2016, 4, 37. [Google Scholar] [CrossRef] [Green Version]
  32. Kuhn, E. Correlation between system entropy and structural changes in lubricating grease. Lubricants 2015, 3, 332–345. [Google Scholar] [CrossRef] [Green Version]
  33. Kragelski, I.P.; Dobicin, M.N.; Kombalov, V.S. Reibung und Verschleiß; Technik: Verl, Germany, 1982. [Google Scholar]
  34. Kuhn, E. Zur Tribologie der Schmierfette: Eine Energetische Betrachtungsweise des Reibungs-und Verschleißprozesses; Expert Verl: Renningen, Germany, 2017. [Google Scholar]
  35. Borrero-López, A.M.; Valencia, C.; Franco, J.M. Rheology of lignin-based chemical oleogels prepared using diisocyanate crosslinkers: Effect of the diisocyanate and curing kinetics. Eur. Polym. J. 2017, 89, 311–323. [Google Scholar] [CrossRef]
  36. Triviño, E.C.; Valencia, C.; Delgado, M.A.; Franco, J.M. Modification of alkali lignin with poly (ethylene glycol) diglycidyl ether to be used as a thickener in bio-lubricant formulations. Polymers 2018, 10, 670. [Google Scholar] [CrossRef] [Green Version]
  37. Cousseau, T.; Graça, B.; Campos, A.; Seabra, J. Experimental measuring procedure for the friction torque in rolling bearings. Lubr. Sci. 2010, 22, 133–147. [Google Scholar] [CrossRef] [Green Version]
  38. Cousseau, T.; Graça, B.; Campos, A.; Seabra, J. Friction torque in grease lubricated thrust ball bearings. Tribol. Int. 2011, 44, 523–531. [Google Scholar] [CrossRef] [Green Version]
  39. Gonçalves, D.; Cousseau, T.; Gama, A.; Campos, A.V.; Seabra, J.H.O. Friction torque in thrust roller bearings lubricated with greases, their base oils and bleed-oils. Tribol. Int. 2016. [Google Scholar] [CrossRef]
  40. Gonçalves, D.; Pinho, S.; Graça, B.; Campos, A.V.; Seabra, J.H.O. Friction torque in thrust ball bearings lubricated with polymer greases of different thickener content. Tribol. Int. 2016, 96, 87–96. [Google Scholar] [CrossRef]
  41. Available online: www.tricocorp.com/product/direct-reading-ferrograph/ (accessed on 31 May 2018).
  42. SKF. Evolution online and G morales-espejel. using a friction model as an engineering tool. Evol. SKF 2006, 2, 27–30. [Google Scholar]
  43. SKF. SKF General Catalogue; SKF: Schweinfurt, Germany, 2003. [Google Scholar]
  44. Available online: http://www.plus-sci.co.kr/image/ana/predict-dli/pdf/ferrography_overview.pdf (accessed on 20 December 2019).
  45. Available online: https://pdfs.semanticscholar.org/17d4/b8224be1a7df01929af300874e6f5017f18c.pdf (accessed on 20 December 2019).
  46. Available online: https://wearcheck.com/virtual_directories/Literature/Techdoc/WCA001.htm (accessed on 20 December 2019).
Figure 1. Graph of the basic energy equation of wear (adapted from G. Fleischer [23]).
Applsci 10 01477 g001
Figure 2. Tribometer designed by the Laboratory for Machine Elements and Tribology (MuT) laboratory at Hamburg University of Applied Sciences (HAW-Hamburg). Note: 1—Friction force-sensor, 2—steel ball, 3—lubricating grease, 4—steel disc, 5—swivel arm, and 6—electromotor (adapted from E. Kuhn [34]).
Applsci 10 01477 g002
Figure 3. Rolling bearing test rig scheme.
Applsci 10 01477 g003
Figure 4. Grease spread on (a) the rolling bearing house, lower raceway, and cage, and (b) on the upper raceway shaft.
Applsci 10 01477 g004
Figure 5. Friction coefficients versus wear volume on a steel plate for all model greases (wear path s R = 387 m).
Applsci 10 01477 g005
Figure 6. Profilometric pictures obtained from the steel plates as a function of the lubricant grease (window sizes of 0.599 mm × 1.111 mm, 0.461 mm × 1.111 mm, 0.680 mm × 1.111 mm, and 0.478 mm × 1.111 mm).
Applsci 10 01477 g006
Figure 7. Apparent friction energy density ( e R * ) vs. wear intensity ( I h ) for all the model greases.
Applsci 10 01477 g007
Figure 8. Graph of the basic energy equation of wear for all the model greases.
Applsci 10 01477 g008
Figure 9. TBB friction torque results as a function of the entrainment speed for greases 1 and 2.
Applsci 10 01477 g009
Figure 10. TBB friction torque results as a function of the test time for greases 1 and 2.
Applsci 10 01477 g010
Figure 11. Remaining grease on (a) the rolling bearing house, lower raceway, and cage, and (b) the upper raceway shaft.
Applsci 10 01477 g011
Table 1. Friction and wear conditions with associated tribological process parameters (adapted from G. Fleischer [23]).
RangeFriction StateWear StateProcess Parameter
e R *   ( J / mm 3 ) τ R   ( MPa ) I h   ( )
0Fluid friction (rheological deformation and shear)Zero wear1010–107100–10−3<10−13
1Fluid friction/mixed friction (rheological and elastic deformation and shear)Solid body wear level 1109–106103–10−310−13–10−7
2Mixed friction (rheological and plastic deformation and shear)Solid body wear level 2106–104103–10−310−11–10−5
3Solid friction (elastic and plastic deformation and shear)Solid body wear level 3106–102103–10−210−10–10−3
4Solid friction (separating deformation and shear)Solid body wear level 4104–101103–10−210−8–10−3
Table 2. Compositions of greases.
Grease Sample (Code)Base OilSubstance of Content
R1Synthetic esterLithium/calcium soap
R2HOSO 1Lithium-12-hydroxystearate
1HOSO and castor oilBeeswax, glyceryl monostearate, and cetyl alcohol
2HOSO and castor oilGlyceryl monostearate, cetyl alcohol, and sorbitan monostearate
3HOSO and glycerolCellulose ether
4HOSOIsoprene derivative
5HOSOLignosulfonate
6HOSONatural cellulose fibers, 18 µm
7HOSOCorncob grits, 80–120 µm
8HOSONatural cellulose, 20–40 µm
9HOSONatural wood pulp from softwood, 70–150 µm
10HOSONatural cellulose fibers, 120 µm
11HOSO and castor oilEthyl cellulose, carnauba wax, and cetyl alcohol
12Castor oil, HOSO and MCT oil (triglyceride of C8/C10 fatty acids)Polyhydroxybutyric acid and ethyl cellulose
13Glycerol and sorbitan monooleateChitosan, glyceryl monostearate, and calcium phosphates
S1Castor oilLignin/PEGDGE 2 (weight ratio of 1/0.25)
S2Castor oilLignin/PEGDGE (weight ratio of 1/1)
S3Castor oilLignin/HMDI 3 (weight ratio of 1/2)
S4Castor oilLignin/HMDI (weight ratio of 1/1)
1 HOSO: high-oleic sunflower oil; 2 PEGDGE: polyethylene glycol diglycidyl ether; 3 HMDI: hexamethylene diisocyanate.
Table 3. Operating conditions of the power loss tests. TBB: Thrust ball bearing.
ParameterTBB 51107
Mean diameter (mm)43.5
Number of rolling elements21
Height (mm)12
Composite roughness (nm)155
Rotational speed (rpm)100, 200, 400, 800, 1600
Axial Load (N)5 kN ( 2.08 GPa)
Temperature (°C)Controlled at 50 °C
Table 4. Operating conditions of the wear tests.
LoadSpeedTemperatureTime
5 kN200 rpm50 °C120 h
Table 5. Ferrometry and ferrography results of the power loss and wear tests.
IdentificationPower Loss TestsWear Tests
Sample1212
Bearing Load (kN)5555
Number of cycles250–300 k250–300 k1440 k1440 k
Ferrometry
Large Particles Index (DL)67.717.786.057.1
Small Particles Index (DS)17.75.130.717.7
Particle Concentration Index (CPUC)85.422.8116.774.8
Severity of Wear Index (ISUC)4270.0287.36453.52947.1
Ferrography
Normal WearStrongMediumStrongStrong
Severe WearStrongStrongMediumMedium
Fatigue Wear ParticlesMediumMediumMediumMedium
Adhesion Wear ParticlesFairFairFairFair
Friction PolymersFairFairFairFair
Black OxidesMediumFairStrongStrong

