Abstract
Over the last decade, the importance of electricity in the overall energy mix has been increasing. Trends show that by 2030, half of the electricity production will be from renewable energy sources, such as wind or solar energy. To complete and underpin such robust growth, the EU policies and national legislations related to the electricity market must introduce new instruments, taking into account new market players and cutting-edge technologies such as energy storage devices. The sustainability and security of the European electricity supply are strongly dependent on the successful integration of photovoltaic energy. This paper examines the deviation between day-ahead and intraday photovoltaic power generation forecasts compared to the real production regarding 1000 MWp photovoltaic systems. The aim was to determine the photovoltaic balancing requirement through real data relative to the day-ahead and intraday forecasts. Another goal was also to establish the photovoltaic grid balancing reduction potentials of lithium-ion-based and vanadium redox flow battery storage systems. As a result of this research, it was possible to present the magnitudes of the balancing power, the energy divergence, and the frequency in the examined 5-year period. In addition, by a second modeling concept, several energy storage capacity sizes (nominal net storage capacity) were simulated from the values of 10 to 10,000 MWh to estimate these grid balancing reduction potentials by using real, measured photovoltaic data.
1. Introduction
1.1. Photovoltaic Trends in the World and in the European Union
Due to today’s energy trends, it is necessary to reorganize the existing energy systems, mainly due to the increasing greenhouse gas emissions of the world, the scarcity of fossil fuels, and the increasing demand for electricity. The electricity sector plays an important role in the reduction of anthropogenic greenhouse gas emissions. Therefore, the use of less carbon-intensive technologies is necessary to meet challenging emission reduction targets [1,2,3]. The renewable energies have an increasing role in the process of energy production in the 21st century [4]. Besides numerous other benefits, energy production based on photovoltaic technologies can significantly contribute to sustainable energy management. By a one-time investment in photovoltaic technology, it is possible to produce CO2-free green energy without producing any waste for several decades [5,6].
Worldwide, the development of variable renewable energy (VRE) sources (wind, solar) is expanding rapidly because they are clean, safe, widely available, sustainable and economical [7]. Photovoltaic (PV) technologies use photovoltaic modules that transform the electromagnetic solar radiation from the Sun into electricity. A large-scale growth in photovoltaic energy production has been observed in recent years and in most countries the reasons are [8]:
- Rapid technological development,
- Falling investment costs, and
- The introduction of state subsidies [9].
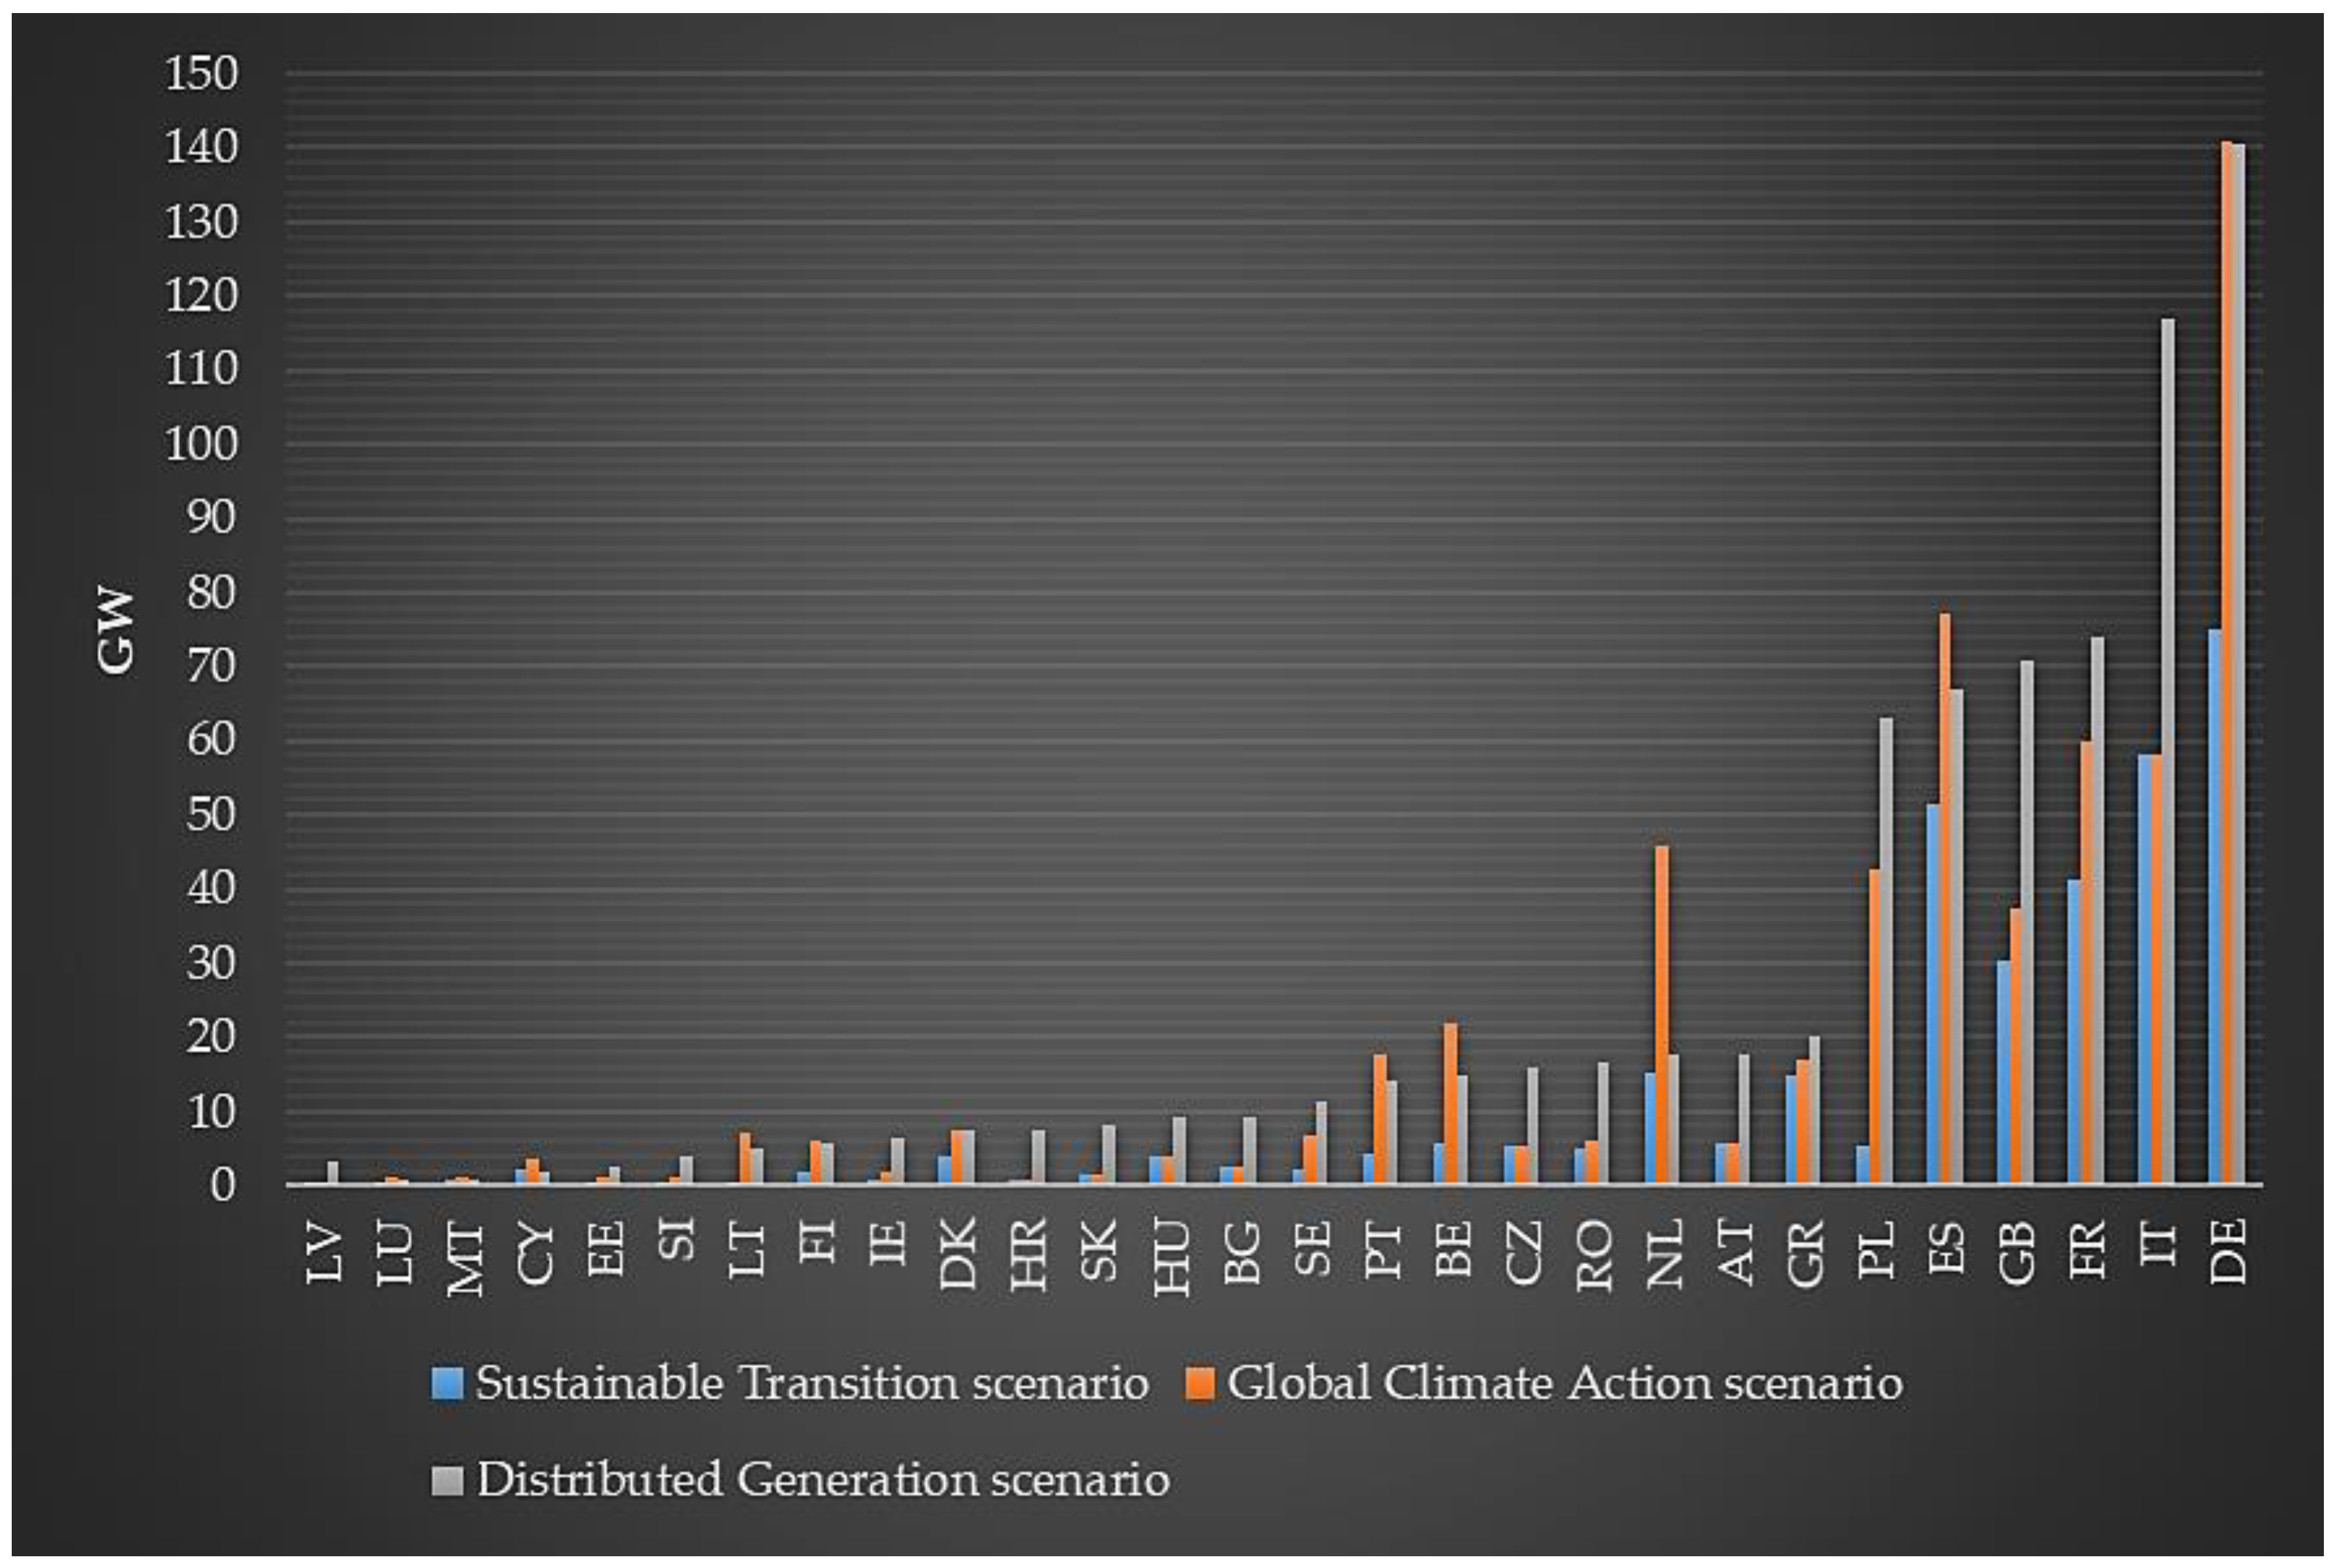
The share of renewable electricity production represented 26.5% of all electricity produced globally in 2017, of which PV systems accounted for 1.9% [10]. PV technologies have largely penetrated the global energy market. In 2018, the global built-in PV capacity amounted to 509.3 GW, with the largest proportions being China’s 175.1 GW, Europe’s 125.8 GW, the USA’s 62.1 GW, Japan’s 55.8 GW, and India’s 27.3 GW [11]. Nowadays, in the energy sector, PV technology is considered to be a cost-competitive source for increasing electricity production and for providing energy access. Nonetheless, markets in most locations continue to be driven largely by regulations or government incentives [12,13,14,15]. Germany (45.9 GW/2018), Italy (19.9 GW/2018), France (8.9 GW/2018), Spain (5.9 GW/2018), and the Netherlands (4.1 GW/2018) have a prominent role in the spread of photovoltaic technology in the European Union (EU). Based on the European Network of Transmission System Operators for Electricity (Entso-E) scenarios, by 2040, the net PV production capacity in the EU will be about 231–625 GW higher than in 2017 (108 GW) [11,16,17] (Figure 1).
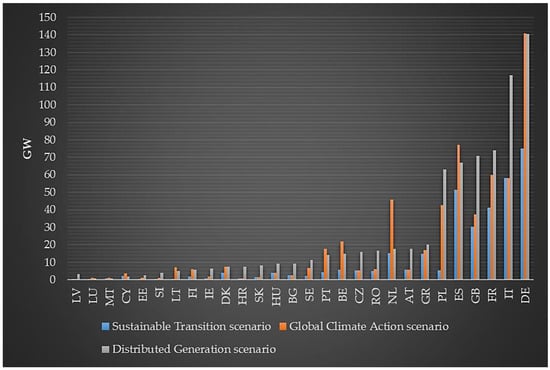
Figure 1.
Net photovoltaic (PV) production capacity forecast in the EU based on Entso-E scenarios in 2040 based on [16].
1.2. The Importance of Energy Storage Systems
The need for energy storage systems in electricity networks is becoming increasingly important as more and more generating capacity uses VRE sources [18,19,20]. The ideal ratio between the necessary and unnecessary amount of VRE power depends on balancing and storage resources [21,22,23], transmission [24,25,26,27], and the characteristics of the load and the climate [28,29,30].
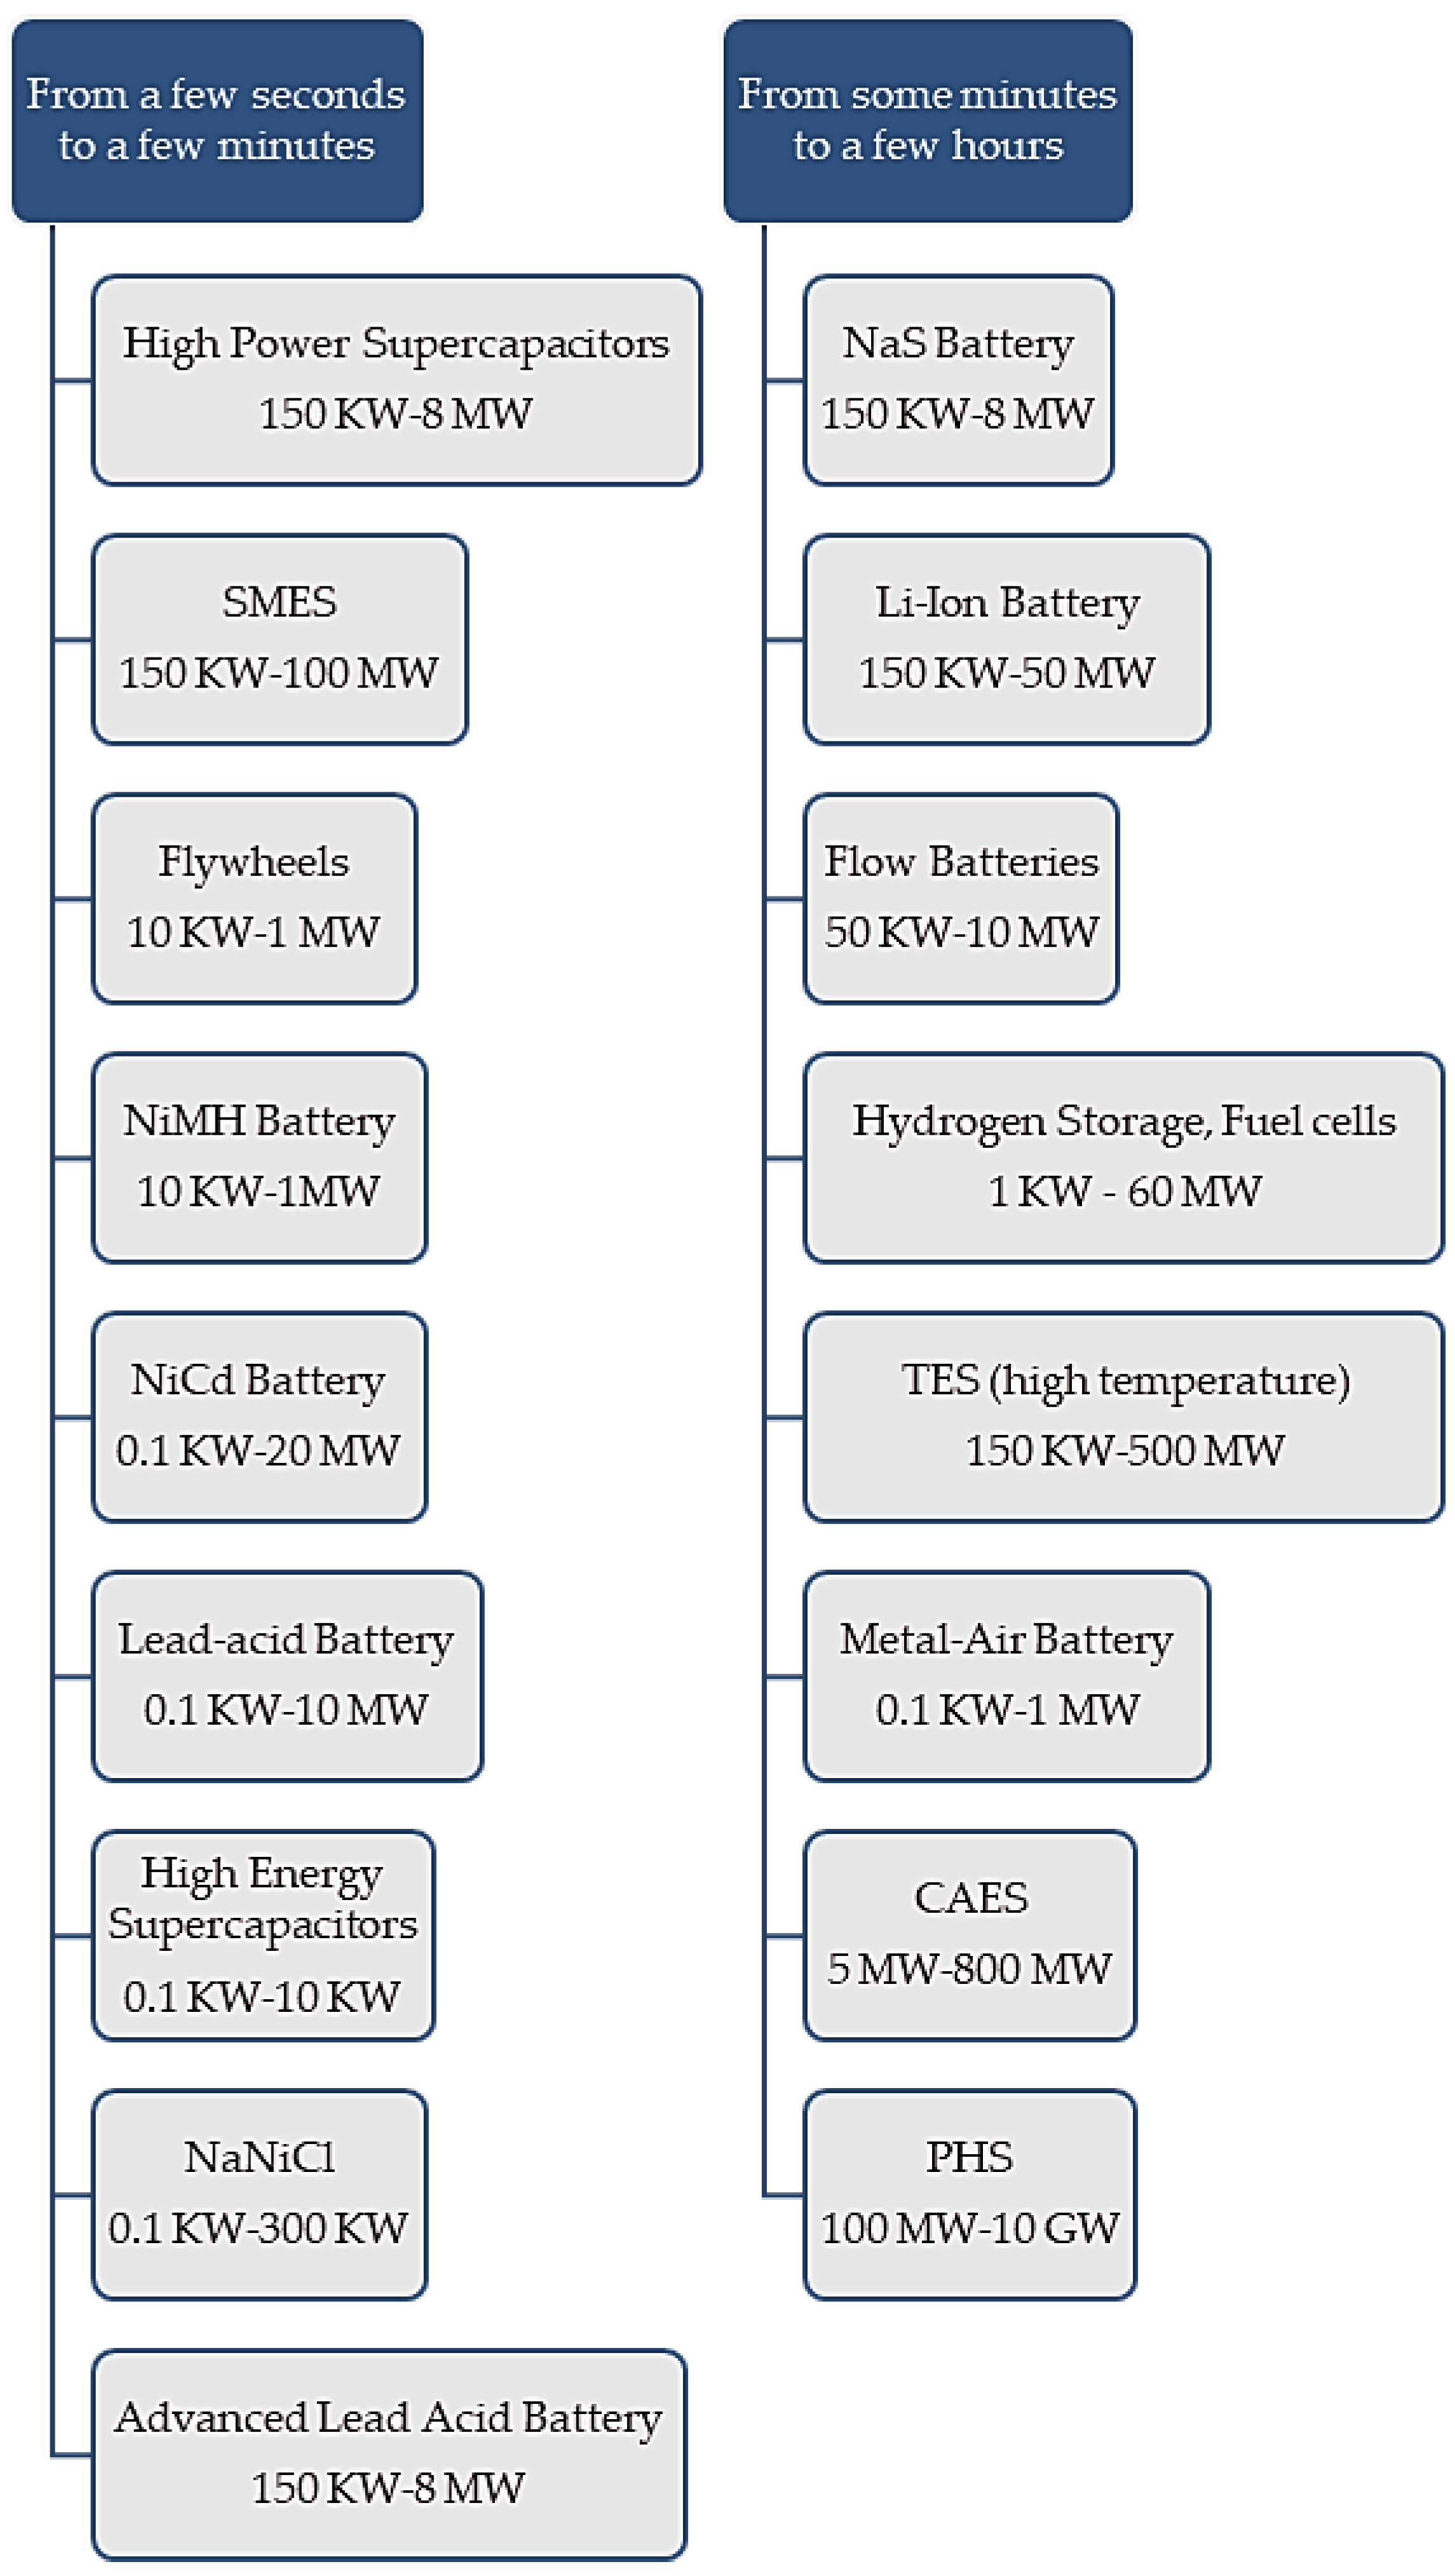
The key to addressing the variability and uncertainty of VRE integration is the increasing of the overall flexibility in the power systems. Energy storage technologies can provide a variety of flexibility services, including the provision of operating reserves and shifting energy over time to better match generation and load [31,32,33,34,35,36,37,38]. This technology can provide both downward and upward flexibility, storing energy either when there is a generation surplus or lower demand and discharging in the opposite case [38,39,40,41]. With respect to solutions for the load balancing of demand and supply in the electricity system large-scale storage options, such as molten-salt thermal storage, pumped hydro storage (PHS), battery, flywheel, or compressed air storage systems are of main interest (Figure 2) [42,43,44,45,46]. However, the specific details of the features of these energy storage technologies are not included in this manuscript.
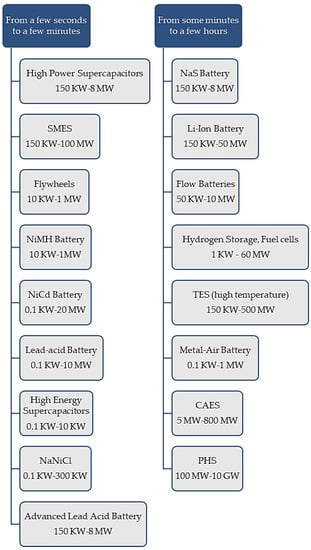
Figure 2.
Utility-scale energy storage technologies by typical discharge time and power capacity ranges based on [39].
The global stationary, grid-connected energy storage capacity was about 159 GW in 2017, most of which was provided by PHS with 153 GW. Around 0.5 GW new utility-scale energy storage capacity was added in 2017 of an estimated 5.9 GW in operation. Most of the growth was in electrochemical (battery) storage, which increased by 0.4 GW to a total of 2.3 GW [10,38,47,48,49]. Nowadays, the battery storage systems are attractive because they are compact, mostly safe, easy to deploy, and already economical in many countries, and they provide a virtually instant response to network disturbances [38,42,50]. Current forecasts and analyses [42] show that the total energy capacity of stationary storage technologies will grow from an estimated 4.67 in 2017 to 6.62–15.89 TWh by 2030 if the share of VRE in the energy system is to be doubled by 2030. According to optimistic estimates and different scenarios [42], the non-PHS will grow from an estimated 162 GWh in 2017 to 5.8–8.4 TWh in 2030. The large increase in storage will be driven by the rapid growth of utility-scale and behind-the-meter applications; therefore, the total battery capacity in stationary applications will grow from an estimated 11 GWh in 2017 to 100–421 GWh by 2030. From the Global Energy Storage Database (DOE) [51] and the International Renewable Energy Agency (IRENA) (2017) [42] data, it can be concluded that 20–80 GWh of global electromechanical storage energy capacity will be built by 2030, of which 20%–30% will be in the EU. The economics of stationary battery electricity storage applications could improve significantly in the 10 next years. As an increasing number of countries begin to introduce market reforms to support higher shares of VRE, more transparent and new markets for ancillary services are emerging, often at a very granular level. This market situation will open up new opportunities for electrochemical storage deployment, given that battery storage will increasingly offer competitive services to these markets. Besides, frequency regulation, electric energy time shift, or renewable capacity firming from battery storage technologies will also expand. The cost reduction potential for new and emerging electricity storage technologies (such as vanadium redox flow battery (VRFB)) is significant [17,42,52]. In 2020, the average price of a utility-scale lithium-ion-based energy storage system (without tax, customs, shipping, authorization, installation costs, etc.) was 300–400 $/kWh, while in the case of VRFB technology, the price decreased to 200–295 $/kWh. This means that the VRFB energy storage technology has become a real, competitive alternative to Li-ion-based (lithium titanate, lithium iron phosphate, nickel manganese cobalt oxide, lithium nickel cobalt aluminum) storage systems [52,53,54]. Table 1 shows the expected energy installation cost reference values for 2030 [42]. In the recent period, the market perception of utility-scale Li-ion energy storage systems in the USA has changed somewhat. In the summer of 2019, there was a major fire at a 2-MW lithium-ion battery system in the state of Arizona (USA). This was the second such case in the state. As a result, the state is exploring the available economical, more sustainable, and secure alternatives. From a security standpoint, the VRFB technology has no risk of thermal runaway [55,56]. The advantage of VRFB is the indefinite-depth discharge cycle, while the rate of physical degradation of the Li-ion battery varies from 2% to 18% after 2500 cycles compared to the new state. The disadvantage of the VRFB technology is the approximately 10%–20% lower round-trip efficiency compared to Li-ion technology [57,58,59,60,61].

Table 1.
Energy installation cost reference values of Li-ion and vanadium redox flow battery (VRFB) batteries for 2020 and 2030 based on [42].
1.3. Grid Integration Challenges of Variable Renewable Energy Sources and Storage Systems
Integrating the PV technologies into the EU grid system will address the need for a more flexible electricity grid [62]. At present, the integration of PV power into the electricity grid is a challenge due to the variable nature of power generation, since the existing grids and their capacities were established to comply with less or non-variable energy sources, predictable load peaks, and dispatchable power generation. Nowadays, the flexibility of the grid is an indispensable economic–technical aspect that is required to handle the network constraints caused by PV generation during the peak hours of the demand [17,33,63,64,65]. One of the most important steps is to evaluate existing rules to determine whether new approaches to design, planning, and operation are needed for higher penetrations of PV technologies. Real market examples show that the EU countries do not have a unified approach to this situation. For example, the Spanish Government has developed a regulation for deploying a net-metering system that will allow restraining energy demand on the system. This concept focuses not only on generation, but also on generation and demand management [66,67]. In contrast, the Czech and Polish transmission system operators (TSOs) have installed phase-shifting transformers (PSTs) at their borders with Germany to prevent the loop flows of northern German VRE power meant for Bavaria and Austria flooding their networks. The interesting thing about the situation is that Austria buys wind power to fill its pumped hydropower storage systems, and ideally 35% of the electricity flowing from Germany to Austria passes through the Czech Republic [67,68]. Strbac et al. [40] showed by a UK network example that the addition of 5 GW of storage in the case of a 60 GW average grid demand reduces the transmission expansion needs by 20% using 24-h storage [39]. The examples help to understand that it is necessary for each country to develop their own policies and system operations to achieve the safe system flexibility and reliability needed for successful PV power integration. For a given power system, the planning consists of an inherently complex set of activities that are undertaken by multiple jurisdictions and groups. The PV technology can be accommodated by integrating the planning of system performance, generation, and transmission. To achieve this, institutions and markets need to be designed to allow access to physical capacity [67]. Energy storage is practically equivalent to grid enhancements in a country because this should be integrated into the network and/or the entire transformer area. This means that not only the transmission capacity and interconnection should be analyzed, but also the network development features (also local smart grid, low- and medium-voltage developments, virtual power plant concepts, transmission reliability margin) and the costs for each country. Based on the energy storage capacities, power capacities, discharge time, and capacity factor values, it is possible to calculate the role of energy storage in the energy mix. In this way, the declining role of peak power plants or the load-reducing role of VRE can be examined/calculated, too. This makes it possible e.g., to determine some reduction of interconnection values. Due to increased VRE, local energy storage is a security issue for each country, which also serves the interests of the market. Due to the heterogeneous installations and weather dependence of PV energy within a country, an opposite energy flow can occur in the local electricity network. This problem can only be effectively managed by a local storage system to optimize the electrical parameters of the entire transformer area. The main purpose of the new storage systems is to keep the voltage within the permitted range by charging and discharging according to the local VRE systems [67,69,70].
1.4. Energy Storage Systems for the Energy Management of Variable Renewable Energy Sources in the Distributed Generation Systems
In the energy sector nowadays, the electricity market liberalization and distributed generation (DG) have been the key drivers for the expansion of the concept of small-scale energy sources. Regarding the fight against global climate change, the use of variable renewables such as wind and PV energy are important to ensure sustainability and energy conservation. Integrating VRE sources is turning out to be a real challenge for the smooth operation of DGs. Grid operators face immense issues in scheduling the generated power from the DGs, especially due to variable renewable energy sources (VREs), which are difficult to be forecasted. An effective management of the generating resources in the DG network is currently very important. It can be said that the energy storage solutions can be incorporated for energy management in many ways, and the conventional usage of energy storage devices was mostly for long-term storage applications. Today, these devices can be used for energy storage and delivery from millisecond to months. These systems can act as spinning reserves for providing short-term power supply to manage instant variability in DG-generated power. Energy storage solutions can compensate for the intermittency and variability of PV and wind energy sources and improve the power reliability and quality. On the other hand, energy storage systems (ESSs) can also provide ancillary services to enable quality power delivery to the end users. The optimized selection in the sizing and siting of ESSs is an important challenge for engineers. The dynamic management of energy generated in a DG system can enhance the performance of the system, thereby enabling reliable and quality energy delivery. National regulations or features such as Feed-in-Tariff (FiT), bond yield interest rates, and other economic dynamics have great impact on the operation of DGs, in which case ESSs can act as added assets to achieve better economic dispatch solutions. The effective usage and implementation of energy storages in the distributed grid requires flexible and intelligent energy management strategies that are capable of handling the dynamics of distributed systems, while ensuring the efficient and effective usage of storage devices. However, the further implementation of hardware-in-the-loop optimization, simulations, weather forecasts, algorithms, and other intelligent techniques and tools have now been attempted to propose advanced energy management scheme strategies to improve storage lifetime and operability [71].
1.5. Policy Proposals and Trends in the Energy Storage Market in the European Union
In the EU’s Energy Union strategy, there are five closely mutually reinforcing and interrelated dimensions:
- A fully integrated European energy market,
- Energy efficiency contributing to the moderation of demand,
- The decarbonization of the economy,
- Trust, energy security, and solidarity, and
- Competitiveness, research and innovation [72].
The energy storage systems have the potential to play an increasing role in achieving each of these dimensions. The need for new energy storage capacity is limited, and the economic perspective is currently not very favorable for new installations. However, in the longer term, more grid flexibility will be needed if higher shares of VRE sources are integrated. The European Union should invest more in research and development activities and product development into promising directions to become competitive in storage technologies, and it is also an important aspect to constantly analyze the most effective options. Storage innovations can generate opportunities and create new employment for the EU. Demand side management, flexible generation units, energy storage, and interconnections can all act as flexibility options. For the future, the development of capacity markets should be harmonized at the European level with clear guidelines to ensure neutrality in relation to technology choices for flexibility storage options and following an integrated energy market approach. The energy storage technologies in support of the transmission and distribution networks could provide greater reliability, stability, and resilience for the EU. Thereby, energy storage can help to reduce, defer, or even avoid investments in transmission and distribution infrastructure when it is a more economical choice. The use of energy storage technologies by national grid operators is very limited nowadays. According to some opinions, access should be provided to storage technologies with new business models. It would be necessary to allow grid operators to invest, exploit, and use energy storage services together with residential and industrial customers of the energy sector to strengthen the flexibility, resilience, and reliability of the grids [72].
Published in June 2019, Regulation (EU) 2019/943 on the internal market for electricity is considered as one of the last but most important documents of the Clean Energy Package with special regard to its provisions shaping the future of energy storage. The inclusion of consumers in the electricity market by enhancing the demand-side response and energy storage will be a significant step toward a more flexible electricity system that can keep up with the intense deployment of renewable energy technology and respond to the continuously growing energy demand [73].
The rapid deployment of renewable energy technologies is closely linked to the EU’s long-term goal to achieve carbon neutrality by 2050. Such a shift toward clean energy urges increased electrification, entailing a growing need for upgrading energy storage solutions. Under the new regulation, balancing markets shall ensure non-discrimination between market actors, taking into account different technical capacities of sources of electricity generation, storage, and demand-side response. Moreover, the non-discrimination of energy storage facilities should also be considered in terms of access to electricity networks. Energy storage, as defined in the common rules for the internal electricity market, is one of the numerous novelties of the new regulation, including not only reconversion into electricity, but also into other energy carriers. The new policy framework is also setting up expectations toward distribution system operators (DSOs), highlighting their key role in the better integration of renewable energy sources, distributed power generation, and other resources embedded in the electricity network, such as energy storage solutions. On the other hand, close and effective cooperation among TSOs and DSOs will be of great importance in order to ensure coordinated access to such resources [74,75].
1.6. The Main Business Levels of Energy Storage
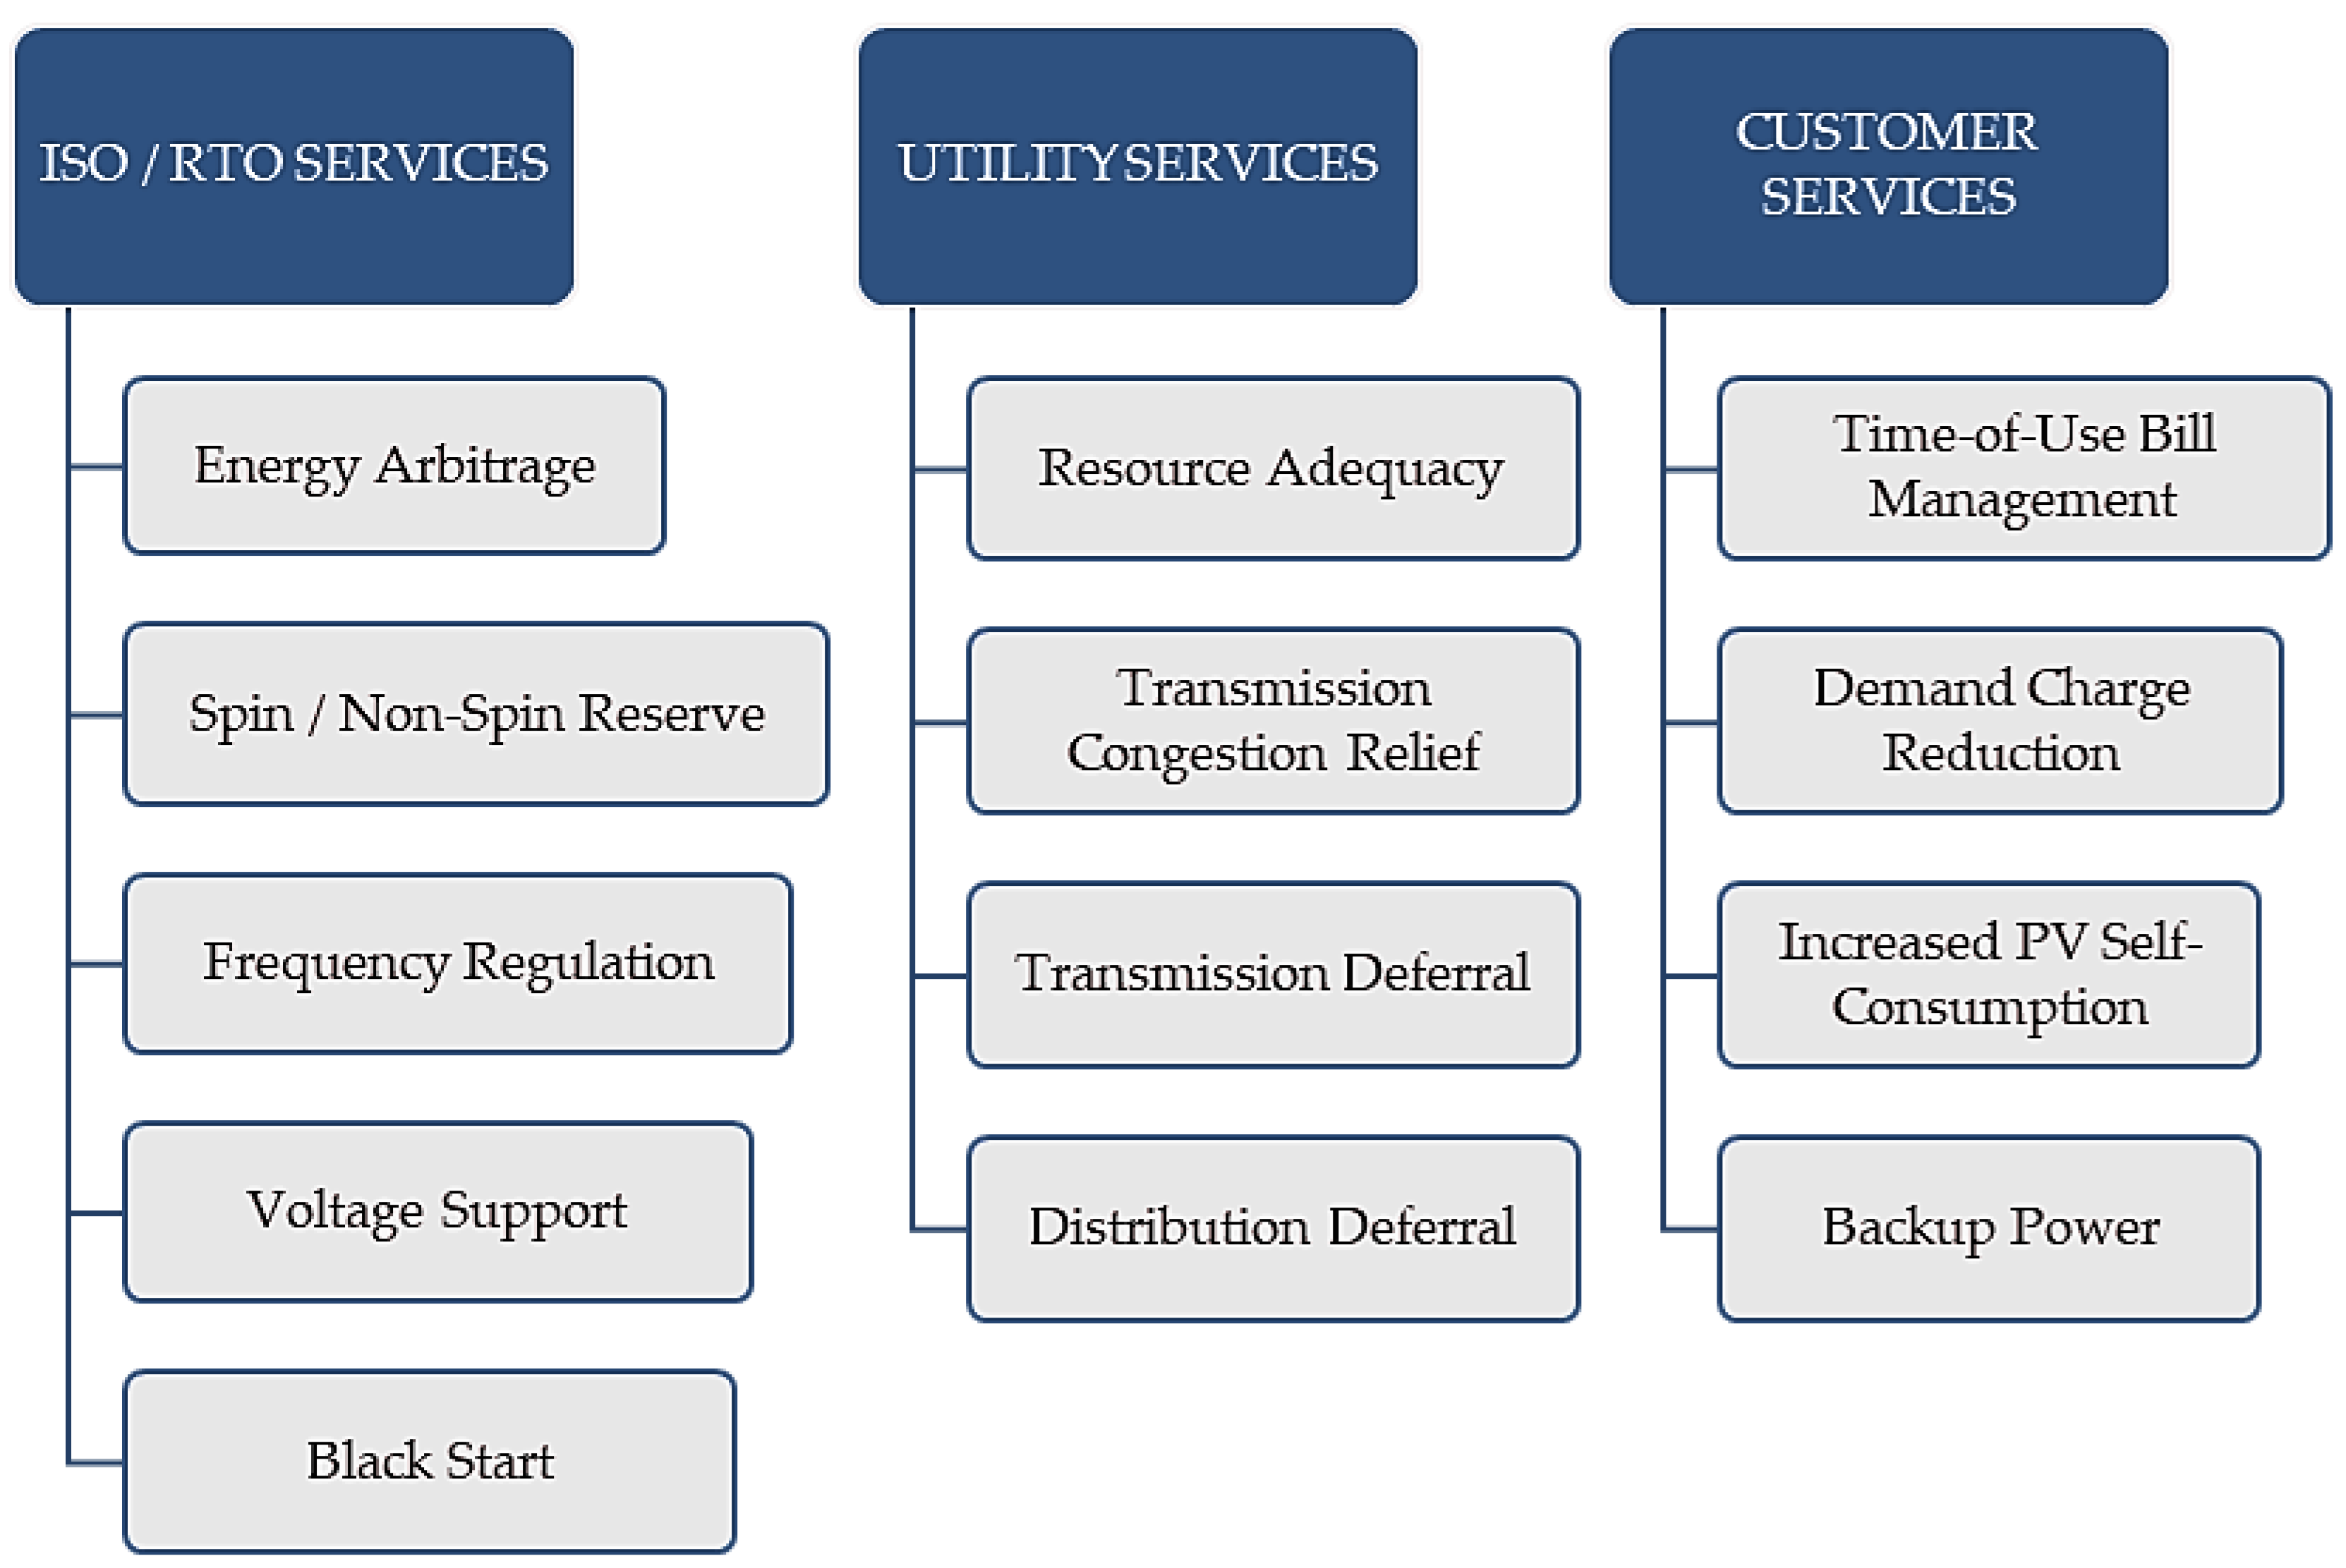
The Rocky Mountain Institute has summarized several battery energy storage services based on reports, expert interviews, and internal analysis. This work described 13 energy storage services by the stakeholder groups: independent system operators (ISOs)/regional transmission organizations (RTOs), utilities, and customers. Energy storage can be classified at three different levels: behind the meter, distribution, or transmission level (Figure 3) [76].
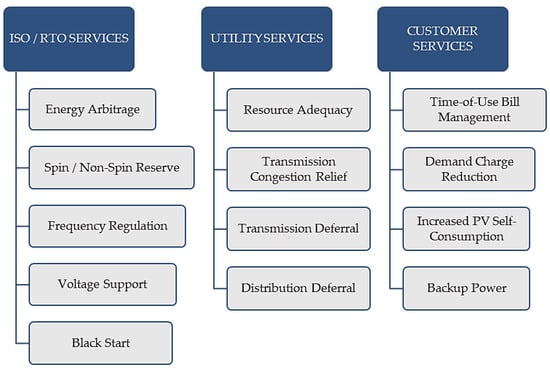
Figure 3.
Battery energy storage value chain based on [76,77].
ISO/RTO services:
- Energy Arbitrage: In this case, the wholesale electricity needs to be purchased when the locational marginal energy price is low (for example at night) and the electricity is sold back to the wholesale market when locational marginal prices are high [76].
- Frequency Regulation: This is the automatic and immediate response of power to a change in local grid frequency. The regulation is important to ensure that system-wide generation is perfectly matched with system-level load on a moment-to-moment basis to avoid system-level frequency dips or spikes, which can create grid instability [76].
- Spin/Non-Spin Reserves: In the case of an unplanned generation outage, the spinning reserve generation capacity is able to serve the load immediately. The non-spinning reserve (not instantaneously available) is a generation capacity that can respond to contingency events within a short period (<1 min) [76].
- Voltage Support: This regulation ensures continuous and reliable electricity flow across the grid. Voltage on the transmission and distribution system need to be maintained within an acceptable range to ensure that real and reactive power production are matched with the demand [76].
- Black Start: In the case of a grid outage, black start generation assets are needed to restore operation to larger power plants in order to bring the regional grid back online [76].
Utility services:
- Resource Adequacy: In this case, instead of investing in new gas combustion turbines to meet generation requirements during peak electricity consumption hours, utilities and grid operators can pay for other solutions (including energy storage) to incrementally reduce or defer the need for new generation capacity and minimize the risk of overinvestment in that area [76].
- Distribution Deferral and Transmission Deferral: Reducing, delaying, or entirely avoiding utility investments in distribution system upgrades is necessary to meet the projected load growth on specific regions of the grid [76].
- Transmission Congestion Relief: In this case, the ISOs charge utilities to use congested transmission corridors during certain times of the day. The energy storage devices can be deployed downstream of congested transmission corridors to charge/discharge the energy during congested periods and minimize congestion in the transmission system [76].
Customer services:
- Time-of-Use Bill Management: During peak electricity consumption periods when time-of-use rates are the highest, by shifting these purchases to periods of lower rates, behind-the-meter customers can use energy storage systems to reduce their bill [76].
- Increased PV Self-Consumption: This means minimizing the export of electricity generated by behind-the-meter PV systems to maximize the financial benefit of PV systems in areas with utility rate structures that are unfavorable to distributed PV [76].
- Demand Charge Reduction and Backup Power: In the case of grid failure, battery energy storage systems with local generators can provide backup power at multiple scales (industrial operations, daily backup for residential customers) [76].
1.7. Electricity Trading
Nowadays, most of the electricity is traded on power exchanges. Below, there are some examples where day-ahead contracts dominate [78]:
- Europe: Nord Pool, European Energy Exchange (EEX),
- Asia: India Energy Exchanges (IEX),
- USA: Pennsylvania New Jersey Maryland Interconnection LLC (PJM), New York Independent System Operator (NYISO) [78].
The day-ahead prices are set around noon on the day preceding the delivery. In case of changing weather conditions and unplanned events, the day-ahead markets are supplemented by balancing and intraday markets. The intraday markets are typically organized by power exchanges in the form of auctions or continuous trading. Under the control of the system operators, the final balancing of the demand and supply is achieved through the balancing markets [78].
2. Methods and Details of the Technical Assessment
2.1. Technology-Specific Energy Storage Considerations for Balancing PV Systems
Today, PHS is very effective for grid balancing, but its use is geographically limited to certain countries, and it also has a significant impact on the environment. In Europe, the largest potential of PHS is located in the Alps, and current PHS systems already play a role in balancing the intermittency of renewables at a European level. In addition, the construction of PHS facilities can take up to a decade (Table 2) [20,42,79]. From an economic point of view, compressed-air energy storage (CAES) systems are competitive with batteries; however, for their profitability, caverns need to built or unused salt caverns have to be used, which also creates geographical constraints. Flywheel systems can only be utilized in short-term grid balancing regulation, and their investment needs are still high [80,81]. Nowadays, battery storage systems are attractive because they are compact, easy, and fast to deploy, and their prices have fallen significantly in the last few years. They also provide a quick solution for controlling the weather dependence of a PV system locally [42,52].

Table 2.
New pumped hydro storage (PHS) storage projects in the EU based on [20].
2.2. The Aspects of the Analysis
Our study deals with the deviation between day-ahead and intraday PV power generation forecasts compared to the real production. The aim is to determine the balancing requirement through real data relative to the forecasts related to 1000 MWp PV system. This research also focused on Li-ion-based and VRFB energy storage systems in connection with the PV grid balancing reduction potential, because these technologies allow an effective, fast, and better integration of VRE sources into the power system, avoiding PV or wind generation curtailment in the case of exceeding generation compared to grid transport capacities [20,52,79].
2.2.1. The Circumstances of the Modeling
For the analyses, the Elia Group’s (EG) 15-min-based PV power data (measured data, day-ahead, and intraday forecasts) were used for the period of 30/09/2014–30/09/2019 [82]. The EG has been developing PV power forecasting systems since 2012 to maximize the grid integration of PV technology, primarily to the day-ahead and intraday market. The size of the monitored system was 2.9 GW in 2012 and had reached the value of 3.9 GW by September 2019 [82]. The frequency of the database measurement periods is continuous with 15-min intervals. The day-ahead PV data are a snapshot of day + 1 forecast, which is updated at 11:35 based on 11:00 meteorological forecast input information. The most recent forecast provides an opportunity to update the PV electricity production forecasts in the intraday market; this is updated four times a day, at 06:00, 11:00, 16:00, and 21:00. About a 1 to 2-h delay is to be applied for the application of those updates into the grid model and intraday grid calculations from Elia [82,83]. In this article, the analyses were converted to 1-GW PV system. The EG has been developing a wind power forecasting system also, but this research focuses only on PV technology.
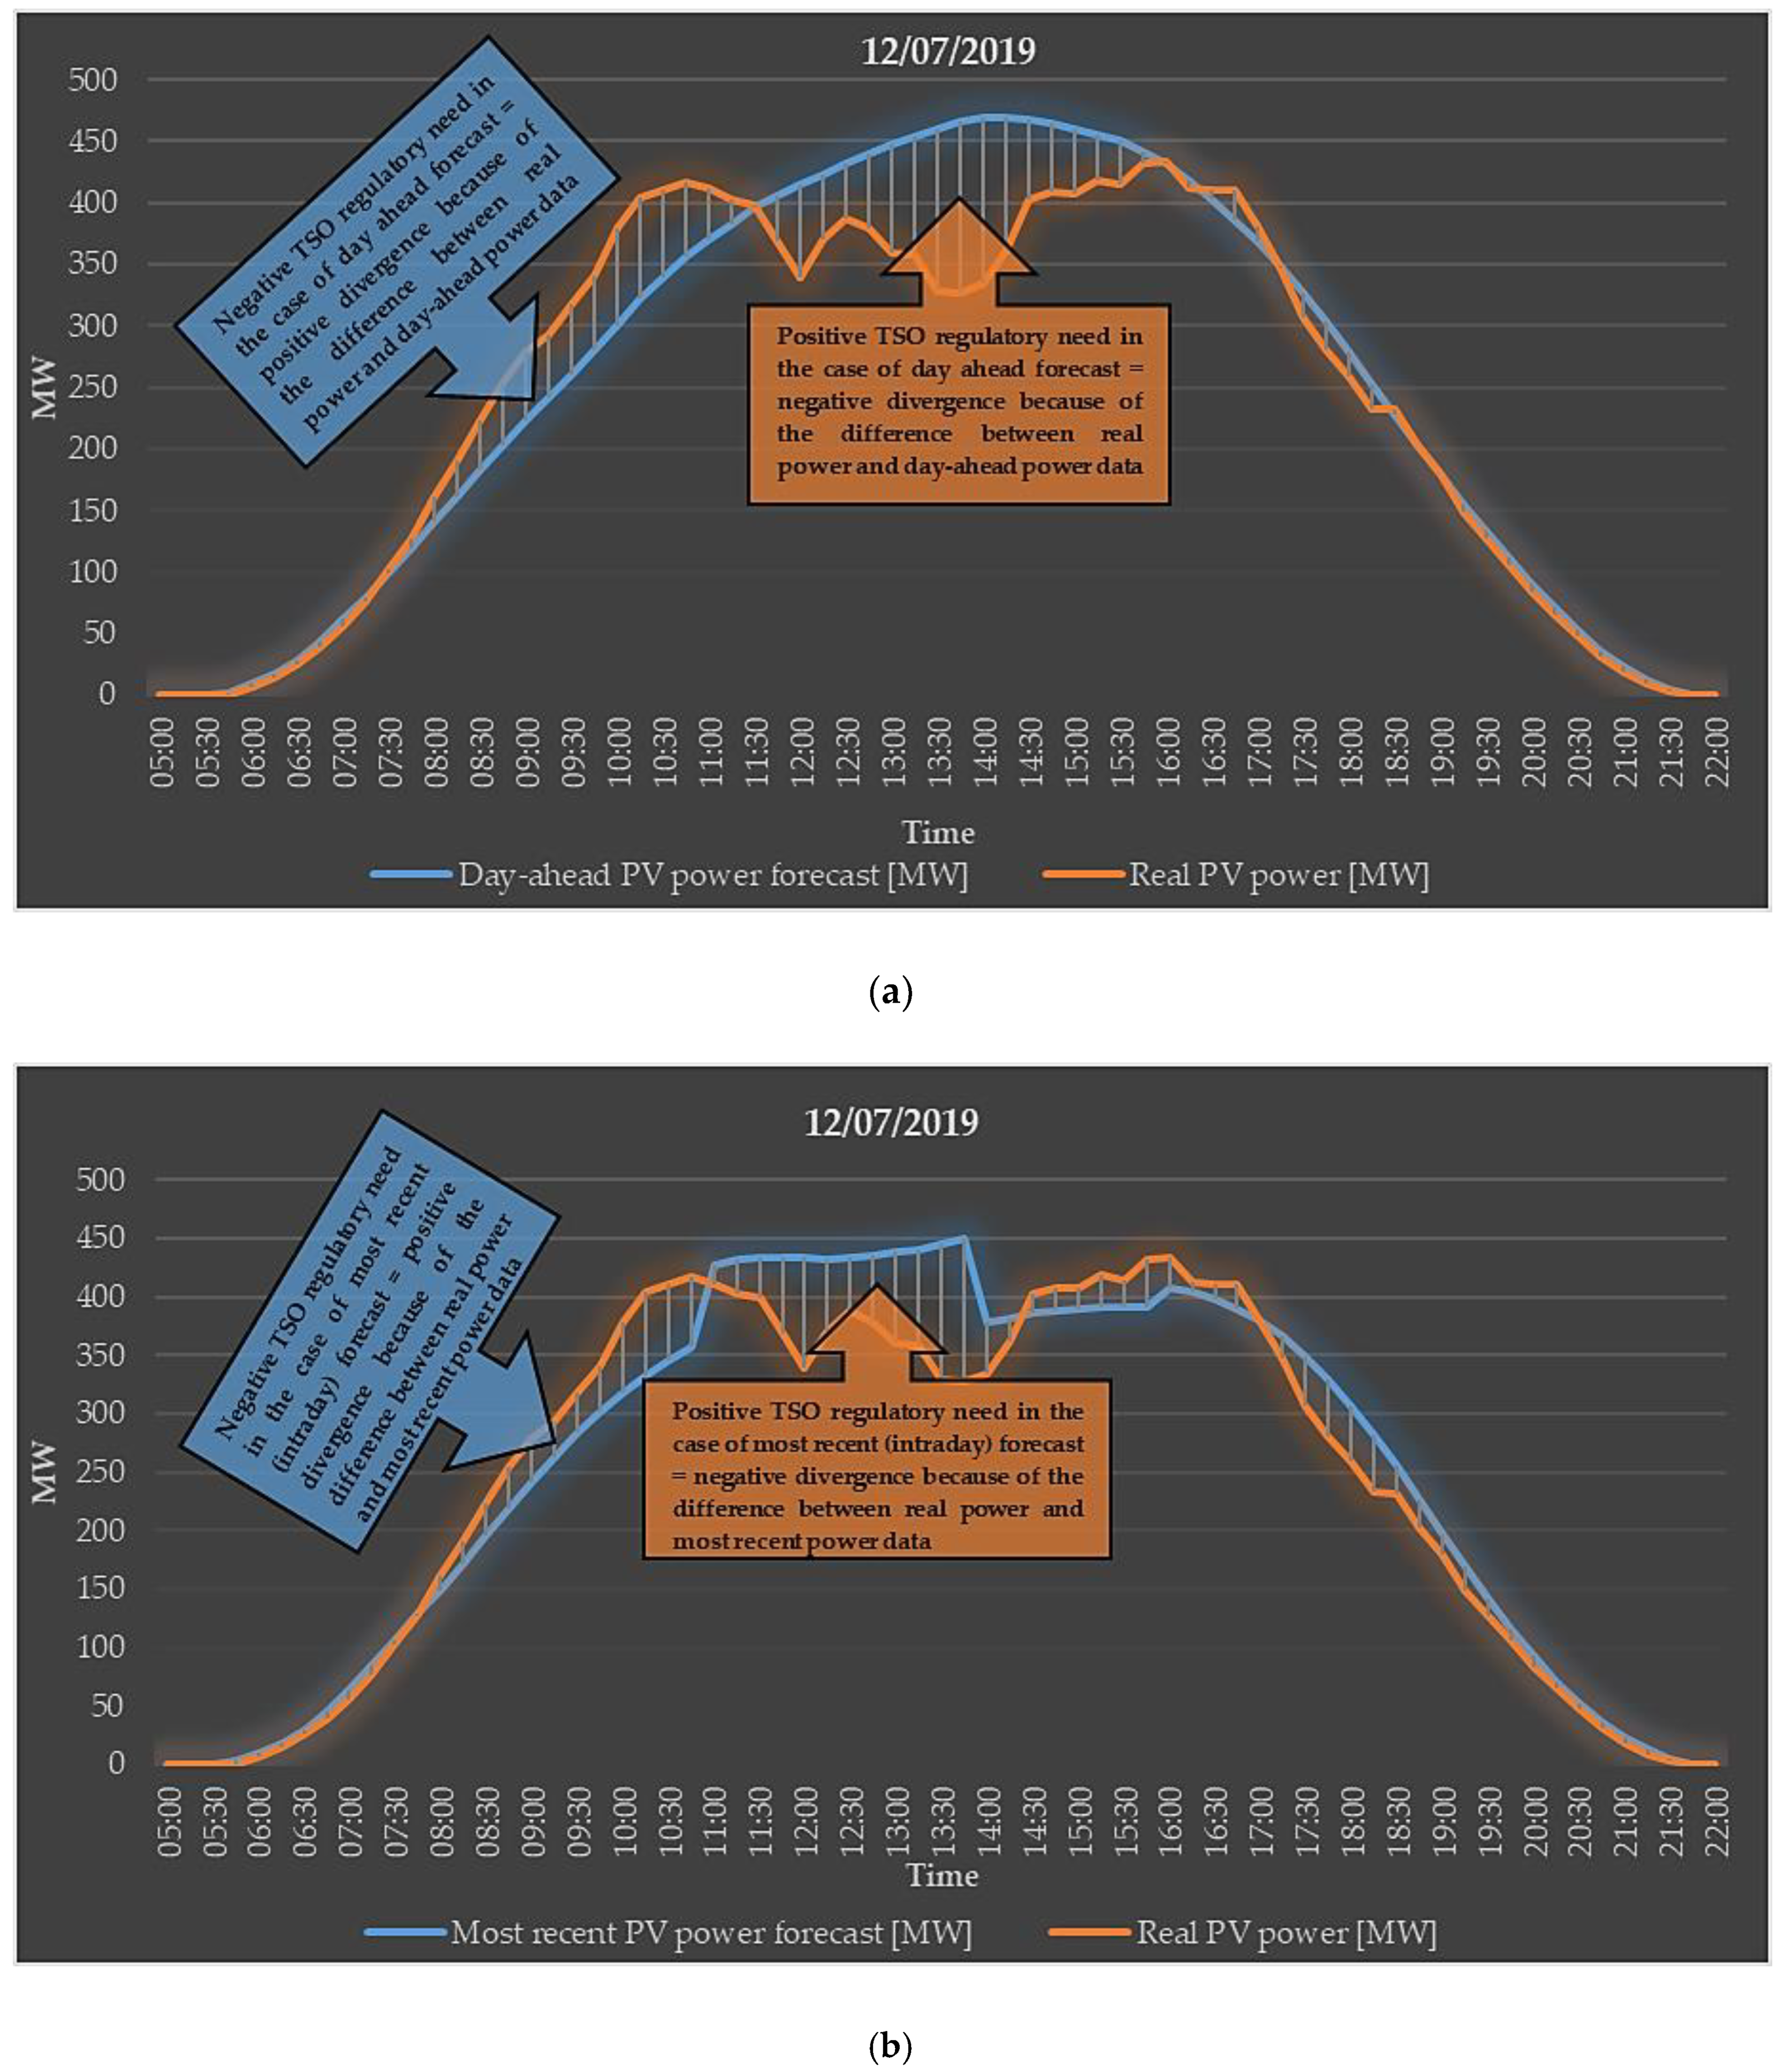
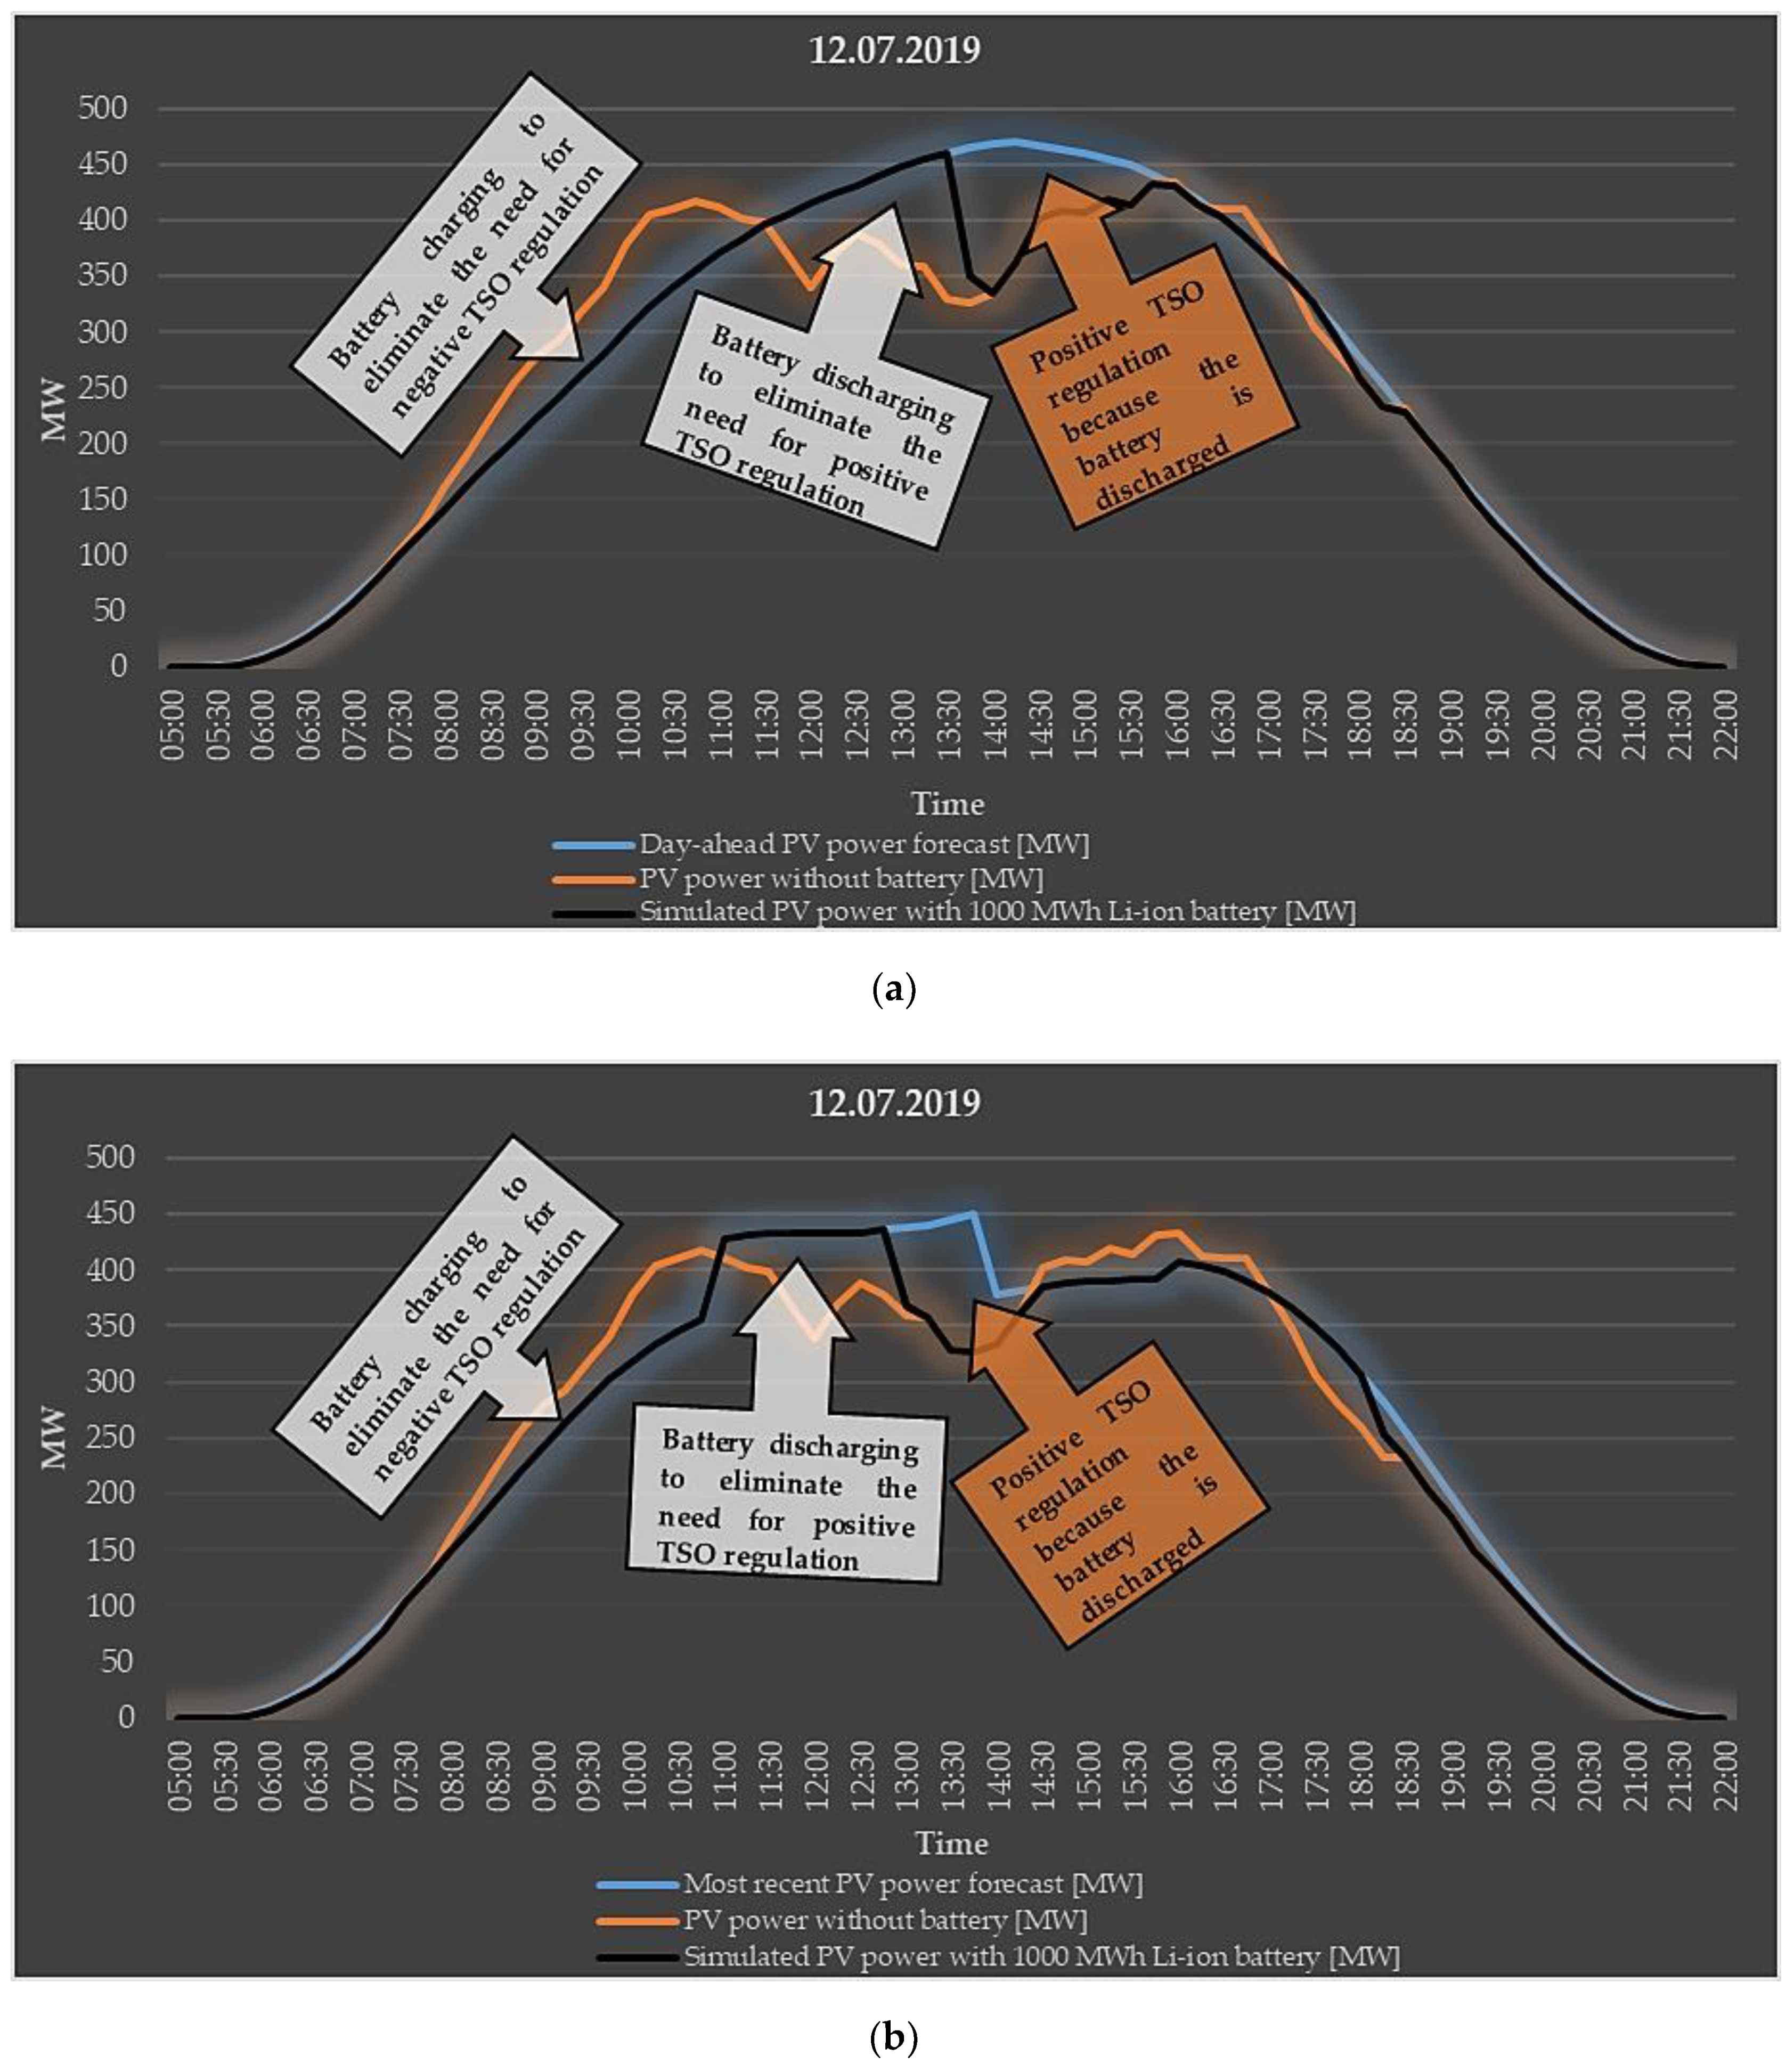
In this manuscript, a 0% divergence limit was analyzed with 15-min frequency measurement periods. This model approach fits the “Transmission Congestion Relief” [76] utility services category. For example, today in Hungary, PV system operators need to create 15-min-based PV day-ahead electricity production forecasts for every single day for the Hungarian TSO [84]. Intraday PV forecasts are optional. However, it should be noted that PV system owners need to pay a kWh-based surcharge for any intervals of 15 min if the divergence is more than ±50% between measurements and forecasts from 1 July 2018. For this reason, creating intraday PV forecasts is highly recommended, because it can reduce the rate of the surcharge [8,84,85,86]. According to the new regulatory model, the ±50% divergence limit will be 0% within a few years due to the rapid growth of PV systems [11,16,87,88]. This is because when the real energy output of the PV system in the 15-min time interval does not reach the day-ahead or intraday forecast, then officially the TSO needs to regulate in a positive direction [85]. From the perspective of the PV system operators, this means that the positive TSO regulation equals a negative divergence because of the difference between real power and day-ahead or the most recent power data, which is caused by the official calculation method. This logic (Figure 4) was illustrated by real data of 12/07/2019. This European market example shows that tightening the legal framework for PV forecasting accuracy in the day-ahead and intraday market can make investors economically interested in using energy storage systems to achieve more accurate daily energy generation by PV.
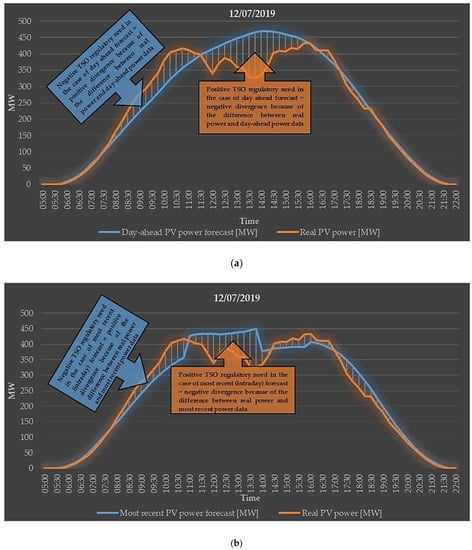
Figure 4.
Explanation of the interpretation of real, day-ahead (a) and most recent (b) PV power by a transmission system operators (TSO) and a PV system operator based on real data of a 1000-MWp PV system [82].
Today, it has become a relevant question how effectively battery storage systems can be used to maintain day-ahead and intraday PV electricity production forecasts, because the current PV-battery management technology is capable of programmed energy generation [89,90,91,92]. Table 3 shows the efficiency features associated with battery technologies.

Table 3.
Main technical–economic parameters for simulations using different battery technologies [58,60,91,92,93,94,95,96,97,98].
2.2.2. Data Processing
With the help of the EG database, the negative and positive power divergence for every 15 min and the summarized daily amount of the energy of these time periods were determined between the real and forecasted data (from the perspective of the PV system operators) for a 1000-MW PV system for the period of 30/09/2014–30/09/2019. The purpose of this was to show the magnitudes of the power divergences and their percentage distributions in the examined 5-year period. In addition, the daily sizes of the negative and positive balancing energy requirements were also determined from the above-mentioned database. This information showed the occurrences of the daily balancing energy requirement amounts and their percentage distributions in the examined period. Knowing these, for example, provides information about scaling an inverter performance and the energy storage capacity for the battery on a probability basis.
A second modeling approach has also been developed for the period of 30/09/2014–30/09/2019. With the help of Elia’s real and forecasted PV data, several energy storage capacity sizes (nominal net storage capacity) from the value of 10 to 10,000 MWh were simulated in connection with a 1000-MW PV system grid balancing reduction potential. In this case, the batteries were charged only by PV power when a positive power divergence occurred (from the perspective of the PV system operators) between the real and the day-ahead/intraday forecast within a quarter of an hour. In contrast, the batteries were discharged when a negative power divergence occurred between the real and the day-ahead/intraday PV forecast within a 15-min period. Maximum charging and discharging times of 2 h were considered. At the beginning of the 5-year simulation, the battery charge level was 100%. However, in order to understand the logic, the day 12/07/2019 was separately simulated (Section 3.2), and the battery charge level started from 0% in this case. The results were determined on the basis of the average of the 5-year examined period of TSO regulations and battery usages. Therefore, the energy storage capacity change (physical amortization) after charge/discharge in the case of Li-ion technology was not considered. The power consumption of the air conditioner was provided by the network to reach the optimal temperature range of the batteries. The goal was always to try to keep the day-ahead or most recent (intraday) PV forecast. In the case of a discharged or fully charged battery, the balancing energy was provided by the grid.
3. Results
3.1. Features of the Negative and Positive Power-Energy Divergence
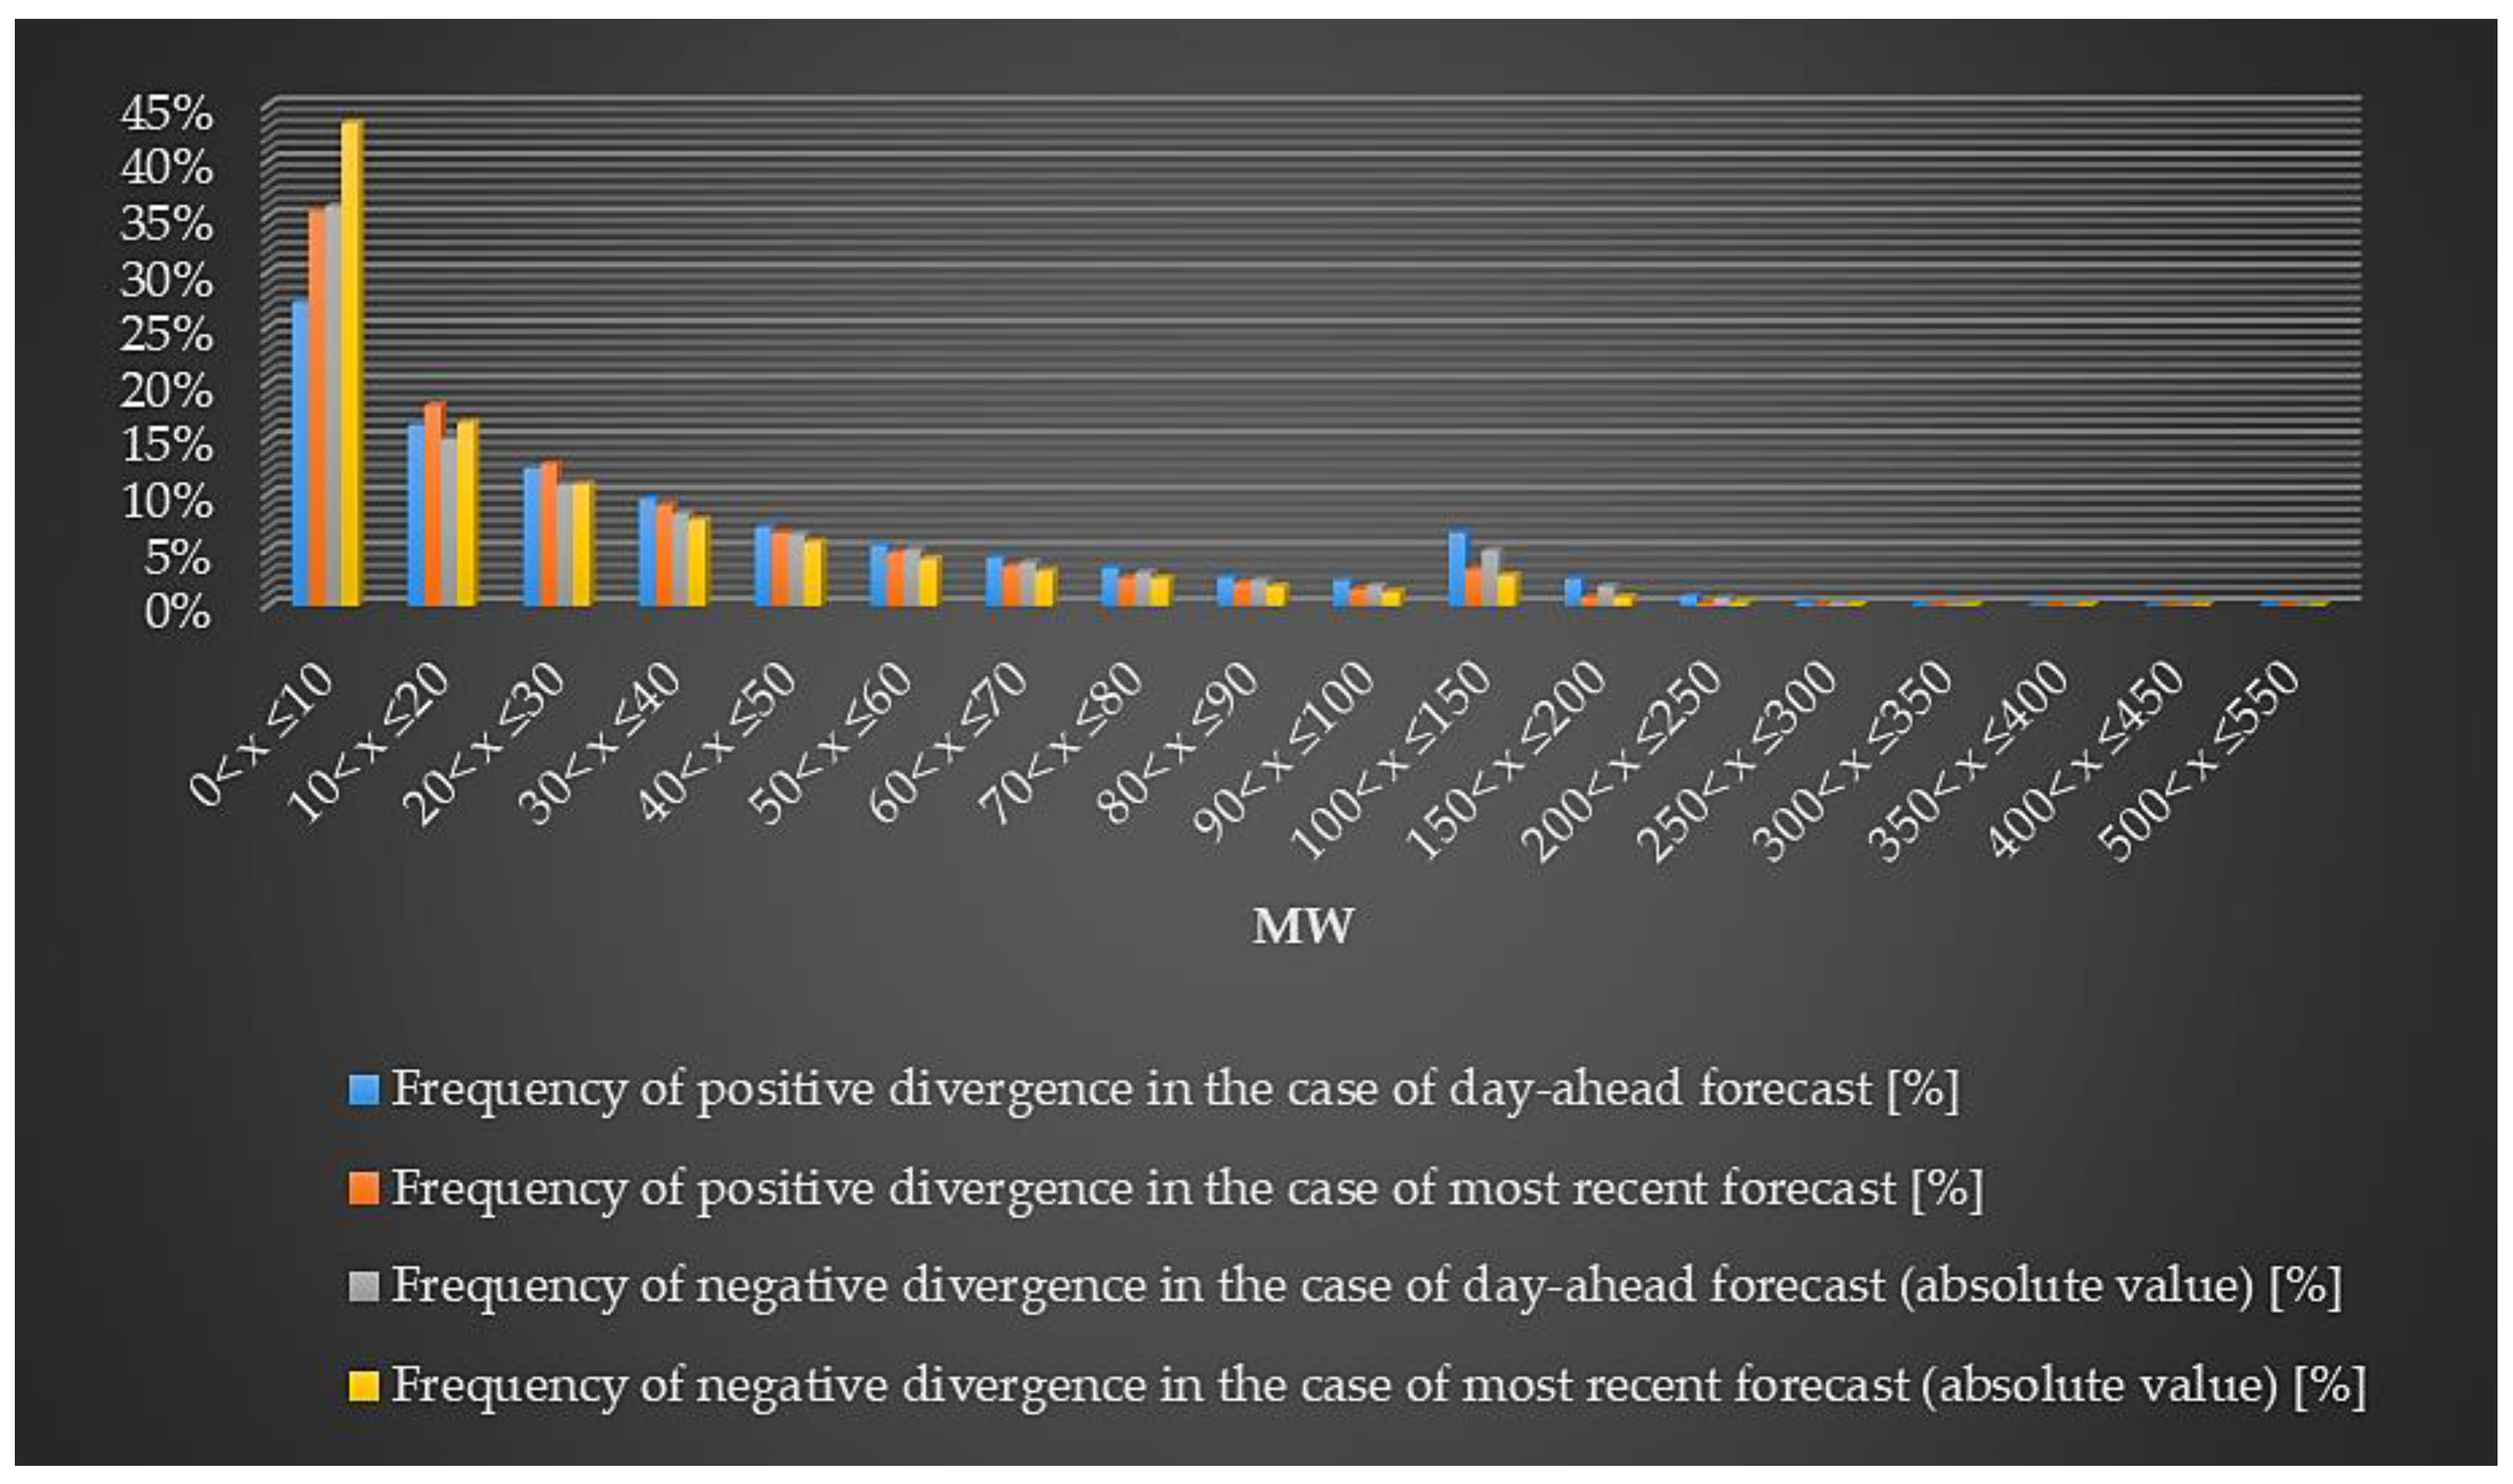
Based on 5 years of data of the EG database, the magnitudes of divergences between the real PV power data and those of the day-ahead and most recent PV power forecasts and their percentage distribution were summarized in the range of 0 MW < x ≤ 550 MW (Table 4, Figure 5). The negative results were given in absolute values. According to the data, it can be concluded that the most recent forecast reduced the MW size of regulation compared to the day-ahead data. For example, a maximum deviation of 50 MW occurred in 72%–76% of the day-ahead cases, whereas this figure increased to 82%–84% in the most recent forecasts. However, it should be noted that the negative power divergence can be up to about 50% of the nominal PV power. In 0.002% of the day-ahead forecast cases, 400 MW < x ≤ 550 MW negative divergence occurred, which increased to 0.004% in the cases of the most recent ones.

Table 4.
Magnitudes of the day-ahead/intraday PV power forecast divergence (15 min-based) compared to the real PV power data for the period of 30/09/2014–30/09/2019.
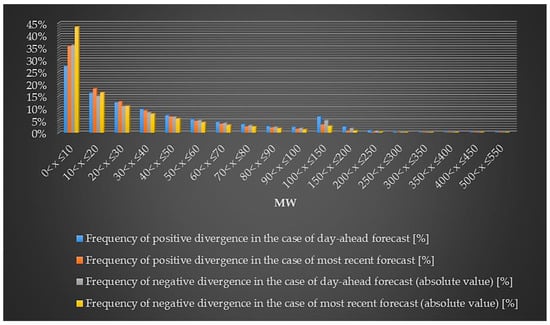
Figure 5.
The magnitude of the day-ahead PV power forecast divergence (15 min-based) compared to the real PV power data for the period of 30/09/2014–30/09/2019.
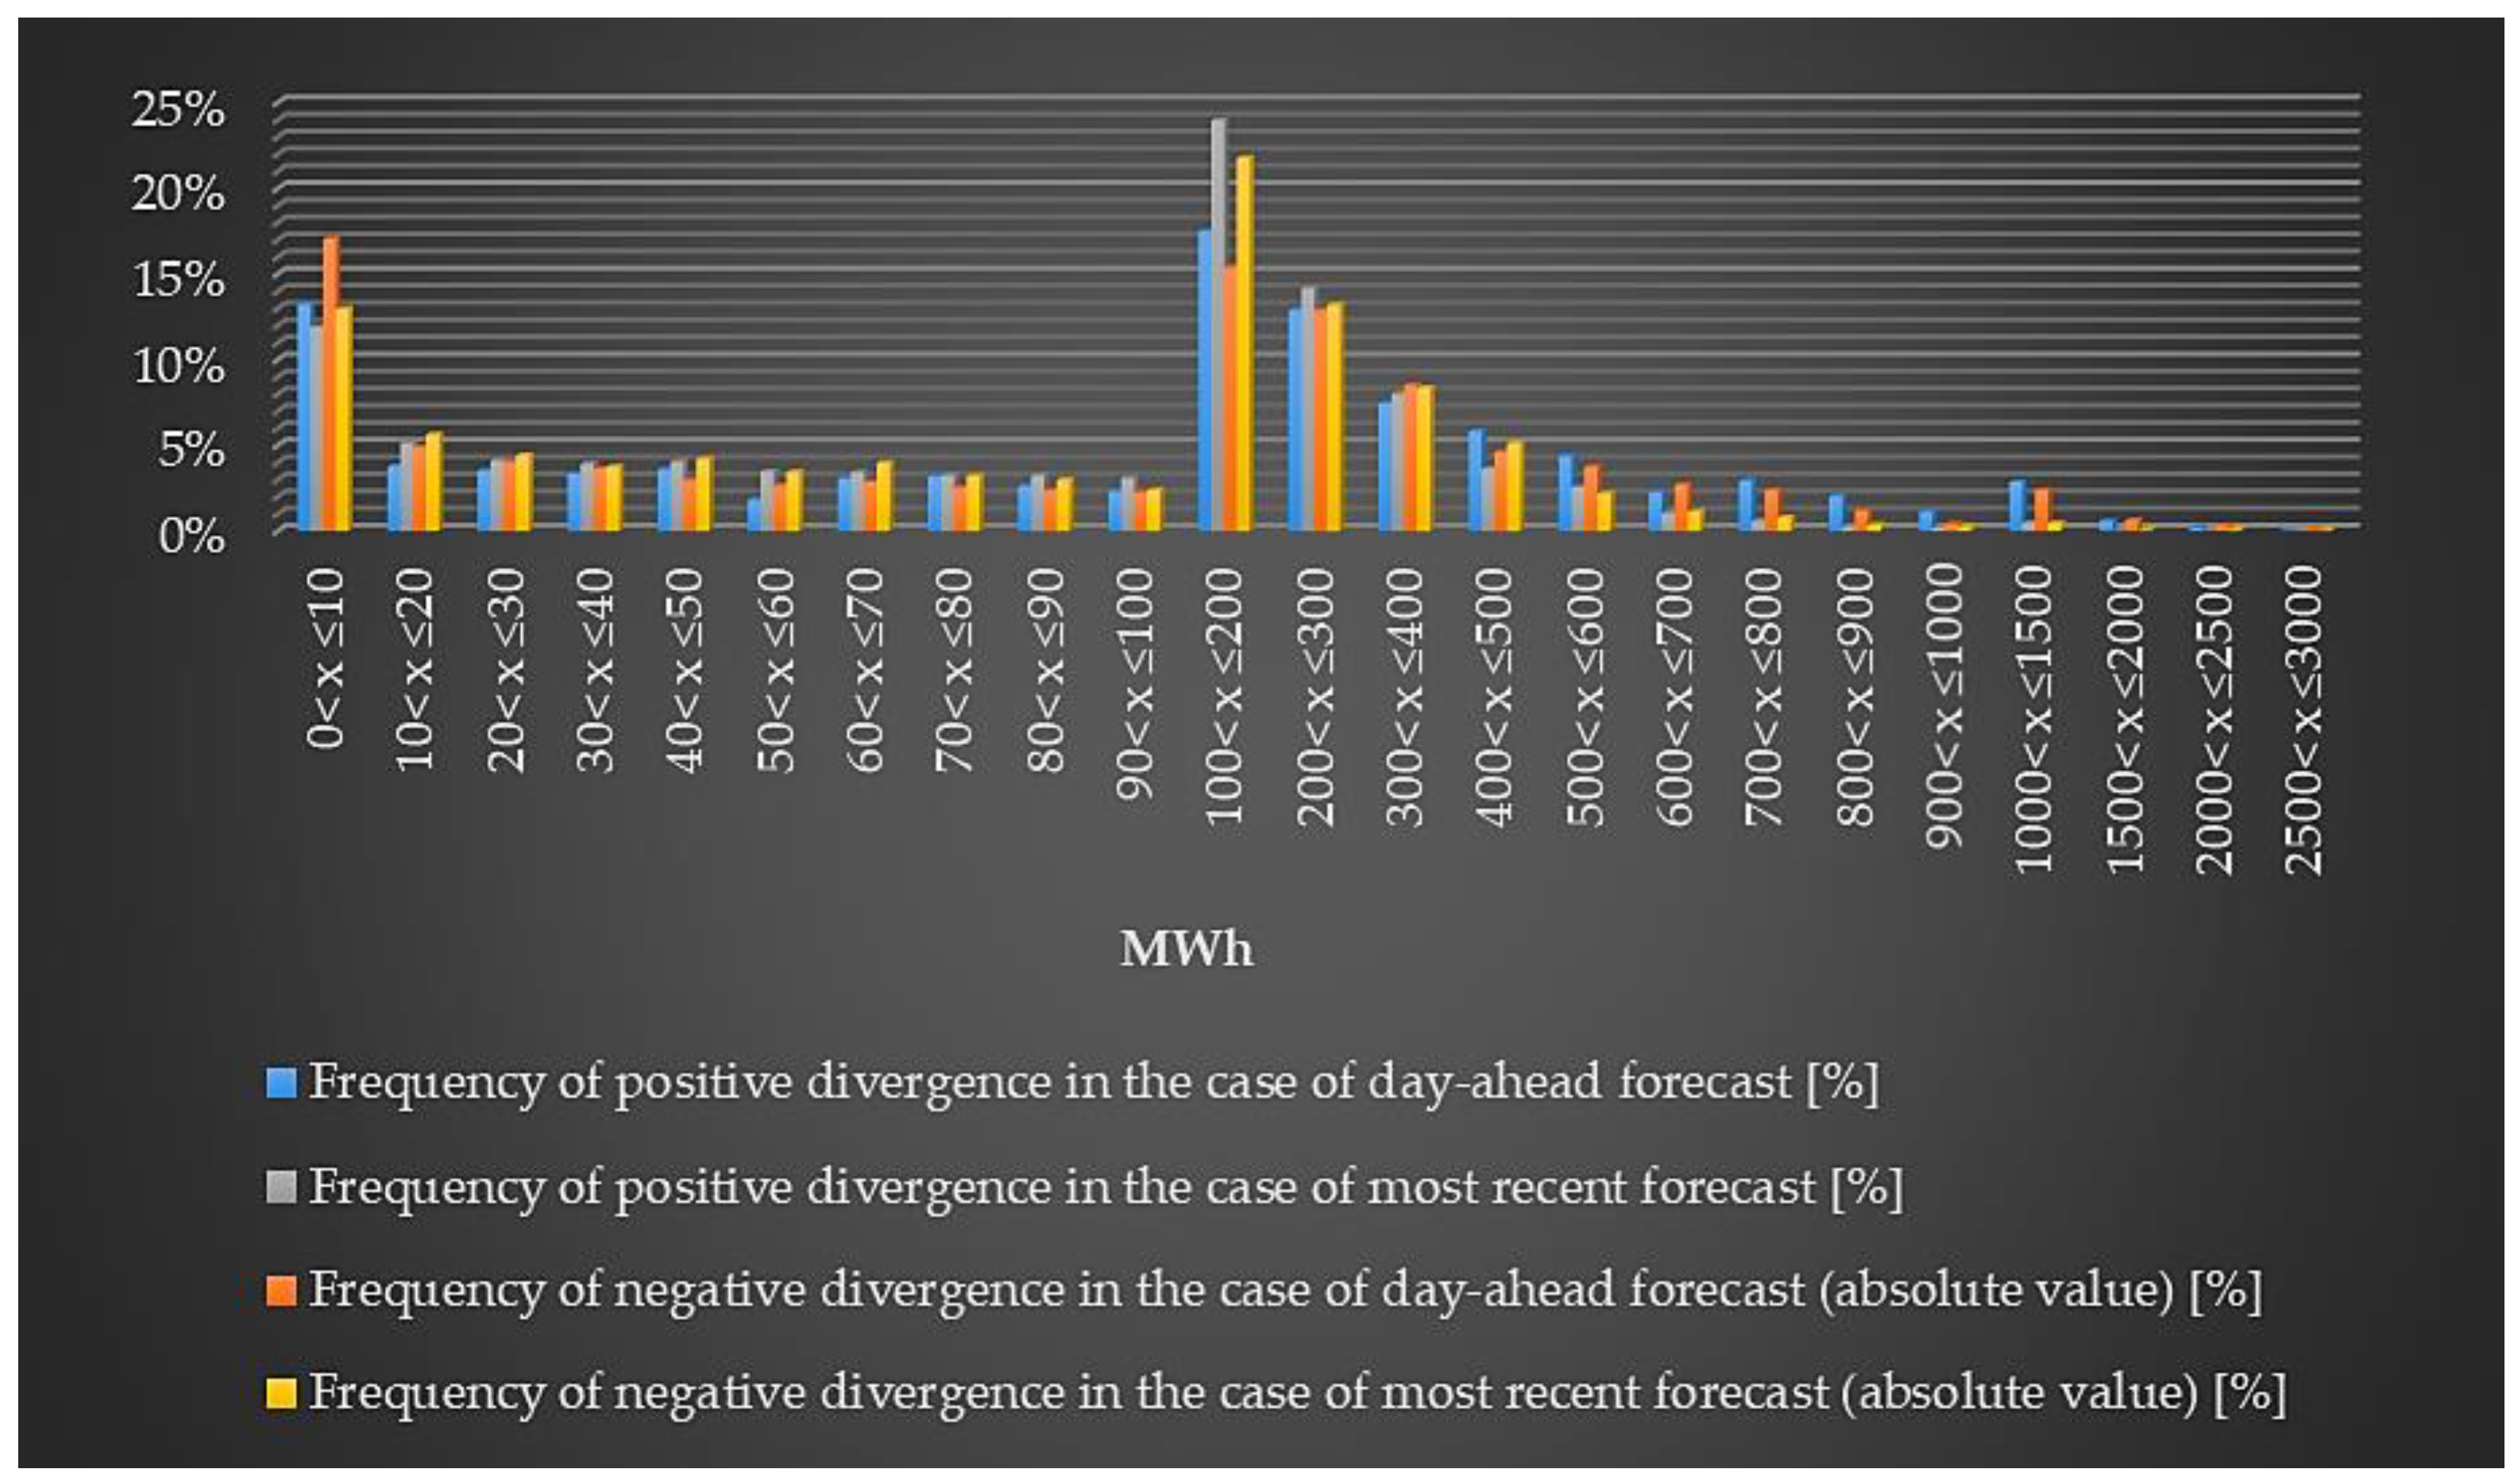
In addition, the results showed that the most recent forecast reduced the MWh regulation size of the daily positive divergence above 10 MWh compared to the day-ahead data. In the negative case, this effect occurred only above 60 MWh. In the case of the 100 < x ≤ 200 MWh range, the best forecast resulted in a 6.4%–6.5% improvement in regulation compared to the day-ahead one. The examination of the negative divergence showed that there were rare cases (0.05%) where 2500 MWh < x ≤ 3000 MWh deviations had to be regulated daily. The most common categories for regulation were the 0 MWh < x ≤ 10 MWh and the 100 MWh < x ≤ 500 MWh, because they accounted for 62% of the positive and 61% of the negative divergences, respectively (Table 5, Figure 6).

Table 5.
The magnitude of the day-ahead/intraday PV energy forecast divergence (24 h based) compared to the real PV energy data for the period of 30/09/2014–30/09/2019.
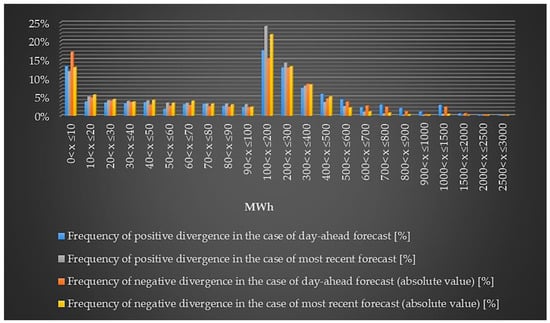
Figure 6.
The magnitude of the day-ahead PV energy forecast divergence (24 h-based) compared to the real PV power data for the period of 30/09/2014–30/09/2019.
Overall, the method showed that the accuracy of PV power and energy forecasting improved with the use of the most recent (intraday) forecast method. The best forecast reduced the MW size of regulation compared to the day-ahead data. However, in this way, it is not possible to determine the positive and negative divergence reduction value of a given storage size. That can only be determined by a 15-min based charge/discharge simulation.
3.2. Simulation Results of the Positive and Negative Divergence Reduction Potential of a Given Storage Size
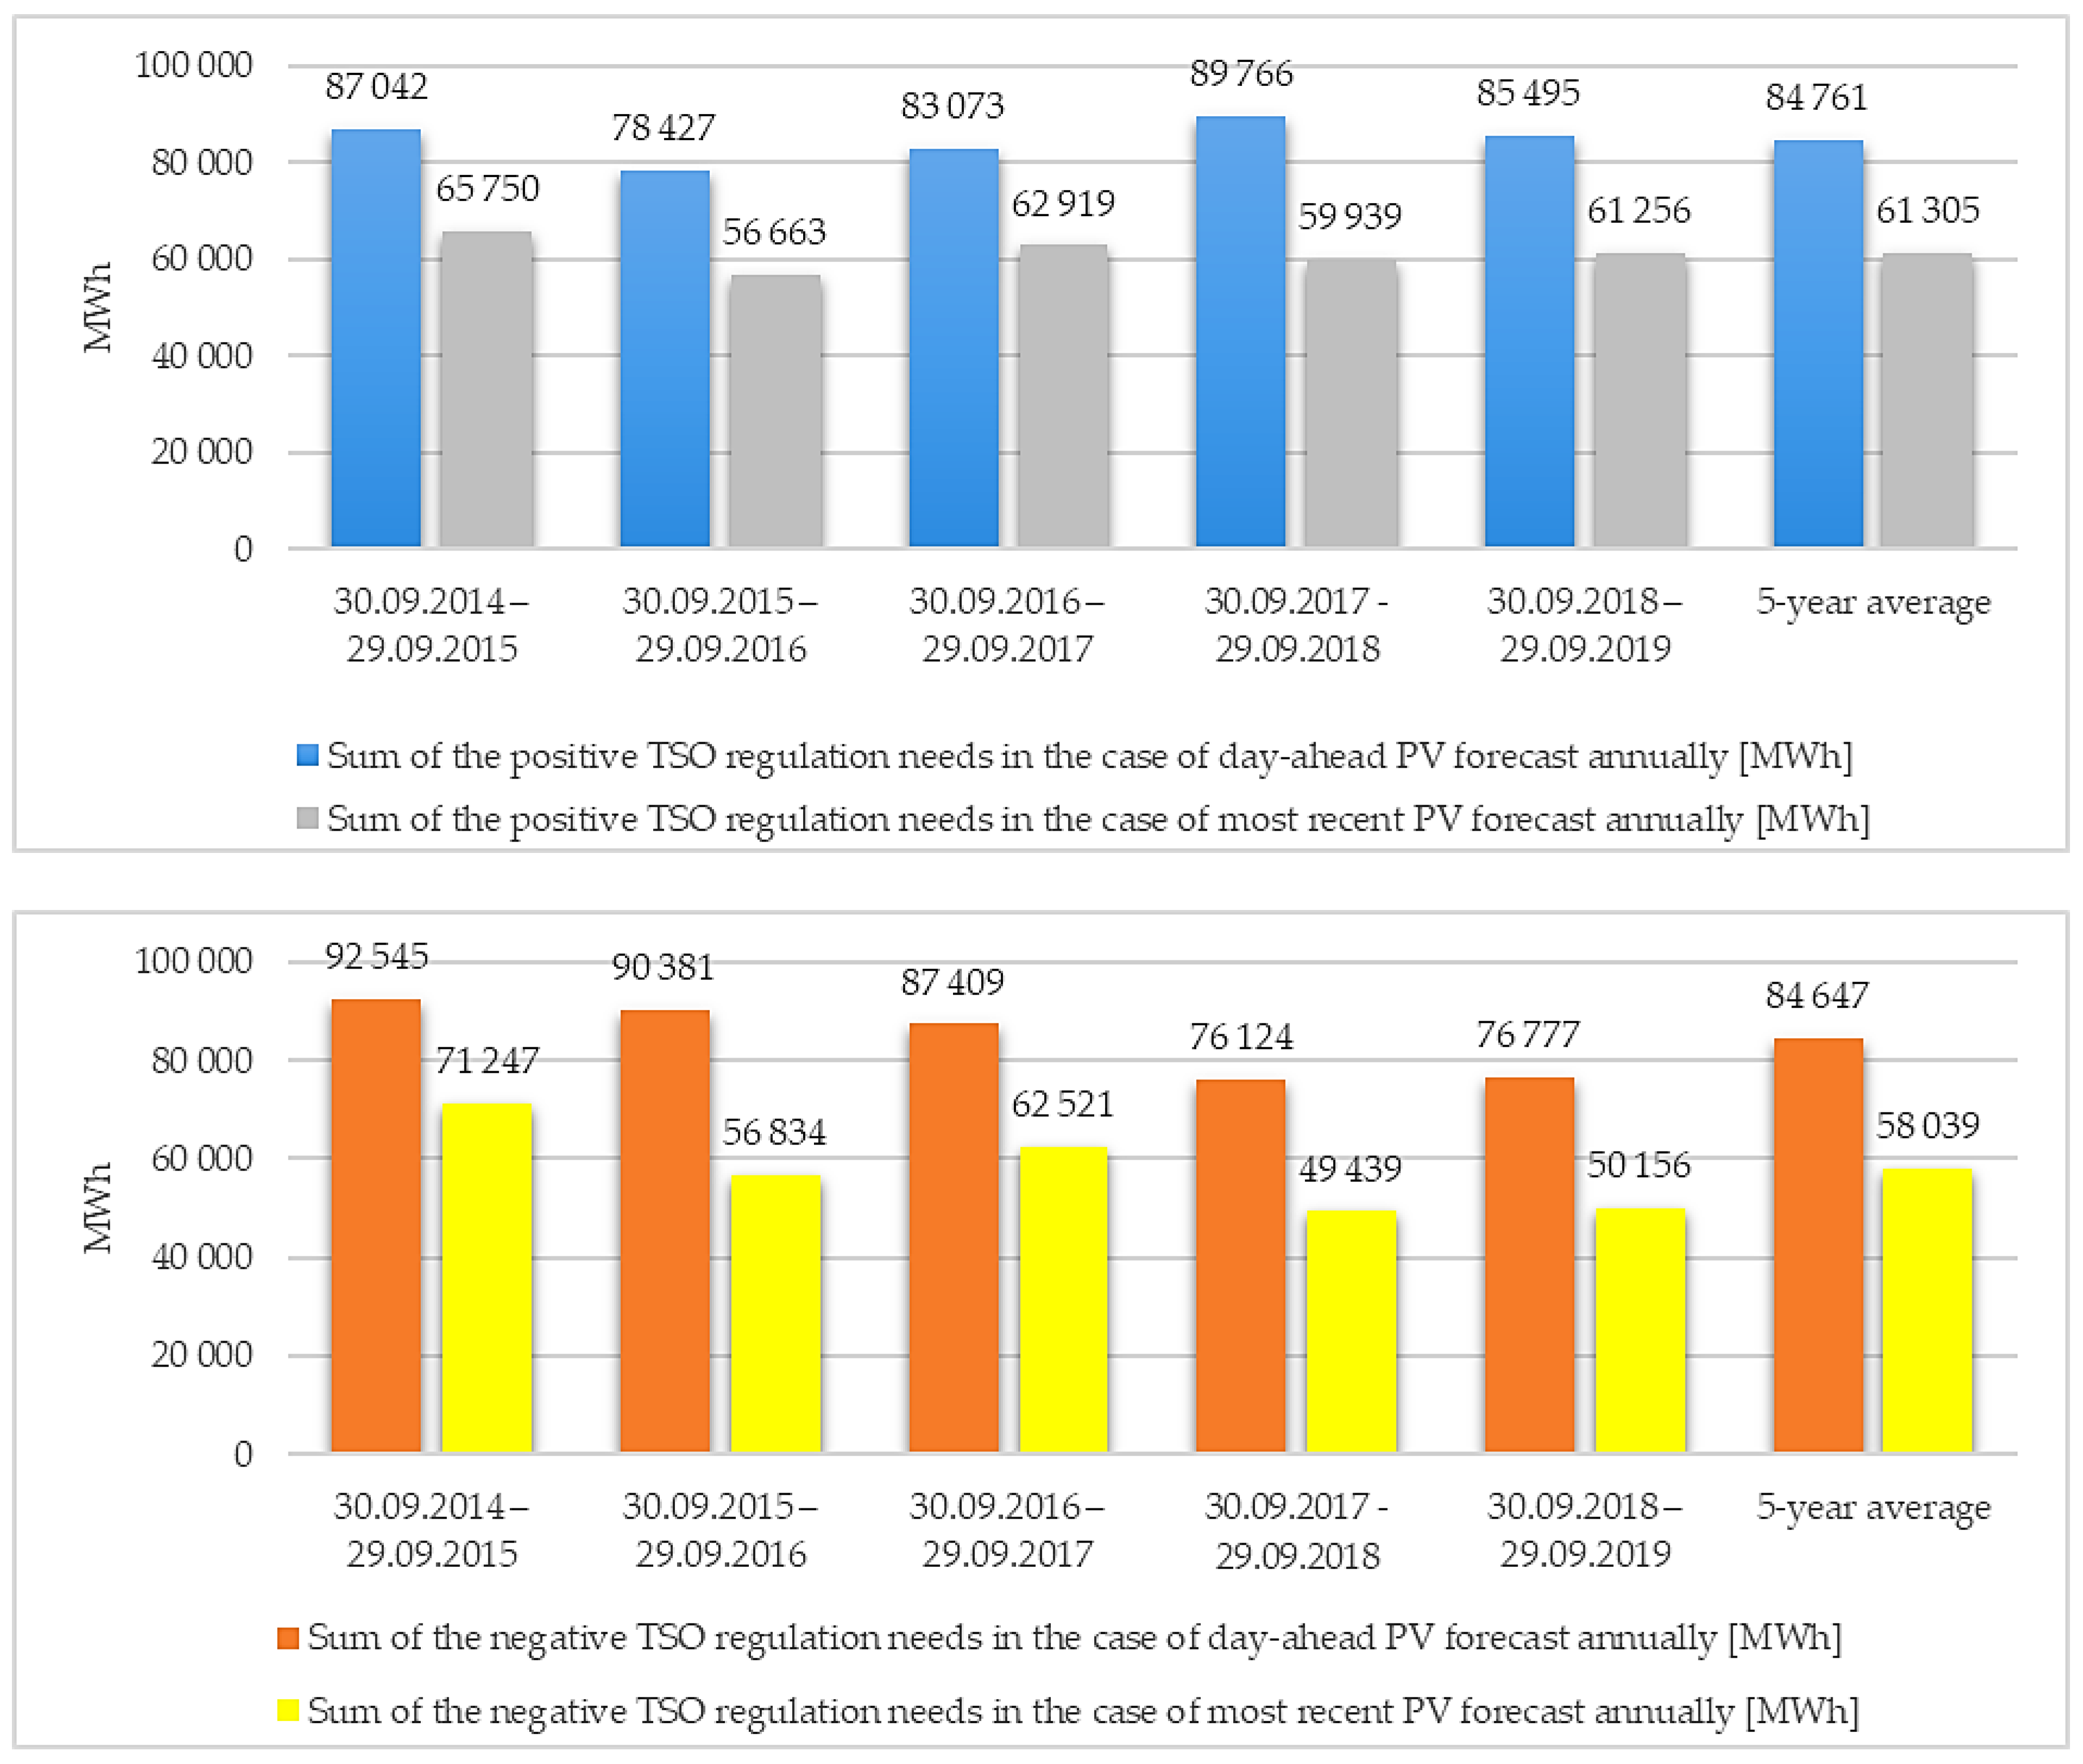
At the beginning of the research, the annual positive and negative TSO regulation need for a 1000 MWp PV system was summarized based on 15-min data during one year (Figure 7). The purpose of this was to determine the magnitude of the MWh differences between the years. The positive day-ahead regulation need varied between 78 and 89 GWh in the examined 5-year period. These values decreased by 20–30 GWh thanks to the most recent forecast method, and the average improvement reached 28%. In the case of the negative day-ahead data, the regulation need was between 76 and 92 GWh, and the best forecast reduced these values by 21–34 GWh. In this case, the average improvement was 31% (Figure 7).
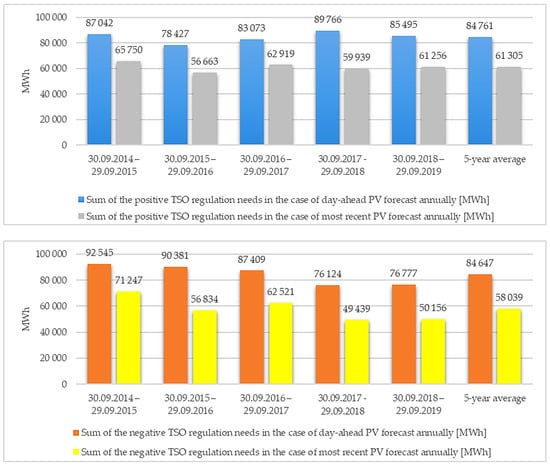
Figure 7.
The summarized results of the positive and negative TSO regulation needs based on the day-ahead and most recent PV energy forecasts in the case of a 1000 MWp PV system for the period of 30/09/2014–30/09/2019.
To understand the results of the simulations, the day of 12/07/2019 was separately simulated and the battery charge level started from 0% in this case (Figure 8). In the example, the black line represents the simulated PV power with a 1000 MWh Li-ion battery, and the goal was to try to keep the day-ahead or the most recent (intraday) PV forecast. In the case of a positive divergence (from the perspective of the PV system operators), because of the difference between the PV power without battery and the forecasted power data, the energy storage had been charged with this difference. Battery discharging happened to eliminate the need for positive TSO regulation. In the case of a discharged (or fully charged) battery, the balancing energy was provided by the grid (Figure 8).
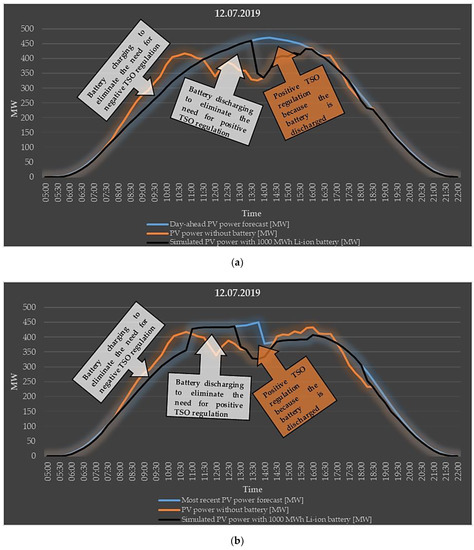
Figure 8.
Illustration of the PV plus battery power simulation results by real 1000 MWp PV input data on 12/07/2019, (a) day-ahead, (b) intraday.
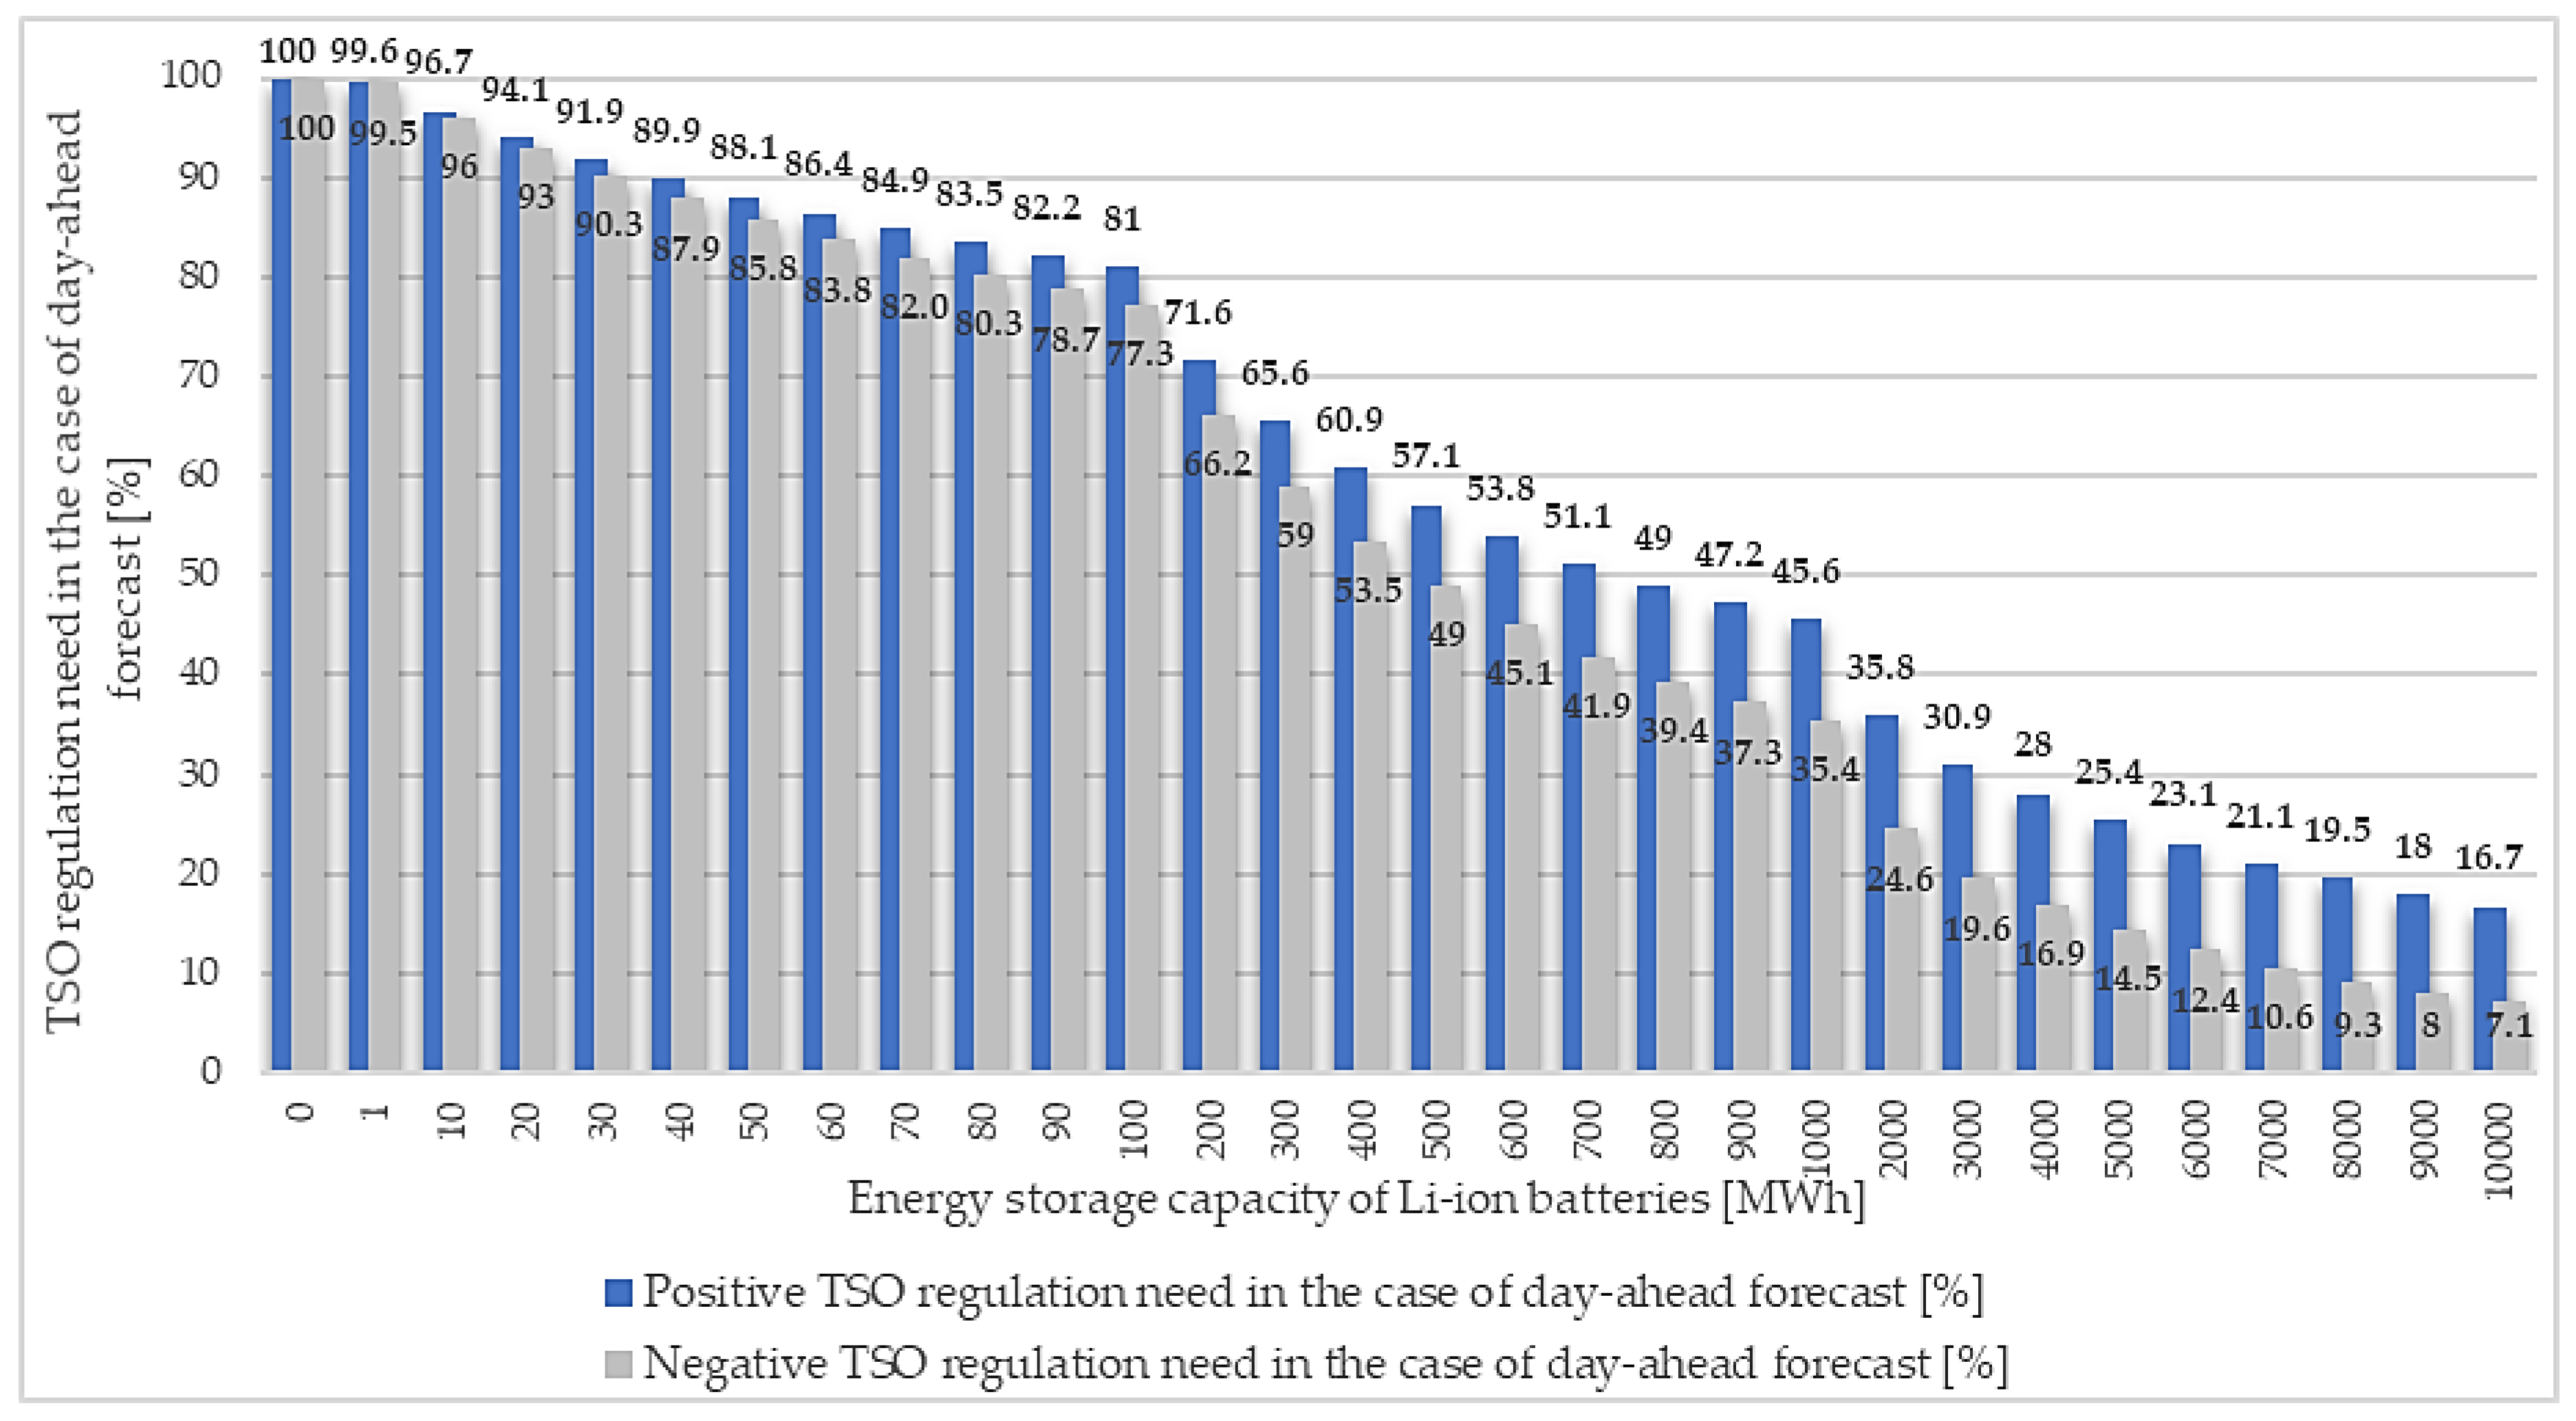
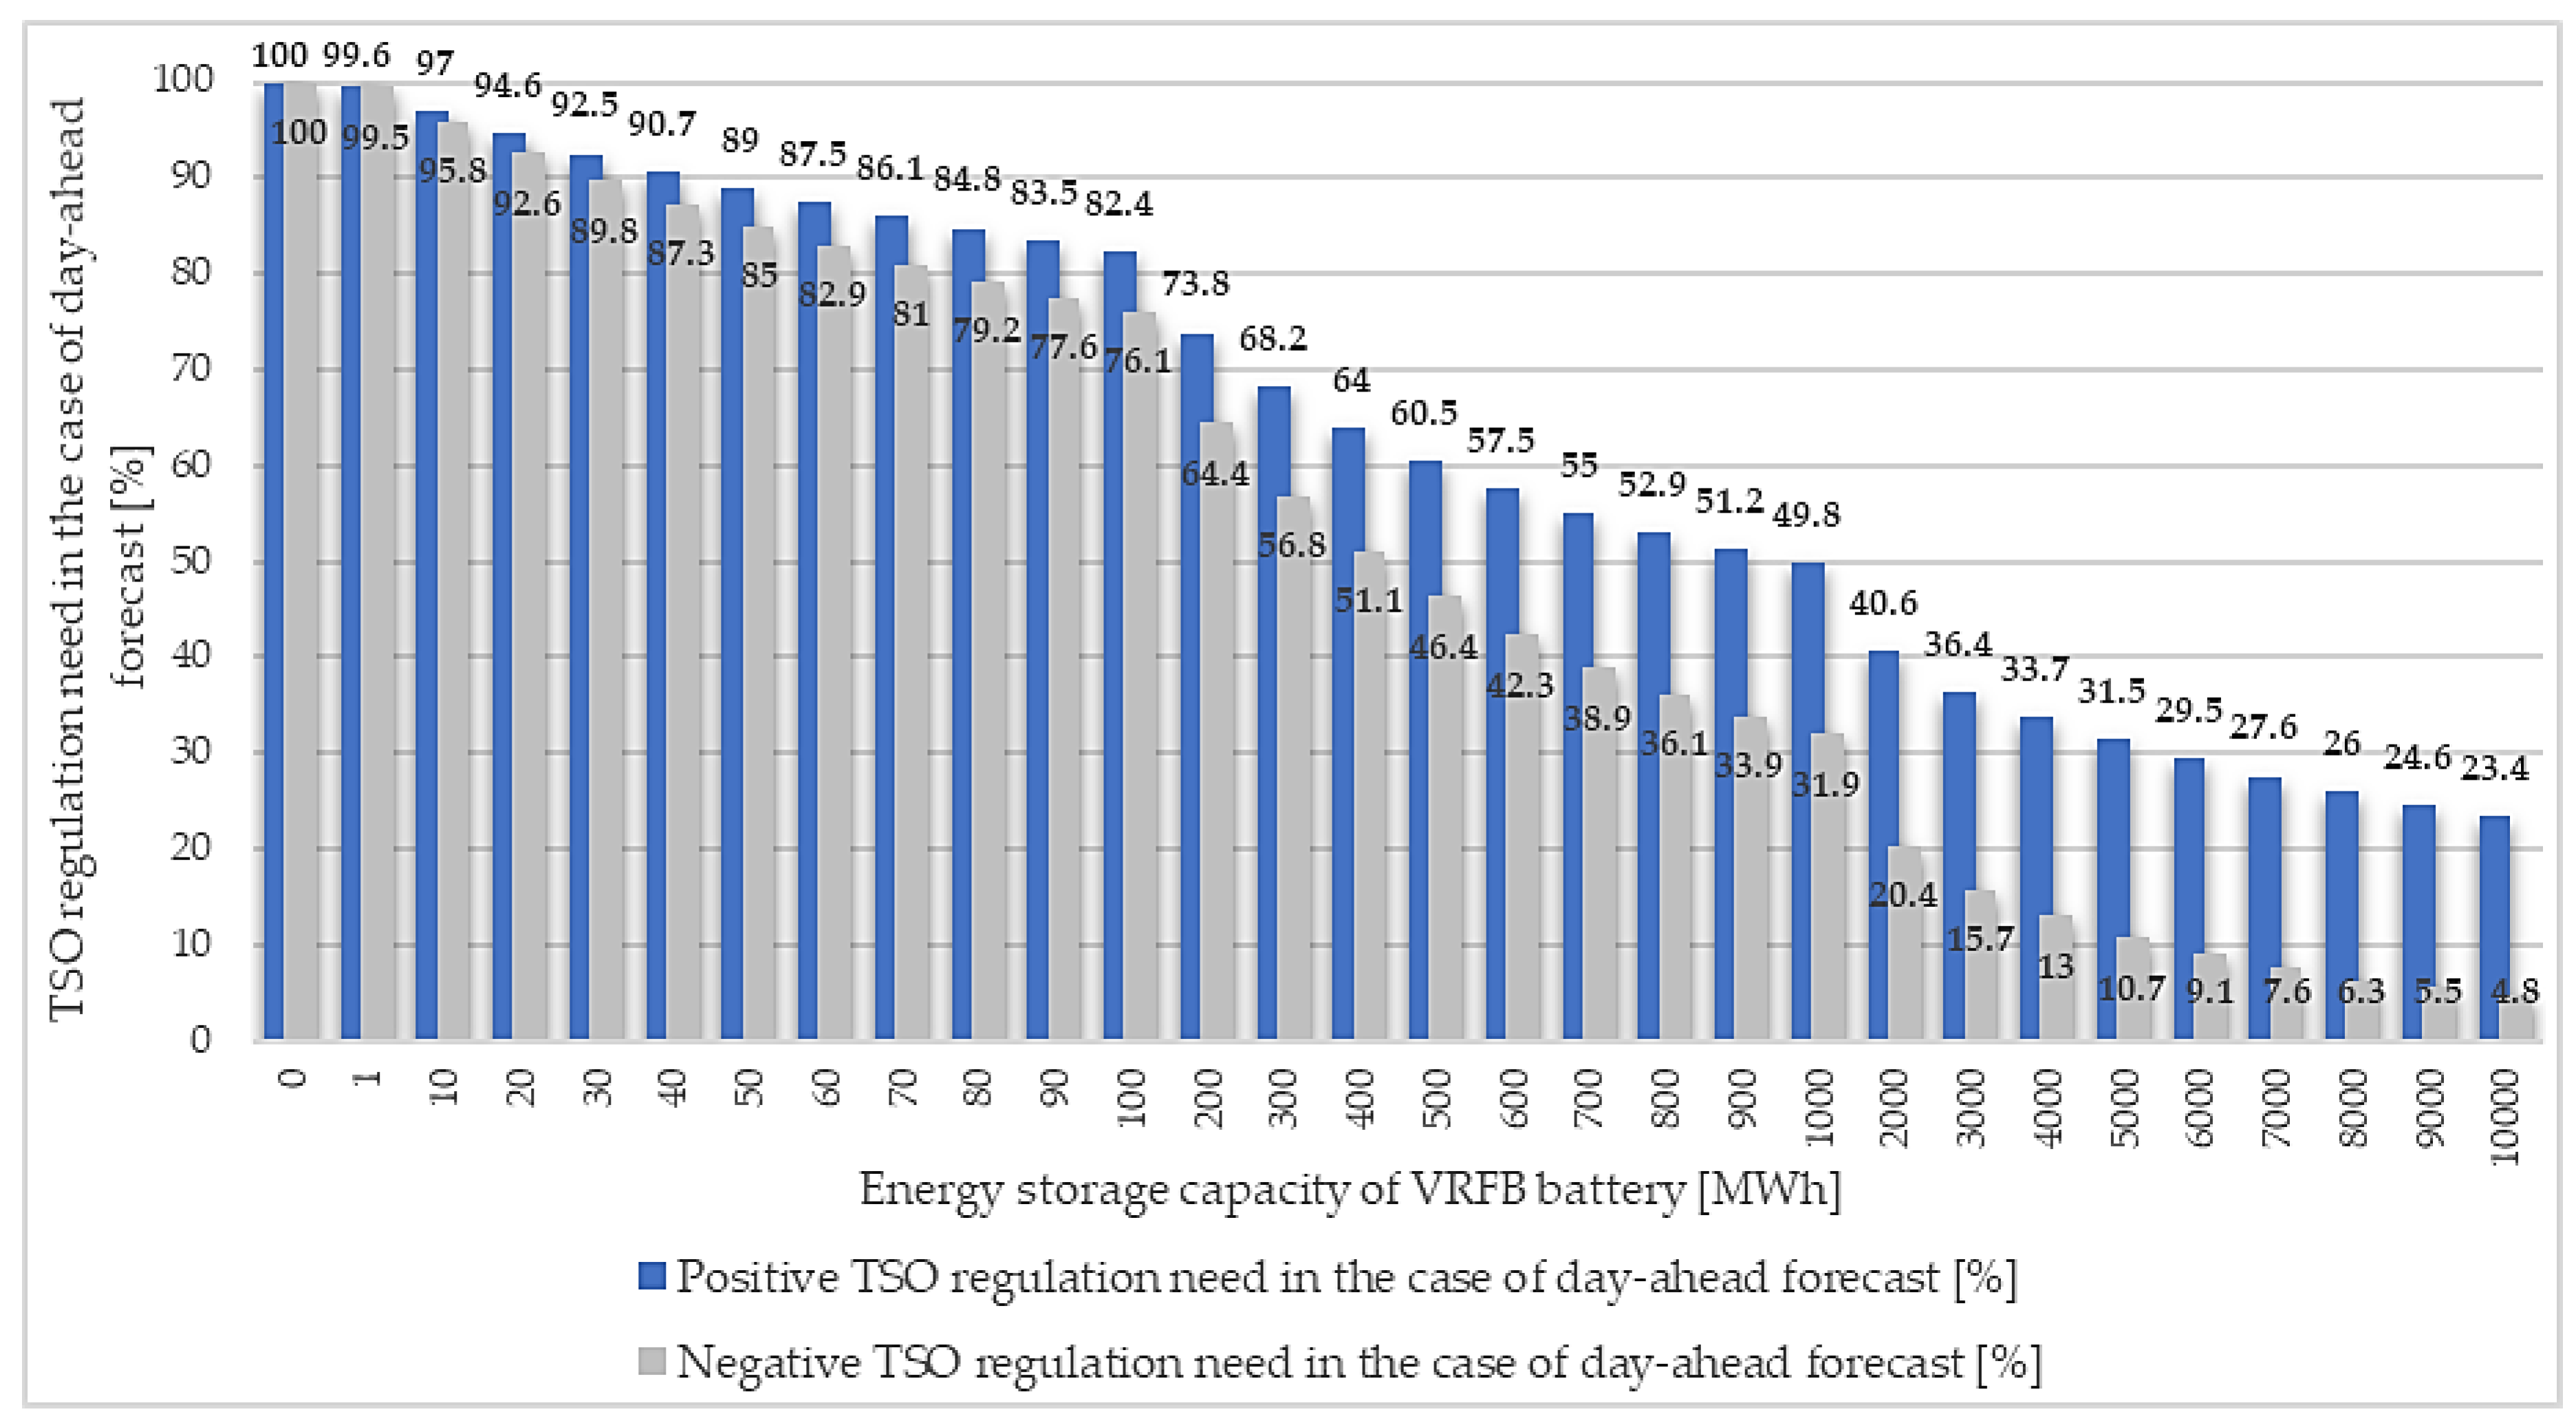
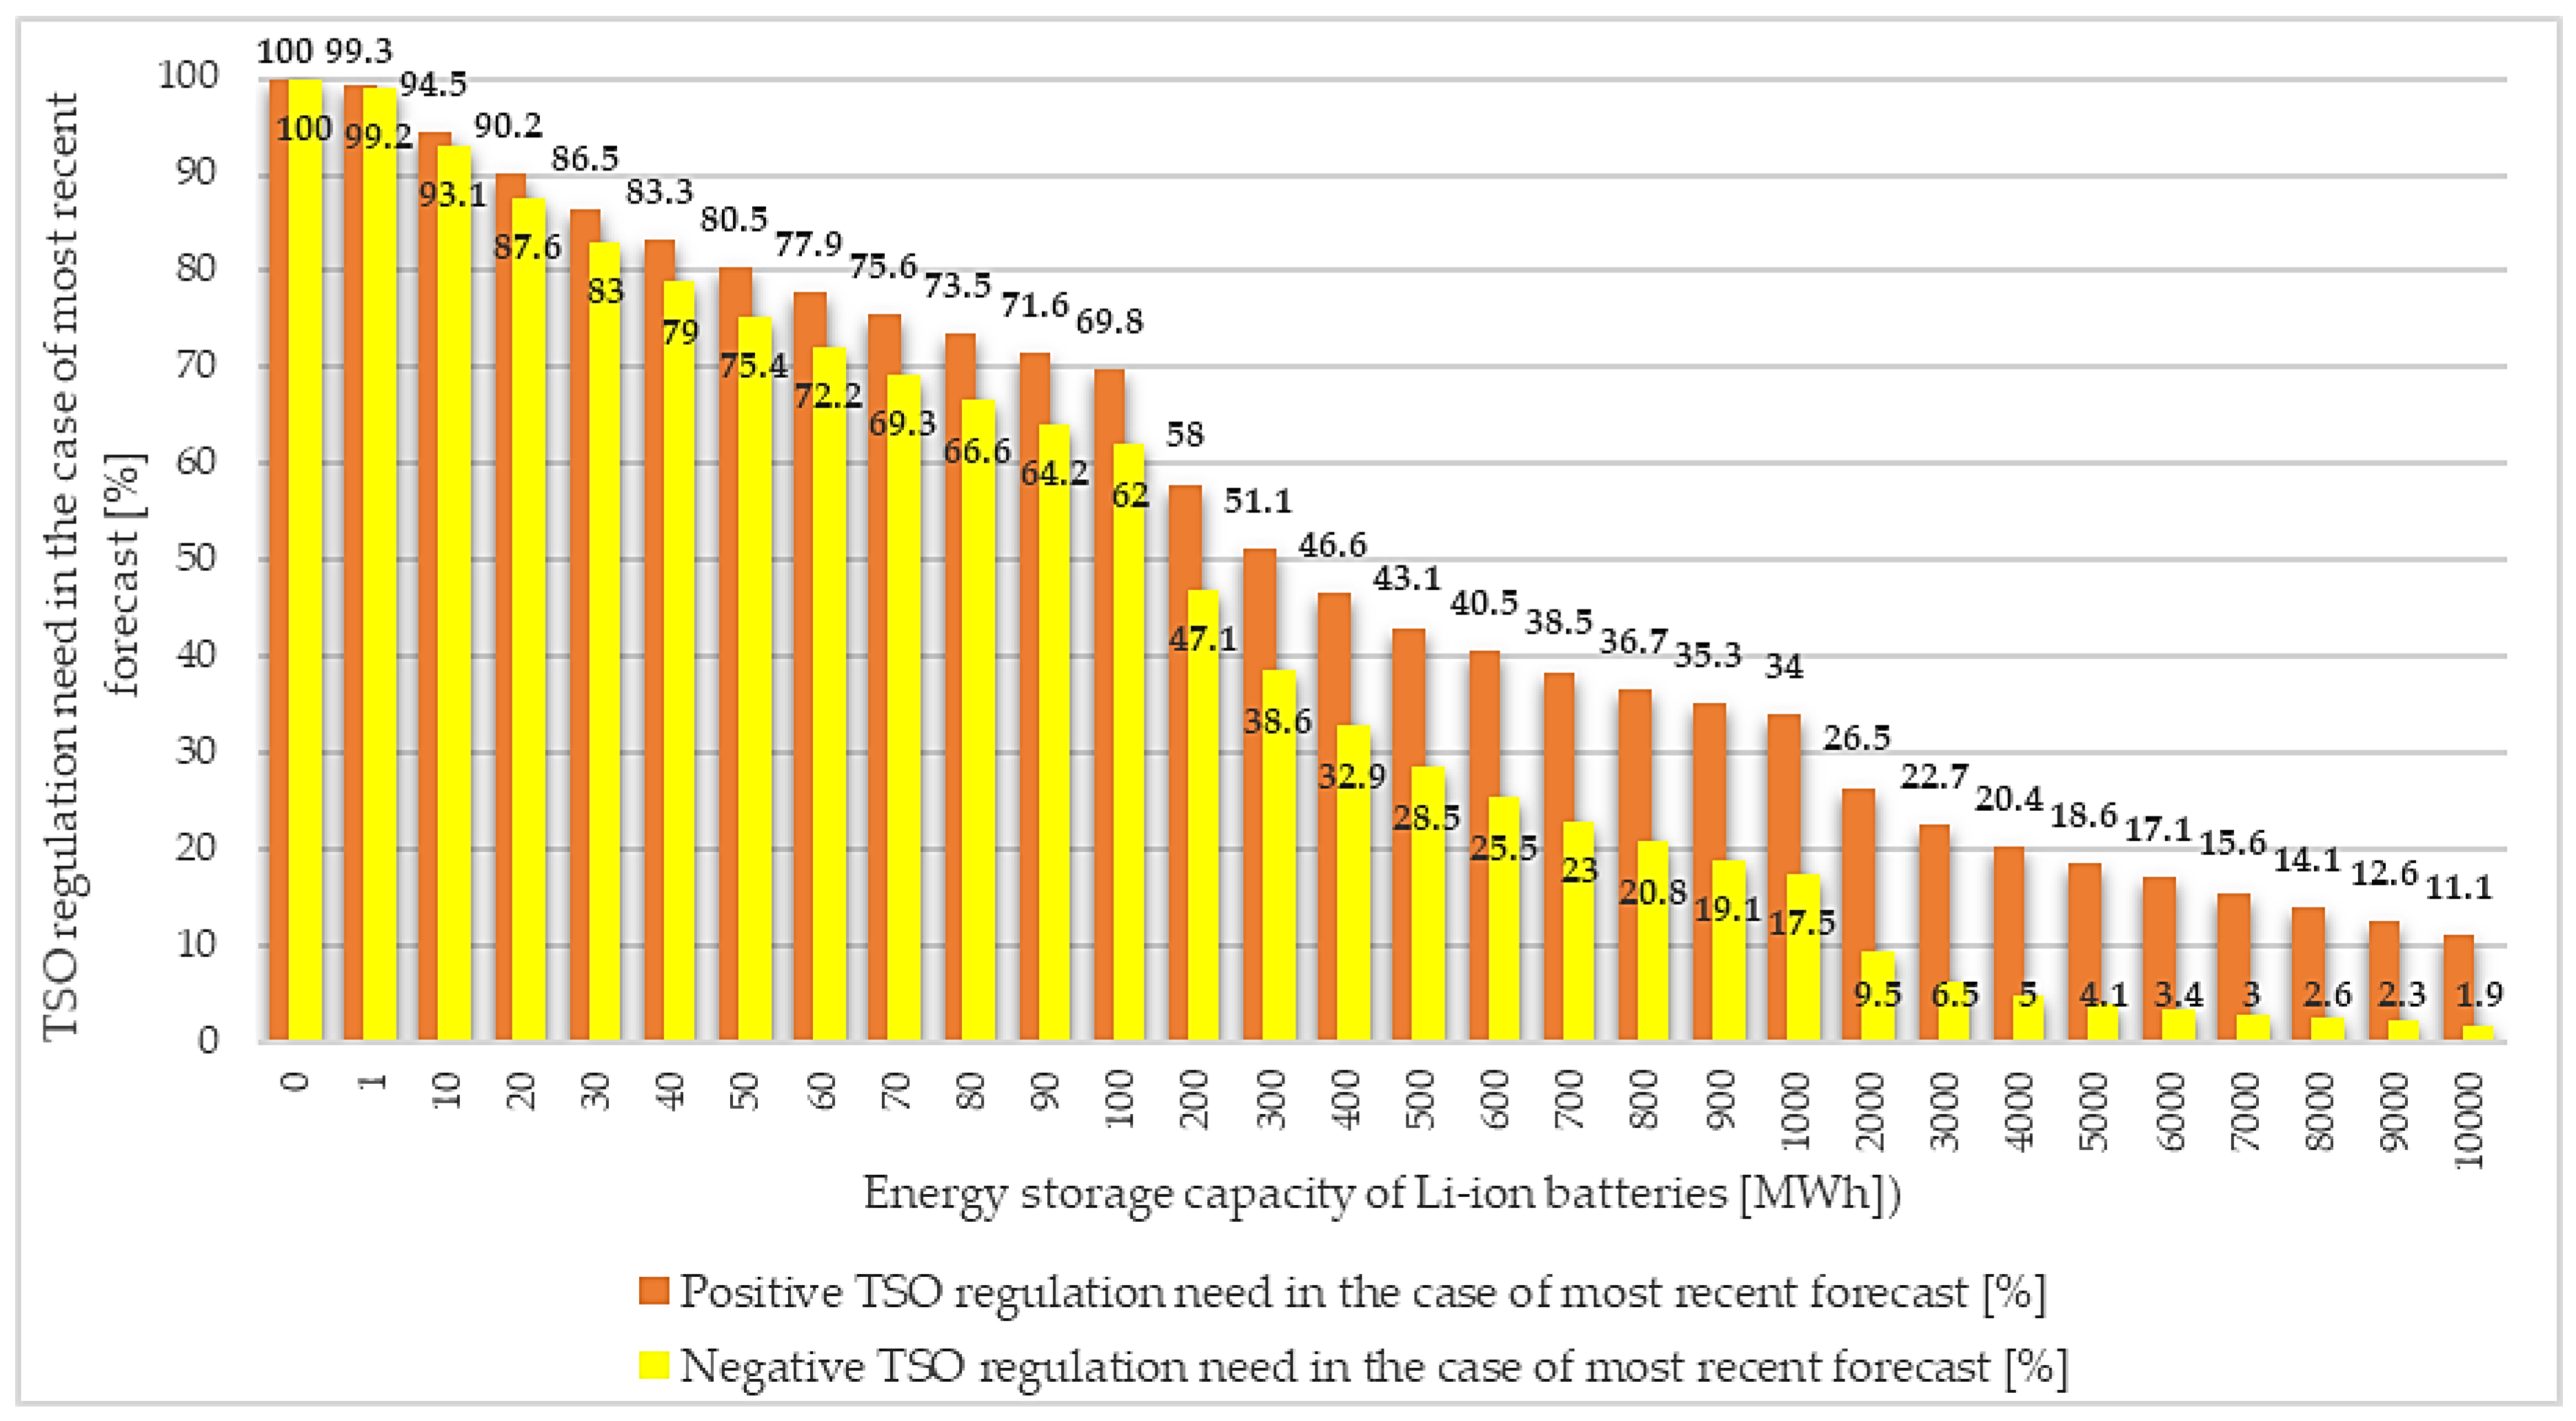
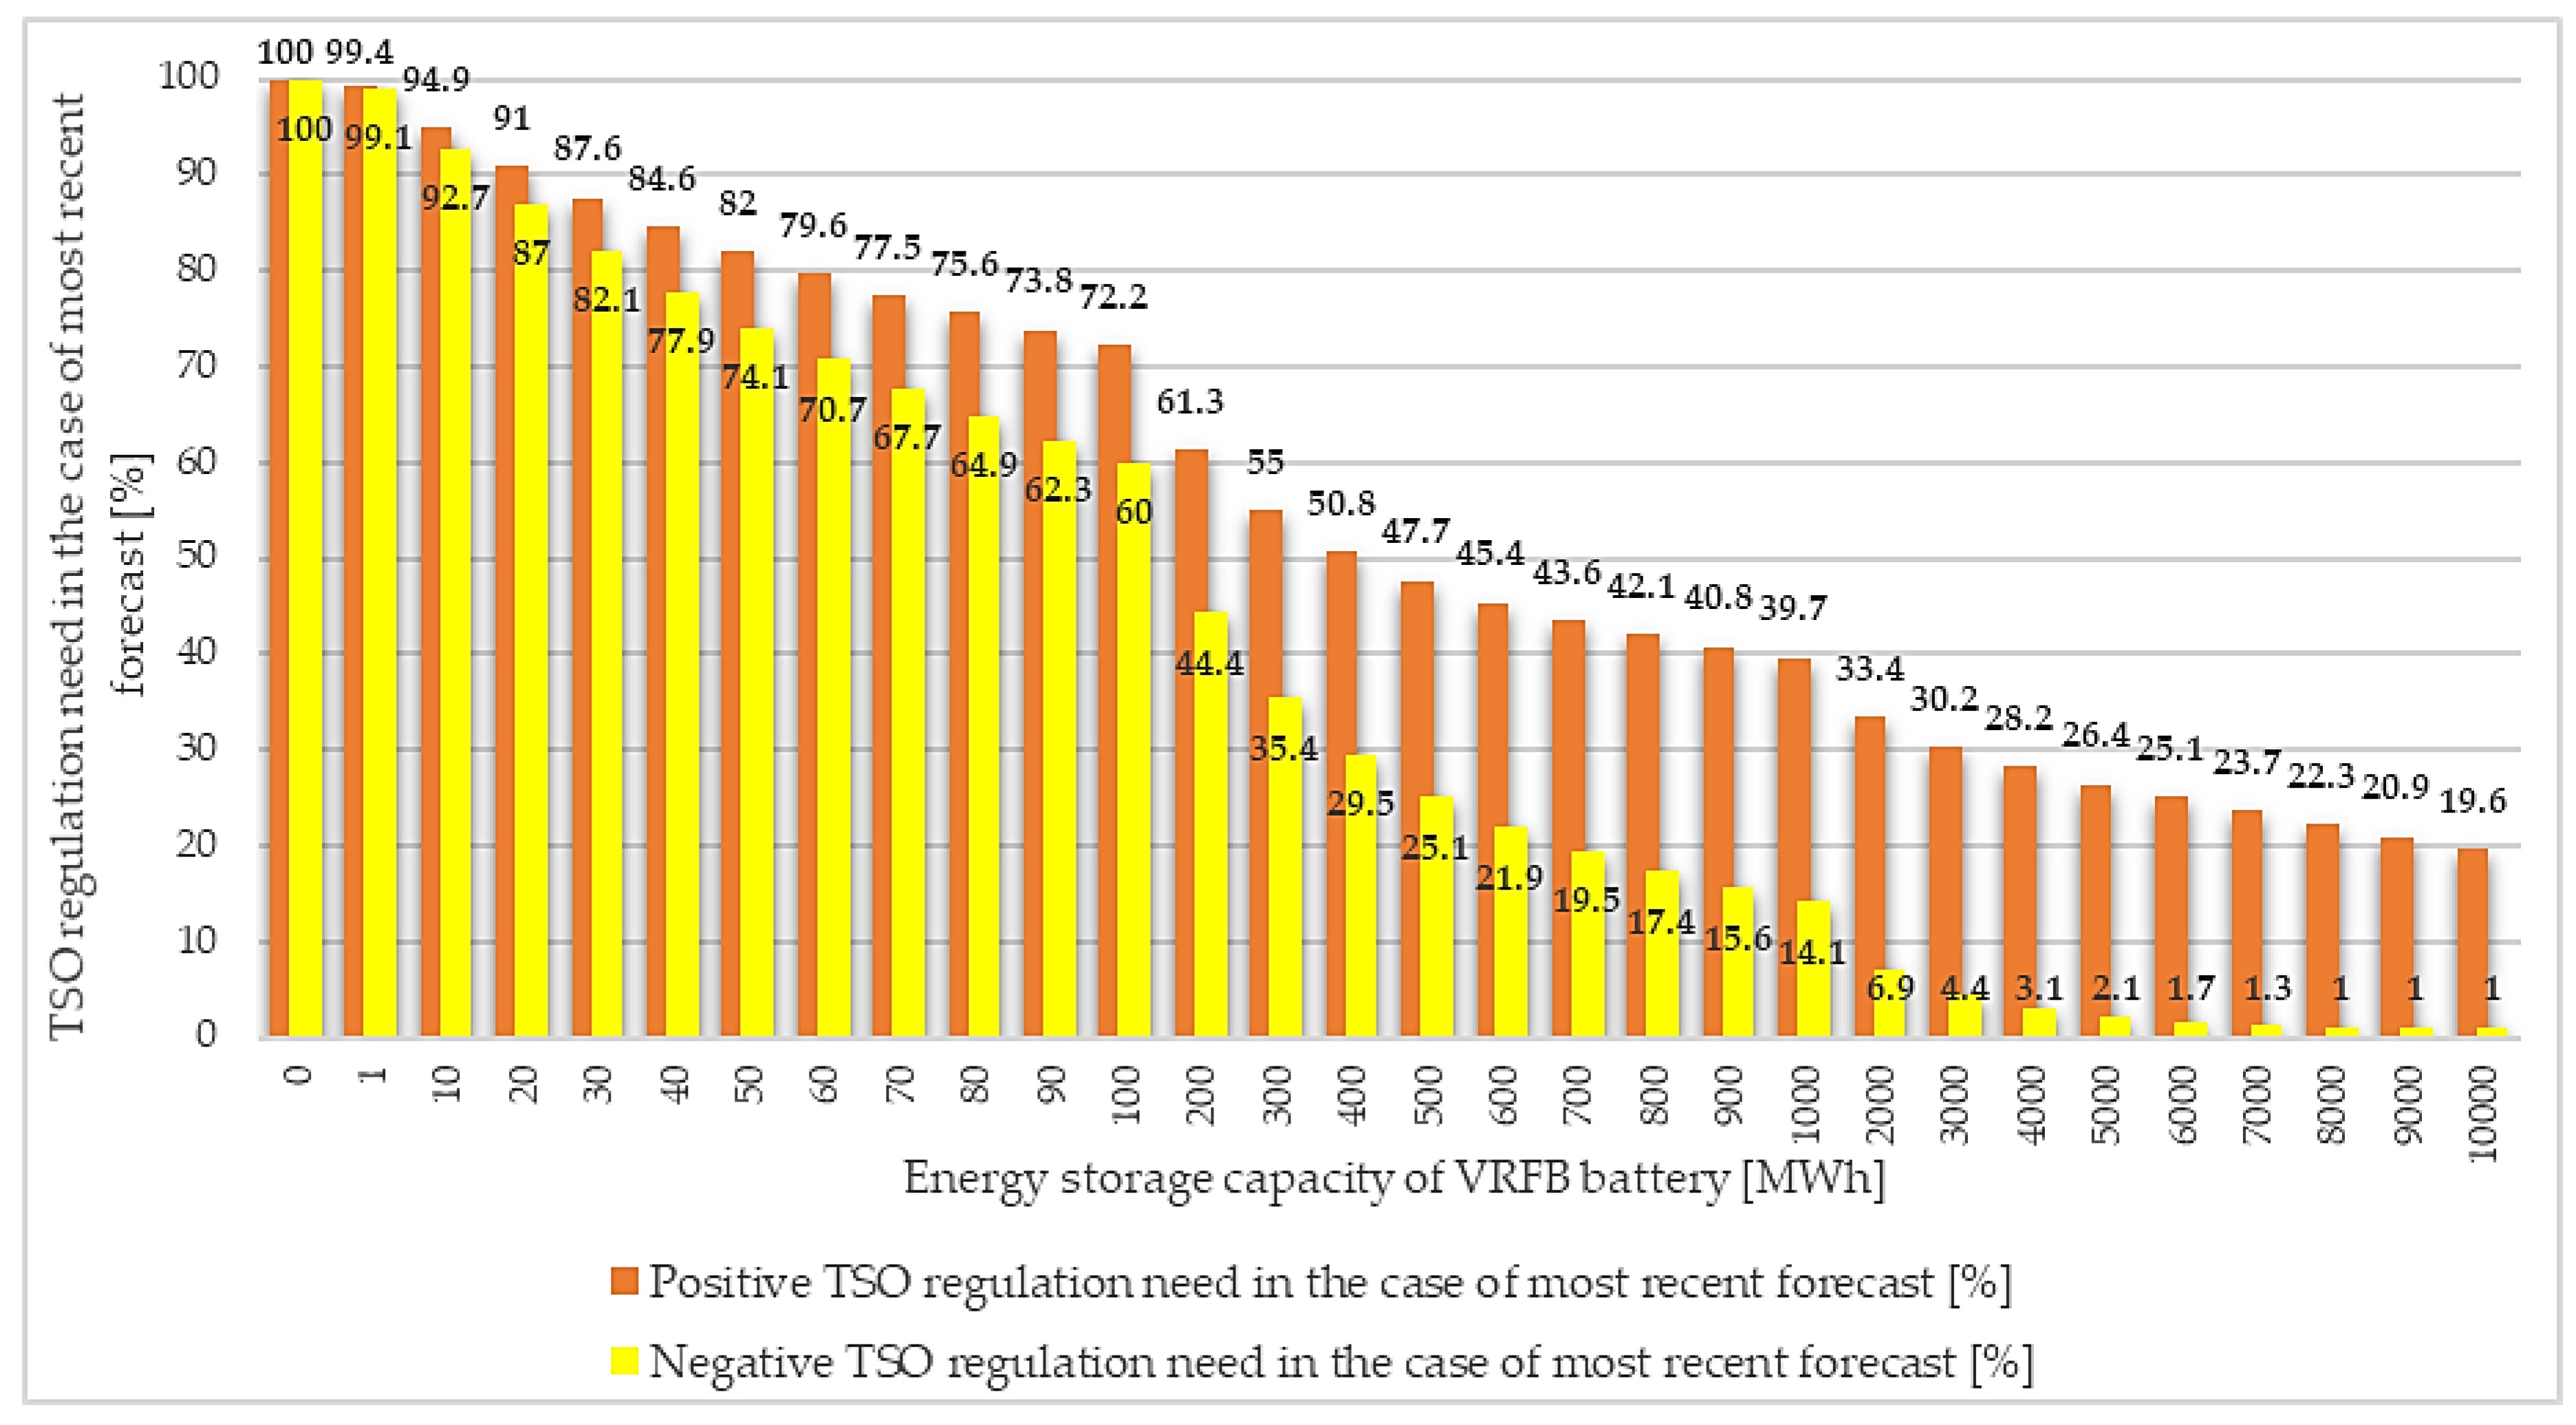
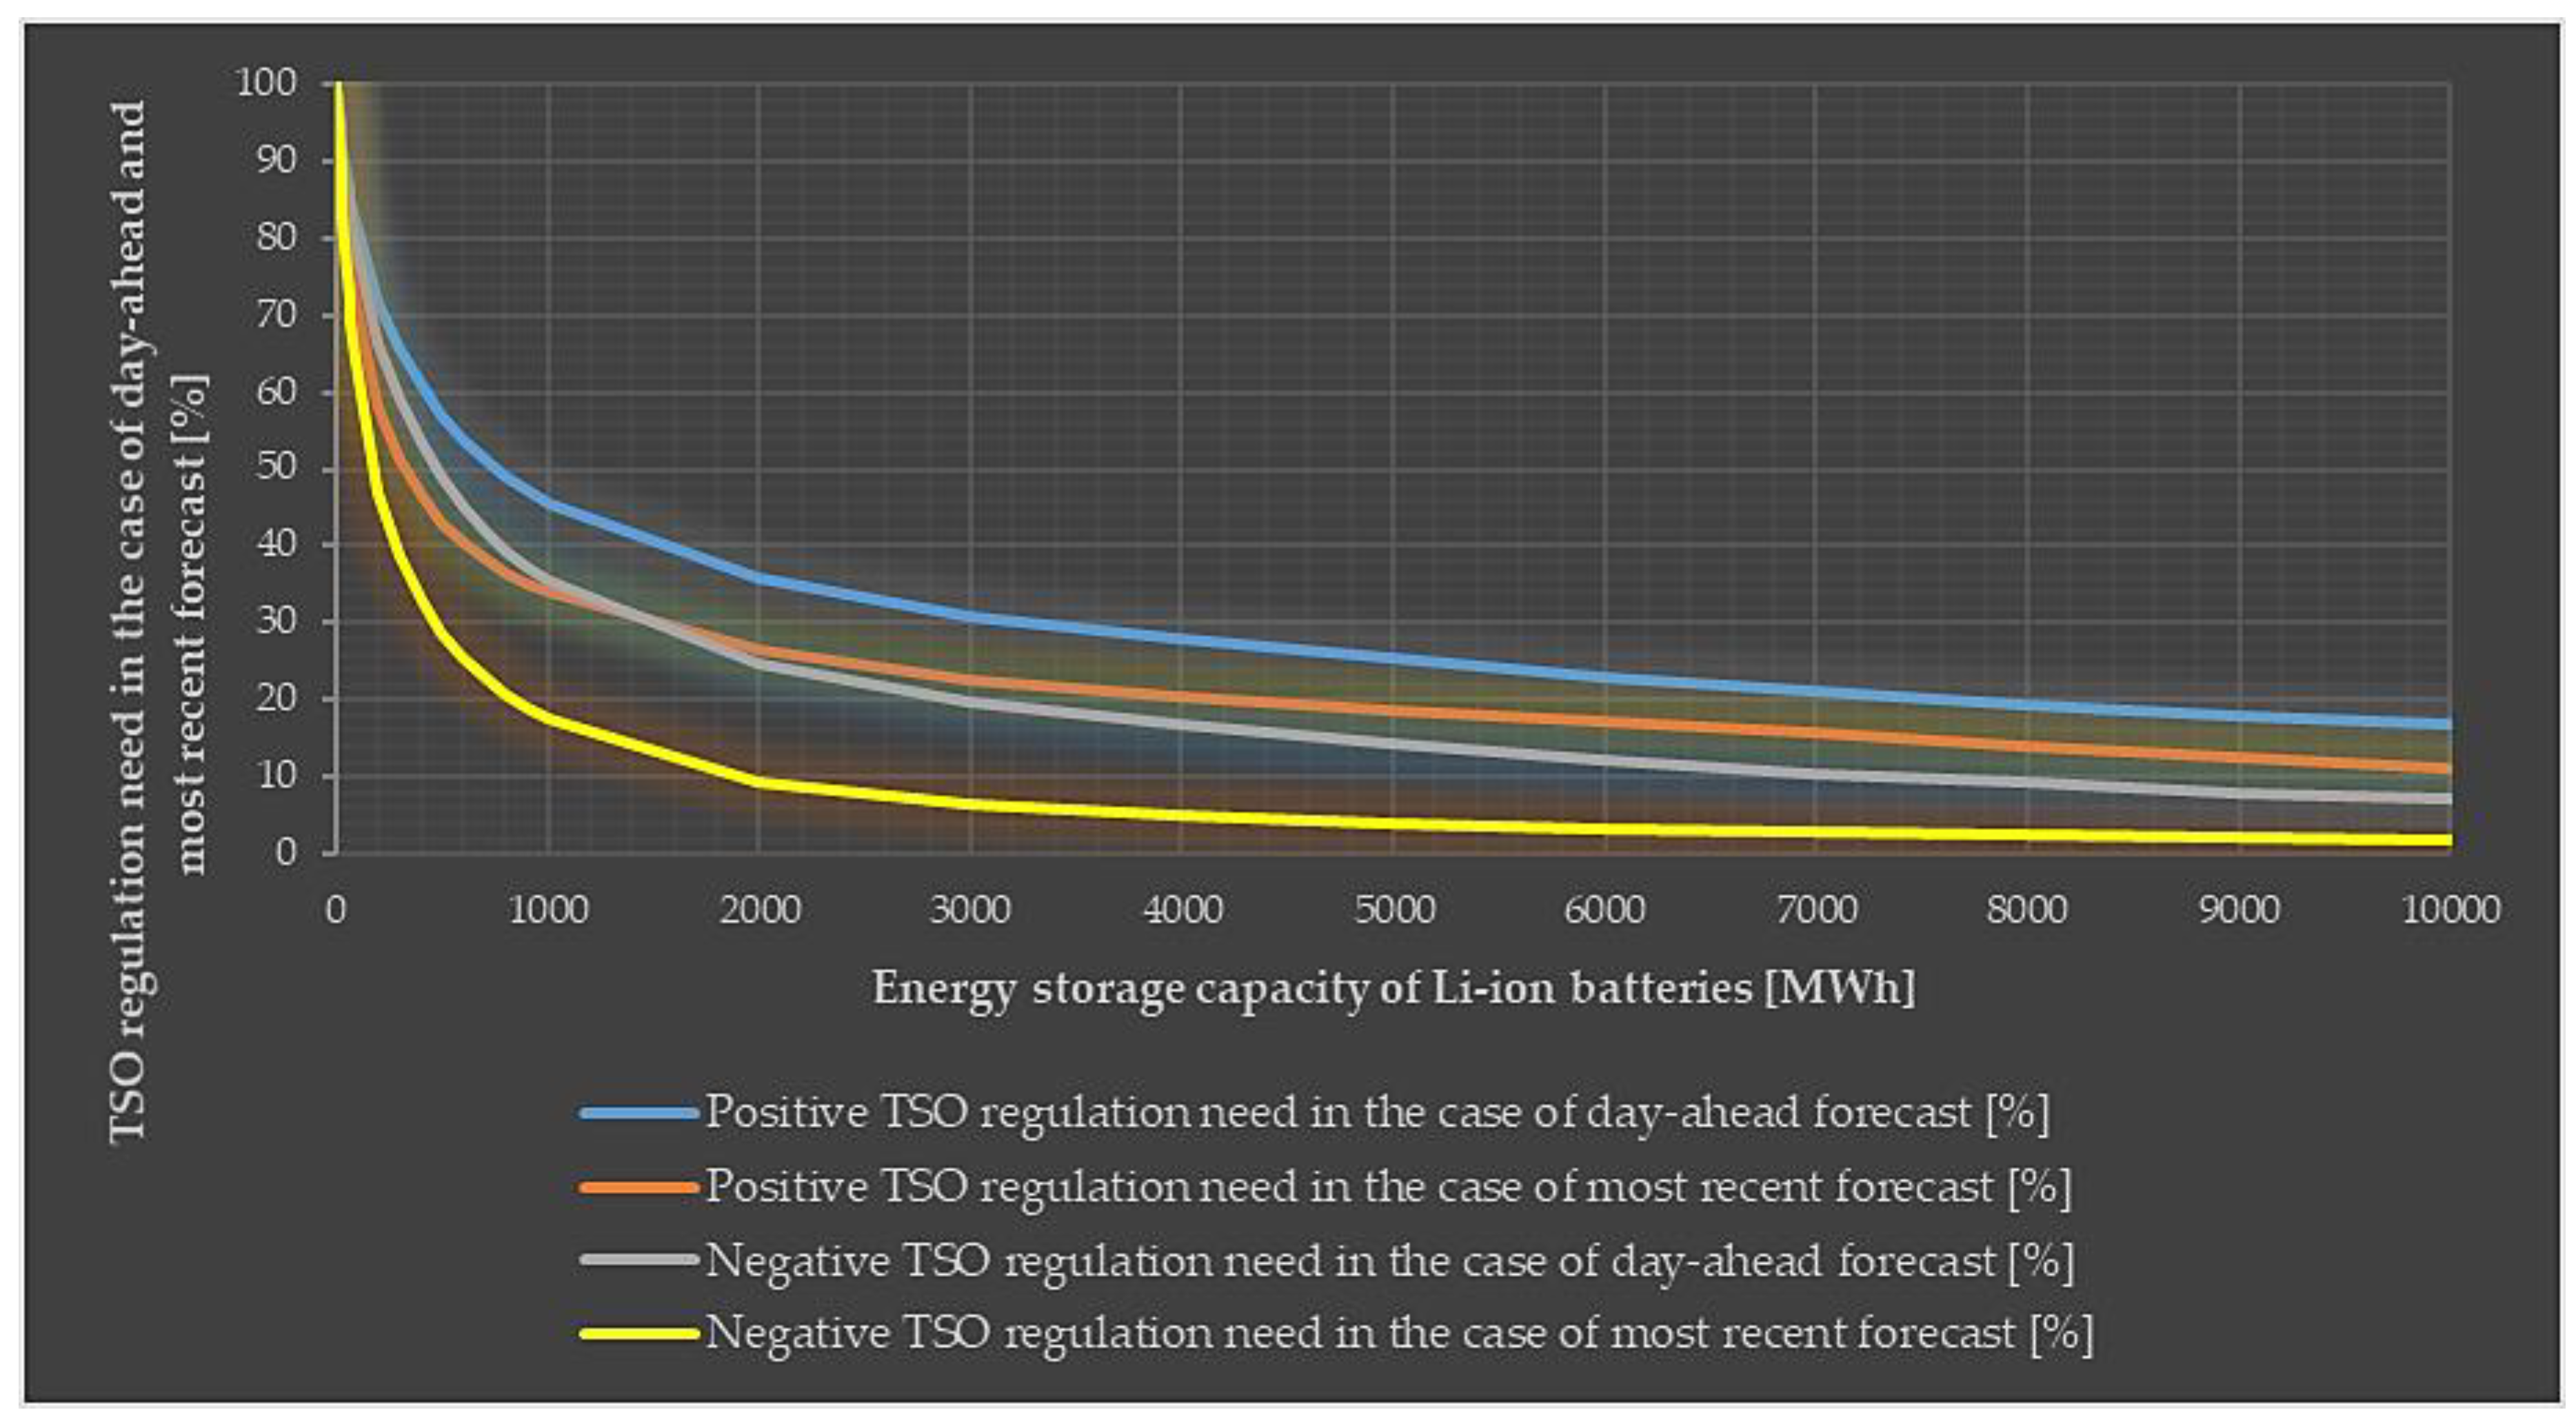
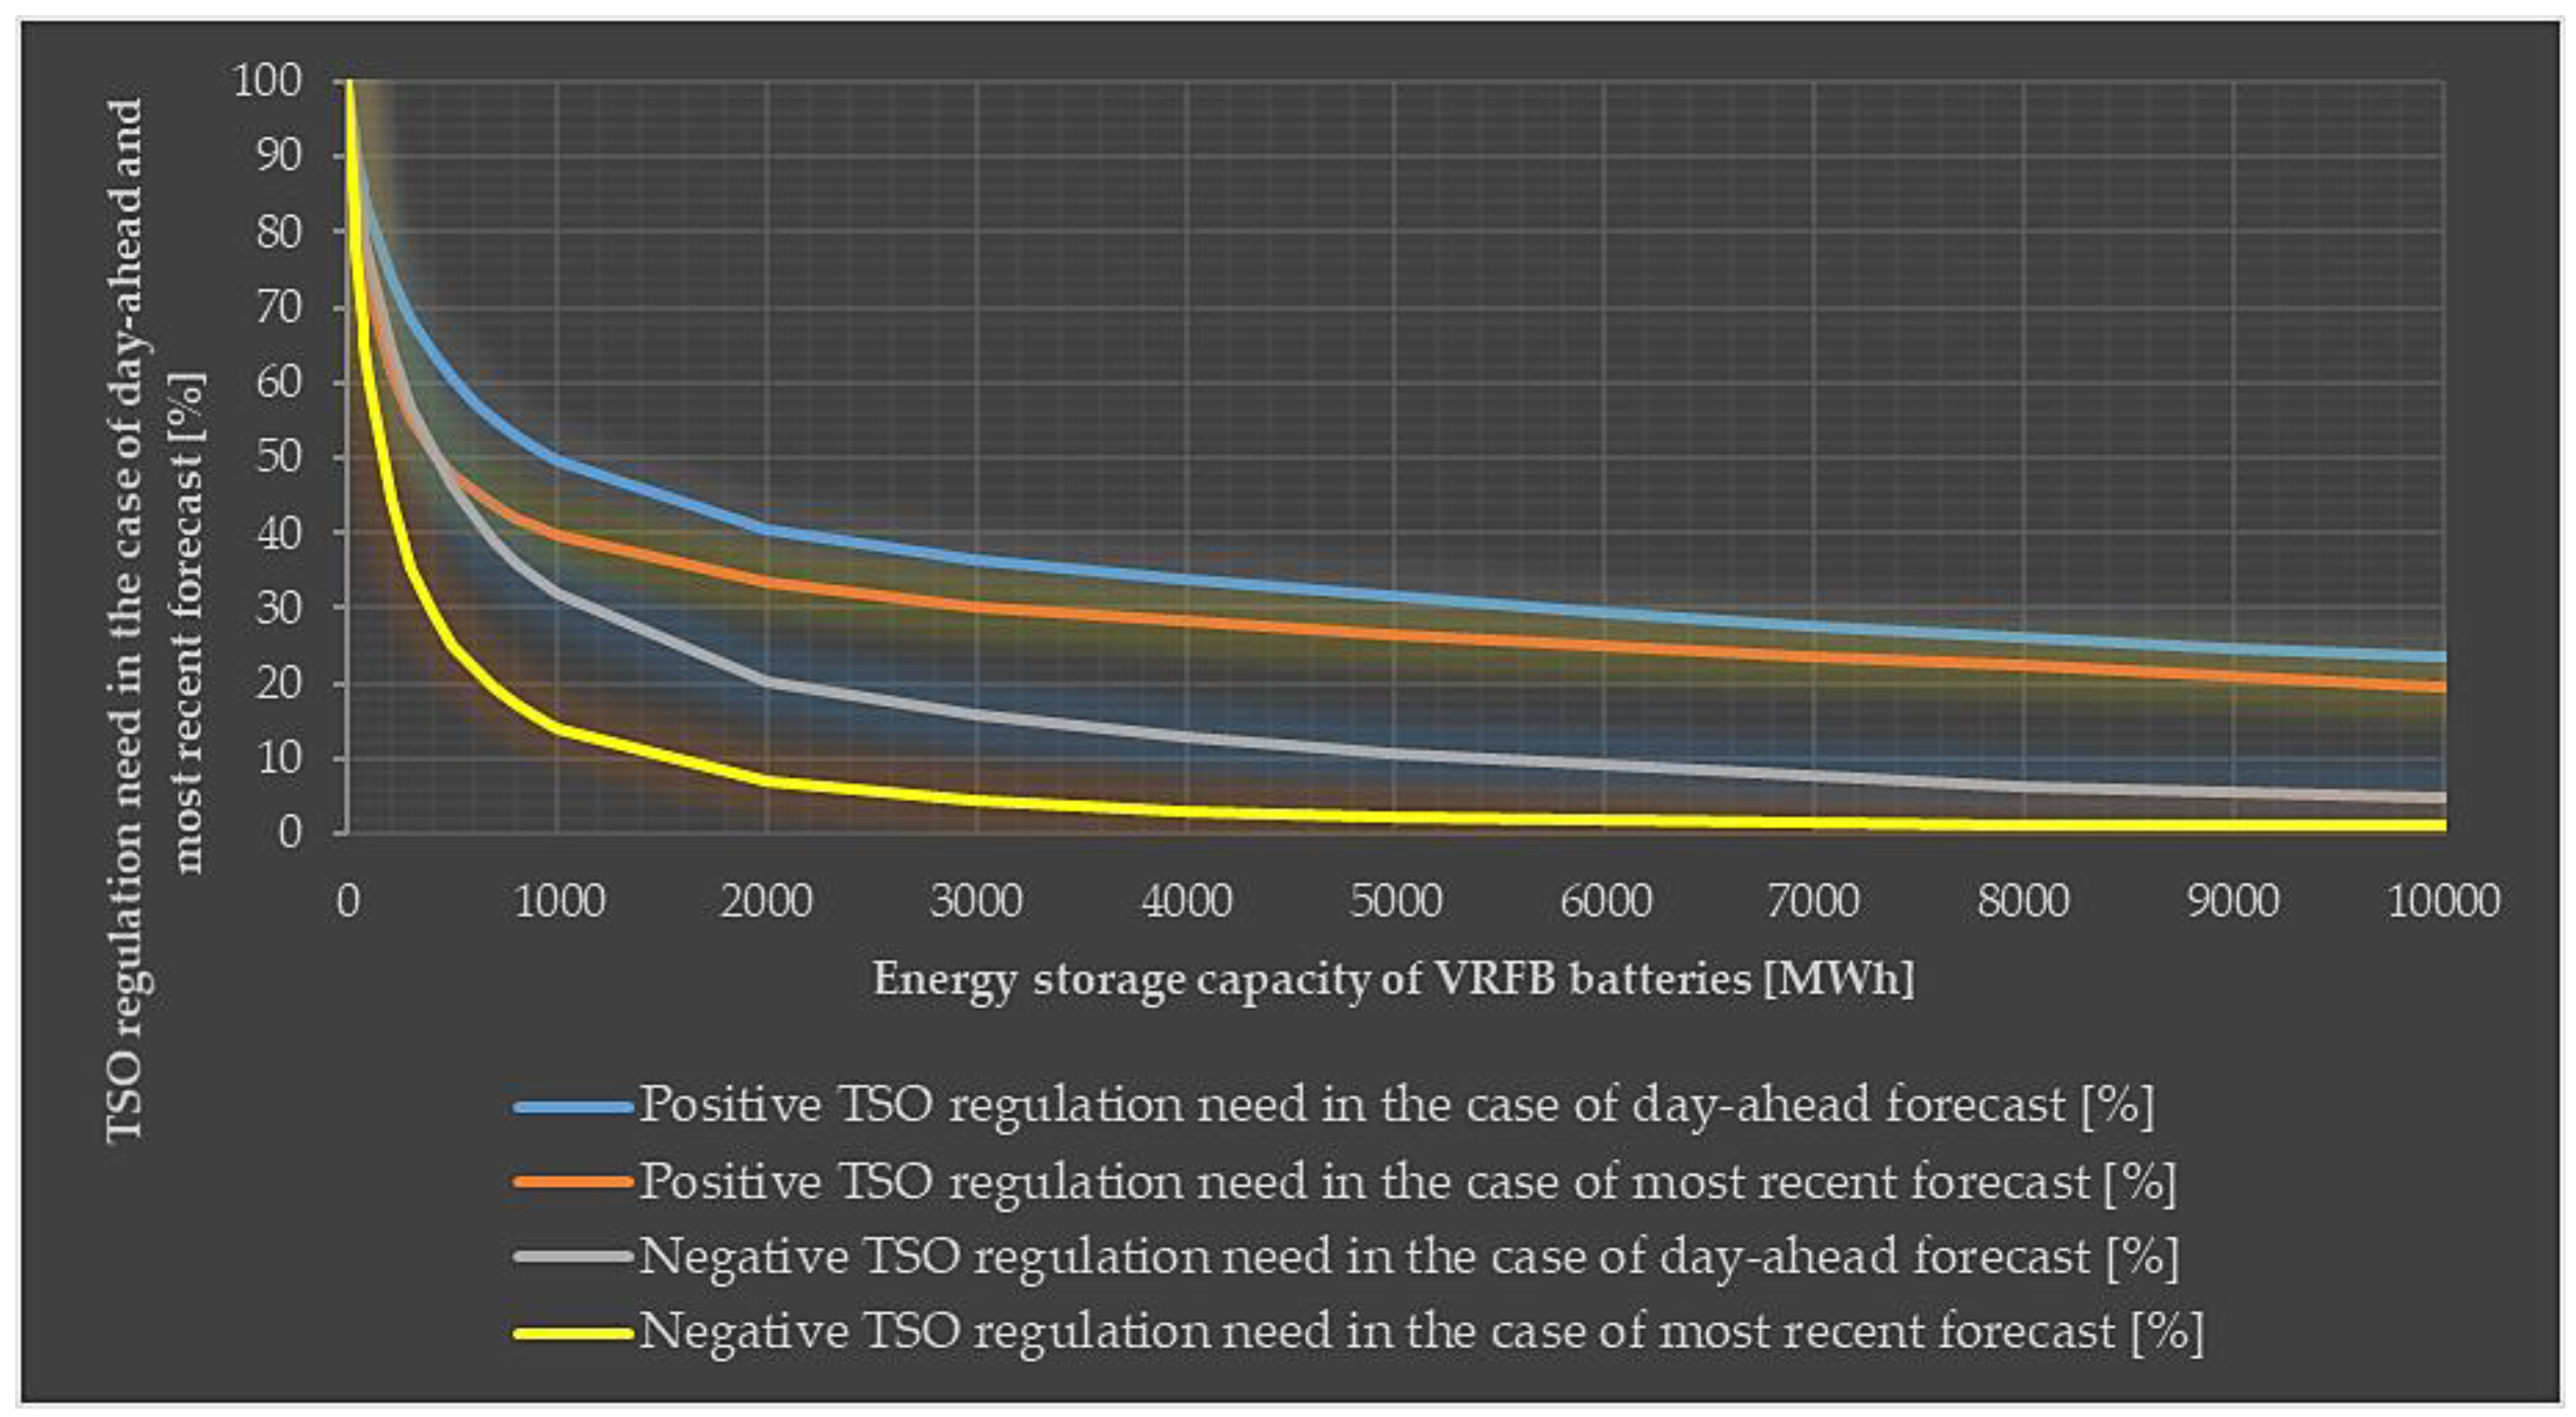
In Figure 9, Figure 10, Figure 11, Figure 12, Figure 13 and Figure 14, the negative and positive TSO regulation needs in the case of day-ahead and most recent forecasts with different Li-ion and VRFB energy storage capacities related to a 1000 MWp PV system were summarized for the period of 30/09/2014–30/09/2019. These results were determined from the 5-year average values of TSO regulations and battery usage. In Figure 9, Figure 10, Figure 11, Figure 12, Figure 13 and Figure 14, 100% data meant the situation without the battery. The 100% average TSO regulation values in MWh are contained in Figure 7 presented above. In the simulations, the batteries were charged only by PV power when positive power divergence occurred (from the perspective of the PV system operators). The results showed that the battery was more effective in negative TSO regulation need than in the positive case. The main reason for that was the energy storage round-trip efficiency phenomenon (Figure 13 and Figure 14) and to a lesser extent the characteristics of the battery charge status. The latter case is important because e.g., it is not possible to cover the negative TSO regulation requirement with a fully charged battery. The round-trip efficiency effect was more visible in the case of the VRFB technology. For this type of battery, the response to negative TSO regulation need was a few percent more efficient because of the higher charging loss compared to the Li-ion one. In the case of the most recent forecast, a 1 MWp PV system with an >8000 MWh VRFB battery eliminated 99% of the negative TSO regulation requirement (Figure 12), whereas this characteristic was 0.9% to 1.6% worse (Figure 11) for the Li-ion battery. In contrast, the positive TSO situation was more difficult to regulate with the VRFB technology.
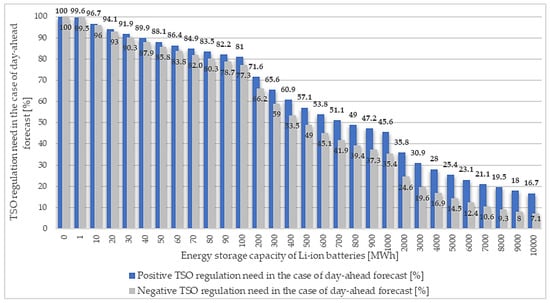
Figure 9.
Negative and positive TSO regulation needs in the case of day-ahead forecast with different Li-ion energy storage capacities related to a 1000 MWp PV system for the period of 30/09/2014–30/09/2019.
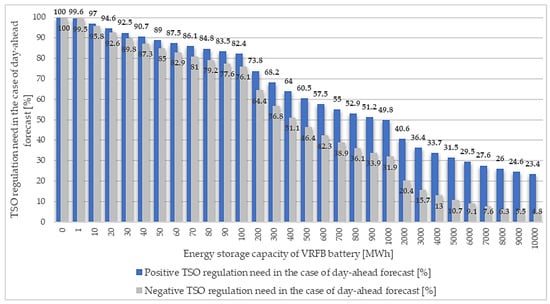
Figure 10.
Negative and positive TSO regulation needs in the case of day-ahead forecast with different VRFB energy storage capacities related to a 1000 MWp PV system for the period of 30/09/2014–30/09/2019.
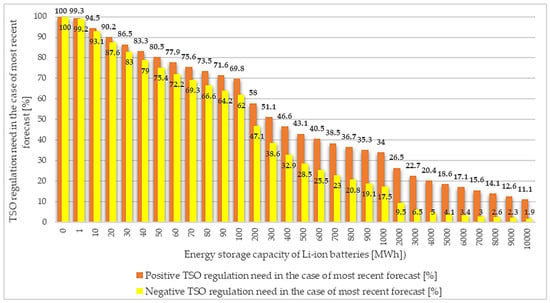
Figure 11.
Negative and positive TSO regulation needs in the case of most recent forecast with different Li-ion energy storage capacities related to a 1000 MWp PV system for the period of 30/09/2014–30/09/2019.
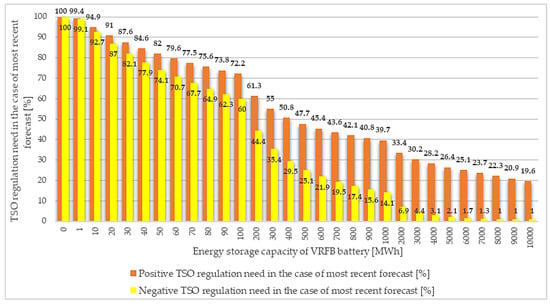
Figure 12.
Negative and positive TSO regulation needs in the case of most recent forecast with different VRFB energy storage capacities related to a 1000 MWp PV system for the period of 30/09/2014–30/09/2019.
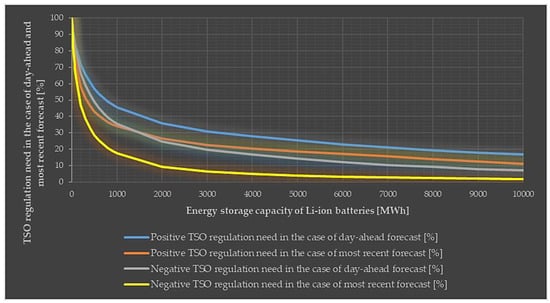
Figure 13.
The relationship of negative and positive TSO regulation needs in the case of day-ahead and most recent forecast with different Li-ion energy storage capacities related to a 1000 MWp PV system for the period of 30/09/2014–30/09/2019.
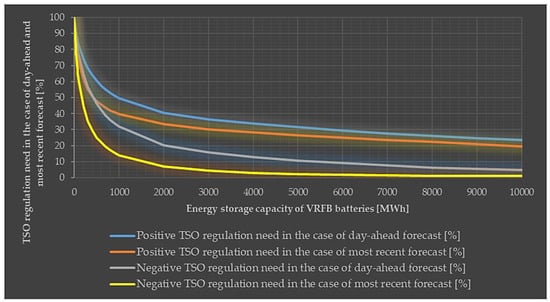
Figure 14.
The relationship of negative and positive TSO regulation needs in the case of day-ahead and most recent forecast with different VRFB energy storage capacities related to a 1000 MWp PV system for the period of 30/09/2014–30/09/2019.
The exponential relationship between TSO regulation need and energy storage capacity is more clearly shown in Figure 13 and Figure 14:
- There is an accelerating decrease up to about 1000 MWh of energy storage capacity.
- There is a slowing decrease between about 1000 and 3000 MWh of energy storage capacity.
- The decrease is very slight over about 3000 MWh energy storage capacity.
These relationships, for example, provide information for investment decisions.
4. Conclusions
This study examined the deviation between day-ahead and intraday PV power generation forecasts compared to the real production in connection with a 1000-MWp PV system. It also analyzed and presented the lithium-ion based and vanadium redox flow battery storage technologies in connection with the photovoltaic grid balancing reduction potential. The aim was to determine the photovoltaic balancing requirement through real data relative to the day-ahead and intraday forecasts. Another goal was also to establish the photovoltaic grid balancing reduction potentials of lithium-ion based and vanadium redox flow battery storage systems. The results made it possible to present the occurrence of the balancing power and energy divergence magnitudes and their percentage distributions in the examined 5-year period. Overall, this method showed that the accuracy of PV power and energy forecasting has improved with the usage of the most recent (intraday) forecast method. The best forecast reduced the MW size of regulation compared to the day-ahead data. In summary, the analytical results indicate the probability of balancing power and energy divergence magnitudes and their percentage distributions in the examined 5-year period.
The simulation results showed the grid balancing reduction potentials related to the energy storage value of 10 to 10,000 MWh. It was found that the battery technology and its energy storage capacity have a significant impact on the regulation needs of TSOs. Generally, the frequency of need for positive regulation by the TSO was higher than that of the negative ones, thus, ensuring the positive value is a greater challenge. The main reason for this was the energy storage round-trip efficiency phenomenon and to a lesser extent the characteristics of the battery charge status. For example, the exponential relationship between TSO regulation need and energy storage capacity provides information for investment decisions.
This paper gives a comprehensive review on the energy issue. The results of this research refer to the Belgian TSO; however, the limitations of PV grid integration are well demonstrated. The developed simulation procedure allows the method to be adapted to any country; therefore, our goal is to develop this concept into an easy-to-use application to help the work of TSOs facing the challenge of PV integration.
Author Contributions
H.Z. was mainly responsible for the technical, experimental, and modeling aspects; H.S. also conceived and designed the manuscript. All authors contributed equally in the analysis of the data and the writing and revision of the manuscript. All authors have read and agreed to the published version of the manuscript.
Funding
The publication is supported by the EFOP-3.6.3-VEKOP-16-2017-00008 project. The project is co-financed by the European Union and the European Social Fund. The authors have worked together with the KRAFT Social Innovation Lab of the Institute of Advanced Studies Kőszeg (IASK).
Conflicts of Interest
The authors declare no conflict of interest.
Abbreviations
The following abbreviations are used in this manuscript:
| CAES | Compressed-air energy storage |
| DG | Distributed Generation |
| DOE | Global Energy Storage Database |
| DSO | Distribution system operators |
| EEX | European Energy Exchange |
| EG | Elia Group |
| Entso-E | European Network of Transmission System Operators for Electricity |
| ESS | Energy Storage System |
| ESSs | Energy Storage Systems |
| EU | European Union |
| FiT | Feed-in-Tariff |
| IEX | India Energy Exchanges |
| IRENA | International Renewable Energy Agency |
| ISOs | independent system operators |
| LFP | Lithium-Iron-Phosphate |
| Li-ion | Lithium-Ion |
| LTO | Lithium titanate |
| NCA | Nickel cobalt aluminium |
| NMC | Nickel manganese cobalt oxide |
| NYISO | New York Independent System Operator |
| PHS | Pumped hydro storage |
| PJM | Pennsylvania New Jersey Maryland Interconnection LLC |
| PST | Phase-shifting transformer |
| PV | Photovoltaic |
| RTO | Regional transmission organizations |
| SMES | Superconducting magnetic energy storage |
| TES | Thermal energy storage |
| TSO | Transmission system operator |
| USA | United States of America |
| VRE | Variable Renewable Energy |
| VREs | Variable Renewable Energy Sources |
| VRFB | Vanadium redox flow battery |
References
- Aboumahboub, T.; Schaber, K.; Tzscheutschler, P.; Hamacher, T. Optimization of the utilization of renewable energy sources in the electricity sector. Recent Adv. Energy Environ. 2010. Available online: https://www.semanticscholar.org/paper/Optimization-of-the-utilization-of-renewable-energy-Aboumahboub-Schaber/4030672038fa20e162813699aaa5ff198b226ab6 (accessed on 20 September 2019).
- Olivier, J.G.J.; Van Aardenne, J.A.; Dentener, F.J.; Pagliari, V.; Ganzeveld, L.N.; Peters, J.A.H.W. Recent trends in global greenhouse gas emissions: Regional trends 1970–2000 and spatial distributionof key sources in 2000. Environ. Sci. 2005, 2, 81–99. [Google Scholar] [CrossRef]
- Greenhouse Gas Emissions by Sector in 2003. EU-25, EU-15 and EU-10—European Environment Agency. Available online: https://www.eea.europa.eu/data-and-maps/figures/greenhouse-gas-emissions-by-sector-in-2003-eu-25-eu-15-and-eu-10 (accessed on 15 May 2018).
- Szabó, S.; Enyedi, P.; Horváth, M.; Kovács, Z.; Burai, P.; Csoknyai, T.; Szabó, G. Automated registration of potential locations for solar energy production with Light Detection And Ranging (LiDAR) and small format photogrammetry. J. Clean. Prod. 2016, 112, 3820–3829. [Google Scholar] [CrossRef]
- Hosenuzzaman, M.; Rahim, N.A.; Selvaraj, J.; Hasanuzzaman, M.; Malek, A.B.M.A.; Nahar, A. Global prospects, progress, policies, and environmental impact of solar photovoltaic power generation. Renew. Sustain. Energy Rev. 2015, 41, 284–297. [Google Scholar] [CrossRef]
- Aman, M.M.; Solangi, K.H.; Hossain, M.S.; Badarudin, A.; Jasmon, G.B.; Mokhlis, H.; Bakar, A.H.A.; Kazi, S. A review of Safety, Health and Environmental (SHE) issues of solar energy system. Renew. Sustain. Energy Rev. 2015, 41, 1190–1204. [Google Scholar] [CrossRef]
- Jacobson, M.Z.; Delucchi, M.A.; Cameron, M.A.; Frew, B.A. Low-cost solution to the grid reliability problem with 100% penetration of intermittent wind, water, and solar for all purposes. Proc. Natl. Acad. Sci. USA 2015, 112, 15060–15065. [Google Scholar] [CrossRef]
- Zsiborács, H.; Hegedűsné Baranyai, N.; Csányi, S.; Vincze, A.; Pintér, G. Economic Analysis of Grid-Connected PV System Regulations: A Hungarian Case Study. Electronics 2019, 8, 149. [Google Scholar] [CrossRef]
- Zsiborács, H.; Pályi, B.; Pintér, G.; Popp, J.; Balogh, P.; Gabnai, Z.; Pető, K.; Farkas, I.; Baranyai, N.H.; Bai, A. Technical-economic study of cooled crystalline solar modules. Sol. Energy 2016, 140, 227–235. [Google Scholar] [CrossRef]
- REN21. Renewables 2018 Global Status Report—REN21; REN21: Paris, France, 2018. [Google Scholar]
- SolarPower Europe. Global Market Outlook for Solar Power; SolarPower Europe: Brussels, Belgium, 2019. [Google Scholar]
- Renewable Energy Policy Network for the 21st Century Renewables 2017 Global Status Report; REN21: Paris, France, 2017; pp. 1–302.
- International Renewable Energy Agency IRENA. Solar PV in Africa: Costs and Markets; International Renewable Energy Agency IRENA: Abu Dhabi, UAE, 2016. [Google Scholar]
- China National Energy Board. 2016 Photovoltaic Power Generation Statistics. Available online: http://www.nea.gov.cn/2017-02/04/c_136030860.htm (accessed on 4 February 2018).
- Zsiborács, H.; Bai, A.; Popp, J.; Gabnai, Z.; Pályi, B.; Farkas, I.; Baranyai, N.; Veszelka, M.; Zentkó, L.; Pintér, G. Change of Real and Simulated Energy Production of Certain Photovoltaic Technologies in Relation to Orientation, Tilt Angle and Dual-Axis Sun-Tracking. A Case Study in Hungary. Sustainability 2018, 10, 1394. [Google Scholar] [CrossRef]
- ENTSO-E. Europe Power System 2040: Completing the Map and Assessing the Cost of Non-Grid. Available online: https://tyndp.entsoe.eu/tyndp2018/power-system-2040/ (accessed on 12 April 2019).
- Zsiborács, H.; Baranyai, N.H.; Vincze, A.; Zentkó, L.; Birkner, Z.; Máté, K.; Pintér, G. Intermittent Renewable Energy Sources: The Role of Energy Storage in the European Power System of 2040. Electronics 2019, 8, 729. [Google Scholar] [CrossRef]
- Delucchi, M.A.; Jacobson, M.Z. Providing all global energy with wind, water, and solar power, Part II: Reliability, system and transmission costs, and policies. Energy Policy 2011, 39, 1170–1190. [Google Scholar] [CrossRef]
- Czisch, G. Szenarien zur Zukünftigen Stromversorgung, Kostenoptimierte Variationen zur Versorgung Europas und Seiner Nachbarn mit Strom aus Erneuerbaren Energien. Ph.D. Thesis, Universitat Kassel, Kassel, Germany, 2005. [Google Scholar]
- ENTSO-E. Maps and Data, TYNDP 2018. Available online: http://tyndp.entsoe.eu/tyndp2018/ (accessed on 22 May 2018).
- Heide, D.; von Bremen, L.; Greiner, M.; Hoffmann, C.; Speckmann, M.; Bofinger, S. Seasonal optimal mix of wind and solar power in a future, highly renewable Europe. Renew. Energy 2010, 35, 2483–2489. [Google Scholar] [CrossRef]
- Heide, D.; Greiner, M.; von Bremen, L.; Hoffmann, C. Reduced storage and balancing needs in a fully renewable European power system with excess wind and solar power generation. Renew. Energy 2011, 36, 2515–2523. [Google Scholar] [CrossRef]
- Hedegaard, K.; Meibom, P. Wind power impacts and electricity storage – A time scale perspective. Renew. Energy 2012, 37, 318–324. [Google Scholar] [CrossRef]
- Czisch, G.; Giebel, G. Realisable Scenarios for a Future Electricity Supply based 100% on Renewable Energies in: Energy Solutions for Sustainable Development: Proceedings; Risø International Energy Conference 2007; [... Took Place 22–24 May 2007]; Risø National Laboratory: Roskilde, Denmark, 2007; ISBN 9788755036031. [Google Scholar]
- Kempton, W.; Pimenta, F.M.; Veron, D.E.; Colle, B.A. Electric power from offshore wind via synoptic-scale interconnection. Proc. Natl. Acad. Sci. USA 2010, 107, 7240–7245. [Google Scholar] [CrossRef]
- Schaber, K.; Steinke, F.; Hamacher, T. Transmission grid extensions for the integration of variable renewable energies in Europe: Who benefits where? Energy Policy 2012, 43, 123–135. [Google Scholar] [CrossRef]
- Schaber, K.; Steinke, F.; Mühlich, P.; Hamacher, T. Parametric study of variable renewable energy integration in Europe: Advantages and costs of transmission grid extensions. Energy Policy 2012, 42, 498–508. [Google Scholar] [CrossRef]
- Widen, J. Correlations Between Large-Scale Solar and Wind Power in a Future Scenario for Sweden. IEEE Trans. Sustain. Energy 2011, 2, 177–184. [Google Scholar] [CrossRef]
- Aboumahboub, T.; Schaber, K.; Tzscheutschler, P.; Hamacher, T. Optimal Configuration of a Renewable-based Electricity Supply Sector. WSEAS Trans. Power Syst. 2010, 5, 2. [Google Scholar]
- Yao, R.; Steemers, K. A method of formulating energy load profile for domestic buildings in the UK. Energy Build. 2005, 37, 663–671. [Google Scholar] [CrossRef]
- National Renewable Energy Laboratory (NREL). Exploration of High-Penetration Renewable Electricity Futures; NREL: Golden, CO, USA, 2012; Volume 1. [Google Scholar]
- National Renewable Energy Laboratory (NREL). Renewable Electricity Generation and Storage Technologies; NREL: Golden, CO, USA, 2012. [Google Scholar]
- Bertsch, J.; Growitsch, C.; Lorenczik, S.; Nagl, S. Flexibility in Europe’s power sector—An additional requirement or an automatic complement? Energy Econ. 2016, 53, 118–131. [Google Scholar] [CrossRef]
- Hesse, H.; Schimpe, M.; Kucevic, D.; Jossen, A. Lithium-Ion Battery Storage for the Grid—A Review of Stationary Battery Storage System Design Tailored for Applications in Modern Power Grids. Energies 2017, 10, 2107. [Google Scholar] [CrossRef]
- Schimpe, M.; Piesch, C.; Hesse, H.; Paß, J.; Ritter, S.; Jossen, A. Power Flow Distribution Strategy for Improved Power Electronics Energy Efficiency in Battery Storage Systems: Development and Implementation in a Utility-Scale System. Energies 2018, 11, 533. [Google Scholar] [CrossRef]
- Aneke, M.; Wang, M. Energy storage technologies and real life applications—A state of the art review. Appl. Energy 2016, 179, 350–377. [Google Scholar] [CrossRef]
- Han, X.; Liao, S.; Ai, X.; Yao, W.; Wen, J. Determining the Minimal Power Capacity of Energy Storage to Accommodate Renewable Generation. Energies 2017, 10, 468. [Google Scholar] [CrossRef]
- Zsiborács, H.; Hegedűsné Baranyai, N.; Vincze, A.; Háber, I.; Pintér, G. Economic and Technical Aspects of Flexible Storage Photovoltaic Systems in Europe. Energies 2018, 11, 1445. [Google Scholar] [CrossRef]
- Blanco, H.; Faaij, A. A review at the role of storage in energy systems with a focus on Power to Gas and long-term storage. Renew. Sustain. Energy Rev. 2018, 81, 1049–1086. [Google Scholar] [CrossRef]
- Strbac, G.; Aunedi, M.; Pudjianto, D.; Djapic, P.; Teng, F.; Sturt, A.; Jackravut, D.; Sansom, R.; Yufit, V.; Brandon, N. Strategic Assessment of the Role and Value of Energy Storage Systems in the UK Low Carbon Energy Future; Energy Futures Lab, Imperial College London: London, UK, 2012. [Google Scholar]
- Denholm, P.; Ela, E.; Kirby, B.; Milligan, M. Role of Energy Storage with Renewable Electricity Generation; NREL: Golden, CO, USA, 2010. [Google Scholar]
- International Renewable Energy Agency. Electricity Storage and Renewables: Costs and Markets to 2030; IRENA: Abu Dhabi, UAE, 2017. [Google Scholar]
- Kondziella, H.; Bruckner, T. Flexibility requirements of renewable energy based electricity systems – a review of research results and methodologies. Renew. Sustain. Energy Rev. 2016, 53, 10–22. [Google Scholar] [CrossRef]
- Beaudin, M.; Zareipour, H.; Schellenberglabe, A.; Rosehart, W. Energy storage for mitigating the variability of renewable electricity sources: An updated review. Energy Sustain. Dev. 2010, 14, 302–314. [Google Scholar] [CrossRef]
- Deane, J.P.; Ó Gallachóir, B.P.; McKeogh, E.J. Techno-economic review of existing and new pumped hydro energy storage plant. Renew. Sustain. Energy Rev. 2010, 14, 1293–1302. [Google Scholar] [CrossRef]
- Chen, H.; Cong, T.N.; Yang, W.; Tan, C.; Li, Y.; Ding, Y. Progress in electrical energy storage system: A critical review. Prog. Nat. Sci. 2009, 19, 291–312. [Google Scholar] [CrossRef]
- European Commission. EU Reference Scenario 2016; European Commission: Brussels, Belgium, 2016. [Google Scholar]
- International Hydropower Association. 2017 Key Trends in Hydropower; International Hydropower Association: London, UK, 2017. [Google Scholar]
- Sandia National Laboratories. DOE Global Energy Storage Database, Office of Electricity Delivery & Energy Reliability. Available online: http://www.energystorageexchange.org/projects (accessed on 18 August 2019).
- May, G.J.; Davidson, A.; Monahov, B. Lead batteries for utility energy storage: A review. J. Energy Storage 2018, 15, 145–157. [Google Scholar] [CrossRef]
- Sandia National Laboratories. DOE Global Energy Storage Database. Available online: https://www.energystorageexchange.org/projects/data_visualization (accessed on 2 March 2019).
- CellCube Energy Storage Systems Inc. Investor Presentation, June 2019; CellCube Energy Storage Systems Inc.: Toronto, ON, Canada, 2019. [Google Scholar]
- Wuhu ETC Battery Limited. Li-ion based Energy Storage System Prices. Available online: https://etcbattery.en.alibaba.com/productgrouplist-807801410-1/SYSTEM.html?spm=a2700.icbuShop.41413.16.60cc27caUMgMb5&filter=null (accessed on 20 October 2019).
- WattJoule Corporation. Cost and Performance Metrics. Available online: https://wattjoule.com/core-innovation/ (accessed on 20 October 2019).
- S&P Global Market Intelligence. “Lithium’s not the only Game in Town”: Energy Storage Hopefuls Eye breakthrough. Available online: https://www.spglobal.com/marketintelligence/en/news-insights/latest-news-headlines/52794883 (accessed on 20 October 2019).
- Energy Response Solutions, Inc. Energy Storage System Safety: Comparing Vanadium Redox Flow and Lithium-Ion Based Systems; Energy Response Solutions, Inc.: Soquel, CA, USA, 2017. [Google Scholar]
- Algar, V. Understanding Battery Life—Vanadium Redox Flow Batteries. In Proceedings of the Australian Solar Council’s Solar Energy Exhibition & Conference 2017, South Wharf VIC, Australia, 3–4 May 2017; pp. 1–12. [Google Scholar]
- Enerox GmbH. Cellcube, Building Energy Storage Infrastructure; Enerox GmbH: Neudorf, Austria, 2019. [Google Scholar]
- Terna. Rapporto Pubblico Anno 2016 Storage LAB; Terna: Codrongianos, Italy, 2017. [Google Scholar]
- SOLARWATT GmbH. SOLARWATT MyReserve 500. Available online: https://www.solarwatt.de/stromspeicher/myreserve-500 (accessed on 4 February 2018).
- Terna. Rapporto Pubblico Anno 2017 Storage LAB; Terna: Codrongianos, Italy, 2018. [Google Scholar]
- European Commission. Energy Storage—The Role of Electricity; European Commission: Brussels, Belgium, 2017. [Google Scholar]
- Rodríguez, R.A.; Becker, S.; Andresen, G.B.; Heide, D.; Greiner, M. Transmission needs across a fully renewable European power system. Renew. Energy 2014, 63, 467–476. [Google Scholar] [CrossRef]
- Cho, A. Energy’s tricky tradeoffs. Science 2010, 329, 786–787. [Google Scholar] [CrossRef] [PubMed]
- Jacobson, M.Z.; Delucchi, M.A. Providing all global energy with wind, water, and solar power, Part I: Technologies, energy resources, quantities and areas of infrastructure, and materials. Energy Policy 2011, 39, 1154–1169. [Google Scholar] [CrossRef]
- PV Magazine. Spain Unveils New Provisions for Self-Consumption Regulation. Available online: https://www.pv-magazine.com/2019/02/01/spain-unveils-new-provisions-for-self-consumption-regulation/ (accessed on 15 October 2019).
- Cochran, J.; Bird, L.; Heeter, J.; Arent, D.J. Integrating Variable Renewable Energy in Electric Power Markets: Best Practices from International Experience; Oak Ridge and Springfield: Springfield, IL, USA, 2012. [Google Scholar]
- Clean Energy Wire CLEW—Journalism for the Energy Transition. Interconnectors &Amp; Blockages—German Grid at Odds with EU Power Market. Available online: https://www.cleanenergywire.org/factsheets/interconnectors-blockages-german-grid-odds-eu-power-market (accessed on 15 October 2019).
- Miklós, F. Működik az Első Hazai Közcélú Energiatároló Egység. Available online: https://www.villanylap.hu/hirek/4904-mukodik-az-elso-hazai-kozcelu-energiatarolo-egyseg (accessed on 20 February 2019).
- Dániel, S. Napelemek: Energiatárolókat Telepít a Közműszolgáltató. Available online: https://www.napi.hu/magyar_vallalatok/napelemek_energiatarolokat_telepit_a_kozmuszolgaltato.674558.html (accessed on 20 February 2019).
- Fathima, A.H.; Palanisamy, K. Energy Storage Systems for Energy Management of Renewables in Distributed Generation Systems. In Energy Management of Distributed Generation Systems; InTech: London, UK, 2016. [Google Scholar]
- Ugarte, S.; Larkin, J.; Ree, B.; Swinkels, V.; Voogt, M.; Friedrichsen, N.; Michaelis, J.; Thielmann, A.; Wietschel, W.; Wietschel, R. Energy Storage: Which Market Designs and Regulatory Incentives are needed? In Directorate General for Internal Policies Policy Department A: Economic and Scientific Policy; European Parilament: Brussels, Belgium, 2015. [Google Scholar]
- EUR-Lex. Regulation (EU) 2019/943 of the European Parliament and of the Council of 5 June 2019 on the Internal Market for Electricity (Text with EEA Relevance). Available online: https://eur-lex.europa.eu/eli/reg/2019/943/oj (accessed on 11 November 2019).
- EUR-Lex. Directive (EU) 2019/944 of the European Parliament and of the Council of 5 June 2019 on Common Rules for the Internal Market for Electricity and Amending Directive 2012/27/EU (Text with EEA Relevance). Available online: https://eur-lex.europa.eu/eli/dir/2019/944/oj (accessed on 11 November 2019).
- Norton Rose Fulbright. Regulatory Progress for Energy Storage in Europe. Available online: https://www.nortonrosefulbright.com/en-la/knowledge/publications/8b5285f4/regulatory-progress-for-energy-storage-in-europe (accessed on 18 March 2019).
- Garrett, F.; James, M.; Jesse, M.; Hervé, T. The Economics of Battery Energy Storage—How Multi-Use, Customer-Sited Batteries Deliver the most Services and Value to Customers and the Grid; NREL: Golden, CO, USA, 2015. [Google Scholar]
- Eller, A.; Gauntlett, D. Energy Storage Trends and Opportunities in Emerging Markets; Energy Sector Management Assistance Program: Washington, DC, USA, 2017; pp. 1–52. [Google Scholar]
- Maciejowska, K.; Nitka, W.; Weron, T. Day-Ahead vs. Intraday—Forecasting the Price Spread to Maximize Economic Benefits. Energies 2019, 12, 631. [Google Scholar] [CrossRef]
- ENTSO-E. Maps and Data, TYNDP 2016 Storage Projects. Available online: http://tyndp.entsoe.eu/maps-data/ (accessed on 27 May 2018).
- Fuchs, G.; Lunz, B.; Leuthold, M.; Sauer, D. Technology Overview on Electricity Storage—Overview on the Potential and on the Deployment Perspectives of Electricity Storage Technologies; Smart Energy for Europe Platform GmbH: Berlin, Germany, 2012. [Google Scholar]
- De Vita, A.; Kielichowska, I.; Mandatowa, P. Technology Pathways in Decarbonisation Scenarios; European Parilament: Brussels, Belgium, 2018. [Google Scholar]
- Elia Group. Grid Data—Generation. Available online: https://www.elia.be/en/grid-data/power-generation (accessed on 18 October 2019).
- Elia Group. Forecast and Actual Solar-PV1 Power Generation; Elia Group: Brussels, Belgium, 2019. [Google Scholar]
- Hungarian Transmission System Operator - MAVIR ZRt. Renewable Support Department Customer Service. Available online: https://www.mavir.hu/web/mavir/ugyfelszolgalat (accessed on 18 October 2019).
- National Legislation Database, H. 389/2007. (XII. 23.) Government Regulation. Available online: http://njt.hu/cgi_bin/njt_doc.cgi?docid=112846.354226 (accessed on 18 October 2019).
- Hungarian Energy and Public Utility Regulatory Authority. Renewable Energies. Available online: http://www.mekh.hu/megujulo-energiak-villamos-energia (accessed on 18 October 2019).
- PANNON Pro Innovations Ltd. Practical Experiences of PV and Storage Systems. Available online: https://klimainnovacio.hu/en/pannon-pro-innovations (accessed on 2 November 2019).
- Website of the Hungarian Government. Hungarian Official Gazette, 2019, No. 222; Website of the Hungarian Government: Budapest, Hungary, 2019. [Google Scholar]
- Schneider Electric. Hybrid Inverter for Solar Power - Conext XW+ 230V | SE Solar. Available online: https://solar.schneider-electric.com/product/conext-xw-hybrid-inverter/ (accessed on 24 May 2018).
- Schneider Electric. Energy Storage System. Available online: https://solar.schneider-electric.com/solution/energy-storage-system/ (accessed on 11 October 2018).
- Schneider Electric. Energy Storage Solutions for Utility-Scale Applications; Schneider Electric: Rueil-Malmaison, France, 2016. [Google Scholar]
- EU-Solar Zrt. Growatt 10000HYP Inverter. Available online: http://www.growatt.hu/growatt-10000hyp-inverter/ (accessed on 20 October 2019).
- VARTA Storage GmbH. VARTA—Element 130 Jahre Batterie-Expertise in Ihrem Energiespeicher; VARTA Storage GmbH: Nördlingen, Germany, 2019. [Google Scholar]
- Energen Power Holding AB. Energen, IntelliStoree; Energen Power Holding AB: Budapest, Hungary, 2018. [Google Scholar]
- PANNON Green Power Ltd. Practical-Economic Experiences of PV Energy Storage Systems. Available online: https://pannongreenpower.hu/en/home/ (accessed on 30 August 2019).
- Világgazdaság. Information about Elmű-Émász Energy Storage System. Available online: https://www.vg.hu/vallalatok/energia/az-elmu-emasz-megkapta-az-elso-energiataroloi-engedelyt-1018983/ (accessed on 30 November 2018).
- ALTEO Energiaszolgáltató Nyrt. Information about Alteo Energy Storage System. Available online: https://alteo.hu/energiatarolo-projekt/a-projekt-megvalositasa/ (accessed on 30 November 2018).
- Danish Green Technology LLC. AXIstorage Li 7S. Available online: http://www.danishgreentech.com/index.php/shop/solar/energy-storage/axistorage-li-7s-detail (accessed on 20 November 2018).
© 2020 by the authors. Licensee MDPI, Basel, Switzerland. This article is an open access article distributed under the terms and conditions of the Creative Commons Attribution (CC BY) license (http://creativecommons.org/licenses/by/4.0/).

