Article

Feature Assessment of Toe Area Activity during Walking of Elderly People with Stumbling Experiences through Wearable Clog-Integrated Plantar Visualization System

1
Graduated School of Natural Science and Technology, Kanazawa University, Kakuma-machi, Kanazawa 9201192, Japan
2
Faculty of Health Sciences, Institute of Medical, Pharmaceutical and Health Sciences, Kanazawa University, 5-11-80 Kodatsuno, Kanazawa 9200942, Japan
3
Faculty of Frontier Engineering, Institute of Science and Engineering, Kanazawa University, Kakuma-machi, Kanazawa 9201192, Japan
*
Authors to whom correspondence should be addressed.
Appl. Sci. 2020, 10(4), 1359; https://doi.org/10.3390/app10041359
Submission received: 21 January 2020 / Revised: 11 February 2020 / Accepted: 12 February 2020 / Published: 17 February 2020
(This article belongs to the Special Issue Human Health Engineering Volume II)

Abstract

:
In this study, we investigated the relationship between toe-area activity and stumbling experiences utilizing our developed sensing system, in order to assess toe-area activity in elderly people with stumbling experiences. The sensing system enables the visualization of the plantar aspect while walking on any surface and under any condition. An image of the plantar aspect is received at a reflecting surface and captured by a camera attached to a clog. The toe-area activity was evaluated by comparing the difference between the toe contact areas at heel-strike and push-off. Thirteen young individuals (nine men and four women, age 22.4 ± 2 years) and nine elderly individuals (five men and four women, age 65.3 ± 2 years) participated in the experiment by walking along a straight line wearing the plantar sensing system on their feet. The analysis found that a low value of the mean toe activity for multiple walking cycles was associated with high stumbling risk, irrespective of age, whereas large variations in toe activity was associated with aging. These results indicate that toe activity can predict stumbling risk irrespective of age. We also found that a large value of the maximum toe activity during multiple walking cycles indicates aging, whereas a low value is associated with high stumbling risk.

1. Introduction

The Cabinet Office of the Government of Japan [1] has reported falls as the fourth leading reason for elderly individuals above 65 years requiring support from caregivers. The demand for risk assessment to prevent falls increases with age. Fall risk assessment considers different types of factors [2]. This study focused on the motion of the plantar region, especially the toe area. Examination of the sole of the foot, or the plantar aspect, which is often conducted as a self-health check in Oriental medicine, is expected to reveal significant health-related information, such as irregularity in toe-area shape corresponding to stumbling risks. However, the number of observational methods used to obtain quantitative data is limited. Measurement systems for observing parts of the foot involved in walking are classified into two types.
The first type comprises pressure-sensor-based systems. Pressure profiles during walking can be obtained by embedding pressure sensors into the insoles found in every shoe. There are several commercially available pressure sensors for investigating the relationship between plantar pressure and walking speed [3,4], age [5], and foot type [6]. Majumder et al. [7] predicted falls using sensory data from a smartphone and four pressure sensors on a shoe. Ayena et al. [8] assessed the risk of falls at home using a system similar to that of Majumder et al. [7]. Yu et al. [9] developed a shoe system that monitored walking with shoe-integrated force sensors. Crea et al. [10] developed a pressure-sensitive insole based on optoelectronic technology.
The second type of measurement system comprises the inertial measurement unit (IMU)-sensor-based systems [11]. Hung and Suh [12] reduced the position error of shoes estimated by IMU sensors by utilizing additional camera information. Do and Suh [13] developed a walking measurement system that employed inertial sensors and a camera with floor markers to estimate step length and foot angle. An optical sensor was utilized in this case, although the targets did not correspond to plantar observation. Foxlin [14] tracked pedestrians with shoe-mounted IMU sensors. Ojeda and Borenstein proposed a personal dead-reckoning navigation system with a shoe-mounted IMU sensor. Sim et al. [15] proposed an algorithm to detect falls with acceleration sensors on a shoe. Rampp et al. [16] estimated a stride parameter that utilized IMU sensors on a shoe. Mariani et al. [17] used IMU sensors on a shoe to assess 3D spatial parameters of gait.
There are also systems that have both pressure and IMU sensors. Scheoers et al. [18] proposed a shoe fitted with force and IMU sensors. Bamberg et al. [19] proposed a wireless wearable sensor system with an accelerometer, a gyroscope, and a ground force reaction sensor embedded in a shoe. Bebek et al. [20] developed a personal navigation system with pressure and IMU sensors, while Chen et al. [21] detected an abnormality in shoes with four force and IMU sensors. Hegde et al. [22] developed the SmartStep shoe with embedded pressure and acceleration sensors. Kawsar et al. [23] presented an activity detection system that utilized pressure data from a shoe and accelerometers and gyroscope data from a smartphone.
Several studies have focused on toe plantar flexor strength, which is closely related to toe activity. Tsuyuguchi et al. [24] and Kim et al. [25] showed that toe grip strength is an independent risk factor for falling. Mickle et al. [26] showed that the reduction of toe flexor strength and the presence of toe deformities increased the risk of falling among older people. Hiura et al. [27] investigated the relationship between walking ability and falls in elderly Japanese people. Their results showed that lower toe-gap force was significantly associated with falling. Uritani et al. [28] presented a study showing that timed up-and-go test (a measure of functional ability) results were significantly correlated with toe grip strength. Branthwaite et al. [29] assessed the effect of toe flexor exercises on apical plantar pressure, and showed that such exercises can improve forefoot stability and gait efficiency. Takatori et al. [30] showed that the toe elevation angle of participants who had experienced a fall was significantly smaller compared with that of participants who did not fall.
Plantar pressure is another important indicator in walking evaluation, such as for the diagnosis and determination of the course of a disease. Bus et al. [31] showed that the claw/hammer toe deformity is associated with a distal-to-proximal transfer of load in the forefoot, and elevated the plantar pressure at the sub-metatarsal heads in neuropathic diabetic patients. Morag et al. [32] developed predictive models to identify the potential etiological factors associated with elevated plantar pressure. Payne et al. [33] investigated the factors associated with increased plantar pressure on the diabetic foot. Buldt et al. [34] compared plantar pressure among healthy individuals with normal, planus, or cavus feet. Mickle et al. showed that high plantar pressure may increase the risk of falls.
However, the above observation methods can provide only specific data, including pressure or IMU data; thus, they yield a limited amount of information. Examples of unobservable information obtained by conventional measurements include accurate contact area, skin deformation, and skin color. It is difficult for pressure sensors to detect or identify the exact contact area when the load is low (for example, during the swing phase). Thus, we propose a novel wearable sensing system for direct observation of the plantar aspect while walking on any surface and condition [35]. The plantar image is reflected by a reflective film and captured by a camera embedded in a clog (shoe). Passive joints are embedded in the camera holder and around the tarsometatarsal joints to facilitate walking while wearing the system. However, the main contribution of this sensing system is the investigation of fall or stumbling risks, which were not considered previously. As a first step, we focus on toe activity, which is closely related to walking issues such as stumbling, which in turn is directly connected to falling [36,37]. We did not find research that collected and analyzed visual data on toe movements in the above literature, because of the difficulty in directly obtaining visual data from the sensor. The utilization of the developed system is expected to provide clearer information on toe movements, especially in the swing phase. The movements in the swing phase are difficult to observe by conventional IMU or pressure sheet sensors.
In this study, we investigated the relationship between toe-area activity and stumbling utilizing the developed sensing system. Specifically, we identify the features of toe-area activity while walking in elderly people with a history of stumbling. The main difference of this study from the previous one [35] is the utilization of the sensing system. The previous study provided only primary results among young male participants, whereas this study investigated the effects of aging to identify new features of walking in elderly people with a stumbling history. We also improved the sensing system. The difference between the actual sensing system and previous system [35] is the data processing method: the partially manual data processing used in the previous study was changed to fully automatic data processing to determine the contact area in the toe and the corresponding criterion for evaluation. The remainder of this paper is organized as follows. Section 2 presents the developed clog-integrated plantar visualization system. The experimental investigation and data analysis method for evaluating toe activity are presented in Section 3. The results are provided in Section 4 and discussed in Section 5. A summary of the study is presented in Section 6.

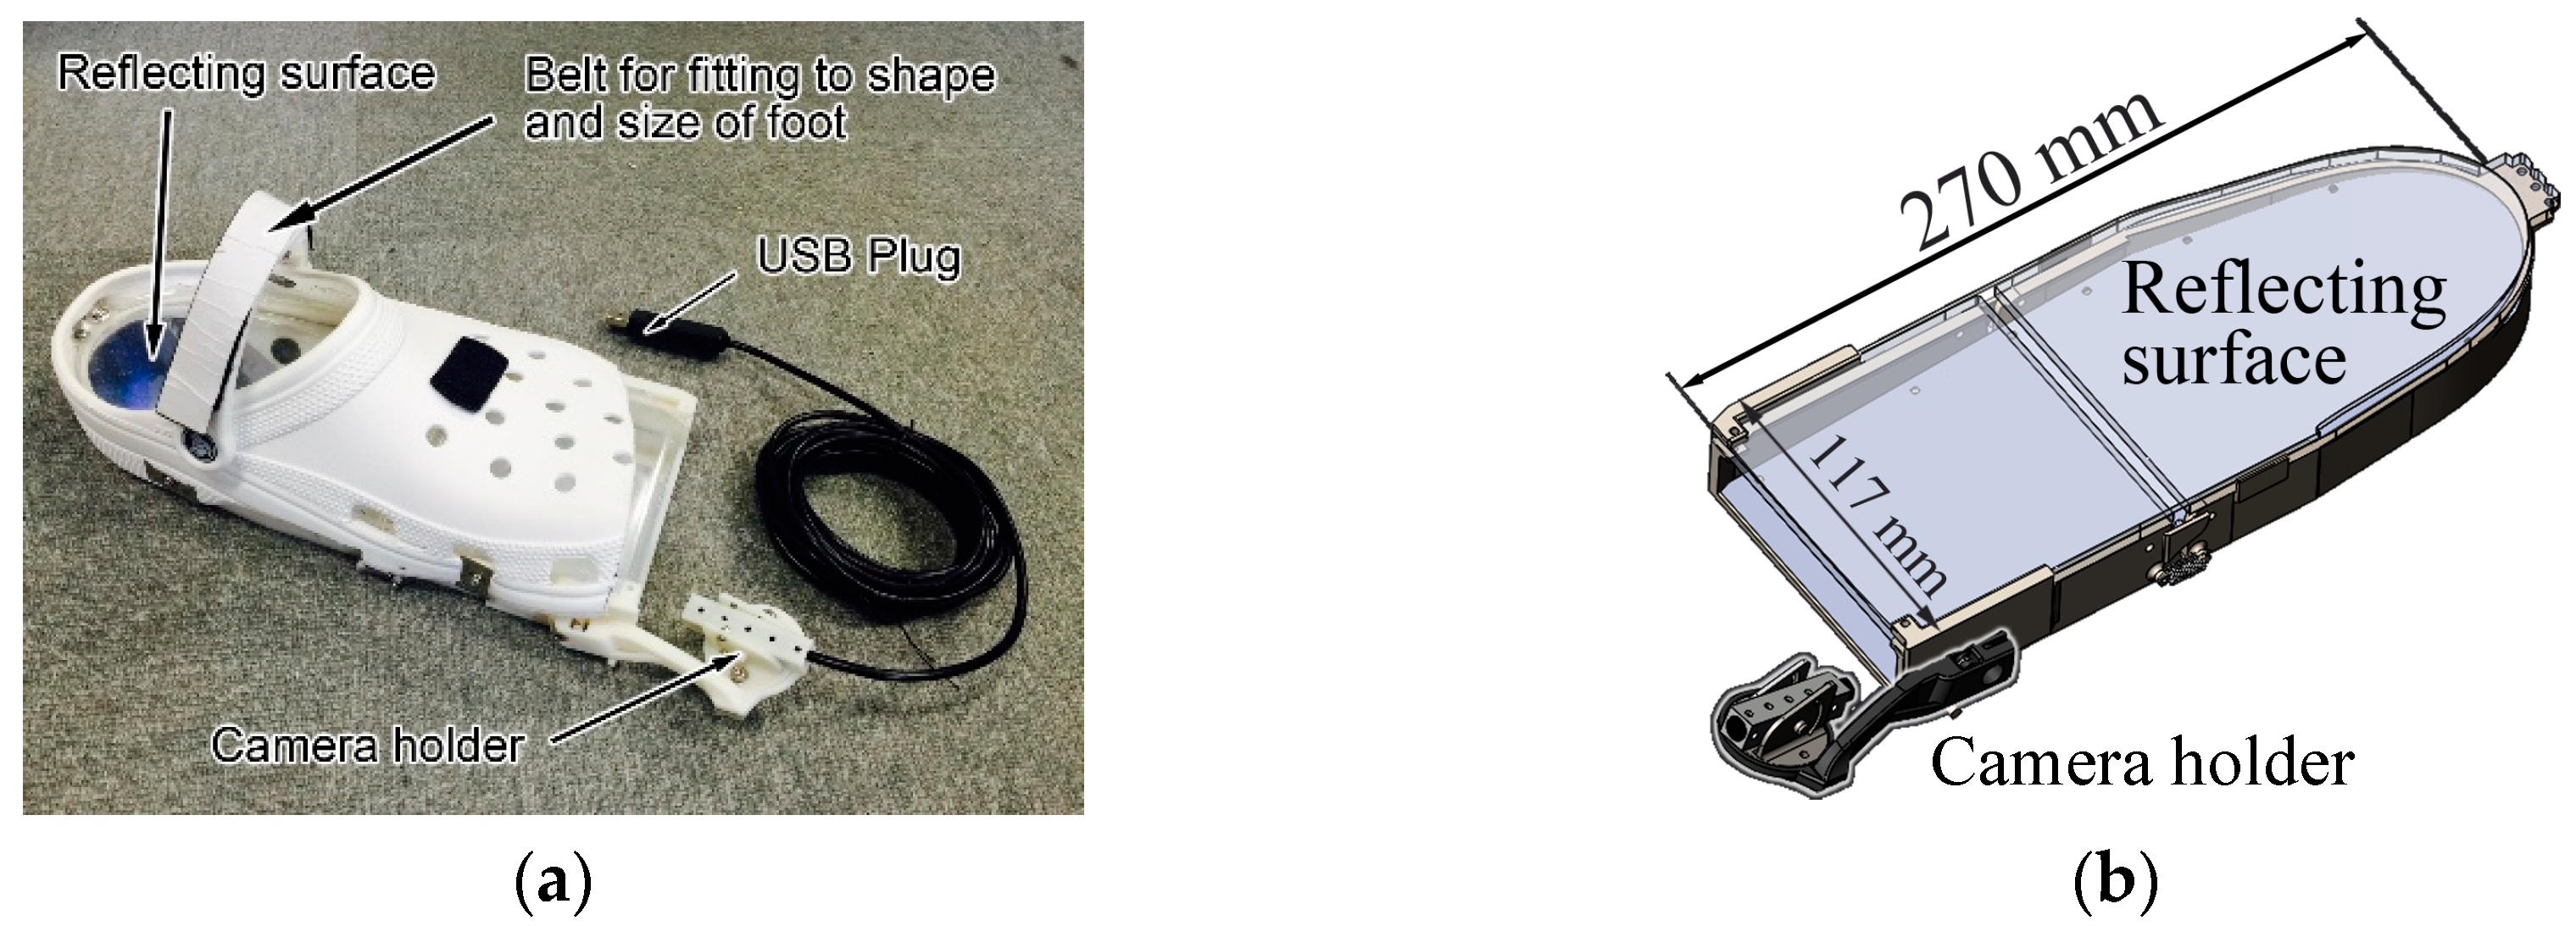
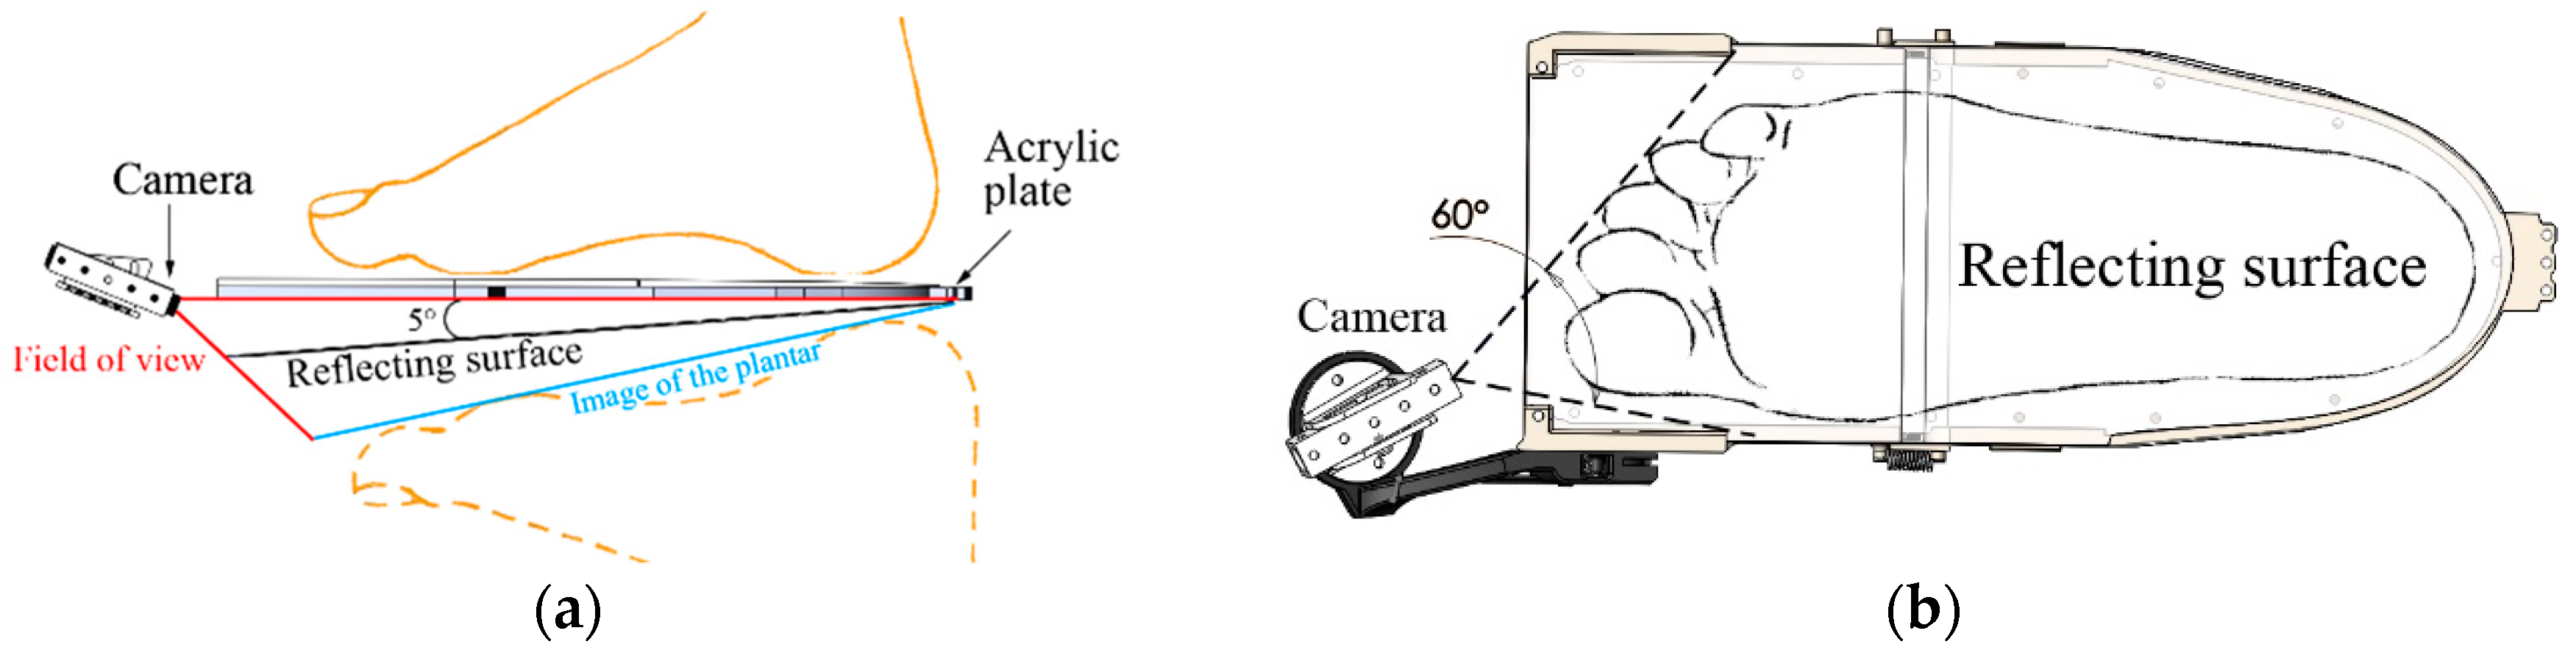
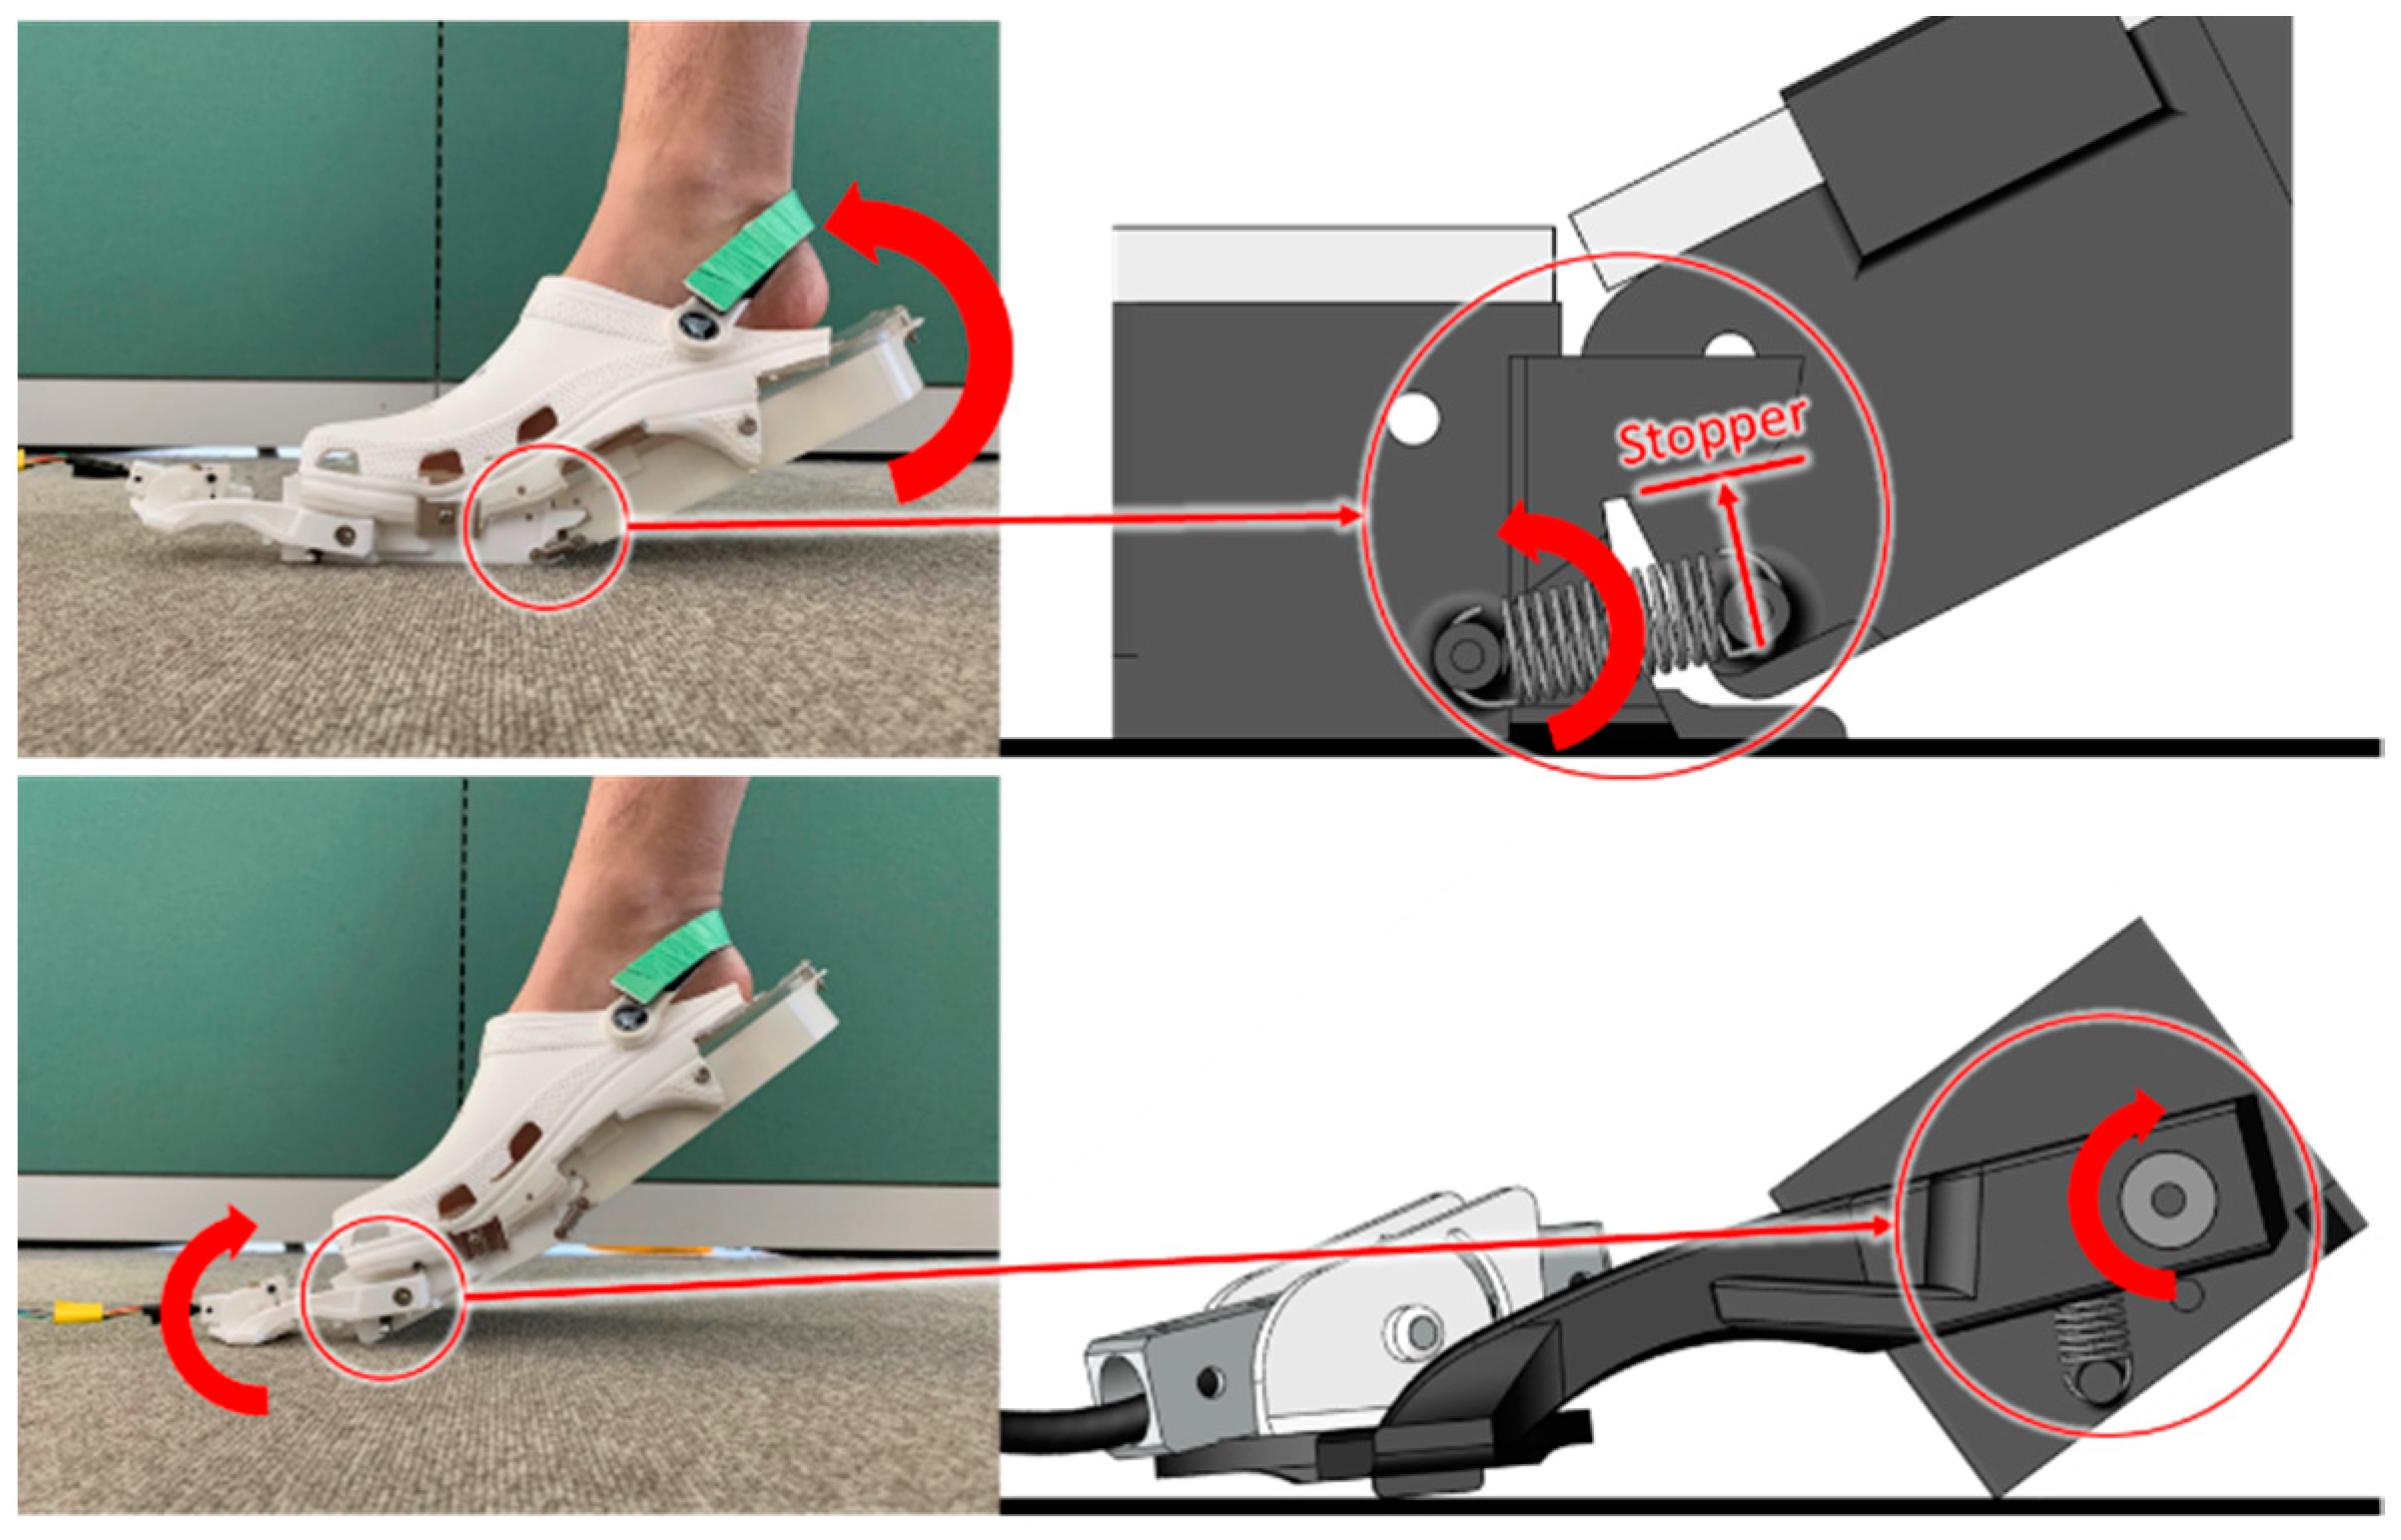
2. Clog-Integrated Plantar Visualization System

Overview of the System

Figure 1a shows an overview of the sensing system. The system was constructed by covering the sensing area, shown in Figure 1b, with the upper part of the clog (Crocs, Niwot, CO, USA). A schematic view of the lower part (sensing area) of the system, which consists of a reflecting surface and camera, is shown in Figure 1b. The image of the plantar aspect was reflected by the reflecting surface and captured by the camera fixed at the holder. Transparent silicone and acrylic plates were utilized as the foot sole to enable visualization of the planta. The sensing area was surrounded by a frame manufactured by a 3D printer (Raise 3D N2) to support the weight of the wearer (exerted through the acrylic plates) and minimize the total weight of the clog.
A schematic illustration of the sensing system is shown in Figure 2. The embedding of the camera to capture the visual information from the plantar aspect was a crucial step. Positioning the camera at the bottom of the clog for direct visualization of the planta is difficult because the space under the insole is very narrow. If the area under the plantar aspect is too thick, it becomes difficult to walk, which makes the observation of walking difficult. Multiple cameras or a camera with an extremely wide field of view and short focal length could be utilized in this setting. However, the use of multiple cameras is unsuitable because they should be sufficiently small to be embedded into or attached to the bottom space of the clog; the processing costs would also increase. Thus, the use of only one camera is ideal to reduce costs and simplify the system. The reflecting surface was placed at the insole of the clog while the camera was set outside the clog to capture the reflected plantar image (Figure 2). The camera was positioned in such a way that the main target areas could be clearly observed. Usually, the heel area of the foot is utilized only during heel-strike, and not during push-off or other swing-phase parts (see Figure 3 for the definition of phases and their components). Therefore, the primary observation target is the toe area, particularly the big toe used during push-off motion.
An endoscopic camera (GIWOX; resolution: 640 × 480 pixels, focal length: 6 cm to infinity, angle of view: 60°) with a short focal length was utilized to obtain a wide field of view. A 0.6 mm thick reflecting film was utilized to ensure that the thickness of the clog sole was close to its original thickness. Sequential images showing a single walking cycle are presented in Figure 3. The toe area is visible in all phases, while the heel area (dark area in the figure) is visible at heel-strike.
Two passive joints were embedded into the clog (Figure 4). One was installed in the clog near the tarsometatarsal joints to minimize the effect of the 3D-printed solid part on walking and enable the foot to bend naturally. The maximum allowable joint angle was set to 40°. The heel area cannot be observed during push-off because of the passive joints. The other passive joint was installed where the holder is attached to the clog to minimize the disturbance on walking by the camera holder. The camera holder rotates during push-off and the heel area is not observable.
The system currently costs less than $70, and the sensor for one foot weighs 448 g (the weight of the original clog is 190 g). The camera cable was connected to a Wi-Fi transmitter (F99 WIFI; weight: 27.5 g, size: 63 × 35 × 18 mm3) with a built-in battery, which was attached to the shank of the wearer to wirelessly transmit the captured images. The electric power reserve of the sensor was sufficient to complete a test lasting approximately 1 h. Hence, the proposed system has the potential for use in a wide variety of experimental environments.

3. Methods

3.1. Participants

The participants were 13 young and healthy individuals (nine men and four women, age 22.4 ± 2 years, weight = 58.3 ± 10.6 kg, height = 165.6 ± 8.9 cm, and foot size = 24–27 cm), and 9 elderly individuals (five men and four women, age 65.3 ± 2 years, weight = 61.4 ± 10.9 kg, height = 163.6 ± 10.8 cm, and foot size = 24–27 cm) without any diseases, impediments, or history of walking problems. The procedure and purpose of the experiments were approved by the Medical Ethics Committee of Kanazawa University (No. 33). Information on the stumbling experiences of participants were obtained via a questionnaire; individuals who had stumbled within a period of three months were designated as individuals with stumbling experience. The participants were separated into two groups according to their responses: those without stumbling experiences (eight young and five elderly individuals) and those with stumbling experiences (five young and four elderly individuals). The toe-area activities of the two groups were compared. The information on participants is summarized in Table 1.

3.2. Procedure

The participants walked a straight line along a 6.5 m long flat road wearing the developed plantar sensing system on their right foot and a normal shoe on their left foot. The thickness of the sole of the left shoe was the same as that of the sensing system so that there was no impact on walking. There was initially a start and stop zone, measuring 1 m each; and the walking data obtained in the remaining 4.5 m, which corresponds to three walking cycles, were analyzed. The camera cable was attached to the leg of participants to avoid disturbing the walking motion. Before the experiment, we conducted a practice session enabling participants to adapt to the plantar sensing system. This minimized the effects of differences between the left and right footwear on the results. The participants practiced walking while wearing the experimental system until they could walk normally without the feeling of strangeness, and the motion of the left foot (wearing a normal shoe) was close to that of the right foot (wearing the developed sensing system). The practice session was also aimed at minimizing the effect of the camera holder on walking. We determined the position and angle of the camera based on the principle of specular reflection and the horizontal angle of view of the camera. Before each experiment, we controlled the camera position and angle so that the image captured includes all the areas of the forepart of the foot and was focused. We also checked whether the average image intensity was in the range of the desired reference values:   0.53 ± 0.02 , which were determined through trial and error based on the results of preliminary experiments. If not, we adjusted the camera’s auxiliary brightness so that the average image intensity was within the desired range. With these methods, we obtained the plantar images for all the participants under almost the same illumination conditions and foot positions. The participants were instructed to walk while facing forward as much as possible to avoid looking at their feet during the experiment. Each participant performed the experiment three times; thus, we analyzed nine walking cycles for each participant.

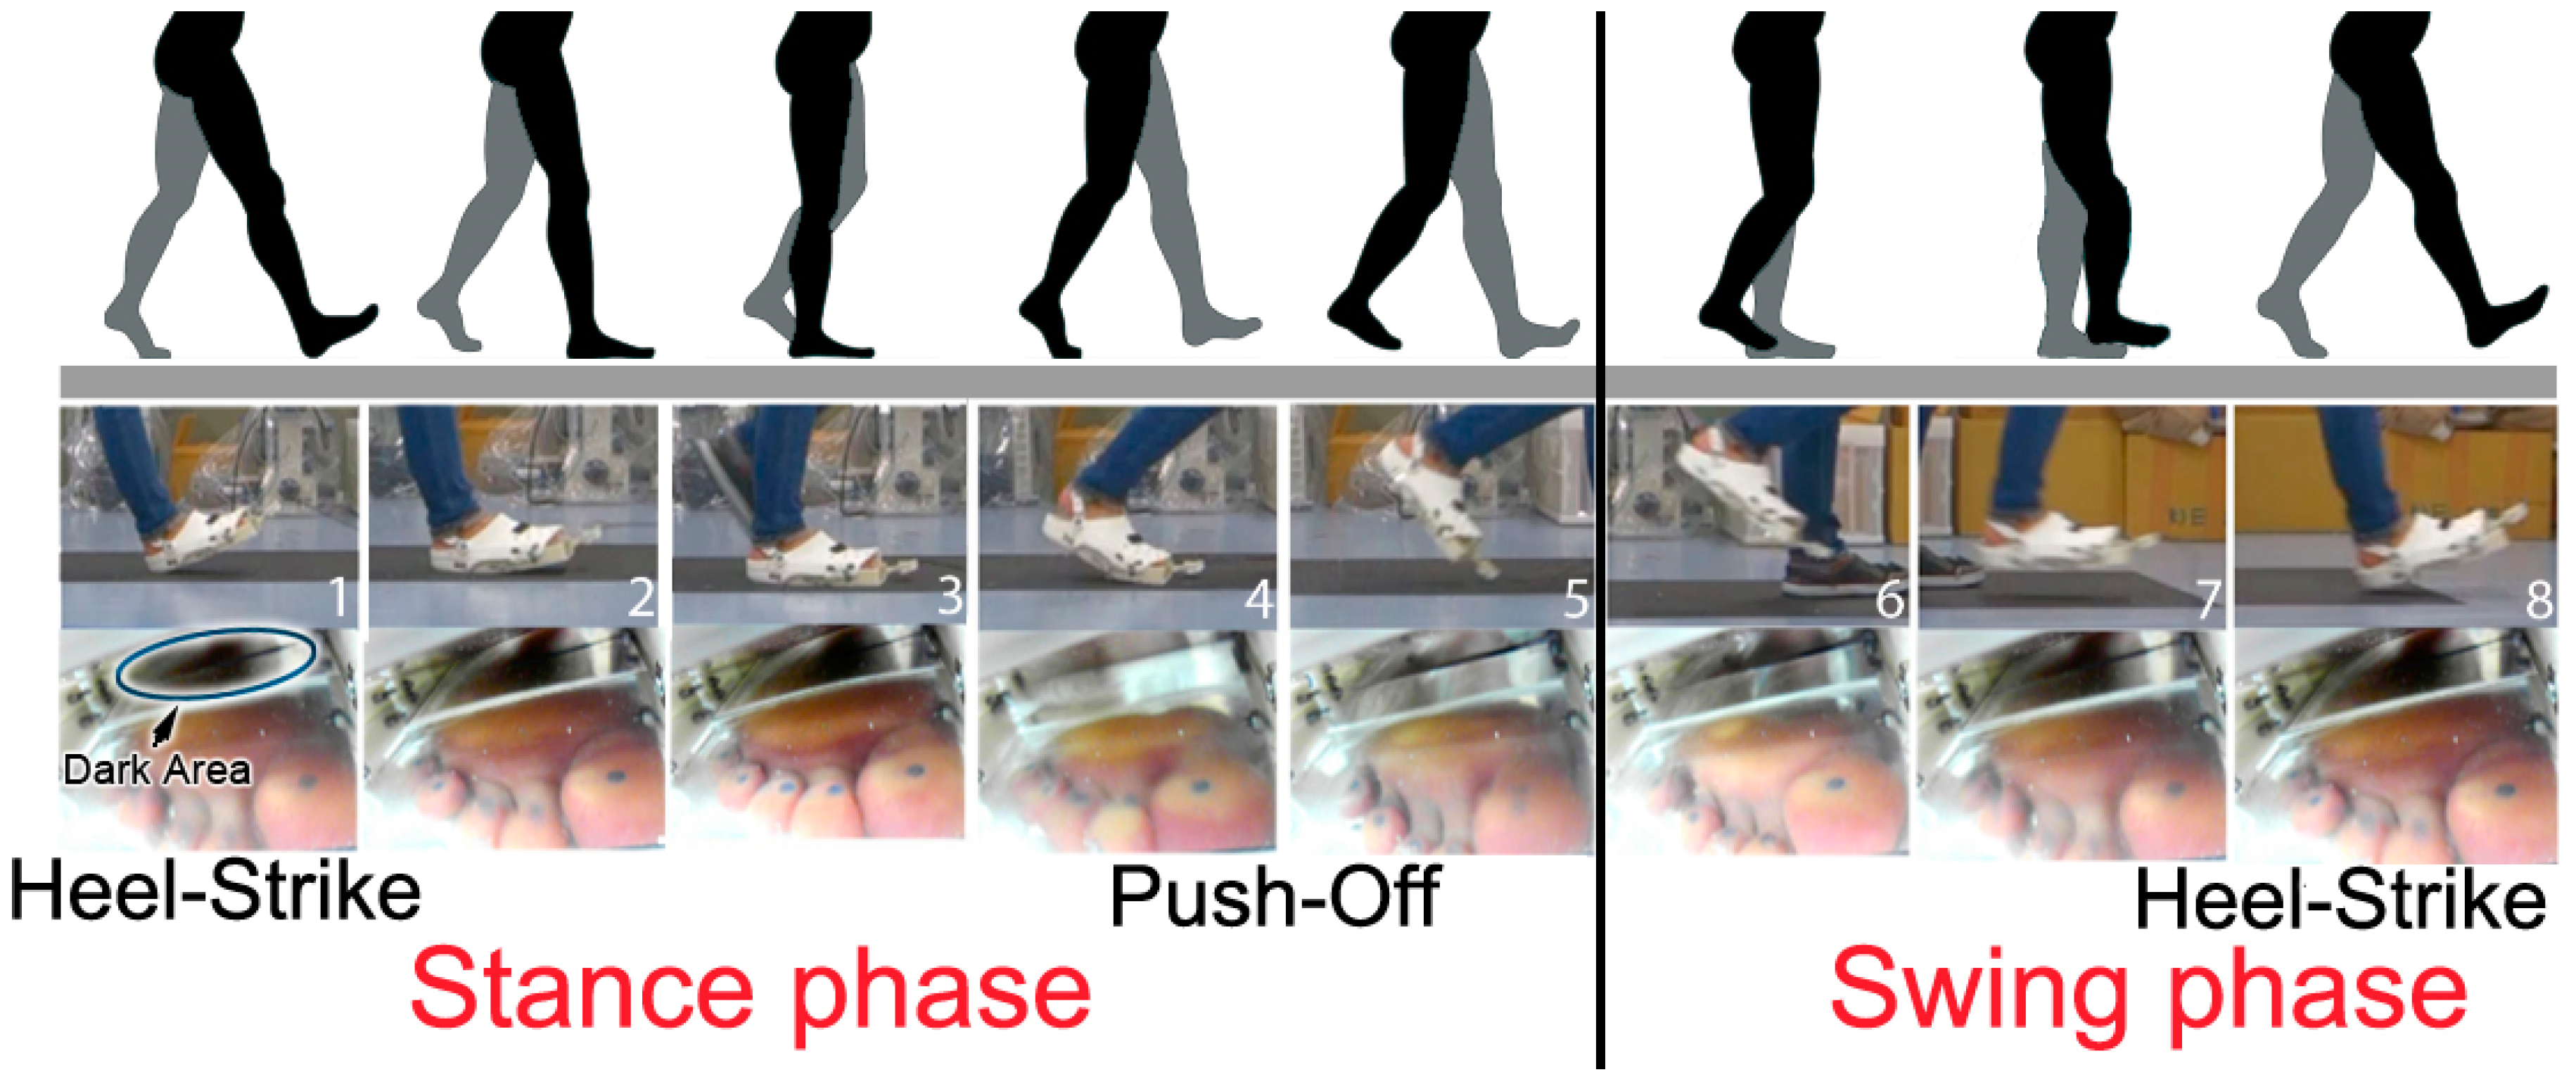
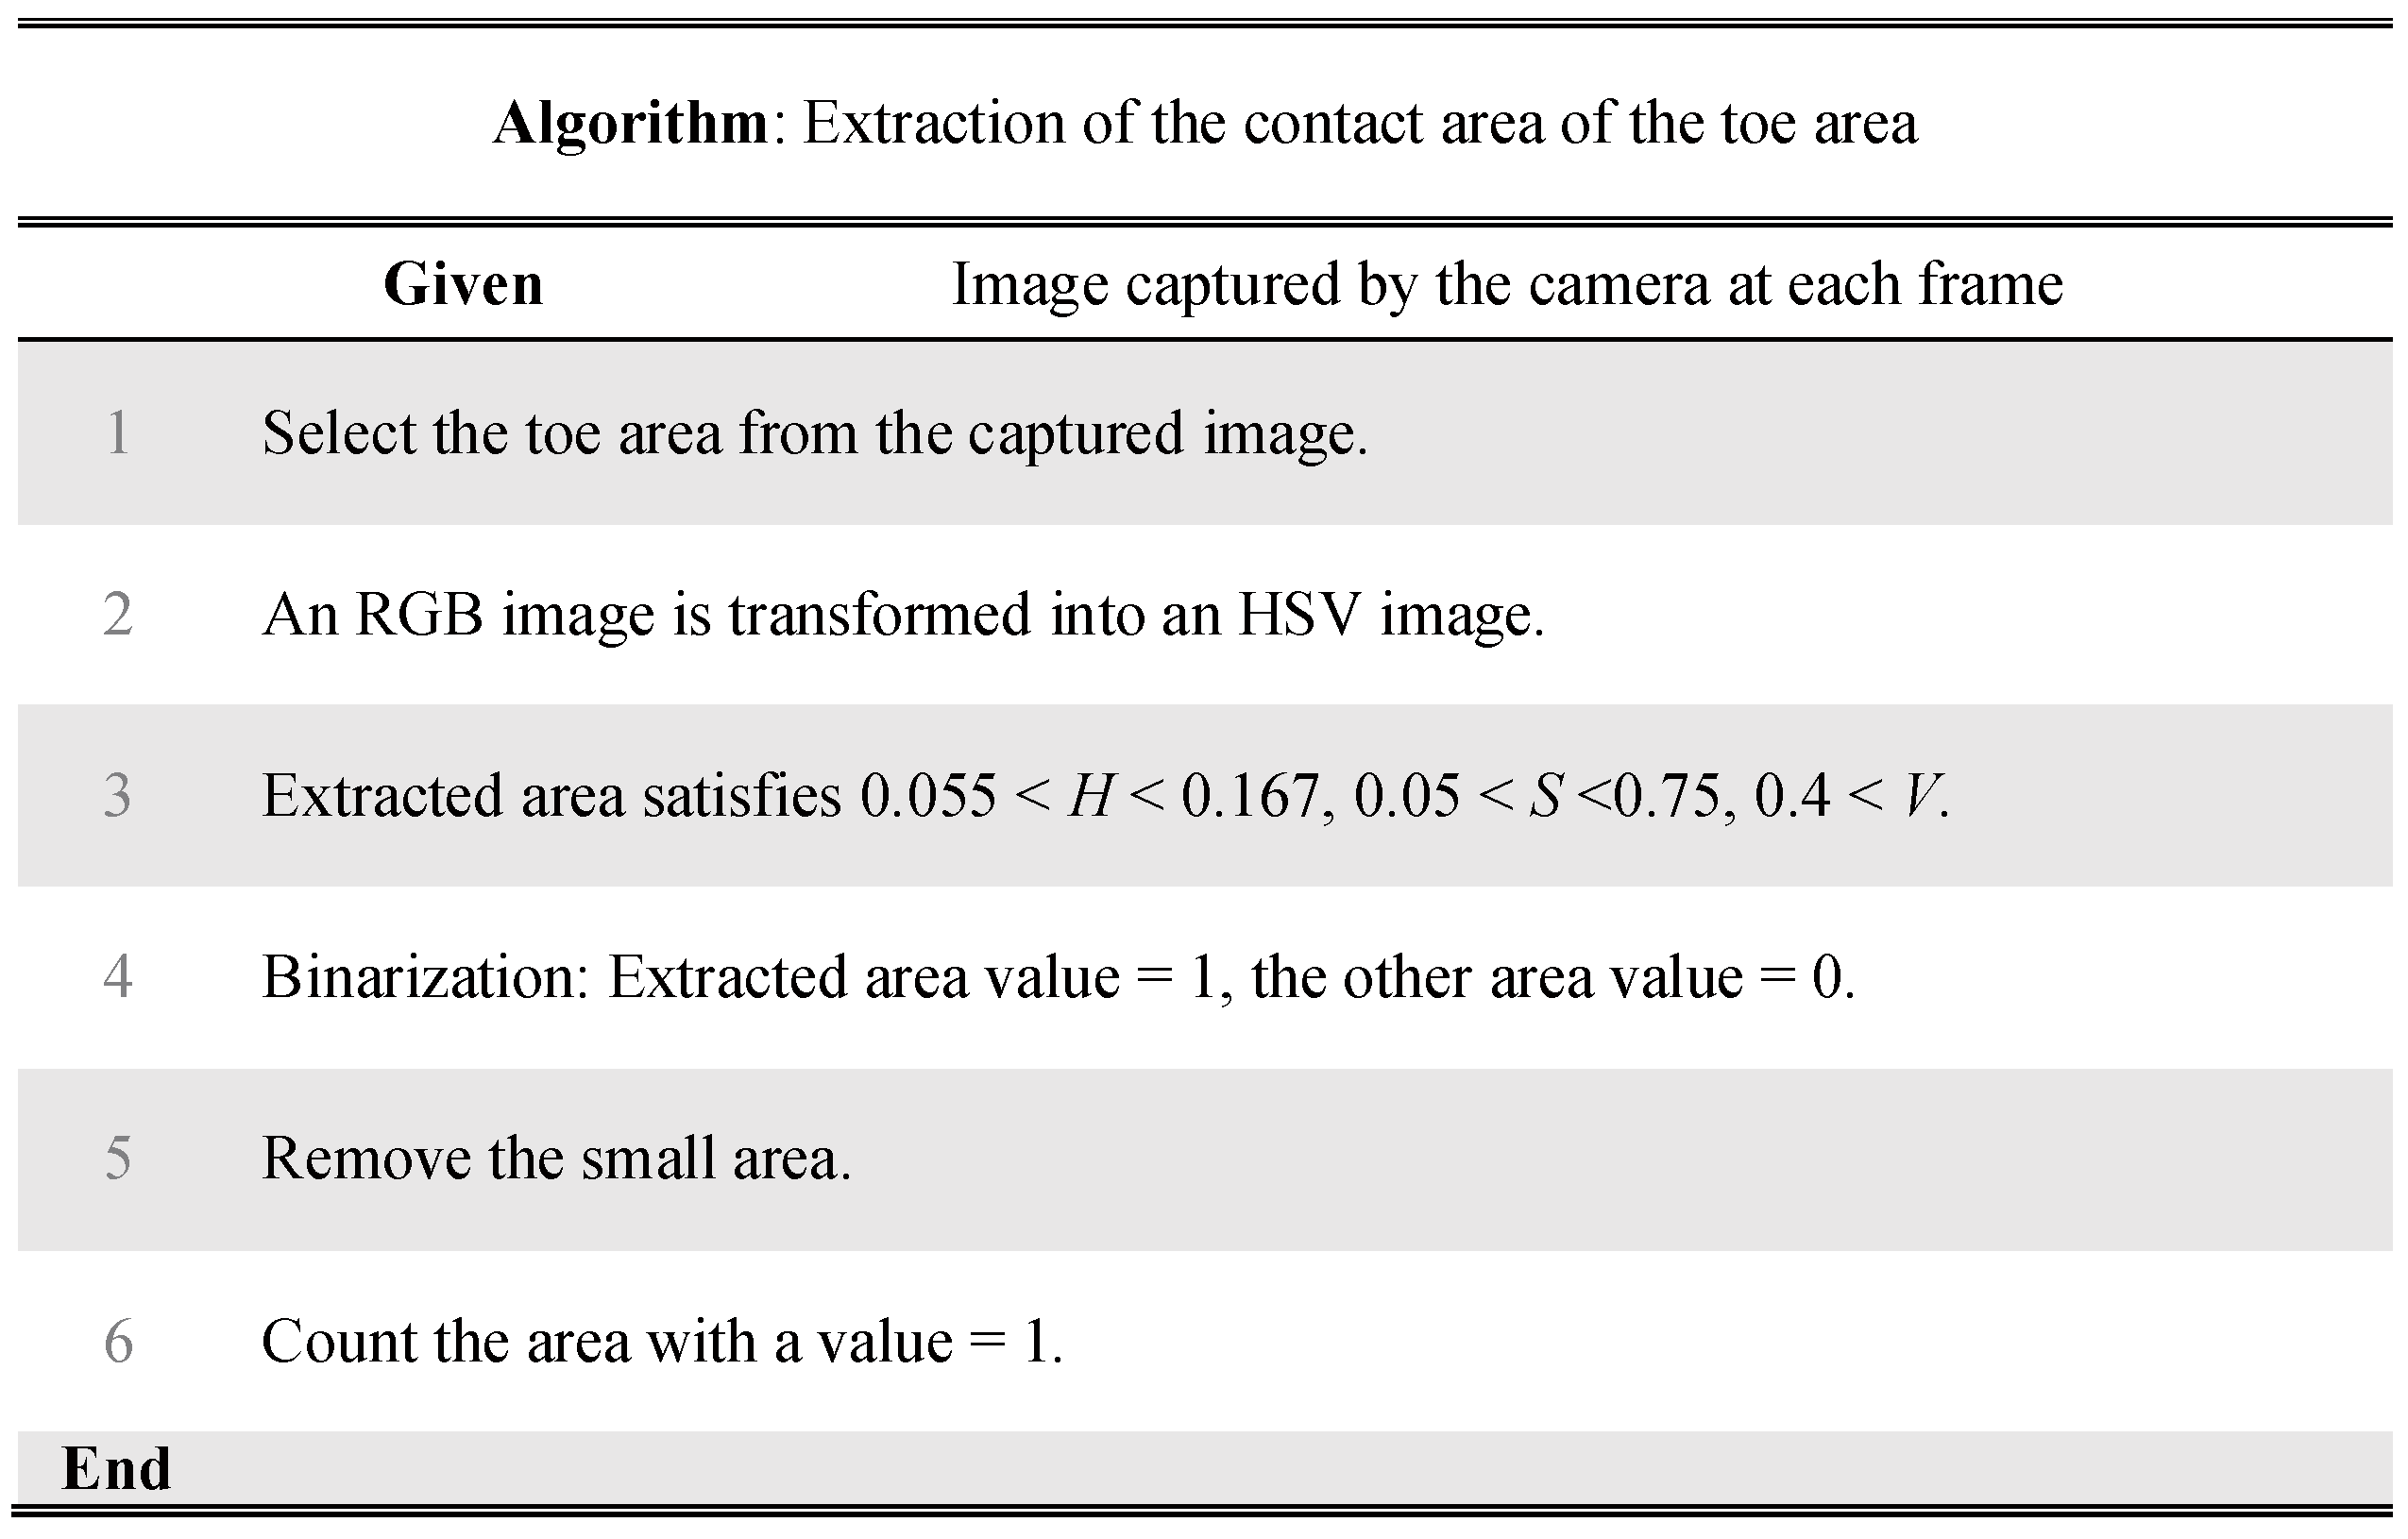
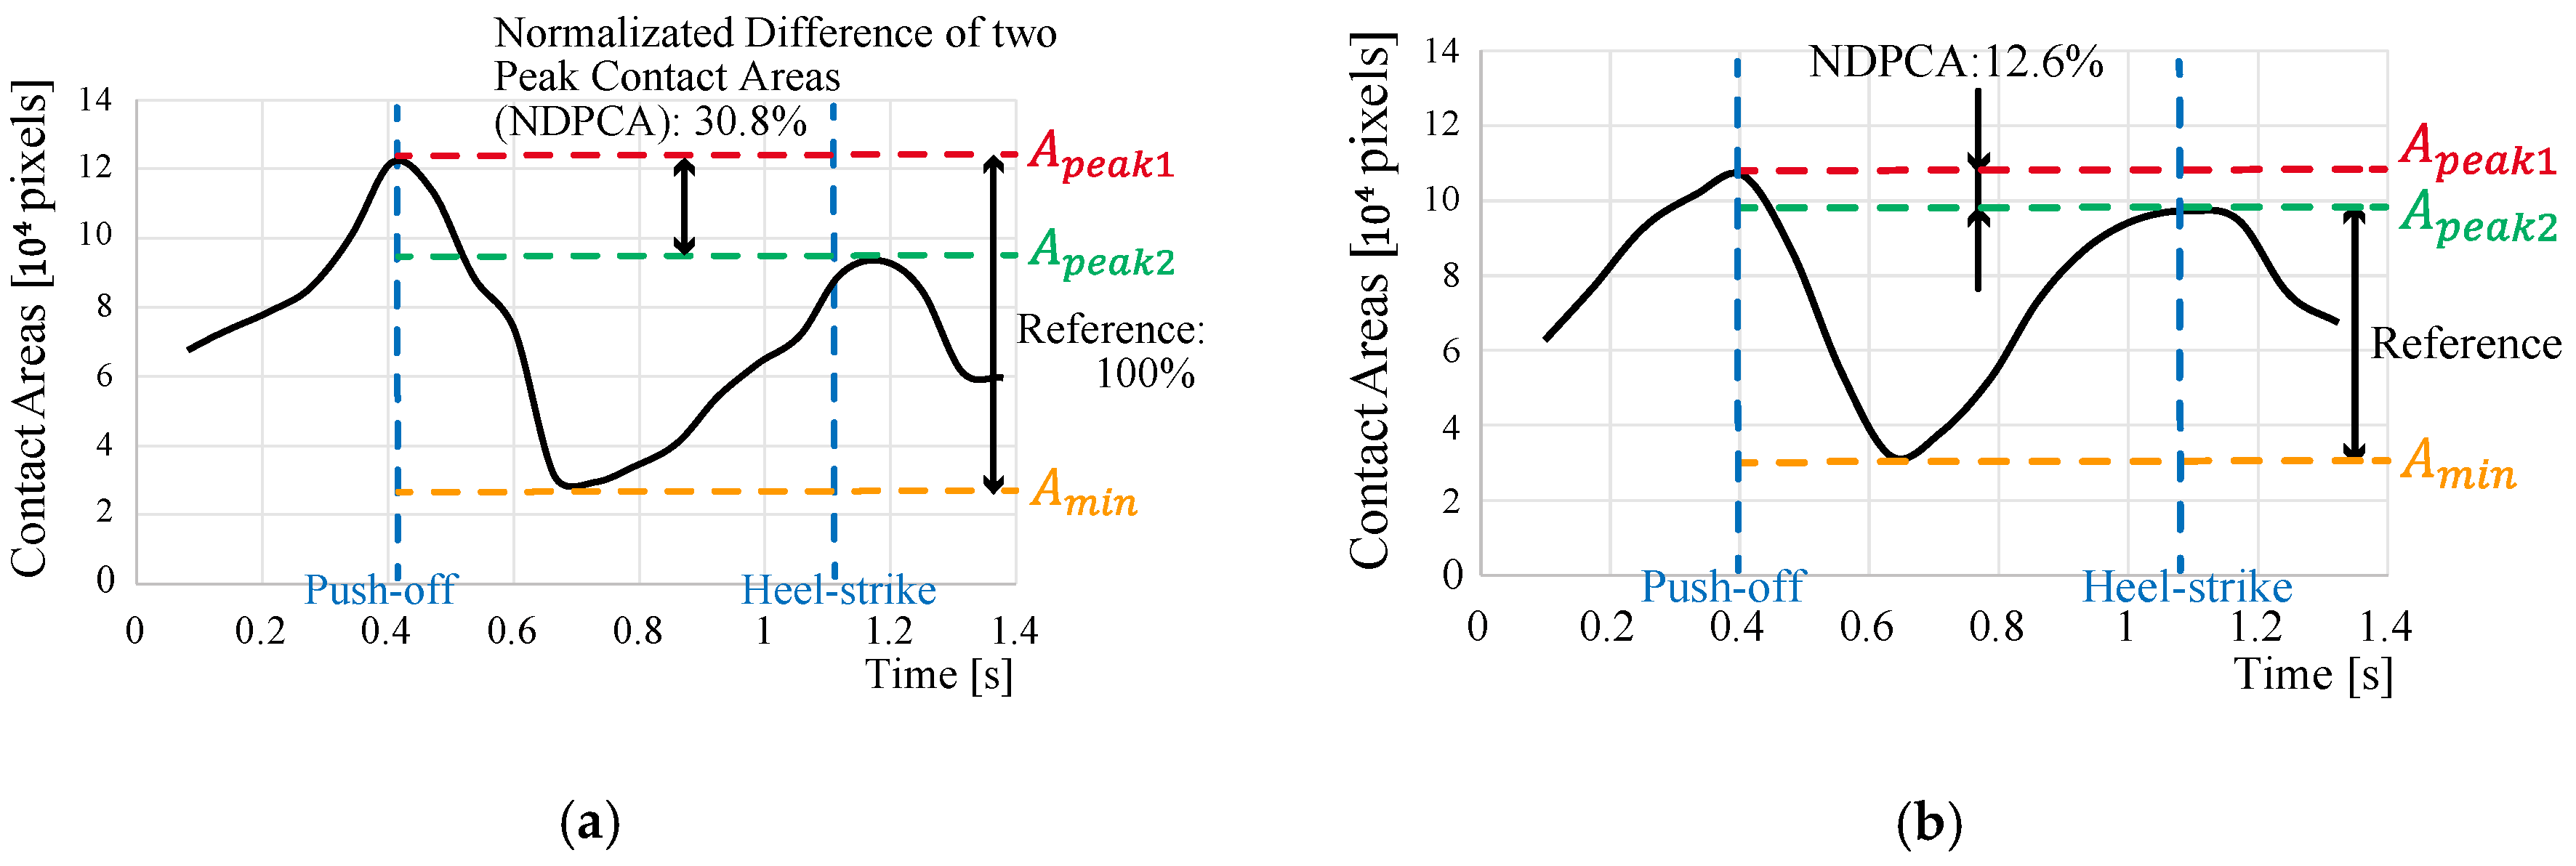
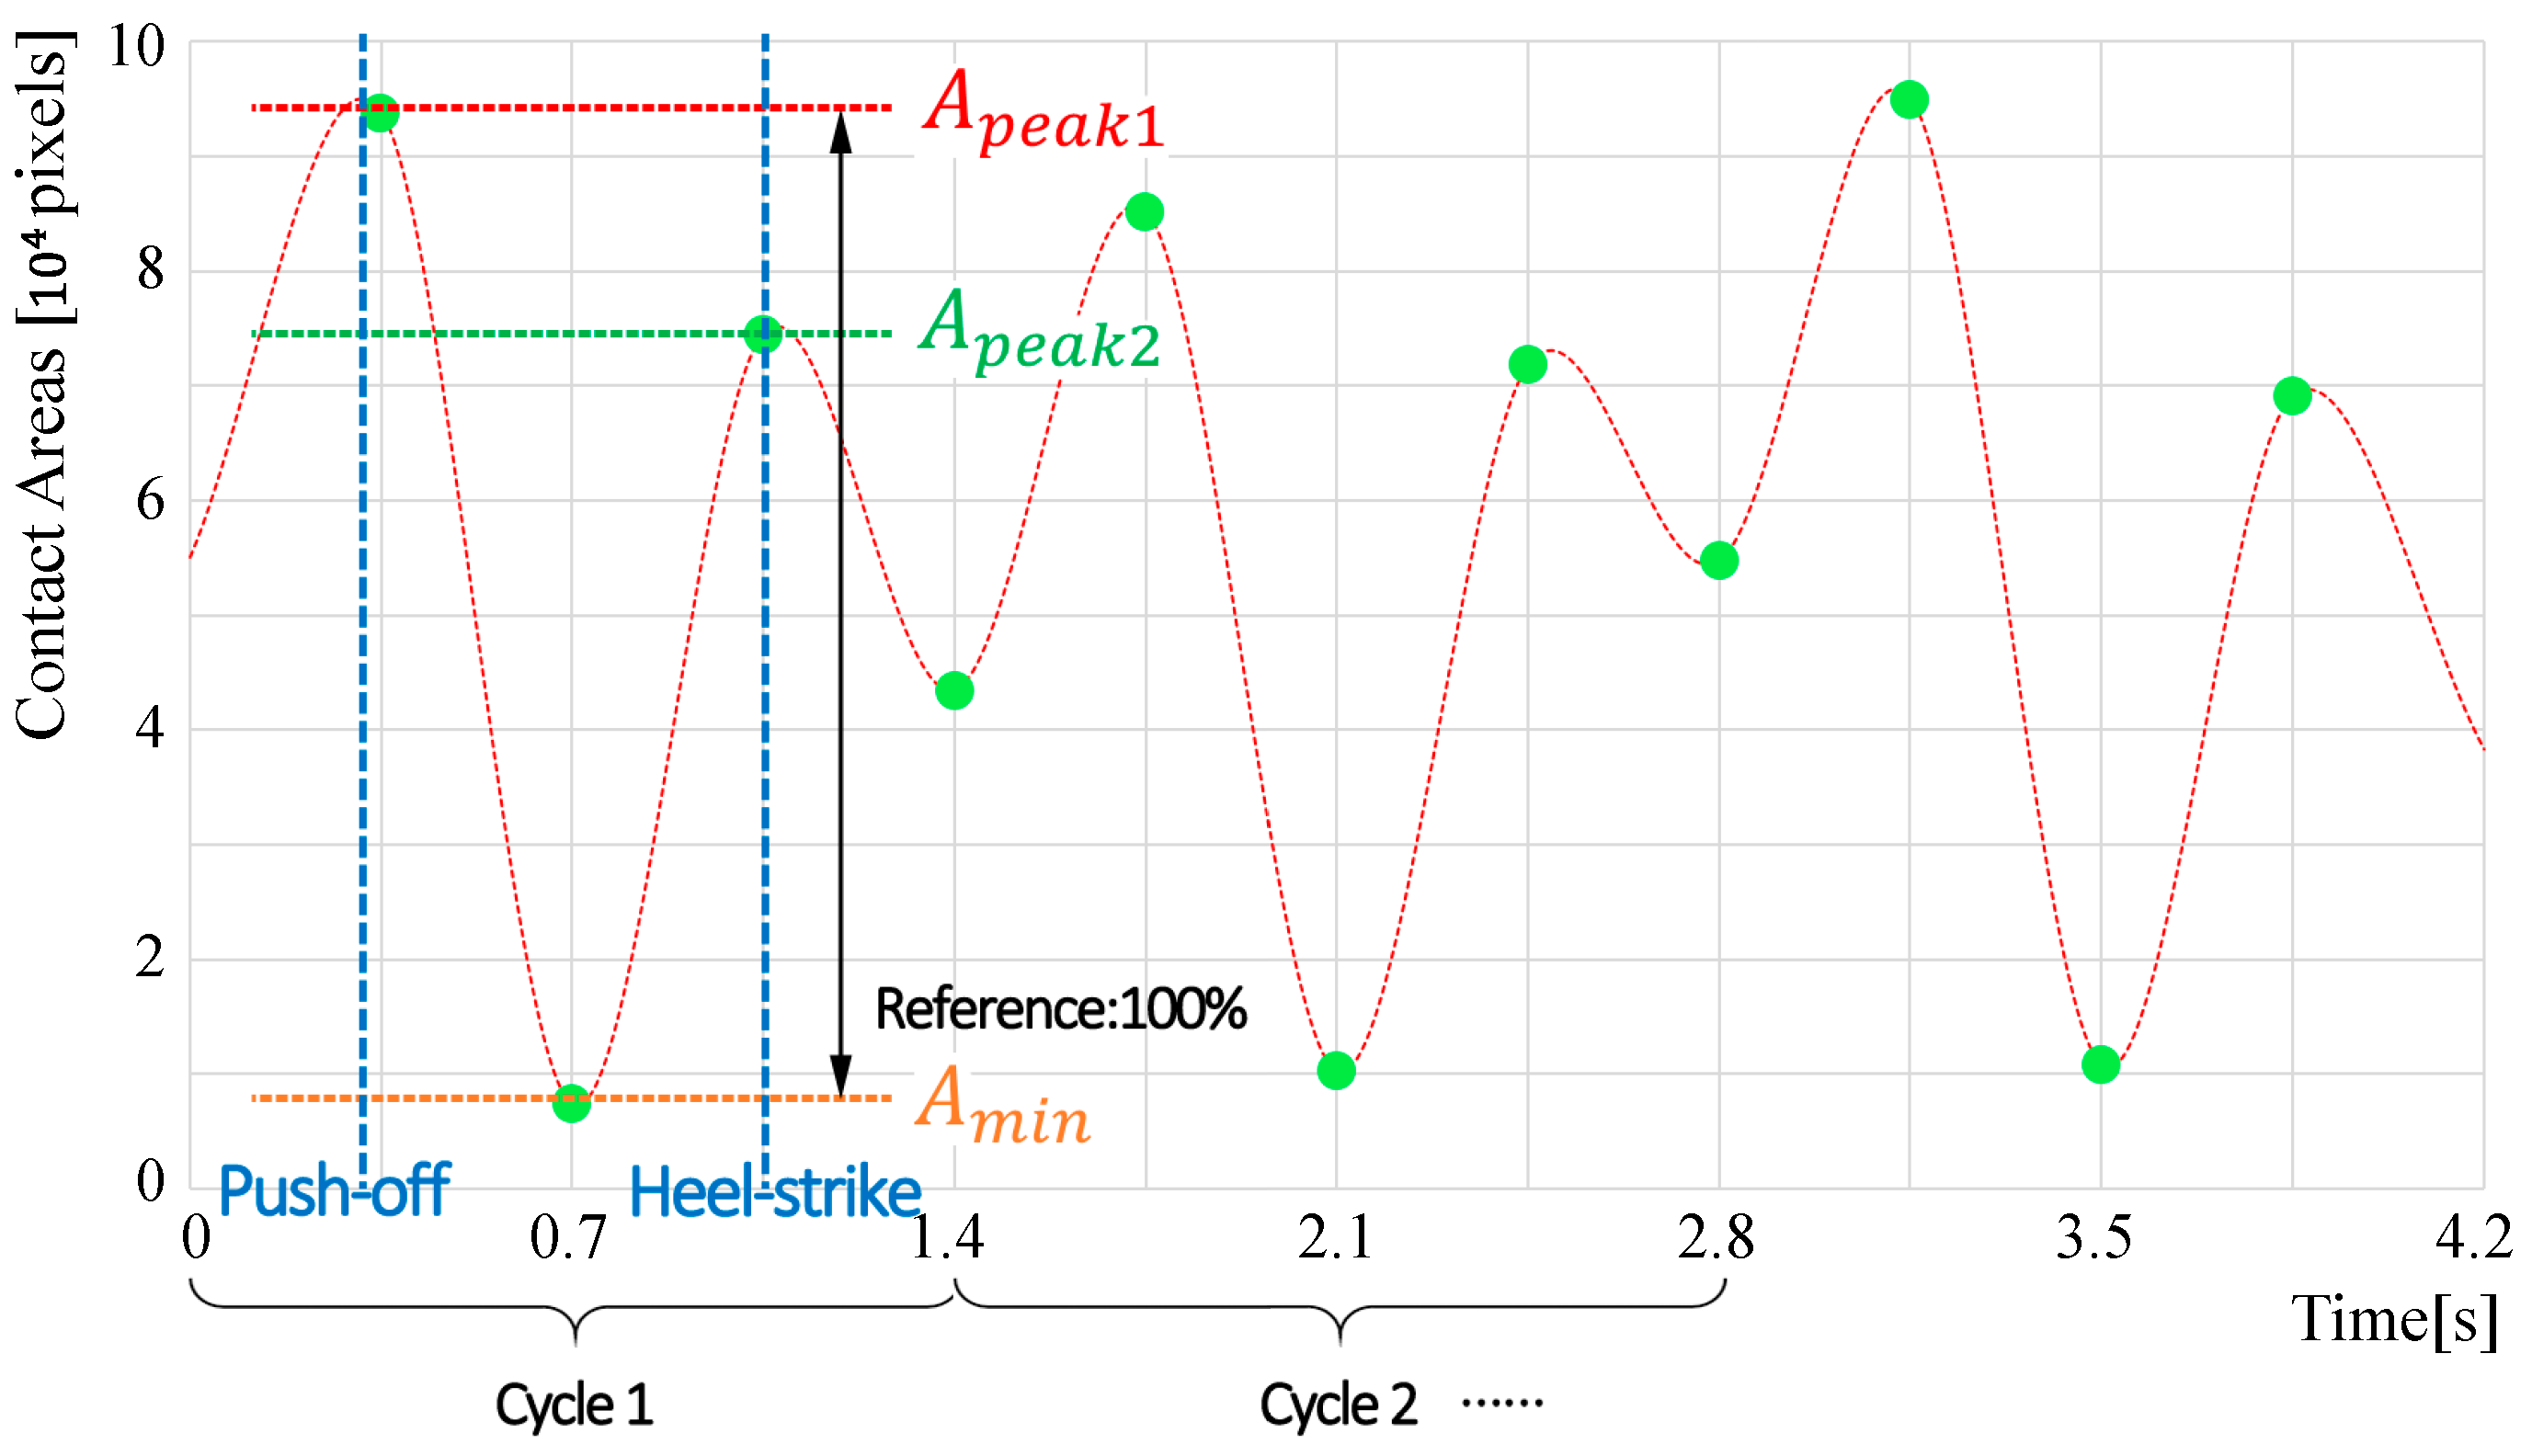
3.3. Data Analysis: Toe-Area Activity
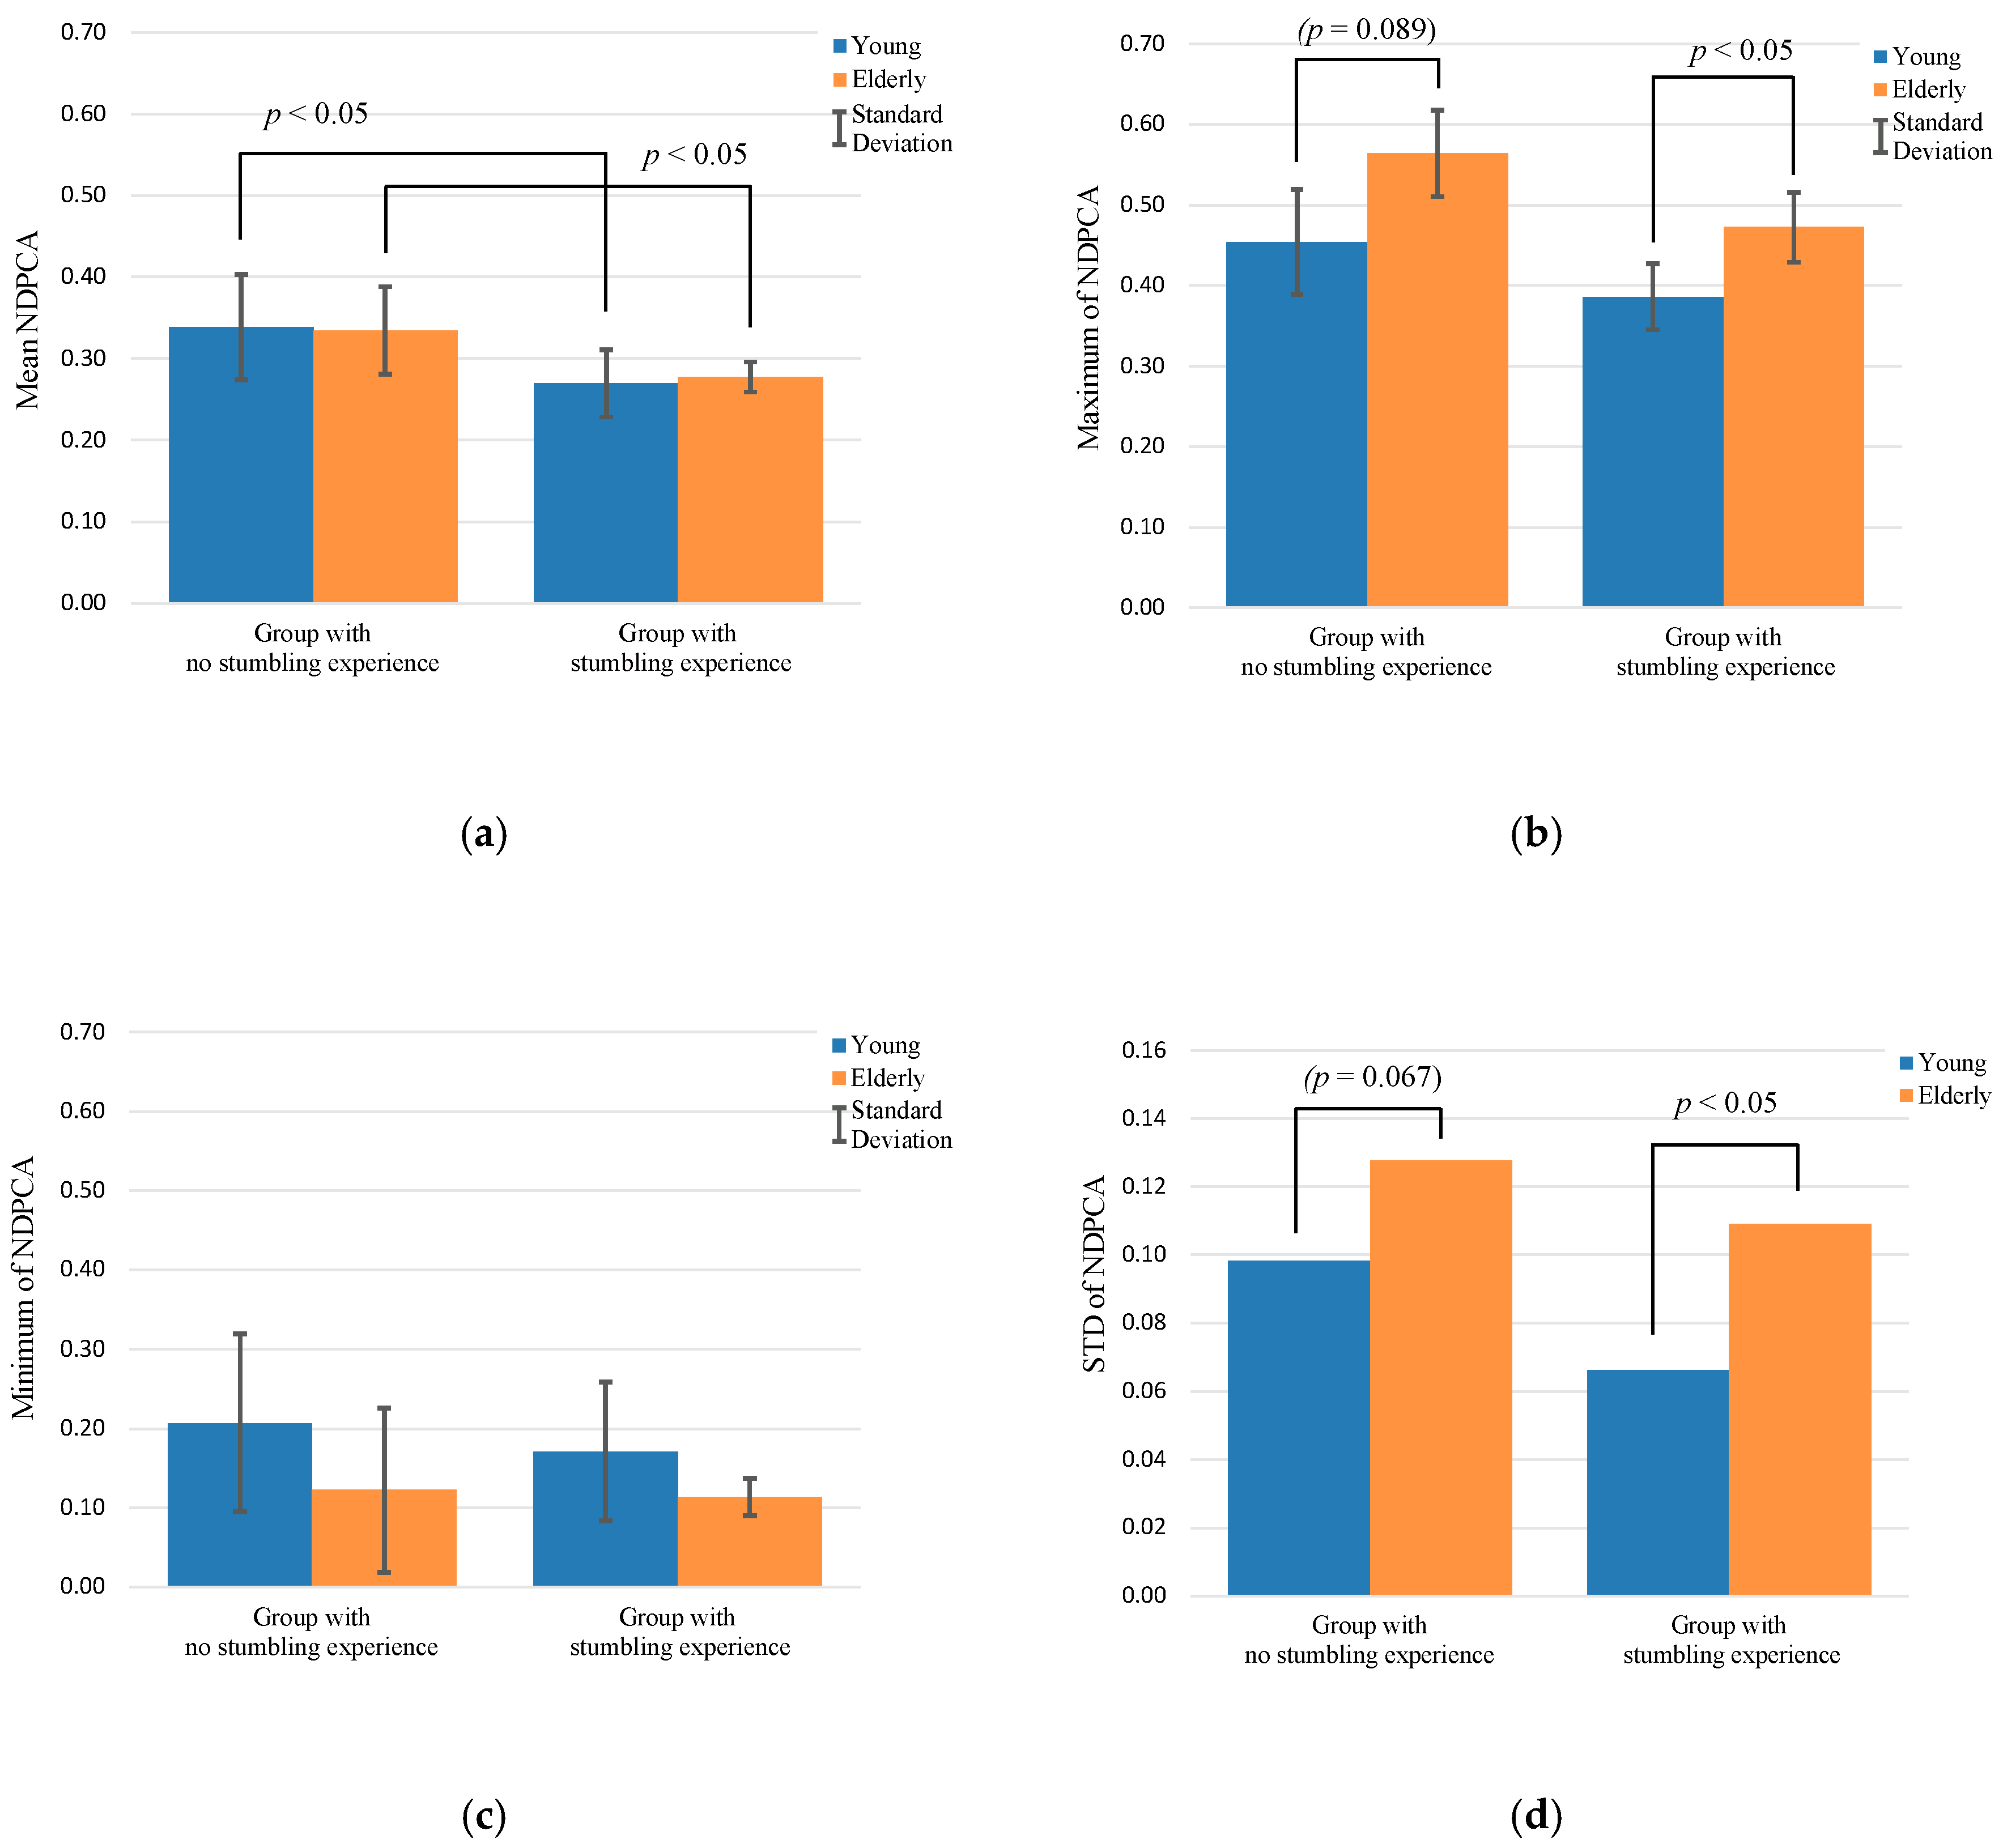
First, each frame containing the toe area was extracted from the captured video streams. Second, the toe area was extracted from the image frame and evaluated. Third, the contact area in the toe area was derived. The information about the contact area was obtained using the skin color of the bare foot. The skin turns white when in contact with something because the blood flow inside capillary vessels is blocked. Thus, the white area in the image corresponds to the contact area. The RGB (red, green, blue) image was transformed into the hue, saturation, value (HSV) image, and the extracted area that satisfied 0.055 < H < 0.167 ,   0.05 < S < 0.75 ,   0.4 < V corresponded to the white area. It should be noted that the contact area can be detected by the naked eye. Therefore, the range of H, S, V values for detecting the contact area was manually determined through trial and error, utilizing sample images obtained at preliminary experiments. The same range of HSV values was applied to all the data for all participants. Fourth, using binarization, the extracted area was assigned a value of one, whereas the other areas were assigned a value of zero. Finally, the small noise area was removed. Figure 5 outlines the overall procedure. Figure 6 shows the time series for the contact area in the toe area for the two young study groups over one walking cycle in a single trial. The first peak resulted from pushing-off before taking-off, while the second peak indicates the heel-strike. The difference in the values of the contact areas at the two peaks was large for the group with no stumbling experiences and small for the group with stumbling experiences. We assumed that the former group moved or rotated their toes while pushing off, thus increasing the contact area, whereas the latter group did not. We examined the difference in the two peaks corresponding to toe-area activity, called the difference of two peak-contact areas (DPCA). The DPCA was normalized for variations in the width of the contact area (Figure 5) to compare the value for each group considering individual differences. The normalized DPCA (NDPCA) is defined as follows:
NDPCA = A peak 1 A peak 2 A peak 1 A min
where A peak 1 denotes the contact area at the first peak, A peak 2 denotes the contact area at the second peak, and A min denotes the minimum contact area. In short, we used the DPCA as an indicator of toe movement, and the min–max normalization of the DPCA was performed using the maximum and minimum difference between the contact area in each cycle. This eliminated data from individual differences, and finally, the NDPCA was obtained. The NDPCA was automatically derived by the method presented in the Appendix A.

4. Results

The mean, maximum, minimum, and standard deviation values of NDPCAs for nine walking cycles were used as evaluation values for each participant. There were no significant differences between the groups with regard to gender proportion, as shown in Table 2; thus, we evaluated the results according to stumbling experiences and aging effect.
Figure 7 and Table 3 show the calculated NDPCAs. Assessment of the mean NDPCAs showed statistically significant differences between the groups with and without stumbling experiences, regardless of the difference in age between groups. Note that the bars shown in Figure 7 represent not standard error but standard deviation, and thus there could be an overlap in the bars for the groups even if there was a statistically significant difference between them. Toe-area activity (NDPCA) was high for the group with no stumbling history, and low for the group with a stumbling history. The results also showed no significant difference in the NDPCA between the elderly and young people in both groups. We evaluated the maximum and minimum NDPCAs to observe extreme cases in toe activity. The order of the mean value of the maximum NDPCA was highest for elderly individuals without stumbling experience, followed by elderly individuals with stumbling experience, and then young individuals without and with stumbling experience. A statistically significant difference was observed between young and elderly groups ( p < 0.01 ), between young and elderly groups with stumbling experiences, and between groups with and without stumbling experiences irrespective of age. A difference was also observed between the young and elderly groups with no stumbling experiences, although it was not statistically significant. No statistically significant difference was observed for any pairs in the minimum NDPCAs. The variations in toe activity were evaluated via the standard deviation of NDPCA. A difference between the young and elderly groups without stumbling experiences was observed, although it was not statistically significant.

5. Discussion

Toe-activity analysis: Using videos, various toe movements were observed during walking. Some participants without stumbling history showed noticeable toe movements in the swing phase. Preservation of posture in the swing phase by participants with stumbling experiences was observed. These factors monitored by our proposed system are difficult to measure with conventional pressure sheet sensors. These factors also explain why we focused on the first and second peaks (contact areas at the start and end of the swing phase) and the difference between them to evaluate toe activity.
Effects of toe activity on stumbling: All the evaluation values shown in Figure 7 and Table 3 exhibit the same tendency—that is, higher toe activity decreased the stumbling risk. This tendency was particularly clear at the mean and maximum NDPCAs, as the statistically significant differences were evident. Zhang et al. [38] assessed the effects of restricting the flexion–extension motion of the first metatarsophalangeal (MTP) joint on the walking gait of humans, and found a high risk of slipping and falling when the MTP joint is constrained. They also found that the flexion–extension motion of the MTP joint is important for normal walking. This supports our finding that low toe activity was associated with high stumbling risk. Tsuyuguchi et al. [24] and Kim et al. [25] investigated the relationship between the risk of falling and toe flexor strength of middle-aged and elderly individuals. Their results showed that toe flexor strength is related to the incidence of falls. Given that high toe activity corresponds to high flexion–extension ability, it was assumed that the risk of stumbling and falling could be estimated by the NDPCA. Kurihara et al. [39] reported a strong correlation between maximum isometric toe flexor strength and the cross-sectional area of intrinsic and extrinsic plantar muscles. Guillén-Rogel et al. [40] reported a moderate correlation between toe flexor strength and ankle dorsiflexion range of motion (DF ROM). Mecagni et al. [41] reported correlations between ankle ROM and balance among community-dwelling elderly women. The aforementioned studies show that toe flexor strength is closely related to balance in walking because the ankle DF ROM can reflect toe flexor strength. We believe that high NDPCA corresponds to high ankle mobility, which means that individuals with high NDPCA have better walking dynamics than those with low NDPCA. Furthermore, low NDPCA indicates that the flexion–extension motion of the MTP joint is not working properly, and that the DF ROM is low, which increases the risk of falling and stumbling. A well-known criterion for evaluating stumbling is the minimum toe clearance (MTC), which is the minimum distance between the toe and the floor. Moosabhoy et al. [42] investigated the sensitivity of MTC to the hip, knee, and ankle joint angles of the swing leg, and found that MTC was most sensitive to the ankle joint angle. Therefore, we speculate that toe activity may be related to MTC. The relationship between toe activity and MTC needs to be clarified in future studies.
Aging effect: The mean NDPCA evaluates the toe activity for nine walking cycles. The difference in mean NDPCAs between healthy elderly and young individuals was very small when the groups with and without stumbling histories were compared. This indicates that the mean NDPCA is a valid parameter for evaluating stumbling risk, irrespective of age. With regard to the maximum NDPCA, a high value is associated with aging (whereas a low value indicates high stumbling risk). We speculate that the high value of the maximum NDPCA resulted from a temporary action that compensated for the decline in muscle strength—in other words, a temporary increase in kicking force to raise the foot high and prevent stumbling. A low value of the minimum NDPCA was also associated with aging, although statistically significant differences were not observed. We speculate that the low value of the minimum NDPCA indicates low toe activity, which is caused by aging and leads to high stumbling risk. A large value obtained by subtracting the minimum NDPCA from the maximum NDPCA indicates considerable fluctuations in toe activity, which indicates aging. In the same context, we also evaluated the standard deviation of NDPCA. For elderly individuals with stumbling experience, the standard deviation of NDPCA was higher than that of young people. This highlights the fact that their toe activities were more volatile and may increase their risk of stumbling. The considerable variations in NDPCA could be attributed to the decline in muscle strength due to aging.
Limitations and further applications: The developed sensing system has many potential applications in future research. These include the analysis of the plantar surface during walking by participants with conditions such as toe deformity and weakness [43] or plantar calluses [44], and the exploration of the plantar region to investigate plantar flexion [26] or diabetes [45]. However, the developed sensing system still has some deficiencies that need to be addressed. We provided only one size of sensor. For a few participants in certain testing environments, foot motion around the MTP joints was affected by the rigidity of the clog. Given that this study is based on image analysis, the sensor was sensitive to the illumination of the experimental environment. Illumination may affect the validity of the image data. Color-based image extraction was also affected by the camera settings. This issue can be resolved by locking the white balance of the camera and adjusting the average brightness. The effect of ambient lighting can be reduced by using the auxiliary lighting provided by the endoscope. Further improvements and application of the sensing system to other studies will be part of our future research. The experimental setup for the left and right footwear was different, but the disparity between results was minimized by conducting a practice walking session with participants. The practice session also minimized the difference in weight and toe length (due to the camera holder) between normal shoes and the developed system. However, the influence of these disparities cannot be completely eliminated. In the future, the investigation could be performed using the same experimental setup for the right and left feet, optimizing materials and topology for reducing the weight, and shortening of the length of the camera holder. Consolidating the validity of the obtained results by increasing the number of participants and its application to the assessment of stumbling or fall risk might also be part of our future work. In this study, we investigated only the case in which participants walked straight ahead. The investigation of the plantar aspects of several types of walking, including turning and speed change [46], will be considered in future works. The developed plantar visualization system has potential applications in different types of clinical measurements of fall risk, including the single-leg-stance test and postural sway test. Further investigation of other measurements will be part of future work.

6. Conclusions

This study investigated the relationship between toe activity during walking and stumbling experiences using a clog-integrated plantar visualization system [35]. The system can accurately observe features such as the contact area, skin deformation, and skin color. We focused on the contact area in the toe area and evaluated toe-area activity as participants walked in a straight line. The participants were separated into four groups: young individuals with and without stumbling experiences and elderly individuals with and without stumbling experiences. The difference between the two peaks at the toe contact area was normalized and calculated to evaluate the toe-area activity. The two peaks correspond to heel-strike and push-off. We evaluated the mean, maximum, minimum, and standard deviation of the toe-area activity for multiple walking cycles. We found that the mean toe-area activity was high for the group with no stumbling experiences, and low for the group with stumbling experiences, irrespective of age. In contrast, the deviations in toe-area activity were high in the elderly group and low in the young group, irrespective of stumbling histories. Therefore, the mean toe-area activity is useful for evaluating stumbling risk, irrespective of age. We also found that a large value of the maximum toe-activity indicates aging, whereas a low value indicates stumbling risk.

Author Contributions

Conceptualization, M.S. and T.W.; Data curation, Y.J.; Formal analysis, Y.J. and T.W.; Funding acquisition, T.W.; Investigation, Y.J. and T.W.; Methodology, Y.J., M.S. and T.W.; Project administration, T.W.; Software, Y.J.; Supervision, M.S. and T.W.; Validation, M.S. and T.W.; Writing—original draft, Y.J.; Writing—review & editing, T.W. All authors have read and agreed to the published version of the manuscript.

Funding

This research was partly funded by Mitutoyo Association for Science and Technology, grant number R1810.

Conflicts of Interest

The authors declare no conflict of interest.

Appendix A

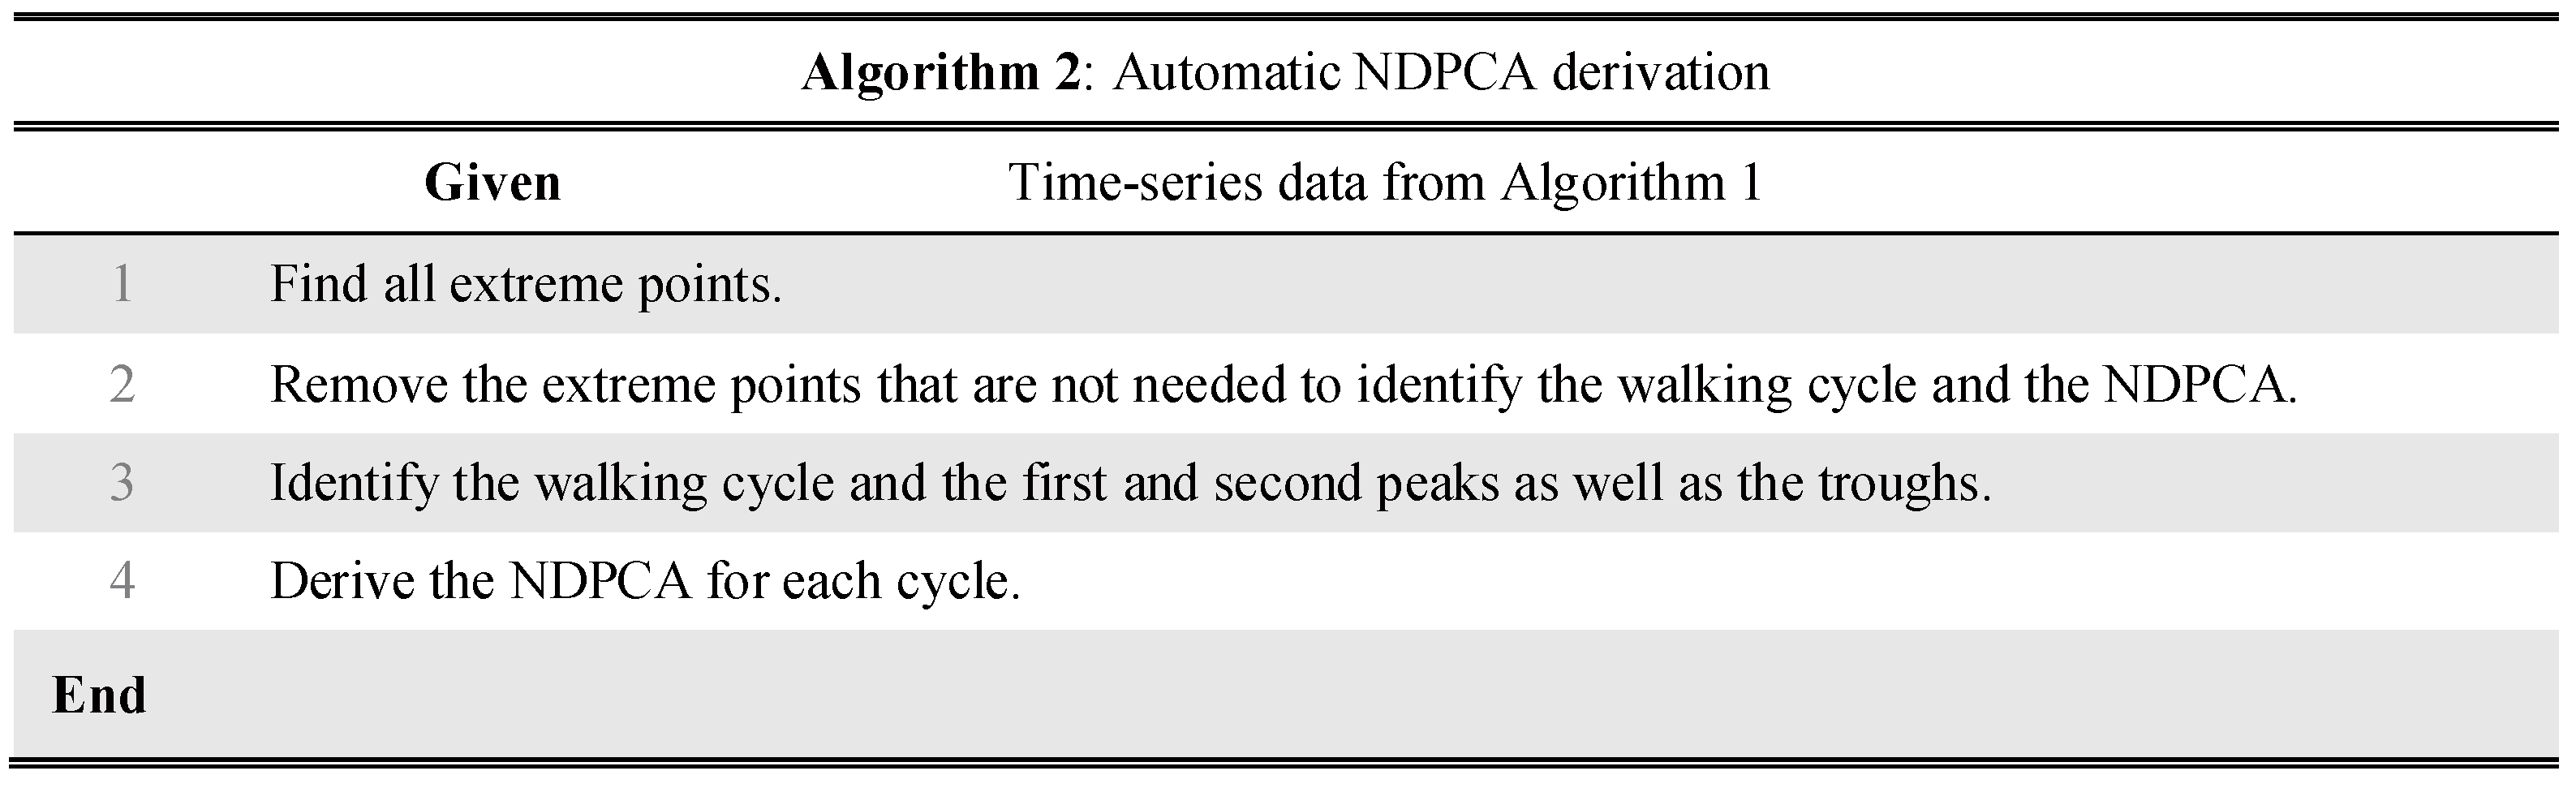
Automatic Deviation of NDPCA

To automatically determine the NDPCA, we developed a method to separate the continuous time-series data of the contact area in the toe area into wave data for one walking cycle; detect the extreme points; and identify the first and second peaks as well as the troughs.
Figure A1. Extreme points extracted by determining the change in the toe contact area.
Applsci 10 01359 g0a1
Figure A2. First and second peaks and troughs extracted from the calculation for three cycles.
Applsci 10 01359 g0a2
As shown in Figure A1, the calculation of the DPCA requires the two peaks ( A peak 1 ,   A peak 2 ) and the minimum point ( A min ) of each walking cycle from the time-series data. We derived these extreme points by determining where the time derivative of the pixel time-series data was zero. The local peak or maximum is where the time derivative changes from positive to negative. Conversely, the point where the time derivative changes from negative to positive is the local trough or minimum. Figure A1 shows the extreme points (in green) derived from three walking cycles. Some of the extreme points were unnecessary for the calculation of the NDPCA (e.g., E P 2 and E P 3 , where E P i denotes the ith extreme point) and were deleted before calculation. The unnecessary extreme points are characterized by a small difference between contact areas of adjacent points, as seen in the red circle in Figure A1. Thus, we checked the distance between two adjacent extreme points, D i f f i , defined by
D i f f i = | E P i E P i + 1 |   for   i = 1 ,   2 ,   3
We then removed the unnecessary extreme points. If D i f f i was less than the threshold θ , then E P i was removed. The threshold was determined through trial and error, based on the preliminary experiments. Here, the difference between D i f f max   and D i f f min was used as the reference for considering the individual difference and normalizing the range of time-series data. In addition, if both E P i and E P i + 2 were the same type of extreme points (i.e., peak or trough), then E P i was removed. The condition for removing E P i was defined as
D i f f i < θ ( i = 1 ,   2 ,   3 )
where
θ = 0.25 ( D i f f m a x D i f f m i n ) D i f f m a x = Max ( D i f f i )   ( i = 1 ,   2 ,   3 ) D i f f m i n = Min ( D i f f i )   ( i = 1 ,   2 ,   3 )
Figure A2 shows time-series data after removing the unnecessary extreme points in Figure A2. Each walking cycle has three extreme points associated with two peaks ( A p e a k 1 and A p e a k 2 ) and one trough between the two peaks. The trough between A p e a k 1 and A p e a k 2 is the minimum point ( A m i n ). A p e a k 1 and A p e a k 2 correspond to the values of the contact areas at push-off and heel-strike, respectively, and A m i n corresponds to the moment when the contact area during the swing phase is the smallest. The swing phase is detected upon detection of A m i n . Given that the order of appearance of A p e a k 1 ,   A m i n , and A p e a k 2 is known, the peaks corresponding to A p e a k 1 and A p e a k 2 are recognized by the location of A m i n . One walking cycle ends at the trough that occurs after A p e a k 2 . The NDPCA is calculated using A p e a k 1 , A p e a k 2 , and A m i n in Equation (A2). The overall automatic gait recognition procedure is summarized in Figure A3.
Figure A3. Procedure for deriving the NDPCA automatically.
Applsci 10 01359 g0a3

References

  1. Cabinet Office, Government of Japan. Annual Report on the Aging Society. 2016. Available online: https://www8.cao.go.jp/kourei/english/annualreport/2016/2016pdf_e.html (accessed on 15 January 2020).
  2. Oliver, D.; Daly, F.; Martin, F.C.; McMurdo, M.E.T. Risk factors and risk assessment tools for falls in hospital in-patients: A systematic review. Age Ageing 2004, 33, 122–130. [Google Scholar] [CrossRef] [Green Version]
  3. Taylor, A.J.; Menz, H.B.; Keenan, A.-M. The influence of walking speed on plantar pressure measurements using the two-step gait initiation protocol. Foot 2004, 14, 49–55. [Google Scholar] [CrossRef]
  4. Burnfield, J.M.; Few, C.D.; Mohamed, O.S.; Perry, J. The influence of walking speed and footwear on plantar pressures in older adults. Clin. Biomech. 2004, 19, 78–84. [Google Scholar] [CrossRef] [PubMed]
  5. Preis, S.; Klemms, A.; Müller, K. Gait analysis by measuring ground reaction forces in children: Changes to an adaptive gait pattern between the ages of one and five years. Dev. Med. Child Neurol. 2008, 39, 228–233. [Google Scholar] [CrossRef] [PubMed]
  6. Chuckpaiwong, B.; Nunley, J.A.; Mall, N.A.; Queen, R.M. The effect of foot type on in-shoe plantar pressure during walking and running. Gait Posture 2008, 28, 405–411. [Google Scholar] [CrossRef]
  7. Majumder, A.J.A.; Zerin, I.; Uddin, M.; Ahamed, S.I.; Smith, R.O. Smartprediction: A Real-time Smartphone-based Fall Risk Prediction and Prevention System. In Proceedings of the 2013 Research in Adaptive and Convergent Systems, Montreal, OC, Canada, 1–4 October 2013; pp. 434–439. [Google Scholar]
  8. Ayena, J.C.; Otis, M.J.D.; Menelas, B.A.J. An efficient home-based risk of falling assessment test based on Smartphone and instrumented insole. In Proceedings of the 2015 IEEE International Symposium on Medical Measurements and Applications (MeMeA) Proceedings, Turin, Italy, 7–9 May 2015; pp. 416–421. [Google Scholar]
  9. Yu, H.; Wang, D.; Yang, C.-J.; Lee, K.-M. A walking monitoring shoe system for simultaneous plantar-force measurement and gait-phase detection. In Proceedings of the 2010 IEEE/ASME International Conference on Advanced Intelligent Mechatronics, Montreal, ON, Canada, 6–9 July 2010; pp. 207–212. [Google Scholar]
  10. Crea, S.; Donati, M.; De Rossi, S.M.M.; Oddo, C.M.; Vitiello, N. A wireless flexible sensorized insole for gait analysis. Sensors 2014, 14, 1073–1093. [Google Scholar] [CrossRef] [Green Version]
  11. Yang, S.; Li, Q. Inertial sensor-based methods in walking speed estimation: A systematic review. Sensors 2012, 12, 6102–6116. [Google Scholar] [CrossRef] [Green Version]
  12. Hung, T.N.; Suh, Y.S. Inertial sensor-based two feet motion tracking for gait analysis. Sensors 2013, 13, 5614–5629. [Google Scholar] [CrossRef]
  13. Do, T.N.; Suh, Y.S. Gait Analysis Using Floor Markers and Inertial Sensors. Sensors 2012, 12, 1594–1611. [Google Scholar] [CrossRef] [Green Version]
  14. Foxlin, E. Pedestrian Tracking with Shoe-Mounted Inertial Sensors. IEEE Comput. Graph. Appl. 2005, 25, 38–46. [Google Scholar] [CrossRef]
  15. Sim, S.Y.; Jeon, H.S.; Chung, G.S.; Kim, S.K.; Kwon, S.J.; Lee, W.K.; Park, K.S. Fall detection algorithm for the elderly using acceleration sensors on the shoes. In Proceedings of the Annual International Conference of the IEEE Engineering in Medicine and Biology Society, EMBS, Boston, MA, USA, 30 August–3 September 2011; pp. 4935–4938. [Google Scholar]
  16. Rampp, A.; Barth, J.; Schülein, S.; Gaßmann, K.G.; Klucken, J.; Eskofier, B.M. Inertial Sensor-Based Stride Parameter Calculation from Gait Sequences in Geriatric Patients. IEEE Trans. Biomed. Eng. 2015, 62, 1089–1097. [Google Scholar] [CrossRef]
  17. Mariani, B.; Hoskovec, C.; Rochat, S.; Büla, C.; Penders, J.; Aminian, K. 3D gait assessment in young and elderly subjects using foot-worn inertial sensors. J. Biomech. 2010, 43, 2999–3006. [Google Scholar] [CrossRef]
  18. Schepers, H.M.; Koopman, H.F.J.M.; Veltink, P.H. Ambulatory assessment of ankle and foot dynamics. IEEE Trans. Biomed. Eng. 2007, 54, 895–902. [Google Scholar] [CrossRef] [PubMed] [Green Version]
  19. Bamberg, S.J.M.; Benbasat, A.Y.; Scarborough, D.M.; Krebs, D.E.; Paradiso, J. A Gait analysis using a shoe-integrated wireless sensor system. IEEE Trans. Inf. Technol. Biomed. 2008, 12, 413–423. [Google Scholar] [CrossRef] [PubMed] [Green Version]
  20. Bebek, Ö.; Suster, M.A.; Rajgopal, S.; Fu, M.J.; Huang, X.; Cavusoglu, M.C.; Young, D.J.; Mehregany, M.; van den Bogert, A.J.; Mastrangelo, C.H. Personal Navigation via High-Resolution Gait-Corrected Inertial Measurement Units. IEEE Trans. Instrum. Meas. 2010, 59, 3018–3027. [Google Scholar] [CrossRef]
  21. Chen, M.; Huang, B.; Xu, Y. Intelligent shoes for abnormal gait detection. In Proceedings of the IEEE International Conference on Robotics and Automation, Pasadena, CA, USA, 19–23 May 2008; pp. 2019–2024. [Google Scholar]
  22. Hegde, N.; Sazonov, E.S. SmartStep 2.0—A completely wireless, versatile insole monitoring system. In Proceedings of the 2015 IEEE International Conference on Bioinformatics and Biomedicine (BIBM), Washington, DC, USA, 9–12 November 2015; pp. 746–749. [Google Scholar]
  23. Kawsar, F.; Hasan, M.K.; Love, R.; Ahamed, S.I. A Novel Activity Detection System Using Plantar Pressure Sensors and Smartphone. In Proceedings of the IEEE 39th Annual Computer Software and Applications Conference, Taichung, Taiwan, 1–5 July 2015; pp. 44–49. [Google Scholar]
  24. Tsuyuguchi, R.; Kurose, S.; Seto, T.; Takao, N.; Tagashira, S.; Tsutsumi, H.; Otsuki, S.; Kimura, Y. Toe grip strength in middle-aged individuals as a risk factor for falls. J. Sports Med. Phys. Fit. 2018, 58, 1325–1330. [Google Scholar]
  25. Kim, Y.-W.; Kwon, O.-Y.; Cynn, H.-S.; Weon, J.-H.; Yi, C.-H.; Kim, T.-H. Comparison of Toe Plantar Flexors Strength and Balancing Ability between Elderly Fallers and Non-fallers. J. Phys. Ther. Sci. 2011, 23, 127–132. [Google Scholar] [CrossRef] [Green Version]
  26. Mickle, K.J.; Munro, B.J.; Lord, S.R.; Menz, H.B.; Steele, J.R. ISB Clinical Biomechanics Award 2009. Clin. Biomech. 2009, 24, 787–791. [Google Scholar] [CrossRef] [PubMed]
  27. Hiura, M.; Nemoto, H.; Nishisaka, K.; Higashi, K.; Katoh, T. The Association Between Walking Ability and Falls in Elderly Japanese Living in the Community Using a Path Analysis. J. Community Health 2012, 37, 957–962. [Google Scholar] [CrossRef] [PubMed]
  28. Uritani, D.; Fukumoto, T.; Matsumoto, D.; Shima, M. The Relationship Between Toe Grip Strength and Dynamic Balance or Functional Mobility Among Community-Dwelling Japanese Older Adults: A Cross-Sectional Study. J. Aging Phys. Act. 2016, 24, 459–464. [Google Scholar] [CrossRef] [PubMed]
  29. Branthwaite, H.; Grabtree, G.; Chockalingam, N.; Greenhalgh, A. The Effect of Toe Flexion Exercises on Grip. J. Am. Podiatr. Med. Assoc. 2018, 108, 355–361. [Google Scholar] [CrossRef]
  30. Takatori, K.; Matsumoto, D. Relationships Between Simple Toe Elevation Angle in the Standing Position and Dynamic Balance and Fall Risk Among Community-Dwelling Older Adults. PM&R 2015, 7, 1059–1063. [Google Scholar]
  31. Bus, S.A.; Maas, M.; de Lange, A.; Michels, R.P.J.; Levi, M. Elevated plantar pressures in neuropathic diabetic patients with claw/hammer toe deformity. J. Biomech. 2005, 38, 1918–1925. [Google Scholar] [CrossRef] [PubMed]
  32. Morag, E.; Cavanagh, P.R. Structural and functional predictors of regional peak pressures under the foot during walking. J. Biomech. 1999, 32, 359–370. [Google Scholar] [CrossRef]
  33. Payne, C.; Turner, D.; Miller, K. Determinants of plantar pressures in the diabetic foot. J. Diabetes Complicat. 2002, 16, 277–283. [Google Scholar] [CrossRef]
  34. Buldt, A.K.; Forghany, S.; Landorf, K.B.; Levinger, P.; Murley, G.S.; Menz, H.B. Foot posture is associated with plantar pressure during gait: A comparison of normal, planus and cavus feet. Gait Posture 2018, 62, 235–240. [Google Scholar] [CrossRef]
  35. Jin, Y.; Shogenji, M.; Watanabe, T. Clog-integrated plantar visualization system for evaluating activity during walking. In Proceedings of the 2017 IEEE International Conference on Advanced Intelligent Mechatronics (AIM), Munich, Germany, 3–7 July 2017; pp. 862–867. [Google Scholar]
  36. Byju, A.G.; Nussbaum, M.A.; Madigan, M.L. Alternative measures of toe trajectory more accurately predict the probability of tripping than minimum toe clearance. J. Biomech. 2016, 49, 4016–4021. [Google Scholar] [CrossRef] [Green Version]
  37. Santhiranayagam, B.K.; Sparrow, W.A.; Lai, D.T.H.; Begg, R.K. Non-MTC gait cycles: An adaptive toe trajectory control strategy in older adults. Gait Posture 2017, 53, 73–79. [Google Scholar] [CrossRef]
  38. Zhang, J.; Si, Y.; Zhang, Y.; Liu, Y. The effects of restricting the flexion–extension motion of the first metatarsophalangeal joint on human walking gait. Biomed. Mater. Eng. 2014, 24, 2577–2584. [Google Scholar] [CrossRef] [Green Version]
  39. Kurihara, T.; Yamauchi, J.; Otsuka, M.; Tottori, N.; Hashimoto, T.; Isaka, T. Maximum toe flexor muscle strength and quantitative analysis of human plantar intrinsic and extrinsic muscles by a magnetic resonance imaging technique. J. Foot Ankle Res. 2014, 7, 26. [Google Scholar] [CrossRef]
  40. Guillén-Rogel, P.; San Emeterio, C.; Marín, P.J. Associations between ankle dorsiflexion range of motion and foot and ankle strength in young adults. J. Phys. Ther. Sci. 2017, 29, 1363–1367. [Google Scholar] [CrossRef] [PubMed] [Green Version]
  41. Mecagni, C.; Smith, J.P.; Roberts, K.E.; O’Sullivan, S.B. Balance and ankle range of motion in community-dwelling women aged 64 to 87 years: A correlational study. Phys. Ther. 2000, 80, 1004–1011. [Google Scholar] [CrossRef] [PubMed] [Green Version]
  42. Moosabhoy, M.A.; Gard, S.A. Methodology for determining the sensitivity of swing leg toe clearance and leg length to swing leg joint angles during gait. Gait Posture 2006, 24, 493–501. [Google Scholar] [CrossRef] [PubMed]
  43. Menz, H.B.; Zammit, G.V.; Munteanu, S.E. Plantar pressures are higher under callused regions of the foot in older people. Clin. Exp. Dermatol. 2007, 32, 375–380. [Google Scholar] [CrossRef]
  44. Fox, J.; Docherty, C.L.; Schrader, J.; Applegate, T. Eccentric plantar-flexor torque deficits in participants with functional ankle instability. J. Athl. Train. 2008, 43, 51–54. [Google Scholar] [CrossRef]
  45. Mueller, M.J.; Hastings, M.; Commean, P.K.; Smith, K.E.; Pilgram, T.K.; Robertson, D.; Johnson, J. Forefoot structural predictors of plantar pressures during walking in people with diabetes and peripheral neuropathy. J. Biomech. 2003, 36, 1009–1017. [Google Scholar] [CrossRef]
  46. Verlinden, V.J.A.; van der Geest, J.N.; Hoogendam, Y.Y.; Hofman, A.; Breteler, M.M.B.; Ikram, M.A. Gait patterns in a community-dwelling population aged 50 years and older. Gait Posture 2013, 37, 500–505. [Google Scholar] [CrossRef] [Green Version]
Figure 1. Overview of the system: (a) photo of the clog-integrated plantar visualization system and (b) dimensions of the underpart of the plantar observation system.
Applsci 10 01359 g001
Figure 2. Schematic illustration of the plantar observation system: (a) side view and (b) bottom view.
Applsci 10 01359 g002
Figure 3. Phases and phase components of a walking cycle and representative images captured by the developed plantar observation system.
Applsci 10 01359 g003
Figure 4. Passive joints to allow the foot to bend at the tarsometatarsal joints and toward the camera.
Applsci 10 01359 g004
Figure 5. Procedure to derive the toe contact area.
Applsci 10 01359 g005
Figure 6. Time series of the toe contact area for (a) the group without stumbling experiences and (b) the group with stumbling experiences. Both subfigures display one example obtained from a single trial for a single young individual. NDPCA: normalized difference of two peak-contact areas.
Applsci 10 01359 g006
Figure 7. Main results of NDPCA: (a) Mean NDPCA; (b) Maximum NDPCA; (c) Minimum NDPCA; (d) Standard deviation of NDPCA.
Applsci 10 01359 g007
Table 1. Information of participants.
YoungElderly
Number of participants13 (M:9 F:4)9 (M:5 F:4)
Without stumbling experience8 (M:5 F:3)5 (M:3 F:2)
With stumbling experience5 (M:4 F:1)4 (M:2 F:2)
Information of participants
Age 22.4   ±   2   years 65.3   ±   2   years
Weight 58.3   ±   10.6   kg 61.4   ±   10.9   kg
Height 165.6   ±   8.9   cm 163.6   ±   10.8   cm
Foot Size 24 27   cm 24 27   cm
M: Male; F: Female.
Table 2. Effect of gender on NDPCA.
NDPCA (Mean ± Std.)MaleFemalep-Value *
 Young 0.318 ± 0.073 0.300 ± 0.024 0.536
 Elderly 0.317 ± 0.047 0.301 ± 0.059 0.690
* p is probability value.
Table 3. Mean, maximum, minimum, and standard deviation of the NDPCA for groups with and without stumbling histories.
YoungElderlyp-Value
Mean NDPCA
 Without stumbling experience 0.339 ± 0.064 0.335 ± 0.054 0.451
 With stumbling experience 0.269 ± 0.041 0.278 ± 0.019 0.348
p-value0.020 *0.039 */
Maximum NDPCA
 Without stumbling experience 0.454 ± 0.065 0.564 ± 0.053 0.012 *
 With stumbling experience 0.385 ± 0.041 0.471 ± 0.043 0.038 *
p-value0.0890.017 */
Minimum NDPCA
 Without stumbling experience 0.207 ± 0.112 0.123 ± 0.104 0.101
 With stumbling experience 0.171 ± 0.087 0.113 ± 0.023 0.110
p-value0.2680.572/
NDPCA Standard Deviation
 Without stumbling experience 0.098 0.128 0.067
 With stumbling experience 0.063 0.109 0.048 *
p-value0.0960.151/
* Significant at p < 0.05.

